Water Loss Control Tools. Software Tools for Supply Side Efficiency
|
|
|
- Eric Wilkins
- 5 years ago
- Views:
Transcription

1 Water Loss Control Tools Software Tools for Supply Side Efficiency PNWS, April 2015
2 Today s Goals 1) What is Water Loss? (10 min) 2) Water Loss Baseline AWWA Audits (20 min) 3) Intervention Strategies WRF Model (20 min) 4) Questions & Discussion throughout!

3 Water Systems Optimization Water Loss Audits Design and Implementation of Water Loss Control Programs Leak Detection Pressure Management Schemes Source Meter Testing Revenue Enhancement Programs

4 What Is Non-Revenue Water (NRW)???
?")

5 What Is Non-Revenue Water (NRW)? Non Revenue Water consists of: Real Losses Apparent Losses

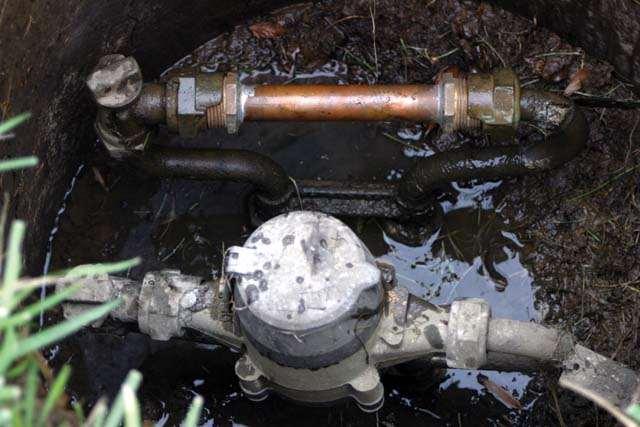
6 Apparent Losses

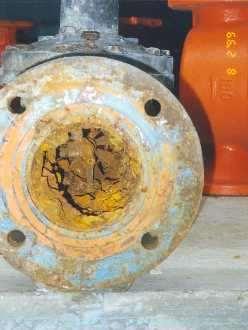
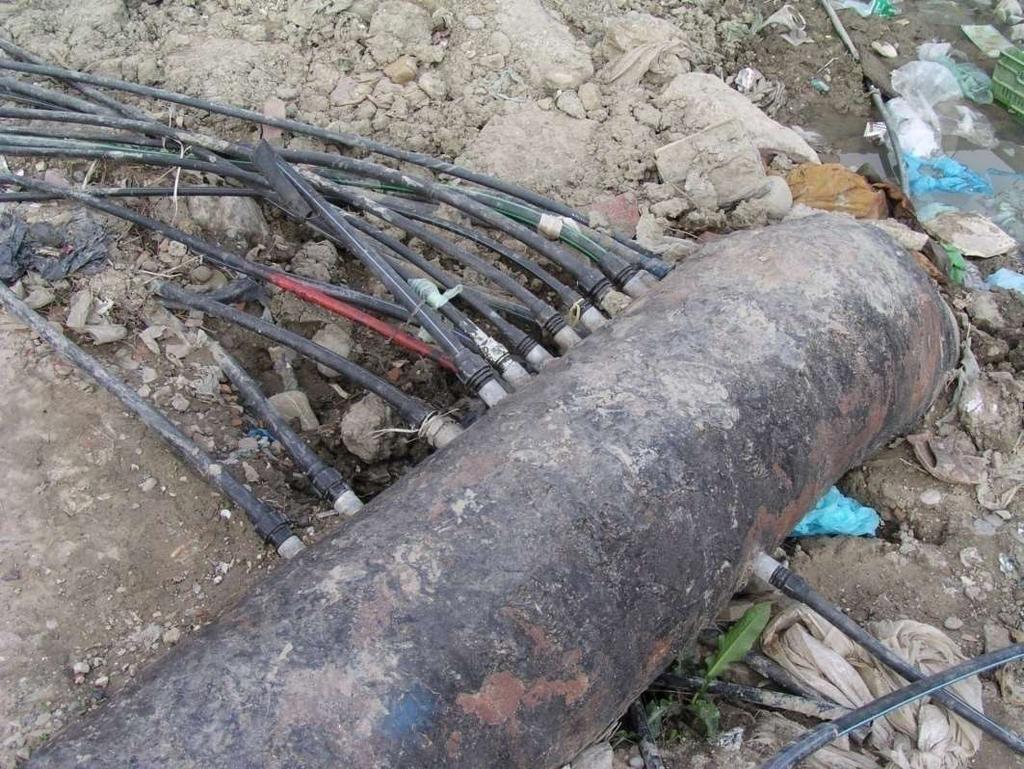
7 Real Losses
8 Benefits of Water Loss Control REAL LOSSES APPARENT LOSSES Saves WATER! Does not save water Creates an additional supply defers capital expenditures and marginal supply development Optimizes REVENUE GENERATION
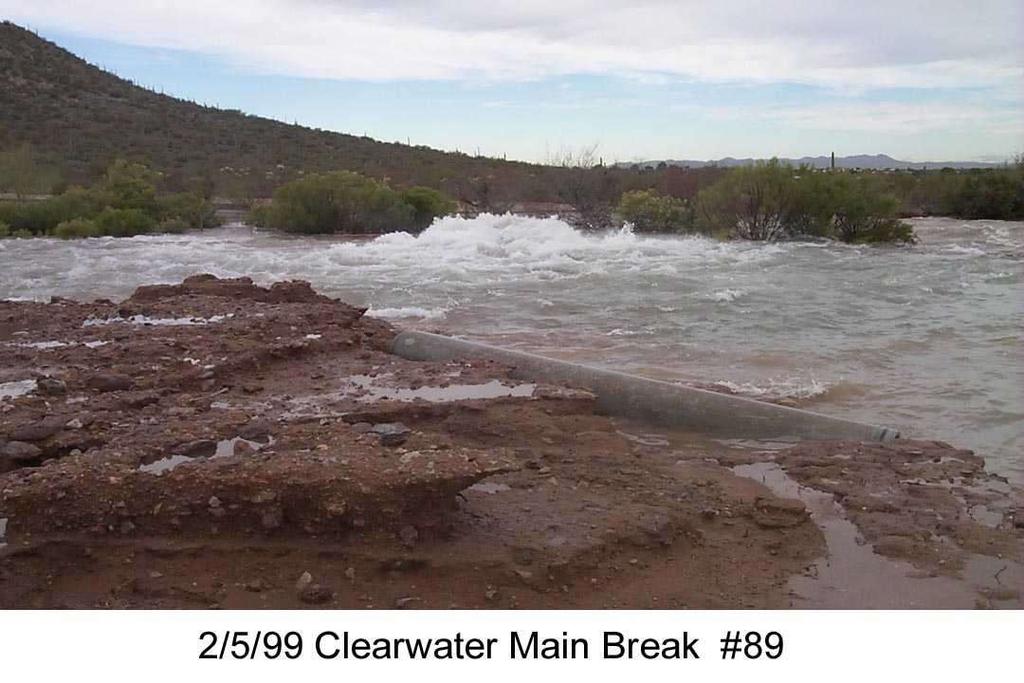
9 What Can Happen without NRW Management?
10 Benefits of NRW Management Save Water Reduce Costs Culture of Accountability Identify what you DON T know Comprehensive understanding of your system Financial Benefits Reduction in O&M & CIP costs Better Asset Management Optimized Meter Replacement/Management Water Conservation (Supply Side & Demand Side) Sustainability (Water/Energy Nexus) Be Ahead of Regulatory Arena Less Liability Build Credibility with Stakeholders and Regulators


11 How Can We Strategically Manage NRW?? Detailed Water Audit Conduct Detailed AWWA Water Audit to Quantify NRW Volume and its Components Real Losses and Apparent Losses Component Analysis Component Analysis of Real Losses Component Analysis of Apparent Losses Water Audit Phase Economics Assessment of Economic Real Loss Intervention Strategies Assessment of Economic Apparent Loss Intervention Strategies Implement NRW Strategy Real Loss Control and Intervention Apparent Loss Control and Intervention Sustainable NRW Management

 per year Master meter error adjustment:? M 695.4 under-registered million gallons (US) per year Water Imported:? M 0.0 million gallons (US) per year? Water Exported: M 7,210.")
 per year Unbilled metered:? M 179.3 million gallons (US) per year? Unbilled unmetered: E 693.6 million gallons (US) per year. AUTHORIZED CONSUMPTION:. 58,408.")
12 Best Practice Tools for Water Loss Control AWWA M36 Publication Water Audits and Loss Control Programs (2009), 3 rd Edition features the IWA/AWWA Water Audit Methodology AWWA Water Loss Control Committee s Free Water Audit Software Current version is 5.0 in English Includes data grading capability Companion Compiler Software AWWA WLCC Water Audit Software: Reporting Worksheet? Click to access definition WATER SUPPLIED Water Audit Report for: Philadelphia Water Department Reporting Year: ALL VOLUMES TO BE ENTERED AS ANNUAL QUANTITIES Volume from own sources:? M 95,526.0 million gallons (US) per year Master meter error adjustment:? M under-registered million gallons (US) per year Water Imported:? M 0.0 million gallons (US) per year? Water Exported: M 7,210.2 million gallons (US) per year. WATER SUPPLIED: 89,011.2 million gallons (US) per year. AUTHORIZED CONSUMPTION. Billed metered:? M 57,535.2 million gallons (US) per year Billed unmetered:? M 0.0 million gallons (US) per year Unbilled metered:? M million gallons (US) per year? Unbilled unmetered: E million gallons (US) per year. AUTHORIZED CONSUMPTION:. 58,408.1 million gallons (US) per year WATER LOSSES (Water Supplied - Authorized ). 30,603.1 million gallons (US) per year. Apparent Losses.. Unauthorized consumption:? E 1,145.2 million gallons (US) per year Customer metering inaccuracies:? E million gallons (US) per year Real Losses. Data handling errors:? E 2,751.2 million gallons (US) per year Apparent Losses:. 4,058.9 million gallons (US) per year Real Losses (Water Losses - Apparent Losses): 26,544.2 million gallons (US) per year. NON_REVENUE WATER. SYSTEM DATA.. WATER LOSSES: 30,603.1 million gallons (US) per year.. NON-REVENUE WATER:. 31,476.0 million gallons (US) per year. Length of mains:? M 3,160.0 miles Number of active AND inactive service connections:? M 548,289 Connection density:. 174 conn./mile main Average length of private pipe:? E 12.0 ft Average operating pressure:? E 55.0 psi COST DATA.. Total annual cost of operating water system:? M $167,604,000 $/Year Customer retail unit cost (applied to apparent losses):? M $3.95 Variable production cost (applied to real losses):? M $ $/million gallons (US).. DATA REVIEW - Please review the following information and make changes above if necessary: - Input values should be indicated as either measured or estimated. You have entered: 12 as measured values 6 as estimated values 0 without specifying measured or estimated - It is important to accurately measure the master meter - you have entered the measurement type as: measured - Cost Data: No problems identified PERFORMANCE INDICATORS Financial Indicators Operational Efficiency Indicators Copyright 2006, American Water Works Association. All Rights Reserved Non-revenue water as percent by volume: 35.4% Non-revenue water as percent by cost: 11.7% Annual cost of Apparent losses: $16,012,518 Annual cost of Real Losses: $3,545,768 Apparent losses per service connection per day: Real losses per service connection per day*: Real losses per length of main per day*: Real losses per service connection per day per psi pressure: $/1000 gallons (US) N/A gallons/connection/day gallons/connection/day Back to Instructions Please enter data in the white cells below. Where possible, metered values should be used; if metered values are unavailable please estimate a value. Indicate this by selecting a choice from the gray box to the left, where M = measured (or accurately known value) and E = estimated. (pipe length between curbstop and customer meter or property 2.41 gallons/connection/day/psi? Unavoidable Annual Real Losses (UARL): 5.98 million gallons/day Water Research Foundation Reports? Infrastructure Leakage Index (ILI) [Real Losses/UARL]: * only the most applicable of these two indicators will be calculated Project 2811: Evaluating Water Loss and Planning Loss Reduction Strategies Project 2928: Leakage Management Technologies WRF 4372 published in May 2014 Textbooks
13 The Water Balance SYSTEM INPUT VOLUME Authorized Billed Authorized Unbilled Authorized Apparent Losses Billed Metered Authorized Billed Unmetered Authorized Unbilled Metered Authorized Unbilled Unmetered Authorized Metering Errors Unauthorized Systematic Data Handling Errors REVENUE WATER NON- REVENUE WATER Water Losses Leakage/Overflow at Reservoirs Real Losses Leakage from Trunk Mains Leakage from Distribution Mains Leakage from Service Connections
14 Water Balance Validation SYSTEM INPUT VOLUME Authorized Billed Authorized Unbilled Authorized Apparent Losses Billed Metered Authorized Billed Unmetered Authorized Unbilled Metered Authorized Unbilled Unmetered Authorized Metering Errors Unauthorized Systematic Data Handling Errors Water Losses Leakage/Overflow at Reservoirs Real Losses Leakage from Trunk Mains Leakage from Distribution Mains Leakage from Service Connections

15 System Input Volume ACCURACY OF METERS IS CRITICAL!


16 System Input Validation Volumetric Meter Test Comparative Meter Test
![MGD Challenge Data Transfer Accuracy (( 4-20mA signal) - 4) Maximum Calibration Flow Rate (MGD) = [ 16 ] * Flow-range (MGD) 14 Reservoir A raw water flowmeter data chain analysis Comparison of](/docs-images/81/83023694/images/17-1.jpg "converted 4-20 ma signal and SCADA reading 13.5 13 12.5 12 11.5 11 10.")
17 MGD Challenge Data Transfer Accuracy (( 4-20mA signal) - 4) Maximum Calibration Flow Rate (MGD) = [ 16 ] * Flow-range (MGD) 14 Reservoir A raw water flowmeter data chain analysis Comparison of converted 4-20 ma signal and SCADA reading :40:06 14:57:23 raw 4-20 ma signal from meter converted to MGD SCADA value MGD 15:14:39 15:31:56 15:49:13 16:06:30 16:23:47 16:41:03 16:58:20 17:15:37 17:32:54 17:50:11 18:07:27 18:24:44 18:42:01 18:59:18 19:16:35 19:33:51 19:51:08 20:08:25 20:25:42 20:42:59 Time 21:00:15 21:17:32 21:34:49 21:52:06 22:09:23 22:26:39 22:43:56 23:01:13 23:18:30 23:35:47 23:53:03 0:10:20 0:27:37 0:44:54 1:02:11 1:19:27 1:36:44 1:54:01 2:11:18
18 Billing Data Validation SYSTEM INPUT VOLUME Authorized Billed Authorized Unbilled Authorized Apparent Losses Billed Metered Authorized Billed Unmetered Authorized Unbilled Metered Authorized Unbilled Unmetered Authorized Metering Errors Unauthorized Systematic Data Handling Errors Water Losses Leakage/Overflow at Reservoirs Real Losses Leakage from Trunk Mains Leakage from Distribution Mains Leakage from Service Connections
19 Billing Data Validation Export Raw Billing Data Checks on Accuracy Customer identification fields Meter identification fields Service type identification fields Meter read and consumption fields units Trouble codes or flags Remove Financial Adjustments Consider Exclusion of Accounts (Recycled? System?) Consider lag between read date and start and end of audit period volumes by meter size and model volumes by meter size and revenue class
20 Billing Data Validation SYSTEM INPUT VOLUME Authorized Billed Authorized Unbilled Authorized Apparent Losses Billed Metered Authorized Billed Unmetered Authorized Unbilled Metered Authorized Unbilled Unmetered Authorized Metering Errors Unauthorized Systematic Data Handling Errors Water Losses Leakage/Overflow at Reservoirs Real Losses Leakage from Trunk Mains Leakage from Distribution Mains Leakage from Service Connections

21 Apparent Loss Validation Meter Size Meter Population Test Sample Size Volume- Weighted Average Accuracy 95% Confidence Limit of Accuracy 5/8 13, % 4.0% 3/4 1, % 0.4% 1 2, % 4.2% 1-1/ % 3.8% % 1.7%
 5/8 691.532 92.0% 59.725 3/4 94.104 100.0% - 1 314.740 96.9% 10.136 1-1/2 133.960 94.0% 8.535 2 295.894 97.6% 7.214 Total 1,530.230 85.")
22 Apparent Loss Validation Meter size Total volume supplied through meters during audit period (MG) Average accuracy based on meter test results Apparent Losses during audit period (MG) 5/ % / % % / % % Total 1,
23 Water Balance Complete SYSTEM INPUT VOLUME Authorized Billed Authorized Unbilled Authorized Apparent Losses Billed Metered Authorized Billed Unmetered Authorized Unbilled Metered Authorized Unbilled Unmetered Authorized Metering Errors Unauthorized Systematic Data Handling Errors Water Losses Leakage/Overflow at Reservoirs Real Losses Leakage from Trunk Mains Leakage from Distribution Mains Leakage from Service Connections
24 Performance Indicators AWWA Recommended Performance Indicators Real Losses/service conn/day Apparent Losses/service conn/day Infrastructure Leakage Index (ILI) ILI = CARL/UARL Unavoidable Annual Real Losses Current Annual Real Losses
25 Performance Indicators MGD % MGD % System Input % System Input % Sales 70 70% Sales 70 70% Non-Revenue Water 30 30% Non-Revenue Water 30 30%

26 Performance Indicators 50 MGD % MGD % System Input % System Input % Sales 70 70% Sales % Non-Revenue Water 30 30% Non-Revenue Water 30 20%
27 Performance Indicators Utility % Real Losses ILI ELL A 23% 6 Close to ELL B 23% 8 Close to ELL C 36% 2 Close to ELL D 4% 1.6 Close to ELL E 22% 2.7 Above ELL F 5% 1.7 Above ELL G 7% 3.2 Above ELL
28 WRF Project Review: #4372a Effective Organization & Component Analysis of Utility Leakage Data PROJECT BASICS: Funded by the WRF and EPA Model Release & Report Publishing in June 2014 Webinar on June PARTICIPATING UTILITIES: Eastern Municipal Water District Metro Water Services, Nashville TN Halifax Regional Water Commission City of Folsom Utilities Dept San Antonio Water System PROJECT GOALS: Provide utilities software model for component analysis of real losses Provide informative context for performance indicator results Develop the software model to optimize use (prioritizing accessibility and adoption) Lake Arrowhead Community Services District S. Central CT Regional Water Authority City of Phoenix Water Services Dept Austin Water Utility Water & Wastewater Authority of Wilson County

29 Downloading the 4372 Materials then search for 4372 or real losses 7

30 The AWWA Water Balance SYSTEM INPUT VOLUME Authorized Billed Authorized Unbilled Authorized Apparent Losses Billed Metered Authorized Billed Unmetered Authorized Unbilled Metered Authorized Unbilled Unmetered Authorized Metering Errors Unauthorized Systematic Data Handling Errors REVENUE WATER NON- REVENUE WATER Water Losses Leakage/Overflow at Reservoirs Real Losses Leakage from Trunk Mains Leakage from Distribution Mains Leakage from Service Connections
31 Water Loss Control Program Next Steps With A Completed AWWA Water Balance: Volume of Apparent Losses Volume of Real Losses Performance Indicators Data Validity Score Remaining Assessments: Understanding of Real Loss Breakdown (where are these losses occurring? what types of leakage?) Evaluation of Cost-Effective Real Loss Intervention Strategies Cost-Effective Non-Revenue Water Reduction Strategies


32 Component Analysis of Real Losses
33 Key Points For Model Development Adoption of AWWA Free Water Audit Software & Importance of Data Validation Contextualized Performance Indicators Break Frequency Research Tools for developing water loss control strategies Location & Response Time Improvement Pressure Management Proactive Leak Detection
 BMP 1.2: annual water audit submissions Examined FY09-10 data")
34 Adoption of Software Methodology & Data Validation Review of statewide regulations and policies regarding water loss and the AWWA Free Water Audit software California Urban Water Conservation Council (CUWCC) BMP 1.2: annual water audit submissions Examined FY09-10 data
35 Contextualized Performance Indicators
36 Break Frequency Research Focus on Predictive Models Terminology Data Collection Completeness

37 Break Frequency Research
38 Participating Utility Insight Integrity and completeness of failure data Readiness of average utility Presentation of software as a TOOL not a REPORT! Estimation/assumption comfort
39 Real Losses Calculation for Reported & Un-Reported Leakage Annual Real Loss Volume from Reported Leaks = # of leaks by size * average run time * average flow rate (at average system pressure) Leakage Occurrence Pipe Diameter # of Events Flow Rate (gpm) Average Run Time (hrs) Annual Leakage (MG) Mains Breaks Failure Repair Records Estimated based on pipe size using BABE methodology Awareness Time Estimation + Failure Repair Records for Location & Repair Time

40 Component Analysis of Real Losses
41 Leakage Management Strategies Pressure Management Speed and Quality of Repairs Unavoidable Annual Real Losses Economic Level of Real Losses Active Leakage Control Potentially Recoverable Real Losses Current Annual Real Losses Pipeline and Asset Management: Selection, Installation, Maintenance, Renewal, Replacement
42 Proactive Leak Detection Model
43 Pressure Management in the Model

44 Response Time Improvement
45 WaterRF 4372: Effective Organization and Component Analysis of Water Utility Leakage Data Summarized Component Analysis Water Audit: City of Austin, TX, USA, 2011 WaterRF 4372 COMPONENT ANALYSIS MODEL SUMMARY As the input data is filled into the model, this sheet will populate with the results and recommendations from the Real Losses Component Analysis, A-L-R Times, Economic Intervention and Pressure Management tabs. The performance indicators from the AWWA Free Water Audit Software have been added to show a brief review of the performance the system being analyzed WATER AUDIT PERFORMANCE INDICATORS Financial Non-revenue water as percent by volume of water supplied: Non-revenue water as percent by cost of operating system: Annual cost of Apparent Losses: Annual cost of Real Losses: Operational Efficiency Apparent Losses per service connection per day: Real Losses per service connection per day*: Real Losses per length of main per day: er service connection per day per pressure: Unavoidable Annual Real Losses (UARL): Current Annual Real Losses (CARL): Infrastructure Leakage Index (ILI) [CARL/UARL]: 10.3% 3.0% $4,376,956 $1,429, gal/service conn/day 56.0 gal/service conn/day N/A gal/mi/day 0.7 gal/service conn/day/psi 1, MG/Yr 4, MG/Yr 3.0 REAL LOSS COMPONENT ANALYSIS RESULTS System Component Background Leakage Reported Unreported Failures Failures Total (MG) (MG) (MG) (MG) Reservoirs Mains and Appurtenances Service Connections Total Annual Real Loss 1, , Real Losses as Calculated by Water Audit Hidden Losses/Unreported Leakage Currently Running Undetected 4, , AWARNESS, LOCATION AND REPAIR TIME REDUCTION RESULTS Reported Failures Total Potential Savings if Location and Repair Duration is Reduced as Simulated on the A-L-R Times Options Sheet Total Potential Cost Savings if Location and Repair Duration is Reduced as Simulated on the A-L-R Times Options Sheet Unreported Failures (MG) $ 23,458 $ 10,837 Per Year ECONOMIC INTERVENTION FREQUENCY FOR PROACTIVE LEAK DETECTION RESULTS Percentage of the System to be Surveyed per Year 31 % Average Annual Budget for Intervention (Proactive Leak Detection) 283,187 $/year Potentially Recoverable Leakage 1, MG/year ALTERNATIVE PRESSURE MANAGEMENT SCENARIO RESULTS User-Inputted Reduction in Average System Pressure Assumed % Reduction in Average System Pressure Estimated Real Loss Reduction from Pressure Management Program Financial Savings from Pressure Management Program User-Estimated Cost of Pressure Reduction Resulting Pressure Management Program Payback Period 5.0 PSI 6% MG/Yr 67,026 $/Year 100,000 $ 1.5 Years
46 Please be in touch! Reinhard Sturm Water Systems Optimization e: Kate Gasner Water Systems Optimization e:
Water Research Foundation 4372a
 Water Research Foundation 4372a Real Loss Component Analysis: What s Your Leakage Profile Project Team Downloading the 4372 Materials www.waterrf.org, then search for 4372 or real losses 7 The AWWA Water
Water Research Foundation 4372a. Real Loss Component Analysis: A Tool for Economic Water Loss Control
 Water Research Foundation 4372a Real Loss Component Analysis: A Tool for Economic Water Loss Control Project Team TECHNICAL TEAM Reinhard Sturm, Water Systems Optimization Kate Gasner, Water Systems Optimization
Accounting For Loss Water & Revenues
 Accounting For Loss Water & Revenues Ohio Section AWWA Southeast/Southwest Districts Joint Spring Meeting Tom Schwing Deer Creek State Park April 21, 2016 AWWA Tools for Water Loss Control AWWA Free Water
Water Loss Control in Effective Utility Management
 Water Loss Control in Effective Utility Management M. Steve Cavanaugh, Jr., PE steve.cavanaugh@cavanaughsolutions.com Feb 22, 2017 Strategic Planning/Core Values include Relevant Goals and Objectives for
WRF Webcast. A Snapshot of Water Loss: Examining the Country s Water Audit Submissions
 No part of this presentation may be copied, reproduced, or otherwise utilized without permission. WRF Webcast A Snapshot of Water Loss: Examining the Country s Water Audit Submissions November 5, 2015
Using Performance Indicators as Part of a Water Audit
 Using Performance Indicators as Part of a Water Audit Smart Management for Small Water Systems What are Performance Indicators? A series of water loss measures that are consistent, repeatable and presented
BEST PRACTICE 3: System Water Loss Control Overview Why a Best Practice? State Planning Requirements
 BEST PRACTICE 3: System Loss Control Foundational best practice Utility operations - implemented by water utilities on their own system Customer participation not applicable Overview loss control is the
George Kunkel, Will Jernigan, Cor Merks
 Learning Module #3 A Listening and Learning Session on the Use of Percentage Performance Indicators for Non-revenue Water Management George Kunkel, Will Jernigan, Cor Merks North American Water Loss Conference
An Introduction to Strategic Water Loss Reduction
 An Introduction to Strategic Water Loss Reduction Webinar 2: Strategies to Address Real Water Losses When you know better you do better Maya Angelou Logistics At the top right corner of your screen: Show
REPORT ON THE EVALUATION OF WATER AUDIT DATA FOR PENNSYLVANIA WATER UTILITIES
 REPORT ON THE EVALUATION OF WATER AUDIT DATA FOR PENNSYLVANIA WATER UTILITIES Prepared by: Philadelphia, Pennsylvania Prepared for: Natural Resources Defense Council TABLE OF CONTENTS 1. Introduction 1
The Importance of Real Loss Component Analysis for Determining the Correct Intervention Strategy
 Leakage 2005 - Conference Proceedings Page 1 The Importance of Real Loss Component Analysis for Determining the Correct Intervention Strategy P Fanner*, J Thornton** *Fanner & Associates Ltd, 7 Brunswick
NON REVENUE WATER INTERNATIONAL BEST PRACTICE FOR ASSESSMENT, MONITORING AND CONTROL
 NON REVENUE WATER INTERNATIONAL BEST PRACTICE FOR ASSESSMENT, MONITORING AND CONTROL Malcolm Farley, Principal Consultant, Malcolm Farley Associates Oxfordshire, UK 12th Annual CWWA Conference Paradise
Performance Audit: Department of Watershed Management Efforts to Reduce Water Loss
 Performance Audit: Department of Watershed Management Efforts to Reduce Water Loss April 2017 City Auditor s Office City of Atlanta File #16.10 CITY OF ATLANTA City Auditor s Office Leslie Ward, City
Risk-based Prioritization of Transmission & Distribution Projects in Westchester County
 Risk-based Prioritization of Transmission & Distribution Projects in Westchester County NYS AWWA Water Event April 26, 2017 Alberto Quiroz, PE Outline Background Methodology Results SUEZ in North America
Economic Level of Leakage (ELL)
") Conferenze sulle Strategie di Gestione delle Perdite Idriche 1 Economic Level of Leakage (ELL) Stuart Trow United Kingdom Leakage Consultant and Director of CaL Solutions Ltd Approaches to Estimating and
Conferenze sulle Strategie di Gestione delle Perdite Idriche 1 Economic Level of Leakage (ELL) Stuart Trow United Kingdom Leakage Consultant and Director of CaL Solutions Ltd Approaches to Estimating and
COMPREHENSIVE COST OF SERVICE AND RATE DESIGN ANALYSIS
 Black & Veatch Holding Company 2011. All rights reserved. COMPREHENSIVE COST OF SERVICE AND RATE DESIGN ANALYSIS San Antonio Water System PREPARED FOR San Antonio Water System 26 MAY 2015 B&V PROJECT NO.
Final Report COMPREHENSIVE WATER AND WASTEWATER COST OF SERVICE AND RATE STUDY
 Final Report COMPREHENSIVE WATER AND WASTEWATER COST OF SERVICE AND RATE STUDY Phase 2 Cost of Service and Rate Design BLACK & VEATCH PROJECT NO. 192366 Black & Veatch Holding Company 2017. All rights
Las Vegas Valley Water District Rates and Rules Citizens Advisory Committee 2016 RECOMMENDATIONS REPORT
 Las Vegas Valley Water District Rates and Rules Citizens Advisory Committee 2016 RECOMMENDATIONS REPORT LAS VEGAS VALLEY WATER DISTRICT Rates and Rules Citizens Advisory Committee Table of Contents Executive
DRAFT COMPREHENSIVE COST OF SERVICE AND RATE DESIGN ANALYSIS. San Antonio Water System. San Antonio Water System 21 MAY 2015 PREPARED FOR
 Black & Veatch Holding Company 2011. All rights reserved. DRAFT COMPREHENSIVE COST OF SERVICE AND RATE DESIGN ANALYSIS San Antonio Water System PREPARED FOR San Antonio Water System 21 MAY 2015 B&V PROJECT
JCI Energy Savings Performance Contract (ESPC) Services AMI System & Water Meter Replacements Water System SCADA Upgrades Acoustic Leak Survey August
 Services AMI System & Water Meter Replacements Water System SCADA Upgrades Acoustic Leak Survey August") JCI Energy Savings Performance Contract (ESPC) Services AMI System & Water Meter Replacements Water System SCADA Upgrades Acoustic Leak Survey August 7, 2018 2 What is ESPC? Energy Savings Performance
JCI Energy Savings Performance Contract (ESPC) Services AMI System & Water Meter Replacements Water System SCADA Upgrades Acoustic Leak Survey August 7, 2018 2 What is ESPC? Energy Savings Performance
What is PBC and how it can help deal with the challenges of reducing NRW?
 Joint DWP ARA Regional Workshop on Performance Based Contracting for Non-Revenue Water Reduction What is PBC and how it can help deal with the challenges of reducing NRW? Bambos Charalambous World Bank
WATER AND SEWER RATE STUDY
 FINAL WATER AND SEWER RATE STUDY B&V PROJECT NO. 179322.0100 PREPARED FOR City of Lynwood, CA JANUARY 11, 2017 Black & Veatch Holding Company 2011. All rights reserved. City of Lynwood, CA WATER AND SEWER
Defining a Resilient Business Model for Water Utilities
 Defining a Resilient Business Model for Water Utilities Water Research Foundation Project #4366 Shadi Eskaf, Environmental Finance Center at UNC eskaf@sog.unc.edu www.efc.unc.edu National Water & Wastewater
Revenue Trends, Pricing Signals, and Financially Resilient Utilities: Understanding and Adapting to New Challenges
 Revenue Trends, Pricing Signals, and Financially Resilient Utilities: Understanding and Adapting to New Challenges Jeff Hughes Director Environmental Finance Center at the University of North Carolina
Performance-based contract financing options Pristina, 7 October, IFC Advisory Services in Public-Private Partnerships
 Performance-based contract financing options Pristina, 7 October, 2014 IFC Advisory Services in Public-Private Partnerships 2 Authorized Consumption Billed Authorized Consumption Unbilled Authorized Consumption
CITY OF RIVIERA BEACH, FLORIDA UTILITY SPECIAL DISTRICT S SYSTEMS AND OPERATIONS FOR FISCAL YEAR ENDING SEPTEMBER 30, 2010.
 UTILITY SPECIAL DISTRICT S SYSTEMS AND OPERATIONS FOR FISCAL YEAR ENDING SEPTEMBER 30, 2010 Overview The service area of the Utility District s Water System includes the entire City of Riviera Beach (approximately
YORK COUNTY, SOUTH CAROLINA
 YORK COUNTY, SOUTH CAROLINA Water and Sewer Financial Planning and Rate Study Report October 25, 2017 1031 S. Caldwell Street Suite 100 Charlotte, NC 28203 Phone 704.373.1199 Fax 704.373.1113 www.raftelis.com
Reducing Non-Revenue Water: Actions to Reduce Real Losses and Improve Customer Satisfaction. June 21, 2016
 Reducing Non-Revenue Water: Actions to Reduce Real Losses and Improve Customer Satisfaction June 21, 2016 A growing problem VS. 2 Good news and bad news No magic wand! Knowledgeable people sharing insight
APPENDIX J. CIP Renewal and Replacement Process. Revision History
 APPENDIX J CIP Renewal and Replacement Process Revision History Revision Date Approval Reason 0 09/30/05 Original 1 05/25/11 2 09/27/12 3 03/26/14 4 11/14/16 E. Yong Updated Clearinghouse process and replaced
City of Norco WATER AND SEWER RATES Frequently Asked Questions
 Q. Where will I see the increase in my bill? A. Your utility bill will see changes in the Water Consumption, Irrigation Consumption, Fixed Monthly Water Charge and Sewer sections of the bill. If you have
Non-Revenue Water Pre-Feasibility Assessment Tool
 Non-Revenue Water Pre-Feasibility Assessment Tool MBI Water Services Master Class #6 2018 For Municipalities, By Municipalities, Benefitting Municipalities and their Communities Background SA 30 th driest
CITY COUNCIL STUDY SESSION MEMORANDUM
 City and County of Broomfield, Colorado CITY COUNCIL STUDY SESSION MEMORANDUM To: From: Prepared by: Mayor and City Council Charles Ozaki, City and County Manager David Allen, Deputy Director of Public
Capital Finance Overview: Dealing with the New Normal
 Capital Finance Overview: Dealing with the New Normal Jeff Hughes Director Environmental Finance Center at the University of North Carolina efc.unc.edu jhughes@sog.unc.edu (919) 843-4956 www.efc.unc.edu
La Cañada Irrigation District
 La Cañada Irrigation District Water Rate Study Report - 2009 March, 2009 201 S. Lake Blvd, Suite 803 Pasadena CA 91101 Phone Fax 626 583 1894 626 583 1411 www.raftelis.com March 30, 2009 Mr. Douglas M.
REQUEST FOR PROPOSALS
 REQUEST FOR PROPOSALS Water & Sewer Utilities Optimization City of Wichita Public Works & Utilities May 14, 2015 PROJECT DEFINITION The City of Wichita is seeking proposals for assistance with the risk,
Asset Management Plan Summary Report Adopted May 2012
 Asset Management Plan Summary Report Adopted TABLE OF CONTENTS Executive Summary..4 Introduction/Background...7 Meter Retrofit Plan..11 Distribution Main Asset Management Plan..14 Groundwater Well Asset
Using practical predictions of Economic Intervention Frequency to calculate Short-run Economic Leakage Level, with or without Pressure Management
 Using practical predictions of Economic Intervention Frequency to calculate Short-run Economic Leakage Level, with or without Pressure Management A.O. Lambert, ILMSS Ltd, UK, ILMSS@CastillianLtd.com A.
Final COST OF SERVICE STUDY SEPTEMBER City of San Clemente
 Final COST OF SERVICE STUDY SEPTEMBER 2017 City of San Clemente Contents CONTENTS Executive Summary... 1 Study Goals and Drivers... 1 Water Rate Analysis & Adoption... 2 Recycled Water Rate Analysis &
Water and Wastewater Utility Rates
 Water and Wastewater Utility Rates March 1, 2016 Presented By: Diana Langley Public Works Director 1 OVERVIEW 2 Uses of Funds Capital Investment Debt Service Operating Cost = Revenue Requirement 3 Source
Rate Comparison & Benchmarking Analysis
 + Rate Comparison & Benchmarking Analysis Final Report September 2016 Firm Headquarters Redmond Town Center 7525 166 th Ave. NE Suite D-215 Redmond, WA 98052 T: (425) 867-1802 F: (425) 867-1937 www.fcsgroup.com
City of Newport News Virginia. Waterworks Ratings Presentation. April 27, 2017
 City of Newport News Virginia Waterworks Ratings Presentation April 27, 2017 I. Overview Newport News Waterworks Mission Statement: To provide high quality drinking water and support public health, safety,
Full Cost Accounting and Solid Waste Rate Structuring
 September 28, 2016 8:30 AM New Mexico Solid Waste & Recycling Conference Full Cost Accounting and Solid Waste Rate Structuring Presenter: Mr. David S. Yanke Workshop Agenda A. Background B. Full Cost Accounting
WATER UTILITY FINANCIAL PLAN AND RATE STUDY CITY OF WHITEFISH, MT MARCH 2016
 WATER UTILITY FINANCIAL PLAN AND RATE STUDY CITY OF WHITEFISH, MT MARCH 2016 The Financial Link Executive Summary - Water In May 2015, the City of Whitefish (City) retained AE2S to complete a Water and
2017 WATER AND WASTEWATER IMPACT FEE STUDY CITY OF AZLE, TEXAS
 2017 WATER AND WASTEWATER IMPACT FEE STUDY CITY OF AZLE, TEXAS JULY 2017 Prepared by: Weatherford Office Address: 1508 Santa Fe Drive, Suite 203 Weatherford, Texas 76086 (817) 594-9880 www.jacobmartin.com
SAN ANTONIO WATER SYSTEM (SAWS) RATE ADVISORY COMMITTEE: MEETING 3
 RATE ADVISORY COMMITTEE: MEETING 3") 01 April, 2014 SAN ANTONIO WATER SYSTEM (SAWS) RATE ADVISORY COMMITTEE: MEETING 3 Bill Zieburtz Richard Campbell Robert Chambers RATE SETTING PROCESS STUDY APPROACH RATE SETTING OBJECTIVES FINANCIAL PLAN
01 April, 2014 SAN ANTONIO WATER SYSTEM (SAWS) RATE ADVISORY COMMITTEE: MEETING 3 Bill Zieburtz Richard Campbell Robert Chambers RATE SETTING PROCESS STUDY APPROACH RATE SETTING OBJECTIVES FINANCIAL PLAN
MARINA COAST WATER DISTRICT FINANCIAL PLAN AND RATE AND FEE STUDY FINAL REPORT. September 2013
 MARINA COAST WATER DISTRICT FINANCIAL PLAN AND RATE AND FEE STUDY FINAL REPORT September 2013 10540 TALBERT AVENUE, SUITE 200 EAST FOUNTAIN VALLEY, CALIFORNIA 92708 P. 714.593.5100 F. 714.593.5101 MARINA
City of Arroyo Grande Department of Public Works REQUEST FOR PROPOSAL WATER AND WASTEWATER RATE STUDY UPDATE
 I. INTRODUCTION City of Arroyo Grande Department of Public Works REQUEST FOR PROPOSAL WATER AND WASTEWATER RATE STUDY UPDATE The City of Arroyo Grande, California (the City ) was incorporated as a general
Temescal Valley Water District
 Temescal Valley Water District Comprehensive Water, Recycled Water, and Wastewater Cost of Service Study Draft Report / December 7, 2016 24640 Jefferson Avenue Suite 207 Murrieta, CA 92562 Phone 951.698.0145
RECENT ADVANCES IN CALCULATING ECONOMIC INTERVENTION FREQUENCY FOR ACTIVE LEAKAGE CONTROL, AND IMPLICATIONS FOR CALCULATION OF ECONOMIC LEAKAGE LEVELS
 IWA International Conference on Water Economics, Statistics, and Finance Rethymno, Greece, 8-10 July 2005 RECENT ADVANCES IN CALCULATING ECONOMIC INTERVENTION FREQUENCY FOR ACTIVE LEAKAGE CONTROL, AND
Central Texas Water Efficiency Network Water Rates and Revenue Workshop
 Central Texas Water Efficiency Network Water Rates and Revenue Workshop Jeff Hughes, UNC Environmental Finance Center jhughes@sog.unc.edu www.efc.sog.unc.edu Austin, Texas November 13, 2013 http://efc.sog.unc.edu
City of Riverbank. Water Rate Study FINAL 6/18/2015
 Water Rate Study FINAL 6/18/2015 Bartle Wells Associates Independent Public Finance Consultants 1889 Alcatraz Avenue Berkeley, California 94703 www.bartlewells.com Tel: 510-653-3399 June 18, 2015 6707
Appendices to NCHRP Research Report 903: Geotechnical Asset Management for Transportation Agencies, Volume 2: Implementation Manual
 Appendices to NCHRP Research Report 903: Geotechnical Asset Management for Transportation Agencies, Volume 2: Implementation Manual This document contains the following appendices to NCHRP Research Report
WATER USER RATES & FEE STUDY
 WATER USER RATES & FEE STUDY FINAL REPORT February 2016 BARTLE WELLS ASSOCIATES Independent Public Finance Consultants 1889 Alcatraz Avenue Berkeley, California 94703 www.bartlewells.com Tel: 510/653-3399
CNAM Risk Management for Utility Managers
 CNAM 2013 Heather McGinnity PEng. Region of Peel Project Manager Roop Lutchman, PEng. GHD Leader, Business Consulting May 07 th, 2013 Agenda 1. Introduction 2. Risk Management Framework 3. Case Study (Lake
Staff Report Page No. 1 of 7. CONSENT CALENDAR Agenda Item No.: 7g CC Mtg.: 04/12/2016. April 12,2016 DATE: Mayor and City Council Members TO: FROM:
 CONSENT CALENDAR Agenda Item No.: 7g CC Mtg.: 04/12/2016 DATE: TO: FROM: SUBJECT: April 12,2016 Mayor and City Council Members Public Works/Utilities Department RESOLUTION NO. 9743 - A RESOLUTION AUTHORIZING
RATE INFORMATION. A. The rates adopted by the Authority will be in accordance with of the Code of Virginia, as amended.
 Page 1 of 8 Section 1. PURPOSE The purpose of this policy to explain how the Bedford Regional Water Authority ( Authority ) implements the adopted Rates policy and to provide explanation for each of the
Cedar River Water and Sewer District FEE AND CHARGE SCHEDULE AMENDED January 21, 2014
 Cedar River Water and Sewer District FEE AND CHARGE SCHEDULE AMENDED January 21, 2014 I. FLAT FEES Certificate of Availability Fee - New (W & S each) Residential - Single family residence $70.00 Commercial
2016 Collection Systems Workshop. Asset Management for Small to Midsized Communities
 2016 Collection Systems Workshop FISHBECK, THOMPSON, CARR & HUBER, INC. Asset Management for Small to Midsized Communities Ohio Water Environment Association May 18 2016 An asset management program identifies
Looking at various aspects of leakage calculations
 Review of SELL Calculations Looking at various aspects of leakage calculations Stuart Trow Estimating, reporting and forecasting leakage Specific objectives identified for the SELL review were to: Take
Mbombela Water Indaba : April 2012
 Background South Africa is a dry country, with a low average rainfall. Our rivers are small in comparison with other countries and shared with other countries. Presented by: Willem Wegelin Many of our
Agenda Rio Linda / Elverta Community Water District Planning Committee
 Agenda Rio Linda / Elverta Community Water District Planning Committee Sacramento Metro Fire Dept. Friday, February 5, 2015 6609 Rio Linda Blvd. 2:00 pm Rio Linda, CA 95673 Public documents relating to
Water Rate Study Final Report
 Phelan Pinon Hills Community Services District March 6, 2013 Water Rate Study Final Report Corporate Office: Anaheim, California Temecula Office: 27368 Via Industria, Suite 110 Temecula, California 92590
REQUEST FOR PROPOSALS Consulting Engineering Services for: Troutdale Water Master Plan
 REQUEST FOR PROPOSALS Consulting Engineering Services for: Troutdale Water Master Plan I. Project Background The City of Troutdale is in need of the services of a qualified Professional Engineer, licensed
Diablo Water District 2018 Facility Reserve Charge & MERA Update
 June 15, 2018 Diablo Water District 2018 Facility Reserve Charge & MERA Update This technical memorandum describes the 2018 update of the existing funding mechanisms used by Diablo Water District (DWD)
Diablo Water District PRELIMINARY DRAFT 2016 Facility Reserve Charge & MERA Update
 June 1, 2016 Diablo Water District PRELIMINARY DRAFT 2016 Facility Reserve Charge & MERA Update This technical memorandum describes the 2016 update of the existing funding mechanisms used by Diablo Water
Capital Region Water. Water and Wastewater Rate Study Report. November 22, Capital Region Water Water and Wastewater Rate Study
 Capital Region Water Water and Wastewater Rate Study Report November 22, 2017 Capital Region Water Water and Wastewater Rate Study TABLE OF CONTENTS 1. INTRODUCTION...1 1.1 RATE STUDY SCOPE AND OBJECTIVES...1
This is a digital document from the collections of the Wyoming Water Resources Data System (WRDS) Library.
 Library.") This is a digital document from the collections of the Wyoming Water Resources Data System (WRDS) Library. For additional information about this document and the document conversion process, please contact
This is a digital document from the collections of the Wyoming Water Resources Data System (WRDS) Library. For additional information about this document and the document conversion process, please contact
Defining a Resilient Business Model for Water Utilities Water Research Foundation #4366 Presentation to Louisville Water Company 10/14/2013
 Defining a Resilient Business Model for Water Utilities Water Research Foundation #4366 Presentation to Louisville Water Company 10/14/2013 Jeff Hughes, jhughes@sog.unc.edu Shadi Eskaf, eskaf@sog.unc.edu
2017 ENTERPRISE ASSET MANAGEMENT PLAN
 Corporate Asset Management 2017 ENTERPRISE ASSET MANAGEMENT PLAN Investments in Peel s Infrastructure We are all asset managers! Executive Summary The Region s infrastructure is a public investment with
Performance Based Contracts in Non- Revenue Water Reduction Programs March Session 4: What is a PBC?
 Performance Based Contracts in Non- Revenue Water Reduction Programs March 2017 Session 4: What is a PBC? www.wsp.org www.worldbank.org/water www.blogs.worldbank.org/water @WorldBankWater Introduction
Some Examples of European Water Loss Targets, and the Law of Unintended Consequences
 Some Examples of European Water Loss Targets, and the Law of Unintended Consequences Marco Fantozzi, Miya, Via Forcella 29-2564 Gussago (BS) Italy; marco.fantozzi@email.it A.O. Lambert, ILMSS Ltd, LL3
WATER ASSET MANAGEMENT PLAN
 WATER ASSET MANAGEMENT PLAN Georgetown Charter Township Ottawa County, Michigan November 2017 Where we re going: System Goals INTRODUCTION About this Document This document is our Water Asset Management
Setting Rates to Support a Capital Improvement Plan
 Setting Rates to Support a Capital Improvement Plan Stacey Isaac Berahzer 18th Alabama Annual Surface Water Meeting October 29, 2015 http://efc.sog.unc.edu @EFCatUNC Dedicated to enhancing the ability
TOWN OF ORO VALLEY WATER UTILITY COMMISSION WATER RATES ANALYSIS REPORT OCTOBER 7, 2009
 TOWN OF ORO VALLEY WATER UTILITY COMMISSION WATER RATES ANALYSIS REPORT OCTOBER 7, 2009 EXECUTIVE SUMMARY The functions and duties of the Oro Valley Water Utility Commission include reviewing and developing
MEASUREMENT AND VERIFICATION AND THE IPMVP
 MEASUREMENT AND VERIFICATION AND THE IPMVP EPC TOOLKIT FOR HIGHER EDUCATION APRIL 2009 INDEX IPMVP: THE PRINCIPLES IPMVP: THE DIFFERENT OPTIONS THE COSTS OF M&V 3 4 7 With permission from the author, this
Fiscal Year Budget Proposal
 Fiscal Year 20182019 Budget Proposal Board of Directors March 27, 2018 RIVANNA WATER & SEWER AUTHORITY FY 2019 Proposed Budget Table of Contents Budget Highlights Prepared: March 6, 2018 Adopted: Draft
Water and Sewer Utility Rate Studies
 Final Report Water and Sewer Utility Rate Studies July 2012 Prepared by: HDR Engineering, Inc. July 27, 2012 Mr. Mark Brannigan Director of Utilities 591 Martin Street Lakeport, CA 95453 Subject: Comprehensive
Corridors of Commerce DRAFT Scoring and Prioritization Process. Patrick Weidemann Director of Capital Planning and Programming November 1, 2017
 Corridors of Commerce DRAFT Scoring and Prioritization Process Patrick Weidemann Director of Capital Planning and Programming November 1, 2017 Project Purpose To develop and implement a scoring and project
Chicopee River CSO Project Springfield Water & Sewer Commission. APWA Congress September 9, CSO Control Plan. CSO Control
 Chicopee River CSO Project Springfield Water & Sewer Commission APWA Congress September 9, 2007 CSO Control Plan Typical Approach Different Thinking on Controlling Costs Case Example Springfield MA CSO
Risk Assessment and Development of Maintenance Strategy for Pipe Rehabilitation Using WDNetXL
 EPiC Series in Engineering Volume 3, 2018, Pages 1735 1743 HIC 2018. 13th International Conference on Hydroinformatics Engineering Risk Assessment and Development of Maintenance Strategy for Pipe Rehabilitation
Water, Sewer and Storm Sewer Rate Analysis
 Water, Sewer and Storm Sewer Rate Analysis August 8, 207 68 North Main Street Bowling Green, Ohio 43402 49-352-7537 www.poggemeyer.com Table of Contents Introduction................................................................
360 CMR (2005)
") 1 of 15 DOCUMENTS 360 CMR 12.01 (2005) 12.01: Preamble The purpose of 360 CMR 12.00 is to promote water conservation by the communities that receive some or all of their water supply from the Authority
1 of 15 DOCUMENTS 360 CMR 12.01 (2005) 12.01: Preamble The purpose of 360 CMR 12.00 is to promote water conservation by the communities that receive some or all of their water supply from the Authority
RATE & FEE SCHEDULE AMENDED July 1, 2018
 RATE & FEE SCHEDULE AMENDED July 1, 2018 I. FLAT FEES & CHARGES Certificate of Availability Fee - New (Water & Sewer Each) Residential - Single Family Residence $70.00 Commercial & Short Plats $200.00
Maurice Kaufman, Director of Public Works / City Engineer Bartle Wells Associates DATE: September 7, 2016 MEMORANDUM
 TO: FROM: Maurice Kaufman, Director of Public Works / City Engineer Bartle Wells Associates DATE: September 7, 2016 SUBJECT: - MEMORANDUM Introduction The (City) provides sewer sanitary collection services
ES.1 Findings and Recommendations... ES Overview Current Rates Rate Making Objectives
 Table of Contents Executive Summary ES.1 Findings and Recommendations... ES-1 Chapter 1. Introduction 1.1 Overview... 1-1 1.2 Current Rates... 1-1 1.3 Rate Making Objectives... 1-1 Chapter 2. Revenue Requirement
General Manager s Recommended Budget for Fiscal Years 2018 & Maureen A. Stapleton, General Manager
 General Manager s Recommended Budget for Fiscal Years 2018 & 2019 Maureen A. Stapleton, General Manager Fiscal Years 2018 & 2019 Recommended Budget Overview Themes Security Cyber & Facilities State & Federal
Webinar Ask the Expert - Advice on Capital Planning
 Webinar Ask the Expert - Advice on Capital Planning June 14, 2017 This program is made possible under a cooperative agreement with EPA. About the Environmental Finance Center Network (EFCN) The Environmental
WATER SUPPLY AGREEMENT BETWEEN THE CITY OF EVANSTON AND THE VILLAGE OF MORTON GROVE AND THE VILLAGE OF NILES
 WATER SUPPLY AGREEMENT BETWEEN THE CITY OF EVANSTON AND THE VILLAGE OF MORTON GROVE AND THE VILLAGE OF NILES Background... 6 1. Parties... 6 1.01 Parties... 6 2. Initial Term of Agreement; Extended Term;
5.- RISK ANALYSIS. Business Plan
 5.- RISK ANALYSIS The Risk Analysis module is an educational tool for management that allows the user to identify, analyze and quantify the risks involved in a business project on a specific industry basis
Full Cost Accounting for Municipal Solid Waste Services Workshop Capital Area Council of Governments
 June 21, 2017 9:00 AM to 3:00 PM Full Cost Accounting for Municipal Solid Waste Services Workshop Capital Area Council of Governments Presenter: Mr. David S. Yanke Workshop Agenda A. Background B. Full
FORT COLLINS- LOVELAND WATER DISTRICT
 FORT COLLINS- LOVELAND WATER DISTRICT Water Financial Planning and Rate Study Report March 16, 2018 District of Thousand Oaks Water and Wastewater Financial Plan Study Report March 16, 2018 Board of Directors
Optimal Risk-Based Life-Cycle Cost Scheduling of Water & Sewer Main Replacements
 Optimal Risk-Based Life-Cycle Cost Scheduling of Water & Sewer Main Replacements The firefighter who was driving the firetruck when it fell into the Valley Village sinkhole caused by a broken water line
Benchmarking and Rate Setting in Water and Wastewater Management
 Benchmarking and Rate Setting in Water and Wastewater Management Stacey Isaac Berahzer Senior Project Director Environmental Finance Center at the University of North Carolina Georgia Association of Water
LCA Lease Concession Financial Study Summary of Results
 LCA Lease Concession Financial Study Summary of Results April 23, 2018 www.jacobs.com worldwide Agenda 1. Safety Minute 2. Project Overview 3. Debt Management 4. Capex 5. Revenue Sufficiency 6. Model Scenarios
SAUSALITO-MARIN CITY SANITARY DISTRICT 1 EAST ROAD SAUSALITO, CALIFORNIA Telephone: (415) Fax: (415)
 Fax: (415)") 1 EAST ROAD SAUSALITO, CALIFORNIA Telephone: (415) 332-0244 Fax: (415) 332-0453 Budget FY 2017/18 Adopted by Board on June 5, 2017 BUDGET EXECUTIVE SUMMARY FISCAL YEAR 2017/18 DISTRICT OVERVIEW The Sausalito-Marin
1 EAST ROAD SAUSALITO, CALIFORNIA Telephone: (415) 332-0244 Fax: (415) 332-0453 Budget FY 2017/18 Adopted by Board on June 5, 2017 BUDGET EXECUTIVE SUMMARY FISCAL YEAR 2017/18 DISTRICT OVERVIEW The Sausalito-Marin
WATER AND WASTEWATER RATE STUDY
 WATER AND WASTEWATER RATE STUDY Draft July 3, 2013 Prepared by: Page 1 Page 2 201 S. Lake Avenue Suite 301 Pasadena, CA 91101 Phone 626. 583. 1894 Fax 626. 583. 1411 www.raftelis.com July 1, 2013 Mr. Don
The Effects of Surge Flows on Residential Water Meters
 Utah State University DigitalCommons@USU All Graduate Theses and Dissertations Graduate Studies 5-2018 The Effects of Surge Flows on Residential Water Meters Ryan P. Weller Utah State University Follow
IN THE MATTER OF THE PUBLIC UTILITIES ACT. -and-
 DECISION 2014 NSUARB 84 M06030 NOVA SCOTIA UTILITY AND REVIEW BOARD IN THE MATTER OF THE PUBLIC UTILITIES ACT -and- IN THE MATTER OF AN APPLICATION of the MUNICIPALITY OF THE COUNTY OF KINGS on behalf
Lookout Mountain Water District: Genesis and Evolution
 Lookout Mountain Water District: Presented by: Genesis and Evolution John Roscoe, President of the Board and Panel: Board of Directors and Contractors September 30, 2010 1 Introduction Purpose: Update
WATER AND SEWER UTILITIES RATE STUDY
 WATER AND SEWER UTILITIES RATE STUDY RATE DESIGN WORKSHOP WITHCITYCOUNCIL / UTILITIES COMMISSION March 6, 2014 Agenda Overview of Rate Study Process Water / Sewer Developer Impact Fees Sewer Rates Water