APPENDIX E ECONOMICS
|
|
|
- Laurence Morrison
- 6 years ago
- Views:
Transcription
1 APPENDIX E ECONOMICS
2


3 American River Watershed Common Features General Reevaluation Report Draft Economics Appendix E February 2015
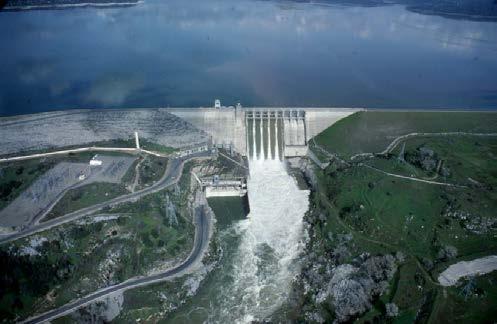
4 Cover Photos courtesy of the Sacramento District: Sacramento Weir during operation Sacramento River facing south near the Pocket and Little Pocket neighborhoods High flows on the American River at the Highway 160 overcrossing Folsom Dam releasing high flows
5 This Page Intentionally Left Blank.
6 Economics - Appendix E Table of Contents CHAPTER INTRODUCTION PURPOSE & SCOPE BACKGROUND STUDY AREA AND BASINS ECONOMIC ANALYSIS IN PRIOR REPORTS SUMMARY OF PREVIOUSLY-AUTHORIZED FLOOD RISK MANAGEMENT IMPROVEMENTS ALREADY CONSTRUCTED OR CURRENTLY UNDER CONSTRUCTION FUTURE WITHOUT-PROJECT CONDITION ORGANIZATION & CONTENT CHAPTER FRAMEWORK OF ECONOMIC ANALYSIS CONSISTENCY WITH CURRENT REGULATIONS & POLICIES PRICE LEVEL, PERIOD OF ANALYSIS, AND DISCOUNT RATE MAIN ASSUMPTIONS METHODOLOGIES, TECHNIQUES, & ANALYTICAL TOOLS Economic Analytical Tool: HEC-FDA Software Floodplain Data in HEC-FDA Using FLO-2D Model Output Computing Stage-Damage Curves in HEC-FDA Multiple-Source Flooding into Single Consequence Area ECONOMIC IMPACT AREAS (EIA) HYDRAULIC REACHES & REPRESENTATIVE INDEX POINTS DESCRIPTION OF ECONOMIC DATA & UNCERTAINTIES Structure Inventory Structure and Content Values First-Floor Elevation of Structures Emergency Cost Loss Categories & Descriptions Automobiles Depth-Percent Damage Curves Economic Uncertainties American River Common Features GRR February 2015 Page 1
7 Economics - Appendix E 2.8 DESCRIPTION OF ENGINEERING DATA & UNCERTAINTIES Hydrologic Engineering Data Used in HEC-FDA Hydraulic Engineering Data Used in HEC-FDA Geotechnical Engineering Data Used in HEC-FDA Engineering Uncertainties in HEC-FDA CHAPTER WITHOUT-PROJECT ANALYSIS & RESULTS: AUTHORIZED COMMON FEATURES + JOINT FEDERAL PROJECT + DAM RAISE FUTURE WITHOUT-PROJECT CONDITION FLOODING CHARACTERISTICS FLOOD RISK: PROBABILITY & CONSEQUENCES Annual Chance Exceedance (ACE) Event Damages Expected Annual Damages (EAD) Annual Exceedance Probability (AEP) by Index Point and Basin Long-Term Risk by Index Point and Basin Assurance CHAPTER WITH-PROJECT ALTERNATIVES ANALYSES WITH-PROJECT ANALYSIS: BASIN AS BASIC ANALYTICAL UNIT DESCRIPTION OF FINAL ARRAY OF ALTERNATIVES WITH-PROJECT RESULTS: RESIDUAL EAD AND BENEFITS BY INDEX POINT AND ALTERNATIVE RANGE OF BENEFITS BY INDEX POINT & ALTERNATIVE WITH-PROJECT RESULTS: BENEFITS BY BASIN AND ALTERNATIVE BENEFITS DURING CONSTRUCTION BENEFITS OUTSIDE THE IMMEDIATE STUDY AREA: CITY OF WEST SACRAMENTO WITH-PROJECT PERFORMANCE RESULTS: AEP, LONG-TERM RISK, & ASSURANCE SCREENING-LEVEL COST ESTIMATES: BY ALTERNATIVE, BASIN, & SOURCE OF FLOOD RISK NET BENEFIT AND BENENFIT-TO-COST ANALYSES: PERFORMED INCREMENTALLY BY SOURCE OF FLOOD RISK & BASIN IDENTIFICATION OF NATIONAL ECONOMIC DEVELOPMENT (NED) PLAN American River Common Features GRR February 2015 Page 2
8 Economics - Appendix E List of Figures Figure 1: Study Area, Basins, and Major Sources of Flooding... 9 Figure 2: Prior American River Watershed Study Reports Figure 3: FRM Improvements Authorized Under the American River Watershed Study Figure 4: Content of Chapters Figure 5: Main Economic Impact Areas (Basins) Figure 6: Sub-EIAs in the ARS and ARN Basins Figure 7: General Location of Eight Index Points Used in the Economic Analysis List of Tables Table 1: Timeline of Key Events and Reports... 5 Table 2: Sources of Flooding by Basin... 8 Table 3: Benefits, Costs, and Project Performance of 2007 PAC Recommended Plan Table 4: Net Benefit and Benefit-to-Cost Analyses from ERR Table 5: Number of Structures by Category and Basin in Impact Areas Delineated in 2008 ERR Table 6: Value of Damageable Property (Structures) by Category and Basin in 0.2% Floodplain Table 7: Value of Damageable Property (Contents) by Category and Basin in 0.2% Floodplain Table 8: Value of Damageable Property (Structures & Contents) by Category and Basin in 0.2% Floodplain Table 9: Value of Damageable Property (Automobiles) by Category and Basin in 0.2% Floodplain Table 10: Flooding Characteristics by Index Point and Annual Chance Exceedance (ACE) Event Floodplains Under Levee Breach Scenario: ARS Basin Table 11: Flooding Characteristics by Index Point and ACE Event Floodplains Under Levee Breach Scenario: ARN Basin Table 12: Floodplain Characteristics by Index Point and ACE Event Floodplains Under Levee Breach Scenario: Natomas Basin Table 13: Damages by Annual Chance Exceedance Event Table 14: Without-Project EAD by Index Point Table 15: Without-Project EAD by Basin Table 16: Without-Project EAD -- Emergency Costs (ARS B Index Point) Table 17: Without-Project EAD -- Emergency Costs (ARS, ARN, and Natomas Basins) Table 18: Annual Exceedance Probability (AEP) by Index Point -- Without-Project Condition Table 19: Long-Term Risk by Index Point/Basin -- Without-Project Condition Table 20: Assurance by Index Point -- Without-Project Condition Table 21: Method of Benefit Calculation by Basin Table 22: Without-Project EAD and With-Project Residual EAD (ARS A, left bank American River) Table 23: Without-Project EAD and With-Project Residual EAD (ARS F, left bank Sacramento River) Table 24: Without-Project EAD and With-Project Residual EAD (ARN A, right bank American River) Table 25: Without-Project EAD and With-Project Residual EAD (ARN E, right bank Arcade Creek) Table 26: Without-Project EAD and With-Project Residual EAD (NAT D, left bank Natomas Cross Canal) 45 American River Common Features GRR February 2015 Page 3
9 Economics - Appendix E Table 27: Range of Benefits at ARS A (In $1000s, October 2014 Price Level, 50-Year Period of Analysis) 46 Table 28: Range of Benefits at ARS F (In $1,000s, October 2014 Price Level, 50-Year Period of Analysis) 46 Table 29: Range of Benefits at ARN A (In $1,000s, October 2014 Price Level, 50-Year Period of Analysis) Table 30: Range of Benefits at ARN E (In $1,000s, October 2014 Price Level, 50-Year Period of Analysis)46 Table 31: Range of Benefits at NAT D (In $1,000s, October 2014 Price Level, 50-Year Period of Analysis) Table 32: Average Annual Benefits for Alternative 1 (In $1,000s, October 2014 Price Level, 50-Year Period of Analysis) Table 33: Average Annual Benefits for Alternative 2 (In $1,000s, October 2014 Price Level, 50-Year Period of Analysis) Table 34: Annual Benefits Accrued Prior to Base Year (October 2014 Price Level, 50-Year Period of Analysis, $1,000s) Table 35: Equivalent Average Annual Benefits Benefits During Construction (October 2014 Price Level, 50-Year Period of Analysis, 3.375% Discount Rate, $1,000s) Table 36: AEP -- Without-Project and With-Project Conditions Table 37: Long-Term Risk -- Without-Project and With-Project Conditions Table 38: Assurance -- Without-Project and With-Project Conditions Table 39: Alternative 1 -- Costs Table 40: Alternative 2 -- Costs Table 41: Incremental Net Benefit and Benefit-to-Cost Analyses for Alternatives 1 and 2 in ARS Basin (Values in $1,000s, October 2014 Price Level, 50-Year Period of Analysis, 3.375% Discount Rate) Table 42: Incremental Net Benefit and Benefit-to-Cost Analyses for Alternatives 1 and 2 in ARN Basin (Values in $1,000s, October 2014 Price Level, 50-Year Period of Analysis, 3.375% Discount Rate) Table 43: Incremental Net Benefit and Benefit-to-Cost Analyses for Alternatives 1 and 2 in Natomas Basin (Values in $1,000s, October 2014 Price Level, 50-Year Period of Analysis, 3.375% Discount Rate). 53 Table 44: Incremental Net Benefit and BCR Analyses Incorporating Benefits Prior to Base Year for Alternatives 1 and 2 in the ARS Basin (Values in $1,000s, October 2014 Price Level, 50-Year Period of Analysis, 3.375% Discount Rate) Table 45: Incremental Net Benefit and BCR Analyses Incorporating Benefits Prior to Base Year for Alternatives 1 and 2 in the ARN Basin (Values in $1,000s, October 2014 Price Level, 50-Year Period of Analysis, 3.375% Discount Rate) Table 46: Net Benefit and Benefit-to-Cost Analyses by Alternative (Values in $1,000s, October 2014 Price Level, 50-Year Period of Analysis, 3.375% Discount Rate) ATTACHMENT SUPPORTING DATA ATTACHMENT REGIONAL ECONOMIC DEVELOPMENT (RED) & OTHER SOCIAL EFFECTS (OSE) ANALYSES American River Common Features GRR February 2015 Page 4
10 Economics - Appendix E CHAPTER 1 INTRODUCTION 1.1 PURPOSE & SCOPE This Appendix documents the economic analysis performed for the American River Common Features General Reevaluation Report (ARCGF GRR). The main purposes of this report are to: Describe the framework of the economic analysis, including the major assumptions, data, methodologies, and analytical tools used. Describe the flood risk, in terms of probability of flooding and consequence of flooding, associated with the without-project condition, which assumes that three previously authorized projects (1996/1999 Common Features, the Joint Federal Project (JFP), and the Folsom Dam Raise) are in place and functional. Describe the residual flood risk -- the remaining flood risk once a project is built -- associated with each alternative. Summarize the results of the net benefit and benefit-to-cost analyses for each of the final alternatives. Identify the National Economic Development (NED) Plan, which is the alternative that reasonably maximizes net benefits. 1.2 BACKGROUND In February of 1986, major storms in Northern California caused record flows in the American River Watershed. Outflows from Folsom Reservoir, together with high flows in the Sacramento River, caused water levels to rise above the safety margin on levees protecting Sacramento. The effects of the 1986 storms raised concerns over the adequacy of the existing flood control system. These concerns led to a series of study authorizations and investigations into the need for additional flood protection for the Sacramento area. Some of the key milestones and reports in this process, spanning more than 20 years, are listed in Table 1. Table 1: Timeline of Key Events and Reports YEAR KEY EVENT REPORT Severe storms in Northern California raise concerns over level of flood protection in 1986 Sacramento area Continuing Appropriations Act funds American River Watershed Investigation The Sacramento Area Flood Control Agency (SAFCA) is established 1991 American River Watershed (ARW) Investigation Feasibility Report and Environmental Impact Statement/Report (EIS/EIR) recommends levee improvements in portions of Sacramento and detention dam at Auburn 1993 Defense Appropriations Act (DAA) authorized American River Common Features GRR February 2015 Page 5
11 Economics - Appendix E a portion of the Natomas Basin levee improvements proposed in 1991 Feasibility Report and directs USACE to conduct new FRM study Congress defers decision on Auburn Dam, but authorizes more levee improvements common to all candidate plans outlined in SIR; these common features authorized in WRDA 1996; Auburn Dam rejected in late 1996/early 1997 Severe storms in the region once again highlight flood risk in the Sacramento area 1999 WRDA authorizes 1996 SIR s Folsom Modifications Plan (as modified by SAFCA) and directs USACE to conduct additional FRM studies Energy and Water Development Appropriations Act (2004) authorizes 7-foot dam raise at Folsom Dam Energy and Water Development Appropriations Act (2006) directs the USACE and Bureau of Reclamation to collaborate on FRM planning (USACE mission) and dam safety (Bureau mission) efforts related to Folsom Dam In the aftermath of 2005 Gulf Coast hurricane (Katrina), the limitations of the FRM system in the Sacramento area and the need to improve this system gain increased public attention ARW, Supplemental Information Report (SIR) and EIS/R identifies 3 plans to reduce flood risk: Folsom Dam Modifications, Stepped Release Plan, Auburn Dam Plan (NED Plan) SAFCA releases Folsom Dam Modifications Report New Outlets Plan; report presents alternatives to lower spillway under 1996 SIR s Folsom Dam Modifications Plan Common Features (CF) Limited Reevaluation Report (LRR) identifies improvements to reduce flood risk to Lower American River area; Section 366 of WRDA 1999 further modifies 1996 WRDA in regard to CF specific direction is given related to levee modifications that would allow increase outflows from Folsom Dam to a sustained 160,000 cfs without high likelihood of levee failure along Lower American River ARW Long-Term Study and EIS/R recommend raising Folsom Dam by 7 Folsom Dam Modification Project LRR and Environmental Assessment (EA)/EIS reconcile conflicts between authorized Folsom Modification Project and 2002 Long-Term Study Feasibility Report recommendations Folsom Modification and Dam Raise Project, Post-Authorization Change (PAC) Report describes recommended changes to 2 authorized projects (Folsom Modification and Folsom Dam Raise Projects), and evaluates Joint Federal Project (JFP), which addresses both FRM and dam safety objectives American River Common Features GRR February 2015 Page 6
12 Economics - Appendix E Start of American River Common Features (ARCF) GRR F3 without-project condition milestone conference is held in Sacramento, CA; following conference, decision made to evaluate potential FRM alternatives in Natomas Basin on accelerated schedule and separately from other basins Continuation of ARCF GRR efforts from 2009 Folsom Modification and Dam Raise Projects, Economic Reevaluation Report (ERR) describes potential FRM alternatives at Folsom Dam; analysis revised 2007 PAC Report by updating economic inventory, economic models, and evaluating Regional Economic Development (RED) and Other Social Effects (OSE) accounts Natomas Basin PAC and Interim GRR approved and sent to Congress; recommends improving existing levees surrounding the basin, but defers levee raise analysis to full GRR 1.3 STUDY AREA AND BASINS The American River Watershed drains about 2,100 square miles northeast of Sacramento and includes portions of Placer, El Dorado, and Sacramento counties. Runoff from this basin flows through Folsom Reservoir and passes through Sacramento within a system of levees. Folsom Dam and Reservoir, located on the American River about 25 miles east of the city of Sacramento, form a multi-purpose water project. The project was constructed by the U.S. Army Corps of Engineers (USACE) and is operated by the U.S. Department of the Interior, Bureau of Reclamation (Reclamation) as part of the Central Valley Project (CVP). The reservoir has a normal full-pool storage capacity of 975,000 acre-feet with a minimum seasonally designated flood control storage space of 400,000 acre-feet. Within the watershed, the study area includes three distinct areas: Natomas Basin, which lies to the north of downtown Sacramento American River North area (hereafter referred to as ARN), which lies east of the Natomas Basin and north of the American River American River South area (hereafter referred to as ARS), which lies east of the Sacramento River and south of the American River. Each area is at risk of flooding from multiple sources. Table 2 below lists these sources; Figure 1 below displays these sources on a map of the study area. American River Common Features GRR February 2015 Page 7
13 Economics - Appendix E Table 2: Sources of Flooding by Basin BASIN Natomas (NAT) American River North (ARN) American River South (ARS) SOURCES OF FLOODING Sacramento River Natomas Cross Canal (NCC) Natomas East Main Drainage Canal (NEMDC) Pleasant Grove Creek Canal (PGCC) American River American River Natomas East Main Drainage Canal (NEMDC) Pleasant Grove Creek Canal (PGCC) Dry Creek Robla Creek Magpie Creek Arden Creek American River Sacramento River American River Common Features GRR February 2015 Page 8
 American River Capitol Building/city of Sacramento AMERICAN RIVER SOUTH (ARS) Common Features GRR Floodplains 1 Figure 1: Study Area, Basins, and Major")
14 Economics - Appendix E Natomas Cross Canal (NCC) American River Common Features Study Area N Pleasant Grove Creek Canal (PGCC) Folsom Lake NATOMAS BASIN (NAT) Natomas East Main Drainage Canal (NEMDC) Sacramento River AMERICAN RIVER NORTH (ARN) American River Capitol Building/city of Sacramento AMERICAN RIVER SOUTH (ARS) Common Features GRR Floodplains 1 Figure 1: Study Area, Basins, and Major Sources of Flooding 1.4 ECONOMIC ANALYSIS IN PRIOR REPORTS Prior reports associated with the American River Watershed Study are listed in Figure 2 below. These reports serve as an historic timeline for which to better understand the basis for the economic analysis contained in this GRR. For each study listed, a brief description is given of the conclusions of the economic analysis; additionally, any parts (e.g., assumptions, data, models, etc.) of one analysis that were carried forward to subsequent analyses are also described. American River Common Features GRR February 2015 Page 9
15 Economics - Appendix E 1991: American River Watershed (ARW) Investigation Feasibility Report 1996: ARW Supplemental Information Report (SIR) 2001: ARW Common Features Limited Reevaluation Report (LRR) 2002: ARW Long- Term Study 2009: ARW Common Features General Reevaluation Report (GRR) 2008: ARW Economic Reevaluation Report (ERR) 2007: ARW Post- Authorization Change (PAC) Report 2003: ARW Folsom Modifications Limited Reevaluation Report (LRR) 2010: ARW Common Features Natomas Basin PAC and Interim GRR 2012: ARW Common Features GRR American River Watershed Timeline of Reports Figure 2: Prior American River Watershed Study Reports American River Watershed Investigation Feasibility Report, 1991 This report recommended a detention dam at Auburn, which ultimately was not authorized by Congress. It was estimated that a detention dam at Auburn would have reduced Sacramento s flood risk to about a 1 in 200 chance in any given year based on non-risk analysis methodologies. 1 Following this report, two of many incremental projects, including the Sacramento Area Flood Control Agency (SAFCA) North Area Levee Improvement Project (NLIP) in Natomas and the reoperation of Folsom Dam from 400,000 acre-feet fixed flood control space to a 400,000/670,000 acre-feet variable flood control space, were adopted to help reduce flood risk to Sacramento. For the 1991 economic analysis, long-duration non-residential structural depth-percent damage curves were developed; these curves were used to modify the Federal Emergency Management Agency (FEMA) curves for the 2008 ERR, and were then applied to those areas prone to deep and long-duration flooding. These adjusted FEMA curves were carried forward to the 2010 Natomas PAC and Interim GRR, as well as to this current GRR effort. Much of the other engineering and economic data developed for the 1991 Feasibility Report has been replaced by more current data. 1 Risk analysis methodologies were not implemented at the USACE until after the completion of the 1991 Feasibility Report. American River Common Features GRR February 2015 Page 10
16 Economics - Appendix E American River Watershed Supplemental Information Report, 1996 This report was the first American River Watershed report to use a risk analysis methodology to determine economic benefits. The report identified three final alternatives: the Stepped Release, the Folsom Modifications, and the Detention Dam plans. While the Detention Dam was determined to be the National Economic Development (NED) Plan, it was not recommended in the Chief s report and therefore not authorized. Instead, a less controversial Common Features alternative was authorized. A benefit of this alternative, which included features that were part of all three final alternatives, was that it would not preclude future selection of any of the three final alternatives. American River Watershed Common Features LRR, 2001 The 2001 Common Features LRR estimated that, with levee improvements in place, outflows from Folsom Dam could be increased to 160,000 cubic feet per second (cfs) for a sustained period of time without introducing a high probability of levee failure along the American River. Annual exceedance probability (AEP) on the Lower American River was estimated to be , or about a 1 in 100 chance. Annual flood risk management (FRM) benefits of approximately $19 million and annual FRM costs of $10 million resulted in a benefit-to-cost ratio (BCR) of 1.9. The 2001 LRR split Common Features into the Lower American River levee improvements and the Natomas Basin area. The Natomas Basin area required significant reformulation and development of a GRR, which subsequently was included as part of the 2008 Common Features GRR, the 2010 Natomas Basin Post-Authorization Change Interim & General Reevaluation Report, and finally this current effort for the Common Features GRR. Additionally, levee performance assumptions documented in the 2001 LRR served as the basis for subsequent reports, including the 2007 PAC and the 2008 ERR; however, differences in the economics, hydrology, hydraulics, and geotechnical inputs preclude a direct comparison of damages, benefits, and project performance between the 2001 LRR and the 2007 PAC, 2008 ERR, and this current GRR. American River Watershed Long-Term Study, 2002 The purpose of the Long-Term Study was to address the residual flood risk remaining once the Folsom Modifications project was completed. The Long-Term Study evaluated an array of FRM alternatives that included dam raises ranging from 3.5 to 12 feet. The study determined that a 7-foot raise of Folsom Dam that provided both additional FRM and dam safety 2 would be the most optimal economic solution, exclusive of the Detention Dam alternative. Congress, through the Energy and Water Development Appropriations Act for fiscal year 2004, authorized several project features which were recommended by the Long-Term Study: raising Folsom Dam by 7 feet, modifying the L.L. Anderson Dam spillway, constructing a permanent bridge downstream from Folsom Dam, and modifying the emergency release operations to permit surcharge. First costs for this project were estimated at around $249 million, with $128 2 Dam safety in this instance refers to enabling the dam facility to pass one-hundred percent of the probable maximum flood, or PMF. American River Common Features GRR February 2015 Page 11
17 Economics - Appendix E million allocated to FRM. Annual FRM benefits of $19 million and annual FRM costs of $10 million provided a BCR of 1.9 to 1. At the time, this project was estimated to reduce the risk of flooding to a annual exceedance probability (AEP) 3, or about a 1 in 175 chance. Two project components of the 2002 Long-Term Study, the 3.5-foot dam raise and the 7.0-foot dam raise, were also evaluated in the 2007 PAC and 2008 ERR. The 2007 PAC recommended an alternative that included a 3.5-foot dam raise component, and the 2008 ERR confirmed this recommendation as the most optimal amongst the alternatives evaluated. Section 1.5 describes in greater detail the projects previously authorized and either have been or will be constructed. American River Watershed Folsom Modifications LRR, 2003 The 2003 LRR reconciled conflicts between the authorized Folsom Modifications Project elements and recommendations in the 2002 Long-Term Study. As directed by Congress in WRDA 1999, the plan identified in the 2002 Long-Term Study included raising Folsom Dam, modifying downstream levee improvements, and implementing other elements necessary to meet current Federal dam safety standards. These authorized features, which make up the Folsom Dam Raise Project, carry design implications for the previously authorized Folsom Modifications Project. The 2003 LRR refined the elements related to increasing release capacity to be consistent with gate modifications in the 2002 Long-Term Study. These changes included constructing two new upper-tier outlets, enlarging the four existing upper-tier outlets to 9 feet 4 inches by 14 feet and the four existing lower-tier outlets to 9 feet 4 inches by 12 feet, and modifying the existing main spillway stilling basin. In addition, for the surcharge storage aspect of the project, the three emergency spillway tainter gates would be replaced with larger gates, as authorized, but the design would permit expansion of these gates in the future should the Folsom Dam Raise Project be authorized (which it has been) and implemented. The Folsom Modifications revised economics report (November 2003) identified the recommended project as new and enlarged existing outlets capable of releases of 115,000 cfs and improvements allowing for the use of surcharge storage up to Elevation 474 feet. First costs for this project were estimated at around $214 million with annual benefits of $32 million and annual costs of $16 million providing a benefit-to-cost ratio of 2.0 to 1. At the time this project was estimated to reduce the risk of flooding to a annual exceedance probability, or about a 1 in 140 chance. During the construction proposal process, the cost estimates exceeded the fully funded authorized costs (Section 902 limit). Consequently, dam operations and performance and alternate structural methods to achieve the risk reduction provided by the outlet modifications were reexamined. Subsequent studies also found that modification of the two outboard lower-tier outlets was infeasible, and offered only a marginal increase in performance. 3 In the Long-Term Study, advanced forecast releases were evaluated as part of the alternatives. With advance releases factored in, project performance (as measured by AEP -- the probability flooding will occur in any given year considering the full range of possible annual floods), improved to Advance releases were not considered in the 2007 PAC, 2008 ERR, or in this current GRR effort. American River Common Features GRR February 2015 Page 12
18 Economics - Appendix E The alternatives evaluated in the 2008 ERR included construction measures (eight of the total 10 outlets described) included in the 2003 LRR. American River Watershed PAC Report, 2007 The purpose of the PAC report was to document changes to two authorized projects: the Folsom Modifications Project and the Folsom Dam Raise Project. Both projects share an objective of improving flood risk management on the Lower American River, primarily through structural modifications to the existing Folsom Dam. In the PAC report, project elements from both the Folsom Modifications and the Long-Term Study were considered not only for the purpose of flood risk management but also for dam safety. During the design refinements for Folsom Modifications, it was believed that due to significant increases in the cost estimates that the authorized project may not be optimal or even economically feasible. During this preliminary analysis, it appeared that adding operational gates to the proposed Bureau of Reclamation dam safety auxiliary spillway may provide a more efficient way to meet two project purposes. The Folsom Dam Joint Federal Project was intended to meet the goals of the Corps of Engineers as well as the Bureau of Reclamation; its analysis became one of the main focuses of the PAC. As mentioned, the PAC economic analysis included elements of three authorizations, the Folsom Modifications, the Dam Raise, and Reclamation s dam safety project. The combined project s objectives in terms of economic outputs and project performance were: (1) Reduce flood damages as effectively and efficiently as possible within a limited schedule and without complete reformulation, (2) effectively pass the 200-year design flow event without levee failure (based on design non-risk-based criteria), and (3) pass the PMF without placing the dam structure in danger of failure. The PAC and follow-on ERR evaluated a final array of four action alternatives. Alternative C, as described below, was the recommended plan from both studies. Alternative C included six submerged tainter gate auxiliary spillway, 3.5-foot dam raise, and three emergency spillway gate replacements. The recommended plan is summarized in Table 3 below. American River Common Features GRR February 2015 Page 13
19 Economics - Appendix E Table 3: Benefits, Costs, and Project Performance of 2007 PAC Recommended Plan SUMMARY CRITERIA RECOMMENDED PLAN Performance: Passes PMF Annual exceedance probability (AEP) Design flood event (non-risk-based criteria) Yes in 240 Costs and benefits: First costs (FRM only) Annual costs (FRM only) Annual benefits (FRM only) Net benefits (FRM only) Benefit-to-cost ratio (BCR) Residual damages Percent damage reduction $788 million $40 million $107.1 million $67.1 million 2.7 $91.1 million 54% Notes: 1) Values in October 2006 prices 2) FRM = flood risk management American River Watershed ERR, 2008 The main purpose of the ERR was to affirm that the recommended plan from the PAC was economically feasible and was the most efficient among the array of alternatives considered. The focus of the ERR was to update the economics and the HEC-FDA modeling (including the hydrologic and hydraulic data) from previous analyses to develop a more accurate, comprehensive, and system-wide characterization of flood risk for the study area. This update included evaluation of the National Economic Development (NED), Regional Economic Development (RED), and Other Social Effects (OSE) accounts, development of a new structure inventory, re-estimation of structure and content values using data collected through extensive fieldwork and an expert-opinion elicitation panel, and a re-computation of damages and benefits using new, locality-specific non-residential content depth-percent damage curves, seven event-based floodplains (instead of only one as in previous analyses), and more defined consequence areas. The ERR estimated that total without-project expected annual damages (EAD) was approximately $277 million, not including the Natomas Basin. The with-project residual damages and benefits were estimated for the same four action alternatives that were evaluated in the 2007 PAC. The results of this alternatives analysis are presented below in Table 4. American River Common Features GRR February 2015 Page 14
20 Economics - Appendix E Table 4: Net Benefit and Benefit-to-Cost Analyses from ERR ITEM ALT A ALT B ALT C ALT D Total Project First Costs , ,555.6 Annual Benefits ( ) Annual Benefits During Construction ( ) Total Annual Flood Risk Management Benefits Annual Costs Savings in Avoided Dam Safety Costs 0 (15.3) (15.3) (15.3) Net Flood Risk Management Annual Costs Net Benefits Benefit-to-Cost Ratio Notes: 1) Values in millions, October 2007 prices, 50-year period of analysis, 4.875% discount rate 2) Alternative A includes eight main dam outlets and fuse plug spillway; Alternative B includes a six submerged tainter gate auxiliary spillway; Alternative C includes a six submerged tainter gate auxiliary spillway, a 3.5-foot dam raise, and three emergency spillway gate replacements; Alternative D includes a six submerged tainter gate auxiliary spillway, a 7-foot dam raise, and eight emergency and service spillway gate replacements 3) Alternatives B, C, and D would eliminate the need for construction of the dam safety only fuse plug as part of the future without-project condition; the $15.3 million reduction in dam safety costs was taken as a savings from the net flood risk management annual costs. The ERR confirmed the 2007 PAC recommendation of Alternative C which included a six submerged tainter gate auxiliary spillway, a 3.5-foot dam raise, and three emergency spillway gate replacements. Total annual FRM benefits of Alternative C were estimated at $173.7 million, of which $29.9 million was attributed to benefits during construction. Residual expected annual damages of Alternative C were estimated to be approximately $133 million (American River North and South Basins). American River Watershed Common Features F3 GRR, 2009 Key data used in the ERR were carried forward to the 2009 GRR, including the extensive structure inventory and the non-residential content valuations/depth-percent damage curves. Other data were updated for the GRR, including the number of sources of flooding (American River, Sacramento River, Natomas Cross Canal, Pleasant Grove Creek Canal, Natomas East Main Drainage Canal) used to estimate flood risk, the consequence areas considered (Natomas was included where it was not in the ERR), the levee fragility curves (geotechnical), the Folsom Dam routings (hydrology), and the rating curves/floodplains (hydraulics). In the economic analysis for the 2009 GRR, EAD for the future without-project condition (Authorized Common Features + Joint Federal Project + Folsom Dam Raise) for the ARN, ARS, and Natomas Basins were estimated to be approximately $27.7 million, $132.5 million, and $2.4 billion, respectively. Project performance in terms of annual exceedance probability (AEP) for each area was estimated to be approximately (ARN), (ARS), and (Natomas). In March of 2009, an F3 (without-project condition) milestone conference was held at the Sacramento District office. Based on the outcomes of this conference, the path forward was determined to be to study the Natomas Basin area separately from the rest of the study area (ARS and ARN) via a Natomas Basin Post-Authorization Change & Interim GRR. American River Watershed Natomas Basin PAC Interim GRR, 2010 American River Common Features GRR February 2015 Page 15
21 Economics - Appendix E Soon after the March 2009 F3 milestone conference, the American River Common Features project delivery team (PDT) was charged with studying the Natomas Basin as a separate entity from the rest of the Common Features GRR study area, recommending an alternative(s) for the Natomas Basin via a Post-Authorization Change & Interim GRR, and completing this report within a highly accelerated schedule. This report was in fact completed in December 2010, approximately 20 months following the initial charge, and subsequently was approved by the Civil Works Review Board, signed by the Chief of Engineers, sent to the Office of Management and Budget (OMB), and submitted to Congress. Congress authorized the project in The Natomas Basin PAC & Interim GRR focused on improving the existing levees (either in place or via adjacent levees) surrounding the Basin along all five waterways, including the Sacramento River, American River, Natomas East Main Drainage Canal (NEMDC), Pleasant Grove Creek Canal (PGCC), and the Natomas Cross Canal (NCC); analysis of levee raises were deferred to the GRR. However, the Natomas Basin has since been removed from the GRR alternatives. The Natomas PAC Interim GRR recommended improving the levees along all waterways surrounding the Natomas Basin. It was estimated that the Recommended Plan would reduce without-project EAD by about 96%, or from approximately $462 million in EAD to approximately $19 million in EAD, producing average annual benefits of approximately $443 million. The project cost was estimated to be approximately $67.8 million (average annual). Net benefits and the BCR were estimated to be approximately $375.2 million (average annual) and 6.5, respectively. Once completed, the improvements were expected to reduce the probability of flooding in any given year from about a 1 in 5 chance to about a 1 in 67 chance. 1.5 SUMMARY OF PREVIOUSLY-AUTHORIZED FLOOD RISK MANAGEMENT IMPROVEMENTS ALREADY CONSTRUCTED OR CURRENTLY UNDER CONSTRUCTION Three major American River Watershed projects have been previously authorized by Congress as outlined above. These include the 1996/1999 Authorized Common Features Project, the Joint Federal Project (JFP), and the 3.5-foot Folsom Dam Raise Project. Figure 3 below lays out these improvements, starting with no improvements in place and leading up to the 3.5 foot Folsom Dam Raise (rectangles); the large oval represents the alternatives that were considered for this current GRR effort. It is important to point out that while these projects have been authorized and/or implemented in an incremental nature, these improvements are interdependent and rely on one another to fully maximize risk reduction from a system-wide perspective. American River Common Features GRR February 2015 Page 16

22 Economics - Appendix E Figure 3: FRM Improvements Authorized Under the American River Watershed Study 1.6 FUTURE WITHOUT-PROJECT CONDITION For this current GRR effort, the future without-project condition assumes that the previously authorized 1996/1999 Common Features improvements, JFP, and Folsom Dam Raise are in place and functional by the year This without-project condition is represented by the top rectangle in Figure 3. System-wide risk reduction was estimated by comparing the economic outputs of each alternative evaluated (represented by the large oval in Figure 3) against the future without-project condition. 1.7 ORGANIZATION & CONTENT This report is organized around four main chapters. The contents of each chapter are summarized in Figure 4 below. American River Common Features GRR February 2015 Page 17


23 Economics - Appendix E Figure 4: Content of Chapters American River Common Features GRR February 2015 Page 18
24 Economics - Appendix E CHAPTER 2 FRAMEWORK OF ECONOMIC ANALYSIS 2.1 CONSISTENCY WITH CURRENT REGULATIONS & POLICIES The analysis presented in this document was performed using the most up-to-date guidance and is consistent with current regulations and policies. Various references were used to guide the economic analysis, including: The Planning Guidance Notebook (ER , April 2000, with emphasis on Appendix D, Economic and Social Considerations, Amendment No. 1, June 2004) serves as the primary source for evaluation methods of flood risk management (FRM) studies EM , Engineering and Design Risk-Based Analysis for Flood Damage Reduction Studies (August 1996) ER , Planning Risk-Based Analysis for Flood Damage Reduction Studies (Revised January 2006) Economic Guidance Memorandum (EGM) 01-03, Generic Depth-Damage Relationships (2000) Economic Guidance Memorandum (EGM) 04-01, Generic Depth-Damage Relationships for Residential Structures with Basements (2003) Economic Guidance Memorandum (EGM) 09-04, Generic Depth-Damage Relationships for Vehicles (2009) 2.2 PRICE LEVEL, PERIOD OF ANALYSIS, AND DISCOUNT RATE Values listed in this document are based on an October 2014 price level. Annualized benefits and costs were computed using a 50-year period of analysis and a current federal discount rate of 3.375%. Unless otherwise noted, annualized values are presented in thousands of dollars. 2.3 MAIN ASSUMPTIONS Several main assumptions were relied upon in order to reasonably and efficiently study the problem (i.e., flooding) and its solutions (i.e., flood risk management alternatives), and then ultimately reach a conclusion using the limited resources available: The without-project condition assumes that the 1996/1999 Authorized Common Features improvements, Joint Federal Project, and Folsom Dam Raise are in place and functional; this assumption is reflected in the hydrologic (transform flow), hydraulic (floodplains and rating curves) and geotechnical (levee fragility curves) engineering data used in the economic analysis The future without-project operations at Folsom Dam assume a target release of 160,000 cubic feet per second (cfs) for the 200-year event; this assumption is reflected in the hydrologic transform flow curves used for the without-project condition The with-project operations at Folsom Dam assume a target release of 160,000 cfs for the 200- year event; this assumption is reflected in the hydrologic transform flow curve used for the with-project condition All areas except the Natomas Basin assume build-out and no future development American River Common Features GRR February 2015 Page 19
25 Economics - Appendix E For the Natomas Basin, additional development was accounted for but only to describe the residual risk associated with a project; no benefits were claimed for future development. (A discussion on residual risk in the Natomas Basin can be found in the Economic Appendix for the Natomas Post-Authorization Change & Interim GRR.) That the hydrologic, hydraulic, and geotechnical conditions within the study area would remain the same between the without-project and the most likely future without-project conditions. Most likely future (without-project) hydrologic, hydraulics, and geotechnical engineering data for input into the economic modeling were assumed to be the same as the base without-project condition That damages resulting from out flanking from the non-leveed portions of the American River upstream of existing levees would not be reduced even with a project in place; this assumption was factored into the estimation of benefits for the ARS and ARN basins. 2.4 METHODOLOGIES, TECHNIQUES, & ANALYTICAL TOOLS Various methodologies, analytical techniques, and tools were used to perform the economic analysis. The majority of those used for this analysis is standard to many Corps of Engineers studies and are described in the appropriate sections throughout this document. Several of the main ones used in this analysis are described below Economic Analytical Tool: HEC-FDA Software The main analytical tool used to perform the economic analysis was the Hydrologic Engineering Center s Flood Damage Analysis (HEC-FDA) software, version 1.2.5a. This program stores the engineering data (hydrologic, hydraulic, and geotechnical) and the economic data (structure/content inventory and depth-percent damage curves), and is used to model the flooding problem and potential alternative solutions in the study area. By relating the economic inventory data to the floodplain data, the HEC-FDA software computes economic stage-damage curves. Through integration of the main engineering relationships (exceedance probability-discharge curves, rating curves, and geotechnical levee fragility curves) and the main economic relationship (stage-damage curves), the HEC-FDA software computes project performance statistics and expected annual damages/benefits. The results of the economic modeling are then used as input into the net benefit and benefit-to-cost analyses and may also aid in plan formulation, all of which are performed external to the HEC-FDA software Floodplain Data in HEC-FDA Using FLO-2D Model Output The SPK Hydraulic Design Section developed floodplains using the FLO-2D model, which produces interior water surface elevations by grid cell. The model generates suites of FLO-2D floodplains {0.5 (1/2), 0.1 (1/10), 0.04 (1/25), 0.02 (1/50), 0.01 (1/100), (1/200), and (1/500) annual chance exceedance events}; suites were developed for each index point. (See Section 2.6 for discussion of representative index points). American River Common Features GRR February 2015 Page 20
26 Economics - Appendix E Importing the FLO-2D data into the HEC-FDA models required file formatting. The FLO-2D files were formatted so that the HEC-FDA program would import them as a HEC-RAS water surface profile (WSP) output file. Instead of using river station numbers like in a typical HEC-RAS WSP, assignment of water surface elevations by frequency event were completed using grid cell numbers (output of FLO-2D); the grid cell assignments represent actual floodplain water surface elevations by frequency event rather than in-channel water surface elevations Computing Stage-Damage Curves in HEC-FDA The formatted WSPs included every grid cell that contained a structure and the water surface elevations in each grid cell for each frequency event. The suite of floodplains along with the imported structure inventory was used in HEC FDA to compute stage damage curves. Once the formatted floodplain data were imported into HEC FDA, a row was inserted at the top of the WSP which included the in channel stages associated with the index point (for a particular impact area). This step allowed for the linkage between the two dimensional floodplain data and the in channel stages. Importing formatted floodplain data and assigning water surface elevations to grid cells eliminated the need for creating interior exterior relationships, which is another way to link exterior (river) stages to interior (floodplain) stages within HEC FDA Multiple-Source Flooding into Single Consequence Area Multiple sources of flooding within a single consequence area complicate the economic risk analysis in terms of estimating the chance of flooding and the consequences of flooding in that consequence area. Additional analytical complexity is introduced if one considers that the probability of flooding along a particular flooding source also varies (i.e., not only is the probability of flooding between various water sources not uniform but the probability of flooding along a specific water source is also not uniform), and that the same area is flooded from levee breaches at different locations but at varying magnitudes (i.e., different floodplains) depending on the location of the breach. The risk analysis was performed using eight representative index points, with each point tied to a specific source of flooding within the study area. The same index points were used for both the withoutproject and with-project analysis. Section 2.6 below describes in more detail the index points used and their locations. 2.5 ECONOMIC IMPACT AREAS (EIA) Economic impact areas (EIA) were delineated in order to facilitate the economic risk analysis. These areas enable the direct computation and reporting of consequences that result from flooding from a specific source under both the without-project and with-project conditions. Three main EIAs within the study area were identified: American River North Basin (ARN) American River South Basin (ARS) Natomas Basin (NAT) American River Common Features GRR February 2015 Page 21
27 Economics - Appendix E During the 2007 PAC/2008 ERR, sub-eias within two of the main EIAs (ARN and ARS) were identified in order to more precisely analyze residual risk. These impact areas are presented below but were not carried forward to this analysis. Figures 5 and 6 display the three main EIAs (NAT, ARN, ARS) and the sub-eias within the ARN and ARS Basins. It should also be noted that the boundaries of the EIAs presented in Figure 6 do not correspond to any particular ACE event flood plain used in the current analysis. ARS: ARS 1 Pocket/Greenhaven ARS 2 Fruitridge/Meadowview ARS 3 Land Park ARS 4 Downtown Sacramento ARS 5 East Sacramento ARS 6 Rancho Cordova ARS 7 Gold River ARS 8 South I-50/Florin/Watt ARS 9 Florin South ARS 10 Mather North ARS 11 Rosemont ARS 17 South of Morrison Creek ARN: ARN 13 American River Drive ARN 14 Arden/Expo ARN 15 North Sacramento ARN 16 Dry Creek American River Common Features GRR February 2015 Page 22
 American River Common Features GRR February 2015 Page")
28 Economics - Appendix E Figure 5: Main Economic Impact Areas (Basins) American River Common Features GRR February 2015 Page 23
 explained that each basin/eia may be at risk of flooding from multiple sources. For example, the ARS Basin could be flooded from either the American or Sacramento Rivers.")
29 Economics - Appendix E Figure 6: Sub-EIAs in the ARS and ARN Basins 2.6 HYDRAULIC REACHES & REPRESENTATIVE INDEX POINTS Chapter 1 (Section 1.3) explained that each basin/eia may be at risk of flooding from multiple sources. For example, the ARS Basin could be flooded from either the American or Sacramento Rivers. Additionally, along each source of flooding, the condition of the levee could vary from one location (hydraulic reach) to the next, with the probability of flooding from a particular reach varying correspondingly. In terms of economic analysis, levee reaches are used to focus-in on those areas deemed most pertinent for developing engineering data, which feed into the economic modeling. Data are generated at representative index points within each reach and are used to estimate project performance statistics under both without-project and with-project conditions. The engineering data is also used in conjunction with economic data to estimate expected damages and benefits. Both sets of results are then used together to describe the flood risk in the study area. Twenty-five hydraulic reaches were originally identified based on extensive geotechnical analyses of the levee conditions along each source of flooding within the study area. From these 25 reaches, the project delivery team (PDT) selected five of them, each containing one index point, for which to generate engineering data for use in the economic modeling and the associated without-project damage and with-project benefit analyses. The PDT also selected three additional index points -- two located on the right and left banks of the American River and one located on the NEMDC/PGCC (also known as the Sankey Gap) at locations where there are no levees. These index points were not part of the original 25, but were included in order to aid in a more accurate description of residual flood risk in the study area. Finally, a sixth index point (ARS B) was also used in the economic analysis but only to estimate damages American River Common Features GRR February 2015 Page 24
30 Economics - Appendix E associated with emergency cost losses. The index points used in the economic analysis, by basin, are shown in Figure 7 and listed below. ARS: ARS B, American River, RM 3.94, left bank (used only to estimate damages related to emergency cost losses see Section 2.7.4) ARS A, American River, RM 9.0, left bank Flanking location on American River, RM 14.5, left bank ARS F, Sacramento River, RM 50.25, left bank ARN: ARN A, American River, RM 7.82, right bank Flanking location on American River, RM 13.21, right bank ARN E, Arcade Creek, RM.88, right bank NAT: NAT D, Natomas Cross Canal, RM 4.3, left bank Sankey Gap on the NEMDC/PGCC American River Common Features GRR February 2015 Page 25

31 Economics - Appendix E Figure 7: General Location of Eight Index Points Used in the Economic Analysis 2.7 DESCRIPTION OF ECONOMIC DATA & UNCERTAINTIES The economic data used in the analysis are described in the following sub-sections. These data lay the groundwork for the without-project damage and with-project benefit analyses that are described in Chapters 3 and 4, respectively Structure Inventory An extensive, comprehensive structure inventory of the study area was performed for the 2008 American River Watershed Folsom Dam Modification and Folsom Dam Raise Economic Reevaluation Report (ERR). The 2008 ERR inventory was carried forward to this analysis with limited updating for price level (all basins) and foundation heights (Natomas Basin). Structure data was collected using standard USACE practices. For the ERR, a base geographic information system (GIS) inventory with parcel attribute data for both Sacramento and Sutter counties American River Common Features GRR February 2015 Page 26
32 Economics - Appendix E was provided by the non-federal partner. Numerous field visits were taken to collect the base inventory data, including number of stories, foundation heights, building use (residential, commercial, industrial, public), occupancy types (more specific building use, such as commercial restaurant or single-family residential), class (per Marshall & Swift Valuation Service s grades of construction), construction rating (per Marshall & Swift s categories of low cost to excellent construction), and condition ( poor to new condition), which was used to estimate depreciation. The data collected for the ERR produced a structure inventory encompassing an area larger than the current 0.2% (1/500) annual chance exceedance (ACE) floodplain for the ARS and ARN basins. Structure counts for the four main building categories are listed in Table 5 below, and represent only those structures falling within the 0.2% (1/500) ACE floodplain. Table 5: Number of Structures by Category and Basin in Impact Areas Delineated in 2008 ERR STRUCTURE COUNT CATEGORY ARS BASIN ARN BASIN NATOMAS BASIN TOTAL COMMERCIAL 3, ,286 INDUSTRIAL 1, ,406 PUBLIC ,052 RESIDENTIAL 104,535 15,974 22, ,756 TOTAL 109,605 17,135 22, , Structure and Content Values Structure attribute data collected during field visits and obtained from the non-federal partner were used to determine valuation of structures and contents Structure Values For all residential structures classified as single-family residential (SFR), Sacramento County provided detailed information regarding square footage of the buildings. This included total square footage, basement square footage, 2 nd -floor square footage, and garage square footage; this same data was not available for the non-residential and multi-family residential (MFR) categories. For many of the larger buildings and in some of the commercially-dense areas, the county provided GIS data that included digitized building footprints. The GIS data was used to identify each structure s square footage. For those buildings not included in the GIS data, high-resolution aerial photographs were used in conjunction with GIS to measure the building footprint. In both cases, the measured first floor square footages were used along with the number of damageable floors (limited to no more than three floors) to estimate the maximum possible damageable square footage for structure valuation purposes. Depreciated replacement value of structures were estimated based upon building square footage, estimated cost per square foot (from the Marshall & Swift Valuation Handbook), and estimated depreciation. Values per square foot were based on building use, class, and type as outlined in the Marshall and Swift Valuation Handbook. American River Common Features GRR February 2015 Page 27
33 Economics - Appendix E Content Values For SFR residential structures, depth-percent damage curves developed by the USACE Institute for Water Resources (IWR) and presented in Economic Guidance Memorandum (EGM) and 04-01, were used. Since the percentage damages in these generic depth-percent damage curves were developed as a function of structure value, it was unnecessary to explicitly derive content values for input into the HEC-FDA model; the model computes content damages by applying the percentages in the content-percent damage curves to structure values. For report purposes and to estimate content value for residential structures, a content-to-structure value ratio of 50% was used, which is consistent with the ratio used in prior American River Watershed studies. For non-residential categories, an expert elicitation was performed to develop content values and content depth-percent damage curves for specific occupancy types for the 2008 ERR. The results of that expert elicitation were used for this analysis. The values and curves were developed specifically for structures in the American River Watershed study area. In total, there were 22 different occupancy types with values ranging from $22 to $235 per square foot with uncertainty. Content values for nonresidential structures were generated as a function of building use, damageable square footage, and content value per square footage per occupancy type. Additional information regarding non-residential dollar-per-square foot values and depth-percent damage curves can be found in the 2008 ERR. Tables 6, 7 and 8 show the value of damageable property, by basin, for structures, contents, and combined, respectively. Table 6: Value of Damageable Property (Structures) by Category and Basin in 0.2% Floodplain VALUE OF DAMAGEABLE PROPERTY (IN $1,000S, OCTOBER 2014 PRICE LEVEL): CATEGORY STRUCTURES ARS BASIN ARN BASIN NATOMAS BASIN TOTAL COMMERCIAL 5,245,324 2,219, ,735 8,130,944 INDUSTRIAL 1,671, , ,682 2,544,472 PUBLIC 5,155, , ,049 6,271,462 RESIDENTIAL 17,844,709 3,170,999 4,259,542 25,275,250 TOTAL 29,917,298 6,450,822 5,854,008 42,222,128 Table 7: Value of Damageable Property (Contents) by Category and Basin in 0.2% Floodplain VALUE OF DAMAGEABLE PROPERTY (IN $1,000S, OCTOBER 2014 PRICE LEVEL): CATEGORY CONTENTS ARS BASIN ARN BASIN NATOMAS BASIN TOTAL COMMERCIAL 2,653, , ,247 3,919,302 INDUSTRIAL 1,117, , ,758 1,682,969 PUBLIC 1,308, , ,486 1,779,014 RESIDENTIAL 8,926,817 1,585,499 2,134,367 12,646,683 TOTAL 14,007,087 3,091,023 2,929,857 20,027,968 American River Common Features GRR February 2015 Page 28
34 Economics - Appendix E Table 8: Value of Damageable Property (Structures & Contents) by Category and Basin in 0.2% Floodplain VALUE OF DAMAGEABLE PROPERTY (IN $1,000S, OCTOBER 2014 PRICE LEVEL): CATEGORY STRUCTURES & CONTENTS ARS BASIN ARN BASIN NATOMAS BASIN TOTAL COMMERCIAL 7,899,237 3,205, ,982 12,050,246 INDUSTRIAL 2,789, , ,440 4,227,441 PUBLIC 6,463, , ,535 8,050,476 RESIDENTIAL 26,771,526 4,756,498 6,393,909 37,921,933 TOTAL 43,924,385 9,541,845 8,783,865 62,250, First-Floor Elevation of Structures For structure and content damages, depth of flooding relative to the structure s first floor is the primary factor in determining the magnitude of damages. The current analysis uses HEC-FDA s internal processes for the determination of structural inundation. The process combined a geographic information system (GIS) database containing spatially-referenced polygons for each parcel in the study area with water surface elevations (per grid cell) from the FLO-2D modeling. Parcels/structures were then tied to a specific grid cell in which the parcel was located. A representative ground elevation was assigned to each parcel/structure using GIS. Foundation heights for each structure were estimated during numerous field visits. First-floor elevations were computed in HEC-FDA using the foundation height and ground elevation data. Using the ground elevation and foundation height data from the economic structure inventory in conjunction with the water surface elevation data from the WSP, depths of flooding above the first floor at each structure for each annual chance exceedance event were computed within HEC-FDA. As explained previously, water surface elevations (WSE) from the FLO-2D modeling were provided for each grid cell for the 0.5, 0.1, 0.04, 0.02, 0.01, 0.005, and ACE events and were imported into the HEC- FDA model in the form of a water surface profile Emergency Cost Loss Categories & Descriptions In March of 2009 an expert-opinion elicitation panel comprised of professionals having significant relevant experience in the field of emergency response was convened in Sacramento, California. The main purpose of this expert-opinion elicitation was to develop estimates of economic costs associated with five main loss categories (encompassing 18 sub-categories) not typically quantified in USACE FRM studies. These loss categories are: Debris, which include costs associated with debris removal activities Evacuation, which include costs associated with evacuating the floodplain, subsistence living while waiting for the flood waters to recede, and re-occupation costs once the flood waters have receded Public utilities, which include losses to electric, gas, telecommunication, wastewater treatment, and water supply infrastructure Public services patronized, which include costs associated with educational institutions, public agencies, library and recreation facilities, and medical facilities American River Common Features GRR February 2015 Page 29
35 Economics - Appendix E Public services produced, which include costs associated with police services, fire services, correctional facilities, legislative buildings, and judicial buildings A final draft report entitled, Emergency Cost and Relief Methodology and Concept Paper, was completed in January of This paper lays out in detail the expert-opinion elicitation process as it occurred in March of 2009, the loss categories considered, the general methodology used to evaluate emergency costs and relief associated with flooding, the specific methodologies used to determine flood-related emergency costs associated with each loss category, and the results of the analysis. The information/data obtained from the expert-opinion elicitation were used as input into the various emergency cost loss models, which were developed based on methodologies outlined in the Concept Paper. These models were then used to develop data which could be used to estimate additional without-project damages and with-project benefits. For this analysis, 12 of the 18 loss sub-categories were considered: Debris Evacuation (evacuation, subsistence, re-occupation) Public Utilities (electric, gas, telecommunication, wastewater treatment, water supply) Public services produced (medical) Public services patronized (police, fire) For each loss category, a depth-percent damage curve containing three points was generated from the emergency cost models. These curves were imported into the HEC-FDA model and used to compute damages for the ARS Basin (represented by index point ARS B). The results of this analysis were then extrapolated and applied to the other index points/basins to estimate damages for those areas not analyzed directly. It is important to note that none of the emergency costs models used to generate the output data for use in HEC-FDA has been approved for use by the Planning Center of Expertise (PCX) in San Francisco, CA. The emergency cost analysis and HEC-FDA results presented in this Appendix is intended to make an order of magnitude assessment of emergency cost losses. These losses were not factored into the net benefit/benefit-to-cost ratio (BCR) analysis Automobiles In the 2010 Natomas Post-Authorized Change and Interim Reevaluation Report (NPACR) an average automobile value of $7,988 was obtained from the Bureau of Transportation Statistics. This value was updated for price level ($8,308) and used in this analysis. The number of cars impacted was based on the number of cars per residential unit (1.93), which in turn was based on the total number of automobiles and trucks registered in the Sacramento Area (source: California Department of Finance) divided by the number of households. Automobile counts for car dealerships were based on discussions with local dealers and comparisons with spot inventories from aerial photos. The analysis assumed that, based on relatively short evacuation times, about 50% of residential-based vehicles would be removed from the flood area prior to the event and only 20% would American River Common Features GRR February 2015 Page 30
36 Economics - Appendix E be removed from dealerships. This is consistent with EGM 09-04, which recommends a removal rate of 50.6% for areas where the warning time is less than 6 hours. Table 9 displays the estimated value of automobiles in the 0.2% annual chance exceedance (500-year) floodplain. Table 9: Value of Damageable Property (Automobiles) by Category and Basin in 0.2% Floodplain VALUE OF DAMAGEABLE PROPERTY: AUTOMOBILES (IN $1,000S, OCTOBER 2014 CATEGORY PRICE LEVEL) ARS BASIN ARN BASIN NATOMAS BASIN TOTAL AUTOMOBILES 1,260, , ,905 1,724, Depth-Percent Damage Curves The depth of flooding is the primary factor in determining potential damages to structures, contents, and automobiles. Depth-percent damage functions were used in the HEC-FDA models to estimate the percent of value lost for these categories. Residential depth-damage curves (structures and contents) were taken from Economic Guidance Memorandum (EGM) 01-03, Generic Depth-Damage Relationships, and 04-01, Generic Depth-Damage Relationships for Residential Structure with Basements, for use on both single-family and multi-family residential structures. Structures were identified as 1-story, 2-story, or split-level. Mobile home curves were taken from the May 1997 Final Report, Depth Damage Relationships in Support of Morganza to the Gulf, Louisiana Feasibility Study. Non-residential structure curves were based on revised Federal Emergency Management Agency (FEMA) Flood Insurance Administration (FIA) curves. Two sets were used: 1) standard FEMA FIA curves for impact areas with shorter-duration flooding and 2) adjusted curves for areas where inundation depths are deep and flooding durations are long (exceeding three days); these curves were based on the prior Natomas Basin studies and the 1997 Morganza Study. As previously described in Section , non-residential content depth-percent damage curves for 22 occupancy types were developed based on an expert elicitation; these curves were developed specifically for building types in the Sacramento area and for American River Watershed analyses. Depth-percent damage functions for automobiles were based on averages from curves developed by the Institute for Water Resources (IWR) and provided in EGM 09-04, Generic Depth-Damage Relationships for Vehicles. All of the depth-percent damage curves used in the analysis can be found in the American River Common Features GRR HEC-FDA models Economic Uncertainties The valuation of residential and non-residential structures and contents along with automobile losses were estimated with uncertainty. In the estimation of structure value, three variables were considered to have a possible range of values: 1) dollar per square foot 2) building square footage and 3) percent of estimated depreciation. Using triangular distributions to describe the range of these three variables, a Monte Carlo simulation was run on typical structures by category and the mean and standard deviations were compared to derive coefficients of variation (COV) for structure values by category. Content value American River Common Features GRR February 2015 Page 31
37 Economics - Appendix E uncertainties for non-residential structures were based on data from the expert elicitation mentioned previously. The program Best Fit was used to determine what would be a reasonable distribution, and using the model data, it was determined that a normal distribution best described uncertainty in the structure and content valuation. These uncertainty parameters for valuation were imported into the HEC-FDA program. Several factors contributed to the uncertainty associated with automobile damages. These factors include the average unit value, the number of vehicles per residence/dealership assumed, and the evacuation rate. It was assumed that the average number or automobiles per residential unit was about 2 and the evacuation rate was 50%. An average value of an automobile was determined to be $8,308. While uncertainty in these variables was not considered, uncertainty in the percent damage by depth (as reflected in the depth-percent damage curve) was taken into account. Uncertainty in first floor elevation was also included in the model. During the field inventory, first floor (foundation height) estimates were made by visual inspection and assigned to structures in one half-foot increments. For example, the average SFR built on slab without any fill might be listed as ground elevation foot to 1.0 foot; raised foundations either 1.5, 2 or 2.5 feet. Based on this level of precision, it was assumed that 0.5 foot standard deviation would capture the potential uncertainty in this first floor elevation adjustment. The uncertainty associated with the percent damages at specific depths of flooding for automobiles and structures/contents were entered into the HEC-FDA model. Residential structure and content depthpercent damage curves are normally distributed and include standard deviations of percent damages by depth of flooding. Non-residential content depth-percent damage curves are triangularly distributed and include a minimum, most likely, and maximum percent damage by depth of flooding. All of the value and depth-percent damage uncertainty associated with structures, contents and automobiles can be found in the American River Common Features GRR HEC-FDA models. 2.8 DESCRIPTION OF ENGINEERING DATA & UNCERTAINTIES The following sub-sections briefly describe the engineering data used in the economic analysis. More details about each discipline-specific engineering analysis can be found in the following appendices: Appendix B Hydrology, Appendix C Hydraulics, and Appendix F Geotechnical Hydrologic Engineering Data Used in HEC-FDA The Sacramento District s Water Management Section provided the hydrologic data used in the HEC- FDA modeling. This includes the equivalent record length at each index point, the exceedance probability-discharge curve or the statistics required to compute the exceedance probability-discharge curve in HEC-FDA (depending on the index point), and the transform flow curves for those index points on the American River, where outflow is regulated by operations at Folsom Dam. These data and curves can be found in the Hydrologic Engineering Attachment in the Main Engineering Report or in any of the American River Common Features GRR HEC-FDA models. American River Common Features GRR February 2015 Page 32
38 Economics - Appendix E Hydraulic Engineering Data Used in HEC-FDA The SPK Hydraulic Design Section used the HEC-RAS model to determine stages in the channel, to model levee breakout locations, and to develop breakout hydrographs; it used the FLO-2D model to determine water surface elevations in the floodplain (i.e., develop suites of floodplains). More details about the data and assumptions used by the Hydraulic Design Section for their HEC-RAS and FLO-2D modeling efforts can be found in the Hydraulic Design Attachment to the Main Engineering Report. For this analysis, a suite of floodplains was generated for each of the eight index points. For each index point, the Hydraulic Design Section provided data for input into the HEC-FDA model. These include: Discharge-stage (rating) curves with uncertainty for the without-project and with-project conditions for four index points (those on the American River) Exceedance probability-stage curves with uncertainty for the without-project and with-project conditions for three index points (NAT D, ARS E, and ARN E) Suites of floodplains for each index point; these were formatted from FLO-2D water surface elevation data for direct import into HEC-FDA Geotechnical Engineering Data Used in HEC-FDA A geotechnical levee fragility curve shows the probabilities of failure at different water surface elevations against a levee. Fragility curves are a main component of the economic modeling and in determining the performance of a project, which is often described in terms of annual exceedance probability (AEP) or the chance of flooding in any given year. For this analysis, five sets of geotechnical levee fragility curves were used in the economic analysis, one set for each index point located on a levee reach, with each set including a without-project and withproject curve. (Since there are no levees on the upper portion of the Lower American River or at the Sankey Gap, no fragility curves associated with these three index point locations were developed.) The levee fragility curves used in the economic analysis can be found in the American River Common Features GRR HEC-FDA models. The Geotechnical Engineering Attachment in the Main Engineering Report describes in detail the development of these curves Engineering Uncertainties in HEC-FDA There were three main engineering uncertainties incorporated into the HEC-FDA modeling: Uncertainty in within-channel discharges was computed in HEC-FDA using data provided by the District s Water Management Section. This data was in the form of either an equivalent record length (for graphical curves) or Log Pearson Type III Statistics (for analytical curves). In both cases, the data is entered into HEC-FDA, which uses the data to compute uncertainty in discharge for a range of exceedance probability events. Uncertainty in discharges from Folsom Dam was accounted for in HEC-FDA by using transform flow (regulated versus unregulated) curves containing minimum values and maximum values around the regulated discharges for a range of exceedance probability events. Uncertainty in stages (in-channel) was captured in the hydraulic rating curves, which were entered into HEC-FDA. Stage uncertainty was provided by the District s Hydraulic Design Section. American River Common Features GRR February 2015 Page 33
39 Economics - Appendix E All of the data used to describe the uncertainty in the main engineering relationships can also be found in the Common Features GRR HEC-FDA models or in the respective engineering attachments to the Main Engineering Report. American River Common Features GRR February 2015 Page 34
40 Economics - Appendix E CHAPTER 3 WITHOUT-PROJECT ANALYSIS & RESULTS: AUTHORIZED COMMON FEATURES + JOINT FEDERAL PROJECT + DAM RAISE 3.1 FUTURE WITHOUT-PROJECT CONDITION Expected annual damages (EAD) and engineering project performance results for the without-project condition, which assumes that the WRDA 1996/1999 Authorized Common Features Project, the Joint Federal Project (JFP), and the Folsom Dam Raise Project are in place and operational, are summarized in this chapter. The without-project condition serves as the baseline for which all with-project alternatives are measured against. The with-project alternatives analysis is presented in Chapter FLOODING CHARACTERISTICS The without-project analysis and results are based predominantly on estimates of the flooding extent, the depth of flooding, and the property that may be damaged from flooding within a particular area. Tables 9 to 11 display key characteristics of flooding associated with specific annual chance exceedance events for the three basins within the study area. The flooding characteristics of a basin may differ depending on the assumed levee breach location (reach/index point). For example, structures in the Natomas Basin (NAT D breach location) would experience significant flooding above the first floor elevation; the average depth of flooding above the first floor exceeds 10 feet, even for relatively higher frequency events such as the 25-year. In the ARS basin, average depth of flooding above the first floor exceeds 6 feet (ARS F breach location) for the 25-year event. In all basins, flooding would be deep and potentially catastrophic. It is important to note that it would be incorrect to sum the number of structures inundated per index point within a basin to derive a total number of structures at risk (Tables 10 to 12 below); this would result in double counting. The same structures may in fact be at risk from flooding from more than one location (index point). Estimates of the total number of structures at risk from flooding in each basin were presented in Chapter 2. Plates displaying the full suite of floodplains for each of the index points are located in the Hydraulic Design Attachment of the Main Engineering Report. American River Common Features GRR February 2015 Page 35
41 Economics - Appendix E Table 10: Flooding Characteristics by Index Point and Annual Chance Exceedance (ACE) Event Floodplains Under Levee Breach Scenario: ARS Basin REACH/INDEX POINT AVERAGE DEPTH OF FLOODING ABOVE 1 ST FLOOR BY INDICATED ANNUAL CHANCE EXCEEDANCE (ACE) EVENT (IN FEET) NUMBER OF STRUCTURES INUNDATED BY INDICATED ANNUAL CHANCE EXCEEDANCE (ACE) EVENT A ,405 23, ,605 FLANKING ,600 F ,759 49,374 51,076 Table 11: Flooding Characteristics by Index Point and ACE Event Floodplains Under Levee Breach Scenario: ARN Basin REACH/INDEX POINT AVERAGE DEPTH OF FLOODING ABOVE 1 ST FLOOR BY INDICATED ANNUAL CHANCE EXCEEDANCE (ACE) EVENT (IN FEET) NUMBER OF STRUCTURES INUNDATED BY INDICATED ANNUAL CHANCE EXCEEDANCE (ACE) EVENT A ,009 13,437 14,839 FLANKING ,758 E ,247 3,346 15,144 Table 12: Floodplain Characteristics by Index Point and ACE Event Floodplains Under Levee Breach Scenario: Natomas Basin REACH/INDEX POINT AVERAGE DEPTH OF FLOODING ABOVE 1 ST FLOOR BY INDICATED ANNUAL CHANCE EXCEEDANCE (ACE) EVENT (IN FEET) NUMBER OF STRUCTURES INUNDATED BY INDICATED ANNUAL CHANCE EXCEEDANCE (ACE) EVENT D ,547 22,677 22,770 SANKEY GAP ,821 A full set of floodplain plates can be found in the Hydraulic Design Appendix. These include floodplains for a range of events (2yr to 500yr) and for each index point. 3.3 FLOOD RISK: PROBABILITY & CONSEQUENCES Risk can be described in terms of the chance of some undesirable event occurring and the potential consequences should that undesirable event occur. In FRM National Economic Development (NED) analysis, risk is described in terms of the chance of flooding (the undesirable event) and the potential damages (consequences) from flooding. The following sections describe the flood risk associated with the without-project condition Annual Chance Exceedance (ACE) Event Damages Annual chance exceedance (ACE) event damages, sometimes referred to as single-event damages, were computed in HEC-FDA. Single-event damages assume that a breach from a specific probability event American River Common Features GRR February 2015 Page 36
42 Economics - Appendix E occurs; it does not take into account the likelihood of this event actually happening. Single-event damages are useful in that they show the magnitude of consequences, within a particular consequence area, should a specific flood event occur in that area. Table 13 below shows the damages that may occur for a range of events within the three main basins. These damage values include automobiles, structures, and contents, and represent damages based on flooding from one index point per basin ARN A in the north basin, ARS F in the south basin, and NAT D in the Natomas Basin. Table 13: Damages by Annual Chance Exceedance Event ACE EVENT DAMAGES (IN $1,000s, OCTOBER 2014 PRICE LEVEL) BASIN 50% 10% 4% 2% 1%.5%.2% ARS 6,639,651 8,692,658 9,036,475 9,540,476 11,941,662 12,876,621 21,004,919 ARN 0 0 2,777,614 2,860,881 4,560,254 4,855,423 5,910,919 NATOMAS 4,404,922 5,579,812 5,784,706 6,109,155 6,271,056 6,403,807 6,896,591 TOTAL 11,044,574 14,272,471 17,598,795 18,510,511 22,772,972 24,135,852 33,812, Expected Annual Damages (EAD) Expected annual damage (EAD) is the metric used to describe the consequences of flooding on an annual basis considering a full range of flood events from high frequency/small events to low frequency/large events over a long time horizon (years). It is the main economic statistic used to describe the flooding problem in the study area; it is also used as the baseline to measure potential benefits from proposed FRM alternatives. Table 14 displays the EAD results for each index point and by major damage category. Table 15 condenses the information from Table 14 and displays the EAD results by basin. Since the economic incremental analysis is being performed from a system perspective, the basin EAD results in Table 14 were used as the baseline without-project damages (per each basin) for which to measure with-project outputs. For the ARS basin, the without-project EAD used as the starting point for the economic analysis is the EAD associated with the index point (per basin) that produced the highest without-project EAD. This is index point ARS E on the Sacramento River. For the ARN basin, the without-project EAD used as the starting point for the economic analysis is the sum of the EADs associated with the ARN A (American River) and the ARN E (Arcade Creek) index points. Based on information from the SPK Hydraulic Design Section, the American River and Arcade Creek are uncorrelated from both a hydrologic and hydraulic perspective. For the Natomas Basin, the without-project EAD used as the starting point for the economic analysis is the EAD associated with the NAT D index point. In the prior 2010 NPACR analysis, EAD for Natomas was computed using the HEC-FDA model as well as a supplemental model (N@RM) that accounted for flood plain occupant behavior. The N@RM model was used to adjust EAD results obtained from HEC-FDA by taking into account reduced inventory, reduced value of damageable property, and a decrease in the number of flood plain occupants as floods occurred over time. The adjustment factor using the N@RM model turned out to be, on average, around 67% (i.e., 67% reduction in damages). This factor was carried forward to the current analysis; the EAD results for the Natomas Basin presented in the following tables reflect adjusted values. American River Common Features GRR February 2015 Page 37
43 Economics - Appendix E Table 14: Without-Project EAD by Index Point INDEX POINT WITHOUT-PROJECT EXPECTED ANNUAL DAMAGES (EAD) (IN $1,000s, OCTOBER 2014 PRICE LEVEL, 50-YEAR PERIOD OF ANALYSIS) AUTOS COMMERCIAL FARM INDUSTRIAL PUBLIC RESIDENTIAL TOTAL ARS A 4,171 15, ,704 11,760 56,327 91,330 FLANKING 806 2, ,121 2,051 9,858 16,737 ARS F 15,080 42, ,197 35, , ,383 ARN A 2,171 18, ,257 4,937 19,796 51,128 FLANKING 206 1, ,077 4,995 ARN E 1,050 8, ,044 2,023 10,642 26,175 NAT D 863 3, ,328 2,774 19,300 28,595 S. GAP ,036 Table 15: Without-Project EAD by Basin WITHOUT-PROJECT EXPECTED ANNUAL DAMAGES (EAD) (IN $1,000s, OCTOBER 2014 PRICE LEVEL, BASIN 50-YEAR PERIOD OF ANALYSIS) AUTOS COMMERCIAL FARM INDUSTRIAL PUBLIC RESIDENTIAL TOTAL ARS 15,080 42, ,197 35, , ,383 ARN 3,221 27, ,301 6,960 30,438 77,303 NATOMAS 863 3, ,328 2,774 19,300 28,595 TOTAL 19,164 73, ,826 45, , ,281 Expected annual damages associated with emergency cost loss categories were computed for one representative index point (ARS B) associated with the American River South Basin. The information from this analysis was then used to estimate potential emergency cost damages for each basin. Table 16 below displays the results for ARS B; Table 17 displays the damage estimates for each basin and the approach used to extrapolate the ARS B results to develop damage estimates for the ARS, ARN, and Natomas basins. Table 16: Without-Project EAD -- Emergency Costs (ARS B Index Point) WITHOUT-PROJECT EXPECTED ANNUAL DAMAGES (EAD) EMERGENCY COST LOSS CATEGORIES (IN $1,000s, OCTOBER 2014 PRICE LEVEL, 50-YEAR PERIOD OF ANALYSIS) INDEX POINT DEBRIS EVACUATION PUBLIC PUBLIC SERVICES PUBLIC SERVICES TOTAL UTILITIES PATRONIZED PRODUCED ARS B ,463 The results from ARS B were used to compute emergency cost losses as a percent of structure/content/auto damages. For ARS B, structure/content/auto damages were approximately $85.8 million. Emergency cost damages ($1.5 million) as a percent of structure/content/auto damages, therefore, are approximately 1.7 %. Table 17 shows the process of using the results from ARS B to estimate emergency cost losses for each basin. American River Common Features GRR February 2015 Page 38
44 Economics - Appendix E Table 17: Without-Project EAD -- Emergency Costs (ARS, ARN, and Natomas Basins) BASIN STRUCTURE, CONTENTS, & AUTO EAD 1 (In $1,000s) EMERGENCY COST LOSSES AS % OF STRUCTURE/CONTENT/AUTO DAMAGES 2 EC EAD (IN $1,000S) ARS 332, % 5,651 ARN 77, % 1,314 NATOMAS 28, % 486 TOTAL 438, % 7,451 1 Values taken from Table 14; values in October 2014 price level; 50-year period of analysis 2 Percentage extrapolated from ARS B analysis In terms of EAD, the economic modeling indicates that losses associated with the emergency cost categories are minimal relative to damages associated with structures, contents, and automobiles. The limited analysis performed on the emergency cost loss categories was intended to provide an order of magnitude estimate of emergency cost damages and to show emergency cost damages in relation to other damages, including structures, contents, and automobiles. As was previously noted, the emergency cost models have not yet been reviewed by the Planning Center of Expertise (PCX). In light of this, and coupled with the results provided in Table 17 above that indicate that emergency cost damages do not significantly add to total EAD or affect plan selection, the damages associated with emergency cost losses were not included in the baseline without-project EAD used to measure with-project benefits and to perform the net benefit/benefit-to-cost analyses. However, damages and benefits associated with emergency cost losses will be evaluated and included in the Final Report Annual Exceedance Probability (AEP) by Index Point and Basin Annual exceedance probability (AEP) is a statistic used to describe the chance of flooding in any given year within a designated area. It is often used to describe one aspect of flood risk, with the other being the consequences (e.g., damages and loss of life) of flooding. Annual exceedance probability is computed in HEC-FDA using engineering data at an index point; these input data include exceedance probability-discharge, stage-discharge, and geotechnical levee failure relationships, and in some cases transform flow (inflow-outflow discharges associated with dams/reservoirs) curves. Table 18 below displays the AEP values associated with each index point. Annual exceedance probability values differ depending on the location along the levee due primarily to the differing geotechnical conditions of the levees protecting the basin. Each basin is considered to be protected by a system of levees, and flooding to the basin could potentially occur from various sources. For example, in the ARS Basin, flooding can occur from the American River or the Sacramento River; further, the risk of flooding along either river varies depending on the location along the river. In this respect, the AEP values listed in Table 18 for each index point represent the probability of a flood event occurring when considering only one failure location (one failure mechanism). Generally, evaluating AEP information at multiple points at which flooding into an area could occur typically provides a more complete characterization of the chance of flooding for that particular area. American River Common Features GRR February 2015 Page 39
45 Economics - Appendix E Table 18: Annual Exceedance Probability (AEP) by Index Point -- Without-Project Condition BASIN INDEX POINT AEP 1/AEP ARS A in 97 ARS ARS Outflanking in 294 ARS F in 32 ARN A in 96 ARN ARN Outflanking in 1000 ARN E in 61 NAT D in 67 NATOMAS Sankey Gap in Long-Term Risk by Index Point and Basin Another statistic that the HEC-FDA program computes is long-term risk. Long-term risk describes the chance of flooding over a given time period, such as 30 years; HEC-FDA computes long-term risk statistics for 10-, 30-, and 50-year periods. Table 19 displays the without-project long-term risk results for each index point/basin. For each basin, the long-term risk over a 30-year period is relatively high and exceeds 25%. Table 19: Long-Term Risk by Index Point/Basin -- Without-Project Condition LONG-TERM RISK BASIN INDEX POINT 10 YEARS 30 YEARS 50 YEARS ARS A 10% 27% 41% ARS Outflanking 4% 11% 18% ARS F 27% 61% 79% ARN A 10% 27% 41% ARN Outflanking 1% 3% 4% ARN E 15% 39% 57% NAT D 9% 36% 52% NATOMAS Sankey Gap 90% 99% 99% Assurance Assurance, formerly known as conditional non-exceedance probability (CNP), describes the likelihood of a stream/river being able to pass a specific flow event, for example the 100-year flow. The assurance statistics provide relevant information to decision makers in that it helps describe both how well the flood system currently performs and how well the system could potentially perform under various withproject scenarios. The assurance statistics for each index point/basin under the without-project condition are listed in Table 20 below. Taking ARS B index point as an example, the information indicates that there is an 84% assurance of passing the 4% flow event, but a lower 75% assurance of passing the 1% flow event. American River Common Features GRR February 2015 Page 40
46 Economics - Appendix E Table 20: Assurance by Index Point -- Without-Project Condition ASSURANCE BASIN INDEX POINT 4% 1% 0.2% ARS A 93% 77% 18% ARS Outflanking 99% 80% 9% ARS F 75% 69% 24% ARN A 92% 75% 22% ARN Outflanking 99% 98% 40% ARN E 90% 68% 7% NAT D 93% 84% 37% NATOMAS Sankey Gap 3% 1% 1% American River Common Features GRR February 2015 Page 41
47 Economics - Appendix E CHAPTER 4 WITH-PROJECT ALTERNATIVES ANALYSES 4.1 WITH-PROJECT ANALYSIS: BASIN AS BASIC ANALYTICAL UNIT Without-project expected annual damages were computed at eight representative index points throughout the study area. As was explained in Chapter 2, the project delivery team (PDT) selected these index points, which are located on the main flood sources, in order to be able to reasonably characterize the flood risk associated with each of the three main basins by accounting for the multiple sources of flooding in each basin. Similarly, with-project damages reduced (benefits) associated with various project alternatives were also computed at each representative index point for each basin. If the flood risk in a basin (or any other consequence area) could be attributed to one and only one flood source, then the total benefits computed at an index point along a particular flood source would represent the benefits of building a project on that flood source. This is not the case, however, for the Common Features study area as flood risk in each basin/consequence area can be attributed to multiple flood sources. Under this scenario, benefits were computed first at each index point (source), and then estimated for the whole basin using the appropriate calculation method as determined by assessments of the hydrologic/hydraulic correlation between the flood sources within a basin. Table 21 below summarizes the methods used to estimate benefits for each basin. Table 21: Method of Benefit Calculation by Basin BASIN INDEX POINT METHOD USED TO ESTIMATE BENEFITS A ARS Flanking F ARN NAT A Flanking E D Sankey Gap 4.2 DESCRIPTION OF FINAL ARRAY OF ALTERNATIVES Summary descriptions of each alternative are presented below: Compare risk at multiple index points and use highest EAD/residual EAD to estimate benefits (A and F) Compute risk at multiple index points and add EADs using joint probabilities (A and E) Estimate benefits using single index point (D) and information from prior analysis (NPACR) Alternative 1 Fix Levees: Alternative 1 would include the construction of levee remediation measures to address seepage, stability, erosion, and height measures identified for the Sacramento River, Natomas East Main Drainage Canal (NEMDC), Arcade, Dry/Robla, and Magpie Creeks. Alternative 1 would also include erosion measures for specific locations along the American River. Alternative 1 does not include levee raises in the Natomas Basin. (Although the results of the benefits analysis are shown in this document.) American River Common Features GRR February 2015 Page 42
48 Economics - Appendix E Alternative 2 Sacramento Bypass and Fix Levees: Alternative 2 would include widening the Sacramento Weir and Bypass to divert more flows into the Yolo Bypass and reduce the need to raise levees along the Sacramento River downstream of the bypass. The levees along the American River, the Natomas East Main Drainage Canal (NEMDC), Arcade, Dry/Robla, and Magpie Creeks, would be improved to address identified seepage, stability, erosion and height concerns through some combination of repairing the levees in place (fix in place) or construction of an adjacent levee with measures to address the concerns. The levees along the Sacramento River would be improved to address identified seepage, stability, and erosion concerns through some combination of repairing the levees in place (fix in place) or construction of an adjacent levee with measures to address the concerns. Alternative 2 would also include erosion measures for specific locations along the American River. Alternative 2 does not include any levee raises in the Natomas Basin. (Although the results of the benefits analysis are shown in this document.) 4.3 WITH-PROJECT RESULTS: RESIDUAL EAD AND BENEFITS BY INDEX POINT AND ALTERNATIVE The following tables show the without-project EAD and with-project residual EAD results computed in HEC-FDA for each index point/breach/over flanking location. The benefits shown for each alternative in each table are the damages reduced at a respective index point/breach/over flanking location, and represent the benefits to the associated basin if improvements were to occur on the source of flooding where the index point is located and if there were no other sources of flood risk. For example, in Table 22, the benefits of Alternative 1 are approximately $25.5 million. All of these benefits could be claimed if improvements to the American River (left bank) were made, and if there were no other sources of flood risk. While the first condition (improvements to the levees) would be met under this scenario, the second condition under this scenario has not yet been met there is still flood risk from the Sacramento River. Since there is still flood risk from the Sacramento River, the full $25.5 million in benefits cannot be claimed for the entire ARS Basin. (In the next section, the benefits for each basin are estimated by considering all of the sources of flood risk in that basin.) Tables 22 to 26 show three sets of with-project data. The first set is associated with outputs derived from improvements only to the Sacramento River levees downstream of the confluence with the American River and not from any Sacramento levee raises (Alternative 1) or the Sacramento Bypass widening (Alternative 2). This scenario only applies to the ARS F index point (Table 23), but the columns were added to the other tables for consistency purposes. American River Common Features GRR February 2015 Page 43
49 Economics - Appendix E Table 22: Without-Project EAD and With-Project Residual EAD (ARS A, left bank American River) ARS A INDEX POINT AMERICAN RIVER SOUTH BASIN (IN $1,000s, OCTOBER 2014 PRICE LEVEL, 50-YEAR PERIOD OF ANALYSIS) DAMAGE CATEGORY WITHOUT FIX SAC RIVER LEVEES ONLY (BELOW CONFLUENCE WITH ALTERNATIVE 1 (FIP) ALTERNATIVE 2 (SBW) EAD AMERICAN) RESIDUAL RESIDUAL RESIDUAL EAD BENEFITS EAD BENEFITS EAD BENEFITS Autos 4,171 N/A N/A 2,986 1,185 2,966 1,205 Commercial 15,338 N/A N/A 11,258 4,080 11,136 4,202 Farm 30 N/A N/A Industrial 3,704 N/A N/A 3, , Public 11,760 N/A N/A 8,402 3,358 8,338 3,422 Residential 56,327 N/A N/A 39,900 16,427 39,664 16,663 TOTAL IP 91,330 N/A N/A 65,814 25,519 65,331 25,996 Table 23: Without-Project EAD and With-Project Residual EAD (ARS F, left bank Sacramento River) ARS F INDEX POINT AMERICAN RIVER SOUTH BASIN (IN $1,000s, OCTOBER 2014 PRICE LEVEL, 50-YEAR PERIOD OF ANALYSIS) DAMAGE CATEGORY WITHOUT FIX SAC RIVER LEVEES ONLY (BELOW CONFLUENCE WITH ALTERNATIVE 1 (FIP) ALTERNATIVE 2 (SBW) EAD AMERICAN) RESIDUAL RESIDUAL RESIDUAL EAD BENEFITS EAD BENEFITS EAD BENEFITS Autos 15,080 5,474 9,606 3,084 11,996 2,997 12,083 Commercial 42,514 16,303 26,211 8,403 34,111 8,295 34,219 Farm Industrial 11,197 5,090 6,107 2,051 9,146 2,053 9,144 Public 35,644 13,372 22,272 7,207 28,437 7,091 28,553 Residential 227,555 80, ,287 47, ,342 45, ,989 TOTAL IP 332, , ,733 68, ,346 66, ,305 Table 24: Without-Project EAD and With-Project Residual EAD (ARN A, right bank American River) ARN A INDEX POINT AMERICAN RIVER NORTH BASIN (IN $1,000s, OCTOBER 2014 PRICE LEVEL, 50-YEAR PERIOD OF ANALYSIS) DAMAGE CATEGORY WITHOUT FIX SAC RIVER LEVEES ONLY (BELOW CONFLUENCE WITH ALTERNATIVE 1 (FIP) ALTERNATIVE 2 (SBW) EAD AMERICAN) RESIDUAL RESIDUAL RESIDUAL EAD BENEFITS EAD BENEFITS EAD BENEFITS Autos 2,171 N/A N/A 1, , Commercial 18,967 N/A N/A 10,316 8,651 11,043 7,924 Farm 0 N/A N/A Industrial 5,257 N/A N/A 2,781 2,476 2,982 2,275 Public 4,937 N/A N/A 2,621 2,316 2,809 2,128 Residential 19,796 N/A N/A 10,928 8,868 11,699 8,097 TOTAL IP 51,128 N/A N/A 27,823 23,305 29,793 21,335 American River Common Features GRR February 2015 Page 44
50 Economics - Appendix E Table 25: Without-Project EAD and With-Project Residual EAD (ARN E, right bank Arcade Creek) ARN E INDEX POINT AMERICAN RIVER NORTH BASIN DAMAGE (IN $1,000s, OCTOBER 2014 PRICE LEVEL, 50-YEAR PERIOD OF ANALYSIS) CATEGORY WITHOUT EAD FIX SAC RIVER LEVEES ONLY (BELOW CONFLUENCE WITH AMERICAN) RESIDUAL EAD BENEFITS ALTERNATIVE 1 (FIP) RESIDUAL EAD BENEFITS ALTERNATIVE 2 (SBW) RESIDUAL EAD BENEFITS Autos 1,050 N/A N/A Commercial 8,416 N/A N/A 6,280 2,136 5,866 2,550 Farm 0 N/A N/A Industrial 4,044 N/A N/A 2,079 1,965 1,777 2,267 Public 2,023 N/A N/A 1, , Residential 10,642 N/A N/A 7,376 3,266 6,735 3,907 TOTAL IP 26,175 N/A N/A 18,105 8,070 16,567 9,608 Table 26: Without-Project EAD and With-Project Residual EAD (NAT D, left bank Natomas Cross Canal) NAT D INDEX POINT NATOMAS BASIN DAMAGE (IN $1,000s, OCTOBER 2014 PRICE LEVEL, 50-YEAR PERIOD OF ANALYSIS) CATEGORY WITHOUT EAD FIX SAC RIVER LEVEES ONLY (BELOW CONFLUENCE WITH AMERICAN) RESIDUAL EAD BENEFITS ALTERNATIVE 1 (FIP) RESIDUAL EAD BENEFITS ALTERNATIVE 2 (SBW) RESIDUAL EAD BENEFITS Autos 863 N/A N/A Commercial 3,294 N/A N/A 1,511 1,783 1,469 1,825 Farm 36 N/A N/A Industrial 2,328 N/A N/A 1,081 1,247 1,051 1,277 Public 2,774 N/A N/A 1,274 1,500 1,238 1,536 Residential 19,300 N/A N/A 8,845 10,455 8,595 10,705 TOTAL IP 28,595 N/A N/A 13,113 15,482 12,742 15, RANGE OF BENEFITS BY INDEX POINT & ALTERNATIVE The following tables present ranges of benefits for each alternative and at each index point. HEC-FDA computes damages reduced (benefits) at specific probabilities (25%, 50%, and 75%); the intersection of the probability and the dollar value in the table can be read as, There is an X chance that damages reduced (benefits) exceeds Y. The benefits in these tables provide a broader picture of the possible range in benefits that may be realized considering all of the hydrologic, hydraulic, geotechnical, and economic uncertainty. American River Common Features GRR February 2015 Page 45
51 Economics - Appendix E Table 27: Range of Benefits at ARS A (In $1000s, October 2014 Price Level, 50-Year Period of Analysis) PLAN WITHOUT- PROJECT EAD WITH- PROJECT EAD EXPECTED BENEFITS PROBABILITY BENEFITS EXCEED INDICATED VALUE 75% 50% 25% No action 91, Alt. 1 FIP 91,330 65,814 25,519 17,001 21,266 30,223 Alt. 2 SB 91,330 65,331 25,996 16,944 21,166 30,816 Table 28: Range of Benefits at ARS F (In $1,000s, October 2014 Price Level, 50-Year Period of Analysis) PLAN WITHOUT- PROJECT EAD WITH- PROJECT EAD EXPECTED BENEFITS PROBABILITY BENEFITS EXCEED INDICATED VALUE 75% 50% 25% No action 332, Alt. 1 FIP 332,383 68, , , , ,595 Alt. 2 SB 332,383 66, , , , ,927 Table 29: Range of Benefits at ARN A (In $1,000s, October 2014 Price Level, 50-Year Period of Analysis) PROBABILITY BENEFITS EXCEED INDICATED PLAN WITHOUT- WITH- EXPECTED VALUE PROJECT EAD PROJECT EAD BENEFITS 75% 50% 25% No action 51, Alt. 1 FIP 51,128 27,823 23,305 8,459 17,492 34,125 Alt. 2 SB 51,128 29,793 21,335 7,281 15,667 31,414 Table 30: Range of Benefits at ARN E (In $1,000s, October 2014 Price Level, 50-Year Period of Analysis) PLAN WITHOUT- PROJECT EAD WITH- PROJECT EAD EXPECTED BENEFITS PROBABILITY BENEFITS EXCEED INDICATED VALUE 75% 50% 25% No action 26, Alt. 1 FIP 26,175 18,105 8,070 4,573 7,128 10,783 Alt. 2 SB 26,175 16,567 9,608 4,874 8,102 12,670 Table 31: Range of Benefits at NAT D (In $1,000s, October 2014 Price Level, 50-Year Period of Analysis) PROBABILITY BENEFITS EXCEED INDICATED PLAN WITHOUT- WITH- EXPECTED VALUE PROJECT EAD PROJECT EAD BENEFITS 75% 50% 25% No action 28, Alt. 1 FIP 28,595 13,113 15,482 10,847 14,297 19,378 Alt. 2 SB 28,595 12,742 15,853 11,106 14,652 19, WITH-PROJECT RESULTS: BENEFITS BY BASIN AND ALTERNATIVE Tables 32 and 33 below display the benefits of each alternative by basin. The benefit values in these tables reflect improvements made to each source of flood risk within a particular basin. For example, in the ARS Basin, FRM improvements are made to reduce risk from both the American and Sacramento Rivers. These tables reflect benefits that would be realized in a basin (i.e., in a single consequence area) American River Common Features GRR February 2015 Page 46
52 Economics - Appendix E by thinking of the flood problem from a broader system perspective rather than from just individual, discrete sources of flood risk. Table 32: Average Annual Benefits for Alternative 1 (In $1,000s, October 2014 Price Level, 50-Year Period of Analysis) BASIN WITHOUT-PROJECT EAD WITH-PROJECT EAD AVERAGE ANNUAL BENEFITS ARS 332,383 (ARS E) 68,037 (ARS E) 264,346 ARN 77,303 (ARN A + ARN E) 45,928 (ARN A + ARN E) 31,375 NATOMAS 28,595 (NAT D) 13,113 (NAT D) 15,482 TOTAL 438, , ,203 Table 33: Average Annual Benefits for Alternative 2 (In $1,000s, October 2014 Price Level, 50-Year Period of Analysis) BASIN WITHOUT-PROJECT EAD WITH-PROJECT EAD AVERAGE ANNUAL BENEFITS ARS 332,383 (ARS E) 66,078 (ARS E) 266,305 ARN 77,303 (ARN A + ARN E) 46,360 (ARN A + ARN E) 30,943 NATOMAS 28,595 (NAT D) 12,742 (NAT D) 15,853 TOTAL 438, , ,101 As explained throughout the preceding sections, the benefits of FRM improvements in the study area have been computed using simplifying assumptions and simplified computations in order to make reasonable estimates using available resources, which include time, money, data, as well as software applications. Simplifications were necessary considering that the study area may flood from multiple water sources. As an example, the method used to compute benefits for the ARS Basin was selected based on information that the American and Sacramento Rivers are moderately correlated in terms of hydrology and hydraulics. While it is believed that the method used (compute risk at multiple index points and use the highest EAD) accurately accounts for damages, residual damages, and benefits associated with the ARS Basin, it also should be noted that this may not be the most rigorous method to estimate benefits for this basin. The most rigorous method to compute benefits given the multiple-source flooding situation in the ARS Basin would be to use a model that fully represents the system and could account for various what if scenarios: What if there is a levee breach along the American River first? Would this affect the probabilities of flooding along the Sacramento River downstream of the confluence? What if there is a breach along the Sacramento River first? Would this affect the probabilities of flooding along the American River? What if there is a levee breach along both rivers at the same time? While a true systems approach is ideal, it may not be practical until more sophisticated analytical tools are developed and tested by FRM practitioners. In the meantime, it is believed that the method used to estimate benefits for this current analysis balances rigor with practicality without sacrificing accuracy. American River Common Features GRR February 2015 Page 47
53 Economics - Appendix E 4.6 BENEFITS DURING CONSTRUCTION Screening-level construction schedules for each alternative were prepared by the Civil Design Section (SPK). These schedules lay out the sequencing of each improvement by reach and the year in which each improvement is completed. These schedules indicate that individual basins within the study area may benefit from flood risk reduction prior to the base year -- the year in which the entire project is completed. More specifically, these schedules show that for Alternative 1, FRM improvements to the levees in the ARS Basin would be completed in year 8 of a 10-year construction schedule, allowing benefits in this basin to start accruing two years prior to the base year; improvements to the levees in the ARN Basin would be completed in year 10 of a 10-year construction schedule, with no benefits accruing prior to the base year. For Alternative 2, improvements to the levees in the ARS Basin would be completed in year 8 of a 10-year construction schedule, allowing partial benefits (i.e., benefits from improving the levees only and not from widening the Sacramento Bypass) to accrue for two years prior to the base year; the Sacramento Bypass widening would be complete in year 10, as would improvements to the levees in the ARN Basin, indicating that no benefits for these features would accrue prior to the base year. Table 34 shows the year prior to the base year that individual basins within the study area will start to see benefits, depending on which improvements are completed; the annual benefits claimed prior to the base year are also are displayed. The number of years prior to the base year that improvements to a basin would be completed and the annual benefits per risk source/basin (from Tables 32 and 33) form the basis for which equivalent average annual benefits during construction are computed. Equivalent average annual benefits associated with benefits during construction for Alternatives 1 and 2 are presented in Table 35. These benefits were derived by summing the compounded benefits of each year prior to the base year and amortizing the sum over a 50-year period of analysis. The current federal discount rate of 3.375% was used for both compounding and amortization purposes. Table 34: Annual Benefits Accrued Prior to Base Year (October 2014 Price Level, 50-Year Period of Analysis, $1,000s) YEARS PRIOR TO BASE YEAR ALTERNATIVE BASIN Alt 1 ARS , ,346 ARN NAT Alt 2 ARS , ,733 ARN NAT American River Common Features GRR February 2015 Page 48
54 Economics - Appendix E Table 35: Equivalent Average Annual Benefits Benefits During Construction (October 2014 Price Level, 50-Year Period of Analysis, 3.375% Discount Rate, $1,000s) EQUIVALENT AVERAGE ANNUAL BENEFITS DURING CONSTRUTION BY MAJOR RISK SOURCE AND BASIN ARS ARN ALTERNATIVE TOTAL SACRAMENTO RIVER NAT + AMERICAN AMERICAN RIVER RIVER TRIBUTARIES Alt 1 23, ,162 Alt 2 18, , BENEFITS OUTSIDE THE IMMEDIATE STUDY AREA: CITY OF WEST SACRAMENTO On one hand, widening the Sacramento Bypass (Alternative 2) provides benefits to the city of West Sacramento, which is located on the right bank (west side) of the Sacramento River adjacent to the confluence with the American River and directly across the river from the city of Sacramento. The benefits are achieved through lower flows and stages in the Sacramento River downstream of the Sacramento Bypass, effectively decreasing the computed frequency of flooding into the city of West Sacramento and thereby reducing expected annual damages. On the other hand, Alternative 2 may also increase the computed chance of flooding into West Sacramento via the Yolo Bypass. Preliminary evaluations of the effects of widening the Sacramento Bypass show that water surface elevations in the Yolo Bypass increase minimally, which may result in an increase in expected annual damages associated with flooding from the Yolo Bypass. These evaluations indicate that it may be necessary to make improvements to the Yolo Bypass levees prior to widening of the Sacramento Bypass. A General Reevaluation Report (GRR) is currently being completed for the West Sacramento area. 4.8 WITH-PROJECT PERFORMANCE RESULTS: AEP, LONG-TERM RISK, & ASSURANCE Tables 36 to 38 present the performance statistics under both without-project and with-project conditions for each index point, basin, and alternative. The AEP values under with-project conditions indicate that each alternative provides significant risk reduction in terms of the chance of flooding in any given year. For example, in the ARS Basin, withoutproject AEP is about 1 in 32 (1 in 97 for ARS A on American River and 1 in 32 for ARS F on Sacramento River). With improvements made to both risk sources, flood risk is reduced to about a 1 in 135 (Alternative 1) and 1 in 147 (Alternative 2). The long-term risk statistics indicate that the chance of flooding over a certain time period is also reduced. In the ARS Basin, the chance of flooding over a 10-year and 30-year period improves significantly with a project in place, while in the ARN Basin this improvement isn t as great. Like the ARS Basin, the Natomas Basin would also experience a significant reduction in long-term risk with levee improvements. American River Common Features GRR February 2015 Page 49
55 Economics - Appendix E Table 36: AEP -- Without-Project and With-Project Conditions ANNUAL EXCEEDANCE PROBABILITY (AEP) FIX SAC RIVER LEVEES ONLY BASIN INDEX POINT WITHOUT ALT. 1 (WITH SAC (BELOW RAISES) CONFLUENCE WITH AMERICAN) ARS ARN NATOMAS ALT. 2 SBW ARS A Flanking ARS F ARN A Flanking ARN E NAT D Sankey Gap Table 37: Long-Term Risk -- Without-Project and With-Project Conditions LONG-TERM RISK BASIN INDEX FIX SAC RIVER LEVEES ONLY (BELOW POINT WITHOUT ALT. 1 (WITH SAC CONFLUENCE WITH ALT. 2 SBW RAISES) AMERICAN) 10 YEARS 30 YEARS 10 YEARS 30 YEARS 10 YEARS 30 YEARS 10 YEARS 30 YEARS ARS ARN NATOMAS ARS A 13% 27% 5% 14% 5% 14% 5% 13% Flank. 3% 10% ARS F 27% 61% 10% 27% 7% 20% 7% 18% ARN A 10% 27% 5% 15% 5% 15% 5% 16% Flank. 1% 3% ARN E 15% 39% 5% 14% 5% 14% 4% 11% NAT D 10% 36% 6% 17% 6% 17% 6% 17% S. Gap 82% 99% Table 38: Assurance -- Without-Project and With-Project Conditions ASSURANCE BY EXCEEDANCE PROBABILITY EVENT INDEX BASIN POINT ARS ARN Natomas WITHOUT FIX SAC RIVER LEVEES ONLY (BELOW CONFLUENCE WITH AMERICAN) ALT. 1 (WITH SAC RAISES) ALT. 2 SBW 4% 1%.2% 4% 1%.2% 4% 1%.2% 4% 1%.2% ARS A 93% 77% 18% 98% 91% 31% 98% 91% 31% 98% 91% 32% Flank. 99% 84% 6% ARS F 75% 69% 24% 95% 94% 36% 95% 95% 89% 95% 95% 81% ARN A 92% 75% 22% 99% 90% 24% 99% 90% 24% 98% 89% 22% Flank. 99% 98% 40% ARN E 90% 68% 7% 99% 94% 23% 99% 94% 23% 99% 95% 28% NAT D 93% 84% 37% 95% 91% 60% 95% 91% 60% 95% 91% 60% S. Gap 17% 7% 4% American River Common Features GRR February 2015 Page 50
56 Economics - Appendix E 4.9 SCREENING-LEVEL COST ESTIMATES: BY ALTERNATIVE, BASIN, & SOURCE OF FLOOD RISK Preliminary, screening-level cost estimates were provided by the District s Cost Engineering Section. Detailed costs were provided in several formats; the costs broken out by stream/river were used for this economic analysis and are summarized in Tables 39 and 40 below. In addition to project first costs, interest during construction (IDC), which is an economic cost, was also factored into the net benefit/bcr analyses. Information regarding the construction period (number of years) and the construction schedule for each alternative was provided by the Civil Design Section and used to compute IDC on an annual basis. The construction period for Alternative 1 is estimated to be 10 years while the construction period for Alternative 2 is estimated to also be 10 years; the construction schedules for each alternative identified the timing of the improvements by reach and by year. Table 39: Alternative 1 -- Costs ALTERNATIVE 1: FIX IN PLACE (IN $1,000s, OCTOBER 2014 PRICE LEVEL, 50-YEAR PERIOD OF ANALYSIS, 3.375% DISCOUNT RATE) BASIN AVERAGE RISK FIRST COSTS IDC 1 TOTAL ANNUAL O&M TOTAL AAC SOURCE COSTS COSTS (AAC) American 256,660 72, ,148 13,718 N/A 13,718 ARS Sacramento 674, , ,654 35,203 N/A 35,203 Sac Raises 71,565 16,326 87,891 3,663 N/A 3,663 Total Basin 1,002, ,461 1,261,693 52,584 N/A 52,584 American 144,222 23, ,183 7,009 N/A 7,009 ARN Tributaries 2 181,819 11, ,229 8,053 N/A 8,053 Total Basin 326,041 35, ,412 15,062 N/A 15,062 GRAND TOTAL All Basins 1,328, ,832 1,623,105 67, ,932 1 Interest During Construction 2 Includes Arcade, Dry, and Robla Creeks and the Natomas East Main Drainage Canal (NEMDC) Table 40: Alternative 2 -- Costs ALTERNATIVE 2: SACRAMENTO BYPASS WIDENING (IN $1,000s, OCTOBER 2014 PRICE LEVEL, 50-YEAR PERIOD OF ANALYSIS, 3.375% DISCOUNT RATE) BASIN AVERAGE RISK FIRST COSTS IDC 1 TOTAL ANNUAL O&M TOTAL AAC SOURCE COSTS COSTS (AAC) American 255,142 72, ,201 13,637 N/A 13,637 Sacramento 674, , ,034 35,093 N/A 35,093 ARS Sac Bypass 216,019 22, ,900 9,957 N/A 9,957 Total Basin 1,145, ,967 1,408,135 58,687 N/A 58,687 American 143,370 23, ,190 6,968 N/A 6,968 ARN Tributaries 2 180,978 11, ,333 8,016 N/A 8,016 Total Basin 324,348 35, ,523 14,984 N/A 14,984 GRAND TOTAL All Basins 1,469, ,142 1,767,658 73, ,165 1 Interest During Construction 2 Includes Arcade, Dry, and Robla Creeks and the Natomas East Main Drainage Canal (NEMDC) American River Common Features GRR February 2015 Page 51
57 Economics - Appendix E 4.10 NET BENEFIT AND BENENFIT-TO-COST ANALYSES: PERFORMED INCREMENTALLY BY SOURCE OF FLOOD RISK & BASIN Incremental net benefit/benefit-to-cost analyses were performed for each basin using the major sources of flood risk within a basin as the incremental unit. The cost information presented in Tables 39 and 40 was used to perform the analyses, which are presented in Tables 41 to 43 for the ARS, ARN, and Natomas Basins, respectively. In the ARS Basin, addressing both sources of risk (in tandem) as part of an overall system is necessary in order to significantly reduce risk to the basin as a whole. Without addressing improvements to both the Sacramento and American Rivers, the ARS Basin, which includes downtown Sacramento and the state government buildings, still faces a significant level of risk in terms of the chance of flooding and consequences of flooding. Table 41: Incremental Net Benefit and Benefit-to-Cost Analyses for Alternatives 1 and 2 in ARS Basin (Values in $1,000s, October 2014 Price Level, 50-Year Period of Analysis, 3.375% Discount Rate) Increment Without- Project EAD/Resid EAD Increm. Average Annual Benefits (AAB) Cumulat. AAB Increm. Average Annual Costs (AAC) Cumulat. AAC Increm. Net Benefits Cumulat. Net Benefits Increm. Benefitto-Cost Ratio (BCR) Cumalat. BCR Alternative 1: Fix in Place (FIP) 0 -- No Action 332, N/A N/A 1 -- Fix Sac 120, , ,733 35,203 35, , , River 2a Raise Sac 91,330 29, ,053 3,663 38,866 25, , River 2b Fix 68,037 23, ,346 13,718 52,584 9, , American River Total N/A 264, ,346 52,584 52, , , Alternative 2: Sacramento Bypass Widening (SBW) 0 -- No Action 332, N/A N/A 1 -- Fix Sac 120, , ,733 35,093 35, , , River 2a Widen Sac 91,330 29, ,053 9,957 45,050 19, , Bypass 2b Fix 66,078 25, ,305 13,637 58,687 11, , American River Total N/A 266, ,305 58,687 58, , , Walking through the incremental analysis, Table 41 shows the first increment, under both alternatives, as being improving the Sacramento River levees (but no levee raises under Alternative 1 and no widening of the Sacramento Bypass under Alternative 2). Following improvements to the Sacramento River (fix levees under both Alternatives 1 and 2) the next logical step according to the results of the HEC-FDA analysis would be to address either the raise on the Sacramento River or the widening of the Sacramento Bypass, where AEP and residual damages are the next highest. Once these improvements are made, the American River levees would be improved. American River Common Features GRR February 2015 Page 52
58 Economics - Appendix E It should be pointed out that this planning-level economic analysis indicates that improvements to the American River would be completed after (or in tandem with) either the Sacramento River levee raises (Alt 1) or Sacramento Bypass widening (Alt 2) in order for the ARS Basin to realize its full benefits from either the levee raises or bypass widening. It should also be noted here that while the net benefits associated with the Natomas Basin are shown in Table 43, these benefits were not included in either Alternative 1 or Alternative 2. Table 42: Incremental Net Benefit and Benefit-to-Cost Analyses for Alternatives 1 and 2 in ARN Basin (Values in $1,000s, October 2014 Price Level, 50-Year Period of Analysis, 3.375% Discount Rate) Increment Without- Project EAD/Resid EAD Increm. Average Annual Benefits (AAB) Cumulat. AAB Increm. Average Annual Costs (AAC) Cumulat. AAC Increm. Net Benefits Cumulat. Net Benefits Increm. Benefitto-Cost Ratio (BCR) Cumalat. BCR Alternative 1: Fix in Place (FIP) 0 -- No 77, N/A N/A Action 1 -- Fix 53,998 23,305 23,305 7,009 7,009 16,296 16, American 2 -- Fix 45,928 8,070 31,375 8,053 15, , Creeks Total N/A 31,375 31,375 15,062 15,062 16,313 16, Alternative 2: Sacramento Bypass Widening (SBW) 0 -- No 77, N/A N/A Action 1 -- Fix 55,968 21,335 21,335 6,968 6,968 14,367 14, American 2 -- Fix 46,360 9,608 30,943 8,016 14,984 1,592 15, Creeks Total N/A 30,943 30,943 14,984 14,984 15,959 15, Table 43: Incremental Net Benefit and Benefit-to-Cost Analyses for Alternatives 1 and 2 in Natomas Basin (Values in $1,000s, October 2014 Price Level, 50-Year Period of Analysis, 3.375% Discount Rate) Increment Without- Project EAD/Residual EAD Incremental Average Annual Benefits Incremental Average Annual Costs Incremental Net Benefits Incremental Benefit-to- Cost Ratio (BCR) Alternative 1: Fix in Place (FIP) 0 -- No Action 28, N/A 1 -- Raise All 13,113 15,482 6,918 8, Total N/A 15,482 6,918 8, Alternative 2: Sacramento Bypass Widening (SBW) 0 -- No Action 28, N/A 1 -- Raise All 12,742 15,853 6,945 8, Total N/A 15,853 6,945 8, American River Common Features GRR February 2015 Page 53
59 Economics - Appendix E Tables 44 and 45 show the incremental analyses with benefits prior to the base year (Sections 4.6) incorporated into the calculations. Benefits during construction (Alternatives 1 and 2) were claimed for the ARS Basin. Table 44: Incremental Net Benefit and BCR Analyses Incorporating Benefits Prior to Base Year for Alternatives 1 and 2 in the ARS Basin (Values in $1,000s, October 2014 Price Level, 50-Year Period of Analysis, 3.375% Discount Rate) Increment Without -Project EAD or Res. EAD Increm. Ave. Annual Ben. (AAB) Increm. AAB Prior to Base Year Total Increm. AAB Total Cumul. AAB Increm. Ave. Ann. Costs (AAC) Cumul. AAC Increm. Net Benefits Cumul. Net Benefits Increm. Benefitto-Cost Ratio (BCR) Cumal. BCR Alternative 1: Fix in Place (FIP) 0 -- No Action 332, N/A N/A 1 -- Fix Sac River 120, , , ,733 35,203 35, , , a Raise Sac River 91,330 29, , ,053 3,663 38,866 25, , b Fix American River 68,037 23, , ,346 13,718 52,584 9, , Total N/A 264,346 23, , ,508 52,584 52, , , Alternative 2: Sacramento Bypass Widening (SBW) 0 -- No Action 332, N/A N/A 1 -- Fix Sac River 120, , , ,733 35,093 35, , , a Widen Sac Bypass 91,330 29, , ,053 9,957 45,050 19, , b Fix American River 66,078 25, , ,305 13,637 58,687 11, , Total N/A 266,305 18, , ,857 58,687 58, , , Table 45: Incremental Net Benefit and BCR Analyses Incorporating Benefits Prior to Base Year for Alternatives 1 and 2 in the ARN Basin (Values in $1,000s, October 2014 Price Level, 50-Year Period of Analysis, 3.375% Discount Rate) Increment Without -Project EAD or Res. EAD Increm. Ave. Annual Ben. (AAB) Increm. AAB Prior to Base Year Total Increm. AAB Total Cumul. AAB Increm. Ave. Ann. Costs (AAC) Cumul. AAC Increm. Net Benefits Cumul. Net Benefits Increm. Benefitto-Cost Ratio (BCR) Cumal. BCR Alternative 1: Fix in Place (FIP) 0 -- No Action 77, N/A N/A 1 -- Fix American 53,998 23, ,305 23,305 7,009 7,009 16,296 16, Fix Creeks 45,928 8, ,070 31,375 8,053 15, , Total N/A 31, ,375 31,375 15,062 15,062 16,313 16, Alternative 2: Sacramento Bypass Widening (SBW) 0 -- No Action 77, N/A N/A 1 -- Fix American 55,968 21, ,335 21,335 6,968 6,968 14,367 14, Fix Creeks 46,360 9, ,608 30,943 8,016 14,984 1,592 15, Total N/A 30, ,943 30,943 14,984 14,984 15,959 15, American River Common Features GRR February 2015 Page 54
60 Economics - Appendix E Net benefit/benefit-to-cost analyses for each alternative, shown in Table 46 below, were performed using the information from Tables 43 through 45. For each alternative, total average annual benefits for the ARS and ARN basins were compared to total average annual costs for those basins. Table 46: Net Benefit and Benefit-to-Cost Analyses by Alternative (Values in $1,000s, October 2014 Price Level, 50-Year Period of Analysis, 3.375% Discount Rate) Alternative Average Annual Benefits Average Annual Costs Net Benefits Benefit-to-Cost Ratio (BCR) Alt. 1 FIP 318,883 67, , Alt. 2 SBW 315,800 74, , IDENTIFICATION OF NATIONAL ECONOMIC DEVELOPMENT (NED) PLAN Based on the analysis presented above, both Alternative 1 and Alternative 2 provide positive net benefits. While the net benefits for each alternative are essentially equal from a risk and uncertainty perspective, Alternative 1 would be considered the NED Plan based on the fact that it costs approximately $150 million less than Alternative 2. The analysis also indicates that the improvements to the tributaries in the ARN Basin are only borderline economically feasible (BCR of 1.0) when analyzed incrementally. It should be noted that there is much uncertainty, at this planning level of analysis, in regard to both the benefits and costs associated with the improvements to the east side tributaries. Further analysis and refinements (e.g., including additional benefits from categories not included in this analysis, such as the prevention of emergency costs) are likely to show greater net benefits for the tributaries increment. Preliminary analysis indicates that including the prevention of emergency costs would increase benefits anywhere from about $1.2 million to about $9 million in the ARN Basin. American River Common Features GRR February 2015 Page 55
61 American River Common Features GRR Attachments to Economic Appendix -Supporting Data -Regional Economic Development (RED) Analysis -Other Social Effects (OSE) Analysis
 ACE 1% (1/100) ACE 0.5% (1/200) ACE!. Legend Depths of Flooding (Feet) 0.1-0.5 0.6-1 1.1-3 3.1-5 5.1-10 10.")
 ACE Miles 0 2.5 5 Economic Floodplains Based on a Levee Breach Simulation American River South Index Pt B. Jan 2013 U.")
62 !.!.!. NO LEVEE BREAK FOR THIS EVENT NO LEVEE BREAK FOR THIS EVENT 50% (1/2) ACE 10% (1/10) ACE 4% (1/25) ACE!.!.!. 2% (1/50) ACE 1% (1/100) ACE 0.5% (1/200) ACE!. Legend Depths of Flooding (Feet) STUDY AREA EXTENT AMERICAN RIVER COMMON FEATURES GRR SACRAMENTO, CALIFORNIA 0.2% (1/500) ACE Miles Economic Floodplains Based on a Levee Breach Simulation American River South Index Pt B. Jan 2013 U.S. ARMY CORPS OF ENGINEERS SACRAMENTO DISTRICT
63 Depths of Flooding Miles Legend ARCF Levees AMERICAN RIVER COMMON FEATURES GRR SACRAMENTO, CALIFORNIA Residual Flooding From Channel Outflanking Into The American River South Basin Jan 2013 U.S. ARMY CORPS OF ENGINEERS SACRAMENTO DISTRICT
 0.1-0.5 0.6-1 1.1-3 3.1-5 5.1-10 10.1-15 15.1-20 20.1-25 25.")

64 !.!.!. 50% (1/2) ACE 10% (1/10) ACE 4% (1/25) ACE!.!.!. 2% (1/50) ACE 1% (1/100) ACE 0.5% (1/200) ACE!. Legend Depths of Flooding (Feet) STUDY AREA EXTENT AMERICAN RIVER COMMON FEATURES GRR SACRAMENTO, CALIFORNIA 0.2% (1/500) ACE Miles Economic Floodplains Based on a Levee Breach Simulation American River South Index Pt E. U.S. ARMY CORPS OF ENGINEERS SACRAMENTO DISTRICT Jan 2013 Plate 29
 ACE Miles 0 1.")
65 NO LEVEE BREAK FOR THIS EVENT NO LEVEE BREAK FOR THIS EVENT!.!.!. 50% (1/2) ACE 10% (1/10) ACE 4% (1/25) ACE!.!.!. 2% (1/50) ACE 1% (1/100) ACE 0.5% (1/200) ACE Legend Depths of Flooding (Feet) STUDY AREA EXTENT!. 0.2% (1/500) ACE Miles AMERICAN RIVER COMMON FEATURES GRR SACRAMENTO, CALIFORNIA Economic Floodplains Based on a Levee Breach Simulation American River North Index Pt A. Jan 2013 U.S. ARMY CORPS OF ENGINEERS SACRAMENTO DISTRICT
66 Depths of Flooding Miles Legend ARCF Levees AMERICAN RIVER COMMON FEATURES GRR SACRAMENTO, CALIFORNIA Residual Flooding From Upstream Channel Outflanking Into The American River Basin U.S. ARMY CORPS OF ENGINEERS SACRAMENTO DISTRICT Jan 2013
 ACE 10% (1/10) ACE 10%")
 ACE 1% (1/100) ACE 0.")
 0.1-0.")


67 NO LEVEE BREAK FOR THIS EVENT!.!.!. 50% (1/2) ACE 10% (1/10) ACE 10% (1/25) ACE!.!.!. 2% (1/50) ACE 1% (1/100) ACE 0.5% (1/200) ACE!. Legend Depths of Flooding (Feet) STUDY AREA EXTENT AMERICAN RIVER COMMON FEATURES GRR SACRAMENTO, CALIFORNIA 0.2% (1/500) ACE Miles Economic Floodplains Based on a Levee Breach Simulation American River North Index Pt E. Jan 2013 U.S. ARMY CORPS OF ENGINEERS SACRAMENTO DISTRICT
 ACE 1% (1/100) ACE 0.5% (1/200) ACE!")

 ACE Miles 0 2.")

68 !.!.!. 50% (1/2) ACE 10% (1/10) ACE 4% (1/25) ACE!.!.!. 2% (1/50) ACE 1% (1/100) ACE 0.5% (1/200) ACE!. Legend Depths of Flooding (Feet) STUDY AREA EXTENT AMERICAN RIVER COMMON FEATURES GRR SACRAMENTO, CALIFORNIA 0.2% (1/500) ACE Miles Economic Floodplains Based on a Levee Breach Simulation Natomas Basin Index Pt D. U.S. ARMY CORPS OF ENGINEERS SACRAMENTO DISTRICT Jan 2013 Plate 30

69 By pass Su tt tter Depth of Flooding Miles Legend ARCF Levees AMERICAN RIVER COMMON FEATURES GRR SACRAMENTO, CALIFORNIA Residual Flooding From Sankey Gap Into The Natomas Basin Jan 2013 U.S. ARMY CORPS OF ENGINEERS SACRAMENTO DISTRICT
SUBJECT: EXECUTIVE DIRECTOR'S REPORT FOR JANUARY 19, 2017 WATER INFRASTRUCTURE IMPROVEMENTS FOR THE NATION (WIIN) ACT
 ACT") ITEM 2 Agenda of January 19, 2017 TO: FROM: Board of Directors Sacramento Area Flood Control Agency Richard M. Johnson, Executive Director (916) 874-7606 SUBJECT: EXECUTIVE DIRECTOR'S REPORT FOR JANUARY
ITEM 2 Agenda of January 19, 2017 TO: FROM: Board of Directors Sacramento Area Flood Control Agency Richard M. Johnson, Executive Director (916) 874-7606 SUBJECT: EXECUTIVE DIRECTOR'S REPORT FOR JANUARY
Development Fee Program: Comparative risk analysis
 Development Fee Program: Comparative risk analysis January 2008 Sacramento Area Flood Control Agency David Ford Consulting Engineers, Inc. 2015 J Street, Suite 200 Sacramento, CA 95811 Ph. 916.447.8779
RESOLUTION - APPROVING FINAL FISCAL YEAR BUDGET
 ITEM 12 TO: FROM: SUBJECT: Sacramento Area Flood Control Agency Board of Directors Richard M. Johnson, Executive Director (916) 874-7606 RESOLUTION - APPROVING FINAL FISCAL YEAR 2015-16 BUDGET OVERVIEW:
Lower San Joaquin River Feasibility Report
 Sacramento District Planning Division Lower San Joaquin River Feasibility Report San Joaquin County, California APPENDIX A: ECONOMICS This page intentionally left blank RISK ANALYSIS OVERVIEW Risk is defined
RECOMMENDATION: Staff recommends the Board adopt Resolution No approving SAFCA s Fiscal Year Final Budget.
 ITEM 5 Agenda of August 18, 2016 TO: FROM: SUBJECT: Sacramento Area Flood Control Agency Board of Directors Jason D. Campbell, Deputy Executive Director (916) 874-7606 APPROVING FINAL FISCAL YEAR 2016-17
Westfield Boulevard Alternative
 Westfield Boulevard Alternative Supplemental Concept-Level Economic Analysis 1 - Introduction and Alternative Description This document presents results of a concept-level 1 incremental analysis of the
Public Information Meeting Rahway River Basin, New Jersey Flood Risk Management Feasibility Study
 Public Information Meeting Rahway River Basin, New Jersey Flood Risk Management Feasibility Study U.S. Army Corps of Engineers, New York District New Jersey Department of Environmental Protection 11 &
SUBJECT: LAND USE PLANNING POLICY WITHIN THE 100 YEAR FLOODPLAIN (REPORT #2)
") DEPARTMENT OF PLANNING AND DEVELOPMENT City Council Sacramento, California Honorable Members in Session: CITY OF SACRAMENTO CALIFORNIA August 20, 1993 1231 1 STREET ROOM 200 SACRAMENTO, CA 95814-2998 ENVIRONMENTAL
DEPARTMENT OF PLANNING AND DEVELOPMENT City Council Sacramento, California Honorable Members in Session: CITY OF SACRAMENTO CALIFORNIA August 20, 1993 1231 1 STREET ROOM 200 SACRAMENTO, CA 95814-2998 ENVIRONMENTAL
SUBJECT: EXECUTIVE DIRECTOR'S REPORT FOR AUGUST 20, 2015
 ITEM 1 TO: FROM: Board of Directors Sacramento Area Flood Control Agency Richard M. Johnson, Executive Director (916) 874-7606 SUBJECT: EXECUTIVE DIRECTOR'S REPORT FOR AUGUST 20, 2015 SAFCA Intent to Serve
Situation: the need for non-structural flood risk reduction measures
 Evaluating benefits of non-structural measures in flood risk management feasibility studies At left: Example of a house on an open foundation Source Asheville, NC (undated) By Steve Cowdin, CFM; Natalie
SPILLWAY ADEQUACY ANALYSIS ROUGH RIVER LAKE LOUISVILLE DISTRICT
 SPILLWAY ADEQUACY ANALYSIS OF ROUGH RIVER LAKE LOUISVILLE DISTRICT RICHARD PRUITT (502) 315-6380 Louisville District COE richard.l.pruitt@lrl02.usace.army.mil Spillway ROUGH RIVER LAKE PERTINENT DATA Construction
CONTINUING AUTHORITIES PROJECT (CAP) Federal Interest Determination
 Federal Interest Determination") Date: 8 May 2013 Division: Great Lakes and Ohio River Division District: Nashville District CONTINUING AUTHORITIES PROJECT (CAP) Federal Interest Determination 1. Project: Cumberland River, Metropolitan
Date: 8 May 2013 Division: Great Lakes and Ohio River Division District: Nashville District CONTINUING AUTHORITIES PROJECT (CAP) Federal Interest Determination 1. Project: Cumberland River, Metropolitan
CRISP COUNTY, GEORGIA AND INCORPORATED AREAS
 CRISP COUNTY, GEORGIA AND INCORPORATED AREAS Community Name Community Number ARABI, CITY OF 130514 CORDELE, CITY OF 130214 CRISP COUNTY (UNINCORPORATED AREAS) 130504 Crisp County EFFECTIVE: SEPTEMBER 25,
UPDATE ON DALLAS FLOODWAY
 UPDATE ON DALLAS FLOODWAY ENVIRONMENTAL IMPACT STATEMENT [ EIS ] Transportation and Trinity River Project Committee Rob Newman Director, Trinity River Corridor Project, Fort Worth District 28 April 2014
FREQUENTLY ASKED QUESTION ABOUT FLOODPLAINS Michigan Department of Environmental Quality
 FREQUENTLY ASKED QUESTION ABOUT FLOODPLAINS Michigan Department of Environmental Quality WHAT IS A FLOOD? The National Flood Insurance Program defines a flood as a general and temporary condition of partial
The maximum allowable valley storage decrease for the 100-year flood and Standard Project Flood are 0.0% and 5.0%, respectively.
 2.1.1.2 HYDRAULIC IMPACTS VALLEY The maximum allowable valley storage decrease for the 100-year flood and Standard Project Flood are 0.0% and 5.0%, respectively. General. The computation of valley storage
A Review of Our Legacy System, History of Neglect, Current Issues, and the Path Forward for Levee Safety
 4 th NACGEA GEOTECHNICAL WORKSHOP January 29, 2010 A Review of Our Legacy System, History of Neglect, Current Issues, and the Path Forward for Levee Safety Presented by: Leslie F. Harder, Jr., Phd, PE,
Appendix A Economic Analysis Appendix
 Appendix A: Economic Analysis Appendix Appendix A Economic Analysis Appendix A-1 Appendix A: Economic Analysis Appendix A-2 Appendix A: Economic Analysis Appendix Table of Contents 1 INTRODUCTION...8 1.1
APPENDIX E - ECONOMICS For WESTMINSTER, EAST GARDEN GROVE FLOOD RISK MANAGEMENT STUDY
 APPENDIX E - ECONOMICS For WESTMINSTER, EAST GARDEN GROVE FLOOD RISK MANAGEMENT STUDY October 2018 Page intentionally left blank Contents 1.0 Purpose and Overview... 1 1.1 Problems and Opportunities...
APPENDIX K Drainage Study
 APPENDIX K Drainage Study Storm Drainage Study For Project 65 Sacramento, California Prepared for: Capital Station 65, LLC Prepared by: Nolte Associates, Inc. 2495 Natomas Park Drive, Fourth Floor Sacramento,
Requirements for Mapping Levees Complying with Section of the NFIP Regulations
 FACT SHEET Requirements for Mapping Levees Complying with Section 65.10 of the NFIP Regulations As part of a mapping project, it is the levee owner s or community s responsibility to provide data and documentation
FINAL TECHNICAL MEMORANDUM AWD FLOWS THROUGH FLOOD DAMAGE REDUCTION AREA July 16, 2012
 FINAL TECHNICAL MEMORANDUM AWD-00002 FLOWS THROUGH FLOOD DAMAGE REDUCTION AREA July 16, 2012 Table of Contents TABLE OF CONTENTS Table of Contents... 1 Executive Summary... 2 1 Objective... 4 2 Study Approach...
LETTER REPORT BAYOU SORREL LOCK REPLACEMENT, LOUISIANA POST AUTHORIZATION CHANGE STUDY
 LETTER REPORT BAYOU SORREL LOCK REPLACEMENT, LOUISIANA POST AUTHORIZATION CHANGE STUDY September 2013 SEPTEMBER 2013 LETTER REPORT BAYOU SORREL LOCK REPLACEMENT, LOUISIANA POST AUTHORIZATION CHANGE STUDY
Delaware River Basin Commission s Role in Flood Loss Reduction Efforts
 Delaware River Basin Commission s Role in Flood Loss Reduction Efforts There is a strong need to reduce flood vulnerability and damages in the Delaware River Basin. This paper presents the ongoing role
Appendix D Economic Analysis
 Westchester County Streams, Byram River Basin Flood Risk Management Fairfield County, Connecticut and Westchester County, New York Draft Integrated Feasibility Report & Environmental Impact Statement Appendix
DuPage County East Branch DuPage River Resiliency Project. Benefit Cost Analysis
 DuPage County East Branch DuPage River Resiliency Project Benefit Cost Analysis 1.0 Benefit Cost Analysis Preparation The BCA for this proposal was a collaborative effort between DuPage County, V3 engineering
The Breadth of the Planning Portfolio
 The Breadth of the Planning Portfolio Travis Creel, Planner, Regional Planning and Environmental Division South, MVD Eric Halpin, Special Assistant for Dam and Levee Safety, HQUSACE Lisa Kiefel, PCoP,
Minimum Standards For USACE Evaluation of Levee Systems For the National Flood Insurance Program
 Minimum Standards For USACE Evaluation of Levee Systems For the National Flood Insurance Program Christopher N. Dunn, P.E., Director Hydrologic Engineering Center ASCE Water Resource Group 20 October,
BUTTS COUNTY, GEORGIA AND INCORPORATED AREAS
 BUTTS COUNTY, GEORGIA AND INCORPORATED AREAS Butts County Community Name Community Number BUTTS COUNTY (UNICORPORATED AREAS) 130518 FLOVILLA, CITY OF 130283 JACKSON, CITY OF 130222 JENKINSBURG, TOWN OF
Corps Water Management System (CWMS)
") Corps Water Management System (CWMS) Real-Time Decision Support Modeling & Mapping Inter-Agency Flood Risk Characterization Workshop Christopher N. Dunn, P.E., D. WRE, Director Hydrologic Engineering Center
Corps Water Management System (CWMS) Real-Time Decision Support Modeling & Mapping Inter-Agency Flood Risk Characterization Workshop Christopher N. Dunn, P.E., D. WRE, Director Hydrologic Engineering Center
SWIF TO THE RESCUE. Patty Robinson Ike Pace, PE WATER NATURAL RESOURCES ENVIRONMENT INFRASTRUCTURE ENERGY
 SWIF TO THE RESCUE Patty Robinson Ike Pace, PE WATER NATURAL RESOURCES ENVIRONMENT INFRASTRUCTURE ENERGY AGENDA USACE Programs PL 84 99 (Rehabilitation & Inspection Program, RIP) Levee Safety Program (Routine,
Presented by: Connie Perkins, PE, CFM April 20, 2016
 Presented by: Connie Perkins, PE, CFM April 20, 2016 City of Sacramento s Flood History Need for a Comprehensive Flood Management Plan (CFMP) Overview of Sacramento s CFMP 2016 Next Steps Sacramento
REQUEST FOR QUALIFICATIONS FOR ON-CALL PROJECT MANAGEMENT AND TECHNICAL SUPPORT SERVICES
 REQUEST FOR QUALIFICATIONS FOR ON-CALL PROJECT MANAGEMENT AND TECHNICAL SUPPORT SERVICES SEPTEMBER 2018 Submit proposal to: Tony Williams, Principal Civil Engineer Marin County Flood Control & Water Conservation
SECTION 9: MAPS AND DATA
 SECTION 9: MAPS AND DATA Contents 9.1. NFIP Maps and Data... 9-2 9.1.1. Adopting and enforcing NFIP floodplain maps and data... 9-2 9.1.2. Adopting and enforcing more restrictive data... 9-2 9.1.3. Annexations...
Upper Joachim Creek Public Survey on Potential Flood Risk Reduction
 Upper Joachim Creek Public Survey on Potential Flood Risk Reduction This survey is intended to help the interagency planning committee to receive public feedback on specific flood risk reduction techniques,
DES MOINES CITY OF TWO RIVERS. Flooding Risk & Impact to Development
 DES MOINES CITY OF TWO RIVERS Flooding Risk & Impact to Development River System Des Moines Flood Protection Des Moines Flood Protection cont. Infrastructure Over 24 miles of levees 21stormwater pump stations
Sutter Basin Pilot Feasibility Report - Environmental Impact Report / Supplemental Environmental Impacts Statement
 Sacramento District Planning Division Sutter Basin Pilot Feasibility Report - Environmental Impact Report / Supplemental Environmental Impacts Statement Butte and Sutter Counties, California APPENDIX A
Model Development to Support Assessment of Flood Risk for the Columbia River Treaty Review
 Model Development to Support Assessment of Flood Risk for the Columbia River Treaty Review 2012 AWRA Washington State Conference Sara Marxen, P.E. U.S. Army Corps of Engineers Seattle District September,
GENERAL PLAN AMENDMENT # FLOOD HAZARDS
 GENERAL PLAN AMENDMENT #2011-03 FLOOD HAZARDS The following text that appears on pages HS 3-4 of the Health and Safety Element in the Yolo 2030 Countywide General Plan has been amended. New language is
DEPARTMENT OF THE ARMY EM U.S. Army Corps of Engineers CECW-EH-Y Washington, DC
 DEPARTMENT OF THE ARMY EM 1110-2-1619 U.S. Army Corps of Engineers CECW-EH-Y Washington, DC 20314-1000 Manual No. 1110-2-1619 1 August 1996 Engineering and Design RISK-BASED ANALYSIS FOR FLOOD DAMAGE REDUCTION
DECATUR COUNTY, GEORGIA AND INCORPORATED AREAS
 DECATUR COUNTY, GEORGIA AND INCORPORATED AREAS Community Name Community Number ATTAPULGUS, CITY OF 130541 BAINBRIDGE, CITY OF 130204 BRINSON, TOWN OF 130670 CLIMAX, CITY OF 130542 DECATUR COUNTY (UNINCORPORATED
The AIR Inland Flood Model for Great Britian
 The AIR Inland Flood Model for Great Britian The year 212 was the UK s second wettest since recordkeeping began only 6.6 mm shy of the record set in 2. In 27, the UK experienced its wettest summer, which
Subject: Upper Merrimack and Pemigewasset River Study Task 9 - Water Supply Evaluation
 Memorandum To: From: Barbara Blumeris, USACE Ginger Croom and Kirk Westphal, CDM Date: April 14, 2008 Subject: Upper Merrimack and Pemigewasset River Study Task 9 - Water Supply Evaluation Executive Summary
REVIEW PLAN. Swope Park Industrial Area Flood Damage Reduction Project Kansas City, Missouri
 REVIEW PLAN Swope Park Industrial Area Flood Damage Reduction Project Kansas City, Missouri Post Authorization Change Report/ Limited Reevaluation Report Decision Document Kansas City District Northwestern
Abstract. An assessment of the benefits of DWR s levee inspection program in California s Central Valley
 An assessment of the benefits of DWR s levee inspection program in California s Central Valley At left: Crew members place sandbags during flood fighting effors (DWR). By David Ford, PhD, PE, D.WRE; Joanna
The AIR Inland Flood Model for the United States
 The AIR Inland Flood Model for the United States In Spring 2011, heavy rainfall and snowmelt produced massive flooding along the Mississippi River, inundating huge swaths of land across seven states. As
Passaic River Flood Risk Management Projects
 Passaic River Flood Risk Management Projects EPA Lower Passaic River Community Advisory Group Tom Shea, PMP Project Manager 12 March 2015 US Army Corps of Engineers Passaic River Main Stem Project Studies
CHAPTER 3. Corps Civil Works Missions
 CHAPTER 3 Corps Civil Works Missions 3-1. Purpose and Authorities. Federal interest in water resources development is established by law. Within the larger Federal interest in water resource development,
7. Understand effect of multiple annual exposures e.g., 30-yr period and multiple independent locations yr event over 30 years 3%
 I. FLOOD HAZARD A. Definition 1. Hazard: probability of water height 2. At a Specific XY floodplain location; 3. Z can be expressed as elevation (NAVD88); gauge height; height above ground (depth). 4.
ASFPM Partnerships for Statewide Mitigation Actions. Alicia Williams GIS and HMP Section Manager, Amec Foster Wheeler June 2016
 ASFPM Partnerships for Statewide Mitigation Actions Alicia Williams GIS and HMP Section Manager, Amec Foster Wheeler June 2016 Summary The Concept Leveraging Existing Data and Partnerships to reduce risk
Risk Analysis for Flood Damage Reduction Studies. Davis, California. Course Objectives
 Risk Analysis for Flood Damage Reduction Studies Davis, California Course Objectives The Risk Analysis for Flood Damage Reduction Studies course presents risk concepts and analysis methods required by
IN THE LITTLE APPLE A PRESENTATION FOR THE 2017 ASFPM ANNUAL CONFERENCE IN KANSAS CITY, MO, MANAGING FLOOD RISK IN THE HEARTLAND
 A PRESENTATION FOR THE 2017 ASFPM ANNUAL CONFERENCE IN KANSAS CITY, MO, MANAGING FLOOD RISK IN THE HEARTLAND NONSTRUCTURAL 237 217 200 ASSESSMENT 80 252 237 217 200 119 174 237 217 200 27.59 IN THE LITTLE
Trinity River Restoration Program
 Trinity River Restoration Program Trinity River Bridges: Hydraulic, Scour, and Riprap Sizing Analysis US DEPARTMENT OF THE INTERIOR BUREAU OF RECLAMATION TECHNICAL SERVICE CENTER Prepared by Kent L. Collins
The City of El Paso APPENDIX D DAM RISK INVENTORY ASSESSMENT
 APPENDIX D DAM RISK INVENTORY ASSESSMENT March 2009 Appendix D - Dam Risk Inventory Assessment Section Table of Contents Page D.1.0 DAM RISK INVENTORY ASSESSMENT... 1 D.1.1 Methodology... 1 D.1.2 Dam
University Drive Flood Risk Management Project Phase I 58 th Ave S to 500 S of 64 th Ave S City of Fargo Project FM-15-C1
 University Drive Flood Risk Management Project Phase I 58 th Ave S to 500 S of 64 th Ave S City of Fargo Project FM-15-C1 Public Informational Meeting October 15, 2015 6:00 P.M. Overview Flood Risk FEMA
DEPARTMENT OF THE ARMY. u.s. ARMY CORPS OF ENGINEERS 441 G STREET NW WASHINGTON DC DIRECTOR OF CIVIL WORKS' POLICY MEMORANDUM CWPM
 DEPARTMENT OF THE ARMY u.s. ARMY CORPS OF ENGINEERS 441 G STREET NW WASHINGTON DC 20314-1000 MAR 8 2012 CECW-P DIRECTOR OF CIVIL WORKS' POLICY MEMORANDUM CWPM 12-001 SUBJECT: Methodology for Updating Benefit-to-Cost
Risk Based Approaches for Levees in the U.S. and Abroad: Lessons for the NFIP
 Proud Platinum Sponsor of the ASFPM 2017 Annual Conference Risk Based Approaches for Levees in the U.S. and Abroad: Lessons for the NFIP Mike Seering (AECOM) David Powers (HR Wallingford) ASFPM 2017 Annual
DECISION DOCUMENT REVIEW PLAN USING THE NATIONAL PROGRAMMATIC REVIEW PLAN MODEL
 DECISION DOCUMENT REVIEW PLAN USING THE NATIONAL PROGRAMMATIC REVIEW PLAN MODEL For Section 506, Water Resources Development Act of 2000, as Amended Great Lakes Fishery and Ecosystem Restoration (GLFER)
Levee Safety The Middle Age Of Levee Safety Development
 Levee Safety The Middle Age Of Levee Safety Development HDR Showcase Panel Discussion June 22, 2016 Living the Current Changing Regulatory Climate by Roger Less, PE, CFM Overview of Section 408 Permit
INSTRUCTIONS FOR COMPLETING THE APPLICATION FORMS FOR CONDITIONAL LETTERS OF MAP REVISION AND LETTERS OF MAP REVISION
 INSTRUCTIONS FOR COMPLETING THE APPLICATION FORMS FOR CONDITIONAL LETTERS OF MAP REVISION AND LETTERS OF MAP REVISION GENERAL In 1968, the U.S. Congress passed the National Flood Insurance Act, which created
SOUTH SAN FRANCISCO BAY SHORELINE PHASE I STUDY ALVISO PONDS AND SANTA CLARA COUNTY, CA. Economics Appendix. (Appendix C to Feasibility Report/EIS)
") SOUTH SAN FRANCISCO BAY SHORELINE PHASE I STUDY ALVISO PONDS AND SANTA CLARA COUNTY, CA Economics Appendix (Appendix C to Feasibility Report/EIS) U.S. Army USACE of Engineers San Francisco District i Table
SOUTH SAN FRANCISCO BAY SHORELINE PHASE I STUDY ALVISO PONDS AND SANTA CLARA COUNTY, CA Economics Appendix (Appendix C to Feasibility Report/EIS) U.S. Army USACE of Engineers San Francisco District i Table
SITES Project Overview
 SITES Project Overview 2016 J u l y 2 0 D r a f t, p l a n n i n g p h a s e c o n c e p t s July 2016 Page 1 Why Sites? If the reservoir operated in 2016: * 1,065,000 347 * CA Rice Commission CA Rice
Table 1: Federal, State and Local Government Rules applicable to LOMRs/CLOMRS submittal
 MnDNR LOMC Guide This document has been prepared by the Minnesota Department of Natural Resources floodplain staff and is intended to provide assistance with LOMR/CLOMR submittals. This information is
Department of the Army U.S. Army Corps of Engineers Washington, DC
 CECW-CP CECW-CE Engineer Regulation 1105-2-101 Department of the Army U.S. Army Corps of Engineers Washington, DC 20314-1000 Planning RISK ASSESSMENT FOR FLOOD RISK MANAGEMENT STUDIES Distribution Restriction
New Tools for Mitigation & Outreach. Louie Greenwell Stantec
 New Tools for Mitigation & Outreach Louie Greenwell Stantec Our Discussion Today Background What is Risk MAP? FEMA Products Overview of RiskMAP Data Sets Changes Since Last FIRM Depth and Analysis Grids
UPPER SUSQUEHANNA RIVER BASIN FLOOD RISK MANAGEMENT FEASIBILITY STUDY
 UPPER SUSQUEHANNA RIVER BASIN FLOOD RISK MANAGEMENT 255 255 255 237 237 237 0 0 0 217 217 217 163 163 163 200 200 200 131 132 122 239 65 53 80 119 27 FEASIBILITY STUDY 110 135 120 252 174.59 112 92 56
Flood Risk Management and Columbia River Treaty Review
 Flood Risk Management and Columbia River Treaty 2014 2024 Review Lower Columbia River Estuary Partnership 2013 Science to Policy Summit: The Columbia River Treaty May 10, 2013 Matt Rea Treaty Review Program
Kentucky Division of Water Permitting Floodplain Overview and Considerations
 Kentucky Division of Water Permitting Floodplain Overview and Considerations Presentation to: 2014 KAMM Conference Lake Barkley State Resort Park by Solitha Dharman Department for Environmental Protection
[Letter to be printed on official Levee Sponsor letterhead]
![[Letter to be printed on official Levee Sponsor letterhead]](/thumbs/84/89135049.jpg "[Letter to be printed on official Levee Sponsor letterhead]") [Letter to be printed on official Levee Sponsor letterhead] [Date] COL Joel R. Cross, Commander US Army Corps of Engineers, Omaha District 1616 Capitol Avenue Omaha, Nebraska 68102-4901 RE: [Levee Sponsor
[Letter to be printed on official Levee Sponsor letterhead] [Date] COL Joel R. Cross, Commander US Army Corps of Engineers, Omaha District 1616 Capitol Avenue Omaha, Nebraska 68102-4901 RE: [Levee Sponsor
Chapter 6 - Floodplains
 Chapter 6 - Floodplains 6.1 Overview The goal of floodplain management is to reduce the potential risks to both existing and future developments, and infrastructure, in the 100-year floodplain. Over the
Flood Resilience Study Findings
 Services of the San Francisco Public Utilities Commission Flood Resilience Study Findings Presentation to Citizens Advisory Committee Special Session May 17, 2016 Stefani Harrison, Project Manager 1 Agenda
Norfolk Flood Risk Management Study
 Old Dominion University ODU Digital Commons May 18, 2016: The Economic Impacts of Sea-Level Rise in Hampton Roads Hampton Roads Intergovernmental Pilot Project: Meetings 5-18-2016 Norfolk Flood Risk Management
Appendix B ECONOMIC CONSIDERATIONS: B-01 Areas of Consideration: B-02 General Computational Procedures:
 Appendix B ECONOMIC CONSIDERATIONS: B-01 Areas of Consideration: The study area comprises a stretch of the west bank of the Rio Grande extending from Bridge Blvd. south to the I-25 crossing over the Rio
Improving Flood Hazard Identification & Flood Risk Communication: Lessons Learned from Dam Failures in South Carolina
 Improving Flood Hazard Identification & Flood Risk Communication: Lessons Learned from Dam Failures in South Carolina Katy Goolsby-Brown June 23, 2016 1 Dam Failure Incidents in South Carolina SC Dam Failures
ATR REVIEW PLAN USING THE NWD ATR REVIEW PLAN TEMPLATE
 ATR REVIEW PLAN USING THE NWD ATR REVIEW PLAN TEMPLATE Project Name: Project Location: Kanopolis Dam, KS Project P2 Number: 351875 Project Manager or POC Name: Chance Bitner NWD Original Approval Date:
Overview of Capabilities and Current Limitations
 Overview of Capabilities and Current Limitations Overview of the National Flood Risk Characterization Tool (NFRCT) Map based viewer of relative flood risk around the U.S., with supporting reports for more
Frequently Asked Questions Oxbow / Hickson / Bakke Ring Levee Option
 Frequently Asked Questions Oxbow / Hickson / Bakke Ring Levee Option October 16, 2012 Q1. Why has the position on a ring-levee changed? The feasibility study recommended buy-outs for areas with staging
Peer Review Plan. Bastrop Interim Feasibility Study. Lower Colorado River Basin, Texas
 U.S. Army Corps of Engineers Fort Worth District Peer Review Plan Bastrop Interim Feasibility Study Lower Colorado River Basin, Texas September 28, 2007 PEER REVIEW PLAN BASTROP INTERIM FEASIBILITY STUDY
Technical Memorandum 3.4 E Avenue NW Watershed Drainage Study. Appendix E Floodplain Impacts and Implications Memo
 Technical Memorandum 3.4 E Avenue NW Watershed Drainage Study Appendix E Floodplain Impacts and Implications Memo September 8, 2017 City of Cedar Rapids E Avenue Watershed Drainage Study Memo Date: Tuesday,
REVIEW PLAN USING THE NWD MODEL REVIEW PLAN
 REVIEW PLAN USING THE NWD MODEL REVIEW PLAN for Continuing Authorities Program Section 103, 205 and projects directed by guidance to use CAP procedures Alki Seawall Erosion Control Project Seattle, WA
CONGRESSIONAL DISTRICT: IN 03
 CONGRESSIONAL DISTRICT: IN 03 80 Steuben Lagrange Angola 69 Kendallville DeKalb Noble Garrett Auburn Kosciusko Warsaw Dam Safety Program (All COE Indiana Dams) Columbia City Allen Whitley Fort Wayne New
REVIEW PLAN. Cedar Bayou, Texas Dredged Material Management Plan
 REVIEW PLAN Cedar Bayou, Texas Dredged Material Management Plan Galveston District MSC Approval Date: 16 November 2012 Last Revision Date: none REVIEW PLAN Cedar Bayou, Texas Dredged Material Management
Wetzel County Floodplain Ordinance
 Wetzel County Floodplain Ordinance AUTHORITY AND PURPOSE: THE PROVISIONS OF THIS ORDINANCE HAVE BEEN PREPARED WITH THE INTENTION OF MEETING THE REQUIREMENTS OF SECTION 60.3 (D) OF THE NATIONAL FLOOD INSURANCE
DAM SAFETY REMEDIATION LETTER REPORT
 REVIEW PLAN DAM SAFETY REMEDIATION LETTER REPORT SUCCESS DAM, CALIFORNIA DAM SAFETY ASSURANCE PROGRAM SACRAMENTO DISTRICT July 6, 2010 ii REVIEW PLAN DAM SAFETY MODIFICATION REPORT SUCCESS DAM, CALIFORNIA
Figure 4-1. ARB IRWMP Governance Structure
 Sec t i on4 I RWMPGov er nanc e o nt e m a r c Sa n o i eg R B AR Contents Contents 4. IRWMP GOVERNANCE... 4-1 4.1. Background... 4-1 4.2. ARB Structure... 4-2 4.2.1. Planning Forum... 4-3 4.2.2. Advisory
JANUARY 13, ILL. ADM. CODE CH. I, SEC TITLE 17: CONSERVATION CHAPTER I: DEPARTMENT OF NATURAL RESOURCES SUBCHAPTER h: WATER RESOURCES
 TITLE 17: CONSERVATION CHAPTER I: DEPARTMENT OF NATURAL RESOURCES SUBCHAPTER h: WATER RESOURCES PART 3702 CONSTRUCTION AND MAINTENANCE OF DAMS Section Page No. 3702.10 Purpose 2 3702.20 Definitions 3 3702.30
DAM SAFETY MODIFICATION REPORT
 REVIEW PLAN DAM SAFETY MODIFICATION REPORT MARTIS CREEK DAM, CALIFORNIA DAM SAFETY ASSURANCE PROGRAM SACRAMENTO DISTRICT July 7, 2010 ii REVIEW PLAN DAM SAFETY MODIFICATION REPORT MARTIS CREEK DAM, CALIFORNIA
Action Items for Flood Risk Management on Wildcat Creek Interagency success with floodplain management plans and flood forecast inundation maps
 Presentation to USACE 2012 Flood Risk Management and Silver Jackets Joint Workshop, Harrisburg, Pennsylvania Action Items for Flood Risk Management on Wildcat Creek Interagency success with floodplain
SR-210 MIXED FLOW LANE ADDITION PROJECT EA NO. 0C7000 FROM HIGHLAND AVENUE TO SAN BERNARDINO AVENUE. Prepared for. December 2012.
 S A N T A A N A R I V E R L O C A T I O N H Y D R A U L I C S T U D Y SR-210 MIXED FLOW LANE ADDITION PROJECT FROM HIGHLAND AVENUE TO SAN BERNARDINO AVENUE EA NO. 0C7000 Prepared for San Bernardino Associated
Skagit County Flood Insurance Study Update. Ryan Ike, CFM FEMA Region 10
 Skagit County Flood Insurance Study Update Ryan Ike, CFM FEMA Region 10 Skagit County Flood Insurance Study Process Overview Process, Schedule, & Deliverables Base Flood Elevations, Modeling, & Levees
DECISION DOCUMENT REVIEW PLAN USING THE NATIONAL PROGRAMMATIC REVIEW PLAN MODEL
 DECISION DOCUMENT REVIEW PLAN USING THE NATIONAL PROGRAMMATIC REVIEW PLAN MODEL for Continuing Authorities Program Section 14, 107, 111, 204, 206, 208 and 1135 Projects Archer Highway Twin Bridges, Madison
Vocabulary of Flood Risk Management Terms
 USACE INSTITUTE FOR WATER RESOURCES Vocabulary of Flood Risk Management Terms Appendix A Leonard Shabman, Paul Scodari, Douglas Woolley, and Carolyn Kousky May 2014 2014-R-02 This is an appendix to: L.
DECISION DOCUMENT REVIEW PLAN Consistent with the National Programmatic Review Plan Model
 Continuing Authorities Program Section 14, Flood Control Act of 1946, as amended Emergency Streambank and Shoreline Protection Projects DECISION DOCUMENT REVIEW PLAN Consistent with the National Programmatic
Lincoln Draw City of Hays, Kansas. Feasibility Report and Environmental Assessment Review Plan
 City of Feasibility Report and Environmental Assessment Review Plan Continuing Authorities Program Section 205 of the Flood Control Act of 1948 Northwestern Division Kansas City District P2 Project Number:
HOLMES COUNTY, FLORIDA AND INCORPORATED AREAS
 HOLMES COUNTY, FLORIDA AND INCORPORATED AREAS Community Name Community Number BONIFAY, CITY OF 120116 ESTO, TOWN OF 120630 HOLMES COUNTY (UNINCORPORATED AREAS) 120420 NOMA, TOWN OF 120631 PONCE DE LEON,
USACE Levee Screening Tool Understanding the Classification
 USACE Levee Screening Tool Understanding the Classification Richard J. Varuso, Ph.D., P.E. Deputy Chief, Geotechnical Branch Levee Safety Program Manager USACE - New Orleans District 17 Nov 2011 US Army
Appendix C: Economics
 Shrewsbury River Basin, Sea Bright, New Jersey Coastal Storm Risk Management Feasibility Study Draft Integrated Feasibility Report & Environmental Assessment Appendix C: Economics Shrewsbury River Basin,
PROJECT REVIEW PLAN INDEPENDENT TECHNICAL REVIEW AND EXTERNAL PEER REVIEW
 PROJECT REVIEW PLAN INDEPENDENT TECHNICAL REVIEW AND EXTERNAL PEER REVIEW WHITE OAK BAYOU FEDERAL FLOOD CONTROL PROJECT HARRIS COUNTY, TEXAS HARRIS COUNTY FLOOD CONTOL DISTRICT/GALVESTON DISTRICT-USACE
Living with levees: using tolerable risk guidelines in California
 Living with levees: using tolerable risk guidelines in California Jessica Ludy, CFM. Arcadis-U.S. Inc. Larry Roth, G.E., P.E., Arcadis-US, Inc. Dustin Jones, P.E., Delta Stewardship Council 1 Hoogwater
Rahway River Basin, New Jersey. Coastal Storm Risk Management Feasibility Study
 Draft Economic Appendix New Jersey Department of Environmental Protection U.S. Army Corps of Engineers New York District May 2017 Table of Contents 1 Introduction... 1 2 Description of Study Area... 1