Appendix A Economic Analysis Appendix
|
|
|
- Evan Garrett
- 6 years ago
- Views:
Transcription
1 Appendix A: Economic Analysis Appendix Appendix A Economic Analysis Appendix A-1
2 Appendix A: Economic Analysis Appendix A-2
3 Appendix A: Economic Analysis Appendix Table of Contents 1 INTRODUCTION PURPOSE OF THE STUDY STUDY AREA CHARACTERISTICS OF THE STUDY AREA DEMOGRAPHIC DATA HOUSING AND FAMILIES Housing Families EMPLOYMENT AND LABOR FORCE Employment Labor Force DEMOGRAPHIC AND ECONOMIC PROJECTIONS ECONOMIC EVALUATION PROCEDURES, ASSUMPTIONS, AND METHODOLOGIES HYDROLOGIC AND HYDRAULIC MODELING FOR ECONOMIC EVALUATIONS Determining the H&H Conditions for Base and Future Economic Modeling Base and Most Likely Future Year Economic Modeling FIRST FLOOR ELEVATIONS STRUCTURE AND CONTENT VALUES General Assumptions for Most Likely Future Conditions Structure and Contents Vehicles DEPTH DAMAGE FUNCTIONS Residential Commercial, Industrial, and Public Structures Vehicles Mailed Surveys REACH CHARACTERISTICS Reach E Reach E Reach E A-3
4 Appendix A: Economic Analysis Appendix Reach E Reach E Reach E DAMAGE CALCULATIONS WITHOUT PROJECT CONDITION Structures, Contents, and Autos: EAD and Single Event Damages Other Damages TRANSPORTATION DELAY ANALYSIS BENEFIT ANALYSIS NON-STRUCTURAL MEASURES ANALYSIS First Round Second Round Third Round STRUCTURAL MEASURES ANALYSIS Detention Basins Plan G Plan J FLOOD DAMAGE REDUCTION TO RESIDENTIAL AND NONRESIDENTIAL PROPERTIES Detention Basins Plan G Plan J INDUCED DAMAGES SUMMARY OF BENEFITS RISK AND UNCERTAINTY ANALYSIS First Floor Elevations Structure Value Content Value Vehicle Value H&H Exceedance Probability Functions H&H Stage-Discharge Function Depth-Percent Damage Functions A-4
5 Appendix A: Economic Analysis Appendix 4.7 CONSEQUENCE OF PROJECT EXCEEDANCE AND RESIDUAL RISK COST ANALYSIS CONSTRUCTION COST OPERATIONS AND MAINTENANCE INTEREST DURING CONSTRUCTION BENEFIT/COST EVALUATION OF PLANS Detention Basins Plan G Plan J BENEFITS OUTSIDE OF FEDERAL INTEREST ANALYSIS OF ECONOMIC VIABILITY Sensitivity of Hydrology Monte Carlo Analysis of Viability FINANCIAL ANALYSIS COST APPORTIONMENT ABILITY TO PAY FINANCIAL CAPABILITY PLAN FOR ECONOMIC UPDATES Figures Figure 1: Economic Reaches...9 Figure 2: Spreadsheet Calculations of EAD Figure 3: Detention Basins Figure 4: Project Performance, Without Project Figure 5: Project Performance, Detention Basins Figure 6: Project Performance, Plan G Figure 7: Project Performance, Plan J Figure 8: Cost Estimate for Plan G2 and Detention Basins Figure 9: Cost Estimate for Plan J and Detention Basins Figure 10: OMRR&R for G2 and Detention Figure 11: OMRR&R for J and Detention Figure 12: Economic Reaches... Error! Bookmark not defined. Figure 13: Probability of Economic Viability at 3.75%... Error! Bookmark not defined. A-5
6 Appendix A: Economic Analysis Appendix Figure 14: Probability of Positive Net Benefits at 3.75% Figure 15: Probability of Economic Viability at 7%... Error! Bookmark not defined. Figure 16: Probability of Positive Net Benefits at 7%... Error! Bookmark not defined. Tables Table 1: Streams and Reaches Included in the Springfield Study Area...9 Table 2: Population Change Table 3: Population Characteristics of Springfield, MO Table 4: Housing and Vehicles Table 5: Family Data Table 6: Total and Part-Time Employment by Major Industry Sector by Place of Work, Table 7: Employment Status Table 8: Greene County Population and Employment Forecast Table 9: Land Development for 1996 to Future Period Table 10: Land Development, Average Acres per Time Period Table 11: Business Establishments and Employment in Springfield, Missouri Table 12: Residential Structures Table 13: Commercial and Industrial Structures Table 14: Public Structures Table 15: Parking Lots Table 16: Structure Inventory Table 17: Equivalent Annual Damages, Without Project Table 18: Single Event Damages, Without Project Condition Table 19: Emergency Costs, 1/10 ACE Table 20: Equivalent Annual Damages, Infrastructure Damages, Without Project Table 21: Non-Structural Analysis for Footprint Plans Table 22: Further Analysis for Non-Structural Footprint Plan Table 23: Benefits and BCR for Plans A through G, Early Formulation Table 24: Benefits and BCR for Plans H and I, Recent Formulation Table 25: Single Event Damages, Detention Basins Table 26: EAD, Detention Plan Table 27: EAD, Plan G Table 28: Single Event Damages, Plan G Table 29: EAD, Plan J Table 30: Single Event Damages, Plan J A-6
7 Appendix A: Economic Analysis Appendix Table 31: Benefits of Detention Basins Table 32: Benefits of Plan G Table 33: Benefits of Plan J Table 34: Benefits Compared Table 35: Residual Flooding, Plan J Table 36: Detention Basin Benefits and Costs Table 37: Plan G2 Benefits and Costs Table 38: Plan G2, Benefits and Costs for All Reaches Table 39: Plan J Benefits and Costs Table 40: Plan J, Benefits and Costs for All Reaches Table 41: Structure Inventory, Including E0-N AND E0-S Table 42: EAD, Without Project, Including E0-N AND E0-S Table 43: EAD, Infrastructure Damages, Without Project, Including E0-N AND E0-S Table 44: EAD, Plan J, Including E0-N and E0-S Table 45: Benefits of Plan J, Including E0-N and E0-S Table 46: Plan G2 and Plan J Benefits and Costs, Including E0-N and E0-S Table 47: Sensitivity Test: Plan G2 and Plan J Benefits and Costs, 2003 Hydrology Table 48: Expected and Probabilistic Values of Net Benefits Table 49: Expected and Probabilistic Benefit/Cost Ratios A-7
8 Appendix A: Economic Analysis Appendix 1 INTRODUCTION The Economic Analysis Appendix provides information on the methodologies and details of the economic analysis conducted for the Jordan Creek Flood Risk Management (FRM) Study, Springfield, Missouri (Study). Additional information regarding the Study can be found in the main report and appendices of the Study. 1.1 PURPOSE OF THE STUDY This appendix describes the economic analysis of project alternatives for providing flood risk management measures for the city of Springfield, Missouri. The purpose is to provide a comprehensive review of the methodology applied and results of the economic analysis performed on the FRM alternatives for the Study. 1.2 STUDY AREA Springfield is the county seat of Greene County and the third largest city in Missouri. The study area is located within the White River Basin, extending approximately six miles along Jordan Creek. Jordan Creek, including North Branch and South Branch Jordan Creek, at its confluence with Wilsons Creek has a square mile drainage basin. The project area is generally centered on the Chestnut Expressway between U.S. Highway 65 to the east and U.S. Highway 160 to the west in the northern half of the city of Springfield. The study area includes Jordan Creek, North Branch Jordan Creek, South Branch Jordan Creek and the upstream portion of Wilsons Creek. Substantial residential, commercial, and industrial development has occurred on the floodplain, with continuing development primarily in the south part of the city. The principal flood problem is insufficient channel size, whether vertical wall culverts, open channels, or narrow bridges. The increase in flood heights resulting from development and the absence of a storm system is also significant. Flood runoff from the headwaters of the North and South Branches of Jordan creek affects flood heights along Jordan Creek, as well as its outfall, Wilsons Creek. Typically, area rainfall is fairly heavy and well distributed throughout the year. Historical flood events indicate that flooding along the basin is flashy in nature with the water rising to maximum flows in about an hour and then receding over the next few hours. Flooding will continue along the entire length of the study area, causing additional economic damages to residential, commercial, light industrial, and public property. Jordan Creek runs through the downtown business district, residential neighborhoods, city parks, and commercial and industrial areas. For analysis purposes, the Study area was delineated into reaches, all of which exhibit fairly dense urban land use. Figure 1 illustrates the delineation of the reaches and Table 1 lists the reaches by title, description, and river stationing. A-8
9 Appendix A: Economic Analysis Appendix Figure 1: Economic Reaches Table 1: Streams and Reaches Included in the Springfield Study Area Reach Name Description Beginning Station E1 Industrial area on the most downstream end of the Lower Branch (including a large pharmaceutical manufacturer with a floodwall protecting up to the 1/10 Annual Chance Exceedance event) 29, on Wilsons Creek E2 E3 E4 E5 E6 Mixed industrial and residential area in the center of the Lower Branch Downtown Springfield on the upstream end of the Lower Branch Industrial area on the downstream end of the North Branch Residential area on the upper end of the North Branch Heavily Industrial area on the South Branch. Only reach on South Branch 3, on Lower Branch of Jordan Creek 11, on Lower Branch of Jordan Creek 0.00 on North Branch of Jordan Creek 2, on North Branch of Jordan Creek 0.00 on South Branch of Jordan Creek A-9
10 Appendix A: Economic Analysis Appendix 2 CHARACTERISTICS OF THE STUDY AREA 2.1 DEMOGRAPHIC DATA Population is one parameter of community change. As the population in an area increases or decreases, so does the demand for infrastructure. Population estimates from the 2010 US Census shows growth in Missouri and significant growth in Greene County. This data is shown in Table 2. Table 2: Population Change Population Population Population Change Location Greene County 240, , % Missouri 5,595,211 5,988, % United States 281,421, ,006, % Data source: 2000 and 2010 US Census As shown in Table 2, from , Greene County s population grew over 14 percent while Missouri grew about 7 percent. The national population grew just over 9 percent along the same period of time. Such rapid growth in population greatly increases the demand for public services and infrastructure such as schools, roads, medical care facilities, etc. More detailed Springfield population characteristics are listed in Table 3. A-10
11 Appendix A: Economic Analysis Appendix Table 3: Population Characteristics of Springfield, MO Estimate Percent U.S. Total Population 159, White 141, % 72.4% Black or African American 6, % 12.6% American Indian or Alaska Native 1, % 0.9% Asian 3, % 4.8% Native Hawaiian and Other Pacific Islander % 0.2% Some other race 1, % 6.2% Two or more races 5, % 2.9% Age Under 18 years 24, % 24% between 18 and 64 years 112, % 63% 65 years and over 23, % 13% Income (2010 Dollars)* Median per capita money income (last 12 months) 20,793-27,334 Median housing value (owner occupied) 103, ,400 Persons below poverty level % 13.8% Unemployment rate*** 5.5 % 7.8% Education level for those over 25 years old* - - High school graduate and over % 85% Bachelor's degree or higher % 27.9% Data source: US Census 2010 estimates *Data source: US Census 2010 American Community Survey, Selected Social Characteristics, 5-year estimates: As Table 3 shows, the population in the study area is primarily white and slightly older than the United States population on average. Although, the median per capita income in Springfield is only 76 percent of the national median, the population is not as poor as these numbers suggest. The median housing value is 55 percent of the national median. If housing values are used as a rough measure of cost of living, then although the per capita income is lower than the nation as a whole, it is offset by a reduction in the cost of living. The percentage of persons in Springfield below the poverty level is significantly higher than the national rate. In September 2012, Springfield had an unemployment rate of 5.5 percent compared to 6.9 percent for Missouri and 7.8 percent nationally. Although Springfield has a slightly higher rate of those completing high school than the national rate, of those aged 25 and older, the rate of earning a bachelor s degree or higher is slightly lower than the national rate. 2.2 HOUSING AND FAMILIES Housing Springfield has approximately the same percentage of occupied housing units as the nation as a whole, but significantly fewer of the housing units are owner-occupied. The average household size for both owner- A-11
12 Appendix A: Economic Analysis Appendix occupied and renter-occupied housing units is smaller than the national average. Housing data is presented in Table 4. Table 4: Housing and Vehicles Springfield Estimate % U.S. Estimate Total Housing Units* 76, ,704,730 Occupied housing units 70, % Owner occupied housing units 35, % Average household size of owner-occupied Average household size of renter-occupied Vehicles Available in Occupied Housing Units* No Vehicle 6, % 1 vehicles 30, % 2 vehicles 25, % 3 or more vehicles 7, % Data source: US Census Quick Facts, American Community Survey, October 2012 *Data source: US Census American Community Survey, Selected Housing Characteristics, 5 year estimates: Families The city of Springfield has fewer households residing as families than the nation as a whole, with fewer households with individuals under 18 years old and fewer houses with individuals over 65 years old. Springfield has a smaller average household size than the nation as a whole. Family data is in Table 5. Table 5: Family Data Springfield Estimate % U.S. Estimate Total Households 69, ,716,292 Family Households 35, % Households with individuals under 18 years 16, % Households with individuals 65 years and over 16, % Average household size Data Source: US Census Quick Facts, American Community Survey, October EMPLOYMENT AND LABOR FORCE Employment The distribution of employment in Springfield is representative of the nation as a whole, except for lower percentages in manufacturing and construction and greater percentages in service related industries, as shown in Table 6. A-12
13 Appendix A: Economic Analysis Appendix Table 6: Total and Part-Time Employment by Major Industry Sector by Place of Work, 2010 Employment Springfield U.S. Estimate Estimate Total Employment 77, ,833,331 Percent Distribution of Employment by Industry Sector Farming, Forestry, Mining Construction Manufacturing Wholesale Trade Retail Trade Transportation, Communication, Utilities Information Finance, Insurance, Real Estate Professional, Scientific, Management, Administrative Services Educational, Health Care, Social Services Arts, Entertainment, Recreation, Accommodation and Food Services Other Services Public Administration Data Source: US Census Bureau, American Community Survey, Selected Economic Characteristics, 5 year estimates: Labor Force General employment statistics for Springfield are similar to the nation as a whole, as seen in Table 7. Table 7: Employment Status Springfield Estimate % U.S. Estimate Population 16 years and over 133, ,733,844 In labor force 84, % Employed 77, % Unemployed 6, % Not in labor force 48, % Data Source: US Census Bureau, American Community Survey, Selected Economic Characteristics, 5 year estimates: DEMOGRAPHIC AND ECONOMIC PROJECTIONS Population and employment projections provided by the Missouri Department of Natural Resources show an almost doubling of population and employment in the period of analysis as displayed in Table 8. A-13
14 Appendix A: Economic Analysis Appendix Table 8: Greene County Population and Employment Forecast Year Population Employment , , , , , , , , , , , ,335 Data Source: Missouri Department of Natural Resources, Medium Growth Scenario 3 ECONOMIC EVALUATION PROCEDURES, ASSUMPTIONS, AND METHODOLOGIES The economic analysis evaluated the alternatives on the basis of flood-related costs and damages avoided. Flood damages and costs considered in the economic analysis included flood damages to residential and nonresidential structures and contents, damages to vehicles, and public damages (infrastructure and emergency response expenditures). The economic justification of an alternative was determined by comparing the expected annual benefits to the expected annual costs. If the annual benefits for an alternative exceed the annual costs, then the alternative was considered economically justified. In such cases, the benefit-to-cost ratio (BCR) was greater than 1.0. For this analysis, the expected annual cost of an alternative was determined by considering a number of factors, including construction cost, timing of construction period, interest during construction, and operation, maintenance, repair, rehabilitation, and replacement (OMRR&R) costs. The costs were based on an October 2012 price level, a period of analysis of 50 years, and were annualized to an annual equivalent cost using the FY 2013 Federal Discount Rate of 3.75 percent. The expected annual cost for an alternative was subtracted from the expected annual benefit to compute the net annual benefit. The following sections discuss the types of evaluations and methods used in the economic analysis. 3.1 HYDROLOGIC AND HYDRAULIC MODELING FOR ECONOMIC EVALUATIONS Refer to Hydrology and Hydraulics (H&H) Appendix for information on the hydrologic and hydraulic input into the Flood Damage Analysis (FDA) model Determining the H&H Conditions for Base and Future Economic Modeling As stated in the H&H Appendix: Two separate models were created in order to simulate runoff for current land use conditions and expected ultimate development land use conditions. The current land use model reflects development in the watershed as of about This includes current impervious areas and all significant storm-water improvements and detention basins. The ultimate development model is a variation of the current model with land uses projected to 2053 based on current zoning. Given the model reflecting development in 2003, some GIS analysis was conducted to determine how accurate the model would be for a base year of 2020 and to project the fulfillment of ultimate development. A-14
15 Appendix A: Economic Analysis Appendix General Assumptions 1. Aerial photography was available for the study area for 1996, 2001, 2005, and Google earth aerial photography was available for The ultimate development expected within Jordan Creek watershed included North Branch watershed, South Branch watershed, and Jordan Creek watershed. 3. Real estate parcel geospatial data was available for the study area from Redevelopment of existing property exists within the watershed. As properties are redeveloped, the city s storm-water management practices are enforced. Over time, gravel driveways and parking lots are upgraded with growth of employment and industry, decreasing the infiltration and increasing runoff. 5. Development of industry and residential areas in undeveloped property exists within the watershed. As undeveloped properties are developed, the city s storm-water management practices are enforced, particularly for development greater than one acre Determination of Open Land for New Development A team of an economist and a GIS specialist analyzed the approximately 8,700 acres of Jordan Creek watershed aerial photography using ArcMap The GIS specialist compared 1996 photography with 2010 photography to identify areas of development and created a shapefile named Changes_1996_2010. The economist created a shapefile named Open to identify open land which could be developed. Several assumptions were used in the creation of the Open shapefile. 1. The horizon of development occurs over multiple generations, such that a constant owner is not assumed unless the property is held in trust. 2. Per city floodplain development rules, no structures will develop within the 1/100 Annual Chance Event (ACE) floodplain. 3. Property owned by the city for recreation (parks) or as part of the storm-water management plan will not be developed. 4. Property owned by the Springfield School District, Greene County, the State of Missouri, or the US Government will be developed. Between 1999 and 2011, these entities developed approximately 5 acres of land. 5. The Springfield airport, with land not owned by a government entity, will not be developed. 6. Land which is surrounded on all sides with other development (such as residential land in the center of a block of other residential buildings with no feasible access to roads) will not be developed. 7. Current land use zoning will be maintained. Open area will be developed according to the zoning of surrounding property. Polygons in residential areas were drawn to complement residences nearby. Polygons in commercial and industrial areas were drawn to complement the businesses nearby. 8. Polygons were no greater than 2/3 of available parcel space, given city storm-water management detention basins Calculating Land Development Rates Using the Changes_1996_2010 shapefile, and the aerial photography from 2001, 2005, and 2010, the Open shapefile polygons were categorized as development occurring between 1996 and 2001, development occurring between 2001 and 2005, development occurring between 2005 and 2010, or as empty land still to be developed. The acres of development for each category are presented in Table 9. A-15
16 Appendix A: Economic Analysis Appendix Table 9: Land Development for 1996 to Future Period Time Period Open Acres Developed (incremental) Total Open Acres Developed Remaining Open Acres Future Next, the average rate of development over time was calculated as shown in Table 10. Table 10: Land Development, Average Acres per Time Period Time Period Open Acres Developed (incremental) Years Average acres per year Projecting Future Development To determine a date at which the Jordan Creek watershed is fully developed, a panel of economists examined the time periods average developed acres per year, considered the employment during the time periods as seen in Table 11, considered the projected growth of population and employment in Greene County (previously presented in Table 8) over the next 50 years. Table 11: Business Establishments and Employment in Springfield, Missouri Year Business Establishments* Employment** ,299 Unavailable , , , , , , , , , , , , , , , , , , , , , , , , unavailable 181,010 * Data Source: US Census, County Business Profiles, Springfield, MO Metro ** Data Source: Bureau of Labor Statistics, Springfield, MO Metro A-16
17 Appendix A: Economic Analysis Appendix It appeared that the average acres per year development in the watershed remained relatively constant during the economic expansion between 2002 and 2005 and the economic recession between 2008 and Given that the watershed is over 8,700 acres, and an analysis showing only 200 acres remaining as Open for development in 2010, the study team (with coordination of the vertical team) used professional judgment to determine that by 2020 the watershed would be developed to Ultimate Development condition Base and Most Likely Future Year Economic Modeling For Jordan Creek study, the year the proposed project is expected to be in operation (the base year) was set at The most likely future year was set at Given constant ultimate conditions hydrology over the period of analysis, any other most likely future year would produce identical results in FDA modeling. A separate FDA model with 2003 hydrology in the base year and the most likely future year was used as a sensitivity test for the plan formulation. The result of the sensitivity testing is located in Section FIRST FLOOR ELEVATIONS To identify the structures to include in the study, digital maximum floodplain maps were used. A windshield survey was performed to assign the structures with a Corps ID number which was retained throughout the study. The first floor elevations (FFE) for each structure indentified from the maps, as well as structures requested to be examined by the City of Springfield, were obtained by a professional survey team. FFE, as defined by the surveyors, is the lowest point of the lowest, non-basement floor. 3.3 STRUCTURE AND CONTENT VALUES Knowledge of existing residential and nonresidential development located in a floodplain is critical to evaluating an FRM project. Potential flood damages to residential and nonresidential structures in the study area were evaluated through a structure inventory and mailed surveys General Assumptions for Most Likely Future Conditions 1. No buildings were added or removed from the floodplain during the period of analysis. After the 2000 flood event, the City of Springfield executed a voluntary buyout of properties in the Wilsons Creek watershed, beyond the southern end of Lower Jordan Creek. In the last 10 years the City of Springfield has continued purchasing properties within the Jordan Creek watershed from willing owners as a part of its floodplain management program. It is unlikely that other owners within the floodplain will be willing to leave. 2. The structure value, content value and type of use remains constant during the period of analysis. Historically, structures which were damaged by flood events within the Jordan Creek floodplain remain in use in the floodplain. These structures have had multiple owners or renters, but continue to exist. 3. Each building s condition will remain constant. Historically, some businesses within the Jordan Creek floodplain have remodeled and renovated over time. Any deterioration of condition to some of the buildings is offset by renovation of other buildings, such that the overall condition and structure valuation remains constant. 4. In the future, the floodplain will increase and additional existing buildings will be flooded. Per the H&H modeling assumptions (current zoning will be followed, storm-water management practices with enforceable inspection and maintenance processes will be followed, all pervious areas will have decreased infiltration when land is redeveloped, existing channels will have higher conveyance with storm-water infrastructure improvements), there is increased runoff and higher stages. A-17
18 Appendix A: Economic Analysis Appendix Structure and Contents The purpose of the structure inventory was to collect data on residential and nonresidential structures located in the Study area. Structures were numbered starting downstream and moving upstream. Structures which were added after the original survey were numbered as they were added, irrelevant of their positioning on a stream Data Collection Most commercial, industrial, and residential property values were obtained from the Greene County Tax Assessor whose estimates are updated every 2 years and can be accessed online. The assessor s estimates, confirmed by the assessor s office, are derived by taking the structure s replacement cost less its depreciation. There were 16 structures (mostly public) for which there was no assessment. The values of these structures were obtained by doing a price per square foot estimate based on the type of the structure using RSMeans. RSMeans allowed us to estimate the replacement cost minus depreciation using a building s type of construction, age, and other construction specifications Residential Structures Structure values for residential properties were retrieved from the county tax assessor s office. The 2009 assessments were used as a base value and then updated to Oct 2012 prices using the Marshall and Swift index for Central District (including the state of Missouri) for Class D Wood Frame structures. Residential properties were classified first by whether they are a single or multi family home then by the number of stories and if they have a basement or not. Structure counts are listed in Table 12. Table 12: Residential Structures Structure Count Structure values ($) Structure type Single Family - 1 Story 43 1,815,300 Single Family - 1 Story w/ Basement ,800 Single Family - 2 Story 1 157,100 Multi-Family - 1 Story 2 112,500 Multi-Family - 2 Story 3 2,901,500 Total 60 5,475,200 Content values of residential structures were calculated based on US Army Corps of Engineers Economic Guidance Memorandum # Commercial and Industrial Structures Commercial and industrial structure values were retrieved from the Greene County tax assessor s office and are from the 2009 assessment. Values were updated to Oct2012 price levels using the Marshall and Swift index for Central District (including the state of Missouri) for Class C Masonry Bearing Walls structures. A-18
19 Appendix A: Economic Analysis Appendix Structures were categorized by the type of business and the number of stories. The counts of commercial and industrial structures that fall within the maximum projected floodplain are included in Table 13. Table 13: Commercial and Industrial Structures Structure type Structure Structure Count values ($) Commercial 92 45,828,700 Food Store - 1 Story 3 511,400 Restaurant - 1 Story 3 191,500 Restaurant - 2 Story 1 96,200 Fast Food Restaurant - 1 Story 1 223,400 Medical - 1 Story 1 10,000,000 Office - 1 Story 20 3,343,500 Office - 2 Story 4 19,824,700 Retail - 1 Story 14 2,532,900 Retail - 2 Story 2 229,800 Service Store - 1 Story 14 1,066,100 Shopping - 1 Story 2 585,900 Vacant 27 7,221,500 Industrial ,596,000 Specialized Manufacturing 22 4,280,000 Warehouse - 1 Story 66 9,399,100 Warehouse - 2 Story 12 4,507,200 Light Manufacturing - 1 Story 12 2,521,400 Light Manufacturing - 2 Story 2 2,888,400 Total ,424,800 Content values and depth-damage curves for non-residential properties were estimated using US Army Corps of Engineers (USACE) Sacramento District American River Watershed Project Folsom Dam Modification Draft Economic Reevaluation Report Appendix D, Attachment II Technical Report: Content Valuation and Depth-Damage Curves for Nonresidential Structures (ARW). It was assumed that nonresidential structures in the Jordan Creek floodplain were similar to the prototypical structures used in the development of the non-residential depth-damage curves created in ARW. As noted in the invitation packet to expert-elicitation participants, Depth refers to the depth of flooding above or below the first floor of the structure. Given these instructions to the panel, with photographs and sample properties depicting the 14 prototypes of commercial structures in the ARW study, a team of economists on the Jordan Creek study used professional judgment to determine that the depth damage curves are applicable to Jordan Creek structures. Refer to the ARW report for further information on how the depth-damage curves were created. ARW was also used because the study developed a way to calculate non-residential content values based on the type of structure. Content value was determined by applying a value per square foot based on the type of business occupying the structure. Content values were updated from 2009 to Oct 2012 using the A-19
20 Appendix A: Economic Analysis Appendix Producer Price Index for finished goods. It was assumed that content distribution and content type was similar in structures in the Jordan Creek floodplain to those structures used in ARW. ARW s content value derivation methodology was approved by the US Army Corps of Engineers. A windshield survey was taken to determine commercial vacancies and vacant buildings were assumed to have no content inside the structure. After initial runs of Flood Damage Analysis software, damages to several structures within the Jordan Creek 500-year footprint appeared to not represent historic damages. Several actions of reality check (data confirmation) ensued. 1. Building Materials Company outside inventory Company provided detailed historic depth information and damage information on an OMB-approved survey in 2006 and follow-up interviews; the depthdamage curve to the inventory in the pipe-yard was created with engineering and economic judgment. Given the FDA output, an adjustment was made to the depth-damage curve of the outside inventory for this unique inventory. 2. Lofts Building was originally windshield surveyed as an empty warehouse. The warehouse was renovated to loft apartments on second and third floors. The first floor remained vacant, but FDA output reported significant damages at high-frequency events. Further investigation revealed several businesses occupied the first floor of the renovated building, as well as a three-foot rise in first floor elevation since original survey. 3. Warehouse Building first floor elevation (base of garage doors) was originally surveyed with survey crew in FDA output reported significant damages at the high-frequency events. Further investigation using aerial and street-view photography revealed two open garage doors with truck bays. First floor elevation was adjusted up three feet to account for true first floor elevation. 4. Public property maintenance garage The building was originally surveyed and assigned commercial auto structure and content curves based on assumption of vehicles and maintenance use. FDA output reported significant damages at the high-frequency events. Further investigation using street view photography indicated that the building consisted of two adjacent structures with two separate functions: a lower-elevation rectangular office-use space and a higher-elevation warehouse-use space. 5. Building Materials Company Structure first floor elevation was originally surveyed with survey crew in FDA output reported significant damages at the high-frequency events. Structure was surveyed again and the first floor elevation was corrected. 6. Park pavilion Pavilion was originally assigned recreation damage curve (P-REC). FDA output reported significant damages given a simple frame structure and basic recreational facility contents. Structure value was corrected to $5000; content value was corrected to $ Medical facility Structure first floor elevation was originally surveyed with survey crew in FDA output reported significant damages at frequent events, although structure had never reported damage. First floor elevation was corrected using aerial street view photography. 8. Wholesale building materials company Structure was originally windshield surveyed as vacant. Reevaluation of the building in 2010 determined that structure was being used as an inventory warehouse with concrete cement blocks raising the first floor elevation by one foot. Interview with company manager provided structure and content values bundled together. Economic judgment and Greene A-20
21 Appendix A: Economic Analysis Appendix County assessor data were used to separate structure and content values. First floor elevation was corrected by one foot Public Structures Most public structures were not included in the county s assessment of structure values. The value of public structures not included in the tax assessments were derived using RSMeans and the methodology explained above in Section Square feet estimates for public structures were taken by the county tax assessor although no value was assigned during assessment. Values were updated to current price levels using the RS Means historical index. Public structures are identified in Table 14. Table 14: Public Structures Structure type Structure Count Structure values ($) Recreational - 1 Story 2 10,800 School - 2 Story 2 950,000 Total 4 960,800 Content values for public structures were found using the ARW methodology described above. A windshield survey was taken to determine public vacancies Vehicles As shown below, it was estimated that.72 vehicles per residence were vulnerable to flooding. Census data for the number of households and vehicles available was used to calculate an average of 1.26 vehicles per household in the city. Vehicles were assumed to be at the one foot below the structure to which they were paired, and damages begin at one foot above the ground level. It was estimated that.80 cars will be at each house at any given time that a flood could occur, as shown in Equation 1. It was assumed that.945 vehicles (75 percent of 1.26) were present during non-work hours and.315 vehicles (25 percent of 1.26) were present during normal working hours. It was assumed that working hours are 40 hours per week, leaving 128 non-working hours per week for a total of 168 hours a week. Equation 1: (.945*(128/168))+(.315*(40/168))=.80 The city of Springfield does not have a flood warning system and residents are given no formal warning of flash flooding. Springfield officials estimate that residents have less than one hour to evacuate their vehicles from the floodplain. This estimate is based on historical flooding in the Jordan Creek area where it has taken less than an hour for flows to reach peak heights once precipitation began. Precipitation can be very localized resulting in flooding in areas that may not have received much rainfall. Therefore, we assumed that 90 percent of vehicles remained in the floodplain during a high water event. Equation 2:.80*.90=.72 It was also assumed that a plausible value for a vehicle results by assuming the following relationship for each residence: V = (0.15*S) where V is the vehicle value and S is the value of the residential structure (USACE Fort Worth District Lower Colorado Basin Phase I Interim Feasibility Report and Integrated A-21
22 Appendix A: Economic Analysis Appendix Environmental Assessment). The Colorado Basin methodology was used because the population demographics are not substantially different from those in this study. Average vehicle value in the maximum projected floodplain (500-year) using this method was approximately $8,300 (using Consumer Price Index Midwest Private Transportation index to update 2009$ to Oct 2012$). This was consistent with field observations of vehicles within the project area. Vehicle Value (V) was then multiplied by.72 to represent the value of vehicles left at each residence during a flood event. In summary, the value of damageable vehicles at residential properties = number of vehicles per household x vehicle value x the percent of vehicles remaining during a flood event. The data available (retrieved from US Census, Missouri Department of Motor Vehicles, and Greene County Tax Assessor) to the District did not allow the implementation of the methods outlined in EGM #09-04 to their full extent. If vehicle data for each structure becomes available, the District will use the process listed in the EGM. Non-residential (including public) vehicle values, were assumed to be $8,300 per vehicle ($8,300 is the average value of a vehicle in the 500-year floodplain, as explained in the preceding paragraph). Vehicle values for non-residential properties were assumed to be at their locations 8 hours per day, 5 days per week. Therefore, vehicle values at non-residential locations are multiplied by.238 (5/7 * 8/24 =.238) to accurately account for this assumption. Detailed aerial photographs of the floodplain were examined to determine the approximate number of vehicles located at each non-residential structure. After initial runs of FDA, damages to vehicles within the Jordan Creek 500-year footprint appeared to depict greater damages for flood events than reported historic damages. Several actions of correction ensued. 1. Building Materials Company: Vehicle damages were occurring to specialized trucks instead of sedans, trucks, or SUVs. Vehicle damage curve (C-TRK) created for damages to specialized trucks using photos of the specialized trucks, photos of trucks, and the depth damage curves for vehicles provided by HQUSACE. 2. Cars at the Lofts Parking lot of the lofts and the first floor elevation of the lofts were originally considered equal. FDA output reported significant damages to vehicles at high-frequency events. The lofts and the parking lot were split into two structure entries; the parking lot elevation remained as originally surveyed. Multiple aerial photos were used to count vehicles in the parking lot during business hours. The average number of vehicles in the aerial photos (50) was multiplied by the vehicle value in the methodology to determine the aggregate parking lot vehicle value. Given that there are 33 loft apartments and assuming 1.5 vehicles per apartment, there are 50 cars parked in the lot at night outside of business hours. 3. Local business Parking lot of the business and the first floor of the business were originally considered equal. FDA output reported significant damages to vehicles at high-frequency events. After examining aerial and street view photography, the business and the parking lot were split into two structure entries in the structure inventory; the business remains at the surveyed first floor elevation and the A-22
23 Appendix A: Economic Analysis Appendix parking lot elevation was raised by one foot to correct for the -1 (negative) foot start of damage in the vehicle depth-damage curve. 4. Auto yard Building was originally windshield surveyed as an auto body repair shop. Originally, the vehicles located within the fenced-in area in the back were counted and valued in the same way as all other vehicle valuations in the study. The FDA output reported significant vehicle damages at highfrequency events. Further investigation of aerial and street view photography revealed that the business operates as a used-car parts supplier. As a result, further analysis was done which led to the following assumptions: a. Due to the nature of the business, we assumed the most each vehicle could be worth was $700. $700 was based on the minimum price of classified ad asking prices of barely running cars. b. Due to the nature of the business, the minimum each vehicle could be worth was $200. An average of three scrap metal recycling companies equaled $8 per 100 pounds. Assuming an average weight of 3000 pounds and a removal cost of $40 per vehicle from the auto yard to a metal recycler, $200 was the value of a car that can only be sold for scrap. c. Based on aerial photos over time, half of the vehicles were be sold and replaced by others, but the other half stayed indefinitely. d. Of the vehicles at the business, 5 of the cars were either employee or customer owned and follow the standard vehicle methodology. e. 168 vehicles were easily identifiable from aerial photos. A depth-damage curve was created for the vehicles with a maximum percent damage of 55 percent due to the assumptions made. Three major parking lots exist within the study area. Using the methodology as describe in this section, the vehicle values for the three parking lots are presented in Table 15. Table 15: Parking Lots Structure type Structure Count Vehicle values ($) Parking Lots 3 1,384, DEPTH DAMAGE FUNCTIONS Residential The city of Springfield, Missouri is a typical Midwestern city. The residences are typical to the type of construction represented by the Corps of Engineers generic depth-damage curves. EGM #04-01 provided depth-damage curves for residential structures based on house type and applied content damages as a percentage of the structure value in which the contents reside Commercial, Industrial, and Public Structures Depth-damage curves for non-residential properties were estimated using ARW. It was assumed that nonresidential structures in the Jordan Creek floodplain were similar to the prototypical structures used in the development of the non-residential depth-damage curves created in ARW. As noted in the invitation packet A-23
24 Appendix A: Economic Analysis Appendix to expert-elicitation participants, Depth refers to the depth of flooding above or below the first floor of the structure. Given these instructions to the panel, depth damage curves can be applicable to Jordan Creek structures. Refer to the ARW report for further information on how the depth-damage curves were created. ARW was also used because the study developed a way to calculate non-residential content values based on the type of structure. Content value is determined by applying a value per square foot based on the type of business occupying the structure. Content values were updated from 2009 to Oct 2012 using the Producer Price Index for finished goods. It was assumed that content distribution and content type was similar in structures in the Jordan Creek floodplain to those structures used in ARW. ARW s content value derivation methodology was approved by the US Army Corps of Engineers. A windshield survey was taken to determine commercial vacancies and vacant buildings were assumed to have no content inside the structure Vehicles Automobile depth-damage curves with uncertainty were obtained from ARW. Automobile depth-damage curves from ARW were adjusted down by one foot, given that, on average, vehicles in the study area were parking one foot below the first floor elevation of residences and businesses. A random sample of residences and businesses was taken of vehicle elevations in relation to the FFE of each structure resulting in an average height difference of negative one foot Mailed Surveys In October 2005, a request was submitted to the Office of Management and Budget to survey the residences and businesses within the initial projected floodplain. The request was approved in November In January 2006, surveys were mailed to 234 residences and 211 businesses. By February 2006, 33 residential (14 percent response) and 69 commercial (33 percent response) surveys were returned with information. However, most of the returned surveys were judged to be poor and unusable for the study. The few surveys with quality data were used to check the results from FDA. 3.5 REACH CHARACTERISTICS The study area encompasses all or parts of four streams (North, South, and Lower Branches of Jordan Creek, and Wilsons Creek) and their reaches. The North Branch is divided into two reaches, the Lower Branch is divided into three reaches, and the South Branch is one reach. Wilsons Creek is included in the most downstream reach of the Lower Branch. These six Reaches are delineated based on their economic distinctions from the other reaches. These six economic reaches are further divided into hydrologic subreaches in which raise the confidence level of the analysis. Refer to H&H Appendix for sub-reach delineations. The numbers of structures that fall within the maximum projected floodplain are shown in Table 16. The water flows from the east to the west through the middle of the City of Springfield. When flooding occurs along the creek, it is always of short duration. A-24
25 Appendix A: Economic Analysis Appendix Table 16: Structure Inventory Number of structures Structures by type Structure Content Reach in reach Residential Commercial Industrial Public values ($) values ($) E ,438,000 * E ,068,800 12,131,800 E ,215,800 56,018,400 E ,930,800 5,971,800 E ,447,600 3,665,100 E ,759,800 36,635,200 Total ,860,700 * * Number withheld due to predominance of Archimica s proprietary information that would be revealed Reach E1 Reach E1 is at the confluence of Jordan and Fassnight Creeks. This reach is industrial. The Archimica Pharmaceutical plant, Advantage Waste and an old municipal landfill sustain damages during flood events. The Archimica plant has almost 98 percent of the total value of structures, contents, and vehicles within Reach E1. While structural values are approximately $5.4 million, machinery and inventories are significantly more than the structural value of the buildings. Given the unique composition of structure to inventory values and the special type of manufacturing by the company, the damages within Reach E1 are different than other reaches and significant inventory losses are sustained with just a few feet of water. Archimica has constructed a floodwall to elevation that was deemed structurally sound by project delivery team engineers. When water elevations exceed , water overtops the floodwall and several feet of water inundate the pharmaceutical plant before pumps can remove the water. In the future without project conditions, the wall is overtopped between the 1/10 ACE and the 1/25 ACE. A-25

26 Appendix A: Economic Analysis Appendix Figure 2: Reach E Reach E2 Reach E2 is mainly industrial, but it includes a small neighborhood that starts to sustain damages around the 1/5 ACE. This portion of the stream is mostly natural channel with an assortment of conveyance improvements, bridges, culverts and grade control structures. The 1/10 ACE causes damages to about 15 of the 54 structures in the inventory. Structural values of the 54 structures within Reach E2 are approximately $5 million and content values are approximately $12 million. A-26

27 Appendix A: Economic Analysis Appendix Figure 3: Reach E Reach E3 Reach E3 is the downtown area of Springfield and until a few years ago, it primarily consisted of industrial and commercial buildings. However, local Universities are moving into the old warehouses and factories, and it is starting to become a pedestrian- and cyclist- friendly neighborhood. The upstream end of Reach E3 is at the confluence of North and South Branch where Jordan Creek flows into a set of box culverts capable of conveying the 1/5 to 1/10 ACE. The 30 feet wide, 10 feet tall, dual box culverts extend 3,400 feet underneath most of the downtown area. Once the capacity of these structures has been exceeded, water flows over land, through buildings and over roads, creating downtown flooding until it reaches the areas south of downtown where it can return to the channel. The structural values of the 66 structures within Reach E3 total approximately $33.2 million with contents values of approximately $56 million. A-27


28 Appendix A: Economic Analysis Appendix Figure 4: Reach E3 The City s industrial and commercial heart is situated in the Jordan Creek Valley. Along Jordan Creek, it is relatively flat. However, about a city block out on either side of the stream, the terrain gets substantially steeper. This topography concentrates the floodwaters through a narrow corridor. At 1/5 ACE, damages are $570,000. There are substantial damages at the frequent events Reach E4 Most of the damages in Reach E4 are to properties on a local university campus and a community college campus. Ozark Technical College has a parking lot that is subject to the 1/50 ACE in the existing conditions. Two buildings receive structure damage and one receives damage to contents at the 1/5 ACE. The structural values of the 12 properties within Reach E4 are approximately $1.9 million with contents values at approximately $6 million. A-28

29 Appendix A: Economic Analysis Appendix Figure 5: Reach E Reach E5 In Reach E5, a park pavilion close to the channel is frequently flooded but with few damages. At the 1/100 ACE, about six houses are damaged with no single structure receiving more than $400 worth of damage. The majority of the channel in this reach runs through parkland or open space. The structural values of the structures within E5 total approximately $2.5 million with contents valued at approximately $3.7 million. A-29

30 Appendix A: Economic Analysis Appendix Figure 6: Reach E Reach E6 The upstream part of Reach E6 is mainly residential. Once Glenstone Street is crossed, it becomes more industrial. Frequent damages occur at the Loft s Parking Lot and Harry Cooper Supply, a local pipe wholesaler. The upstream reaches of South Branch of Jordan Creek consist of grass ditches with small culverts capable of carrying a storm that is expected to occur every year. Once the water is out of the ditches, it starts to flow overland. Even at frequent events, the flooding affects buildings. Mostly, the water ponds in intersections before flowing back into the creek. Approximately 80 residential properties in the upstream reaches are within the 1/100 ACE floodplain. Water surrounds many of the homes once the capacity of the channel is exceeded. The structural values of the structures within E6 total approximately $27.8 million with their contents valued at approximately $36.6 million. A-30

31 Appendix A: Economic Analysis Appendix Figure 7: Reach E6 3.6 DAMAGE CALCULATIONS Hydrologic Engineering Center Flood Damage Analysis software (FDA) version was used to calculate flood damages to structures and their content as well as damages to vehicles. FDA used an index point within each stream reach, a structure s FFE, and a structure s stationing along a stream to determine whether structures were in the floodplain and, if so, used a depth-damage relationship to find how much damage occurred to each structure and its contents given a certain water elevation. 3.7 WITHOUT PROJECT CONDITION Structures, Contents, and Autos: EAD and Single Event Damages Equivalent Annual Damages were calculated for damages to structures, contents, and vehicles by FDA. Table 17 displays the without project estimates of Equivalent Annual Damages (EAD) as calculated by FDA. A-31
32 Appendix A: Economic Analysis Appendix Table 17: Equivalent Annual Damages, Without Project Reach EAD: Without Project E1 2,242,650 E2 278,992 E3 1,037,289 E4 72,076 E5 9,532 E6 882,811 Total 4,523,350 Without project estimates of single-event damages in each of the reaches in the study area for specified frequency events are provided in Table 18; the damages shown are at October 2012 price levels. There is a significant increase in damages between the 1/5 ACE and the 1/10 ACE given the overtopping of a floodwall in Reach 1 and overtopping of the box culvert in Reach 3. Damages significantly increase again from the 1/10 ACE to the 1/25 ACE in Reaches 1, 3, and 6. A-32
33 Appendix A: Economic Analysis Appendix Table 18: Single Event Damages, Without Project Condition 0.99 (1- yr) 0.5 (2-yr) Annual Chance Exceedence (Recurrence Interval) Damages 0.2 (5-yr) 0.1 (10-yr) 0.04 (25-yr) 0.02 (50-yr) 0.01 (100-yr) (500-yr) Reach E1 Damage ($) ,496,600 21,249,000 24,974,800 27,322,100 29,779,400 Structures (#) Reach E2 Damage ($) 5,600 96, , ,800 1,062,600 1,435,600 1,961,000 2,859,400 Structures (#) Reach E3 Damage ($) - 100, ,600 2,813,400 4,261,300 5,666,700 8,745,400 19,234,000 Structures (#) Reach E4 Damage ($) - 6,300 35, , , , ,000 1,657,600 Structures (#) Reach E5 Damage ($) 100 2,800 11,500 23,600 35,500 42,900 58, ,300 Structures (#) Reach E6 Damage ($) - 192, ,700 1,495,700 4,087,500 6,175,300 8,725,000 14,741,300 Structures (#) Total Damage ($) 5, ,200 1,967,700 15,624,800 31,031,500 38,828,200 47,660,000 68,378,100 Total Structures (#) Damages per Structure ($) 1,894 13,732 32, , , , , ,291 A-33
34 3.7.2 Other Damages Some damage categories were calculated outside of the FDA program. Emergency protection, public infrastructure (such as roads and bridges), and utility damages are examples of these categories. For these damages, the methodology and results are described Emergency Protection Measures Emergency costs were incurred by government agencies in the aftermath of the flood events and were determined using procedures developed in a study by the U.S. Army Engineer District, Louisville, Kentucky. This study, titled Flood Damage Report for Frankfort, Kentucky, July 1981, provided a basis for estimating these types of costs. Emergency costs were computed using a unit cost for each structure based on the number of structures flooded by frequency in the FDA program and relative duration of flooding. Unit costs were assumed to remain constant. Changes in duration compensated for differences for the long single event in Frankfort and the short, flashy events that occur on Jordan Creek. Flood events create adverse socioeconomic effects that vary in duration from a few days to several months or even years following the particular event. Data from the Frankfort report was used to estimate costs associated with flood events in the Jordan Creek study area. Emergency cost items included protection of life, health, and property, evacuation and reoccupation; emergency care, emergency preparedness; and administrative costs. The Frankfort data was adjusted for price changes as well as being modified to reflect local area conditions with regard to flood durations. Table 19 provides an example of calculating emergency costs for the 1/10 ACE. Given that the total expected annual damage for emergency costs equaled less than $1000 and the differences among plans was insignificant, calculation of emergency costs for alternative plans was removed from analysis. The order of magnitude of benefit is within rounding difference of Alternative Plans benefit calculations. A-34
35 Table 19: Emergency Costs, 1/10 ACE Reach R-1 R-2 R-3 R-4 R-5 R-6 Unit Cost Per day (dollars) (1) Units Affected (2) Total Costs Without Project Cost Item Protection of life, health & property (3) $ $3,116 Evacuation, transition & reoccupation (4) $104 0 $0 Emergency & mass care $234 0 $0 Emergency Preparedness $ $3,895 Administrative Costs $ $6,231 Protection of life, health & property (3) $ $2,908 Evacuation, transition & reoccupation (4) $104 8 $831 Emergency & mass care $234 8 $1,869 Emergency Preparedness $ $3,635 Administrative Costs $ $5,816 Protection of life, health & property (3) $ $4,674 Evacuation, transition & reoccupation (4) $104 1 $104 Emergency & mass care $234 1 $234 Emergency Preparedness $ $5,842 Administrative Costs $ $9,347 Protection of life, health & property (3) $104 8 $831 Evacuation, transition & reoccupation (4) $104 0 $0 Emergency & mass care $234 0 $0 Emergency Preparedness $130 8 $1,039 Administrative Costs $208 8 $1,662 Protection of life, health & property (3) $ $1,454 Evacuation, transition & reoccupation (4) $ $1,350 Emergency & mass care $ $3,038 Emergency Preparedness $ $1,818 Administrative Costs $ $2,908 Protection of life, health & property (3) $ $3,635 Evacuation, transition & reoccupation (4) $104 0 $0 Emergency & mass care $234 0 $0 Emergency Preparedness $ $4,544 Administrative Costs $ $7,270 Total Emergency Costs by Project Condition $78,049 Average Annual Emergency Costs $780 (1) Data from 1981 Report, Flood Damage Report for Frankfort, Kentucky, July Dollar values adjusted for price level changes and locality conditions to October 2012$. (2) Numbers of units with damages from FDA Model runs. (3) Includes commercial and residential unit. (4) Residential units only Infrastructure Damages: Roads, Bridges, and Utilities Given the type of flooding in the Jordan Creek watershed (flash-flooding), infrastructure covered with water during high water events does not stay submerged for long periods of time. The City of Springfield A-35
36 did not provide data for infrastructure damages that have occurred during past flood events. Consistent with past Little Rock District flood risk management studies (May Branch Fort Smith Arkansas, Fourche Creek Little Rock Arkansas), infrastructure damages were estimated by creating an FDA model which was stripped of content and other damages. The infrastructure model was run to calculate EAD for structural damages. Expected annual infrastructure damage in the Without Project condition is $126,573 as shown in Table 20. Table 20: Equivalent Annual Damages, Infrastructure Damages, Without Project Reach Structural EAD: Without Project $ Percentage of Damage Infrastructure EAD: Without Project $ E1 175, % 27,438 E2 64, % 10,019 E3 211, % 33,020 E4 22, % 3,518 E5 4, % 716 E6 342, % 53,356 Total 820, ,067 There are two railroads in the floodplain that would be affected by flood events. Information obtained from the railroad companies indicated damages will occur if the flood duration approached 48 hours. Duration analysis was performed for locations that are subjected to flooding. The longest duration of flooding for the 500-year event was approximately 6 hours; therefore damages to railroads and rail commerce were not included in this analysis. In historic flood events, the rail lines were overtopped but the duration was not long enough to result in damages incurred by the inability to move goods. 3.8 TRANSPORTATION DELAY ANALYSIS Flooding can temporarily impede traffic by covering roads and bridges. Even the threat of flooding and concern for public safety may make it necessary to close roads and detour traffic. The costs of traffic disruption include 1) the additional operating cost for each vehicle, including depreciation, maintenance, and gasoline per mile of detour; and 2) the traffic delay cost per passenger. Examining historic floods along Jordan Creek shows that flooding is extremely flashy with the water reaching its peak stage from normal flow in less than an hour. Once flooding has peaked, water levels usually subside in only a few hours. Historic floods have also shown that flooding was very localized. There have been reports of areas receiving no rainfall that get flooded by rainfall less than a mile upstream. There are also numerous bridges and crossings along Jordan Creek. In some areas there are stream crossings at every street block. Given the short duration of flooding, the locality of flooding and the, numerous stream crossings, transportation delays were not analyzed. In the past, vehicles have been successful at finding noninundated crossings only a short distance from their original route. By not analyzing transportation A-36
37 delays, we assumed the risk that there are costs and benefits not taken into account in the overall analysis of alternatives. This risk was perceived to be very minimal. 4 BENEFIT ANALYSIS 4.1 NON-STRUCTURAL MEASURES ANALYSIS Nonstructural flood risk reduction measures are an important consideration in flood risk management. To analyze the benefits of nonstructural buyout plans, several economists and GIS specialist used FDA output and GIS to identify and analyze footprint buyout plans. The buyout plans were analyzed in three rounds, using a 0.8 BCR as a screening tool for plans to move through the first and second rounds (with greater benefits uncertainty) and a 1.0 BCR as a screening tool for plans to move through the third round to a full cost analysis First Round The FDA_Struct.out file from the FDA model of Without Project condition was used as the foundation of EAD analysis. A simple EAD calculating spreadsheet was created, with each tab depicting a footprint buyout plan. Footprint plans were created for structures which were affected by the 1/2 ACE, the 1/5 ACE, the 1/10 ACE, and the 1/25 ACE. The EAD calculating spreadsheet performed lookup functions (tied with links to the FDA output spreadsheet) to create a list of structures impacted by the flood event (for more than $500) and then to complete a damage table for each structure as seen in Figure 8. A-37
38 Figure 8: Spreadsheet Calculations of EAD Each footprint tab calculated a benefit-cost ratio for a buyout plan: with assuming 100 percent removal of damages, an acquisition and demolition cost of 2.5 multiplied by the structure value, and amortization of the cost over 50 years at 3.75 percent interest. The 2.5 multiplier was a rough estimate received from the Real Estate appraiser that included the cost to buy the structure, the cost to buy property, the cost of relocation and administrative and legal fees. Five structures could not be costvalued based on structure value due to their business being based on parked vehicles; those were assigned acquisition and demolition costs of 2.5 multiplied by their associated buildings structure values. The buyout analysis results are presented in Table 21. Table 21: Non-Structural Analysis for Footprint Plans Footprint Plan Structure Count EAD AAC BCR 2-year 26 $938,835 $2,055, year 55 $1,560,445 $2,667, year 98 $4,285,810 $4,140, year 129 $4,427,333 $5,914, Second Round A next step of screening was performed for the only plan with a BCR greater than 0.8. The second screening round was for the 10-year footprint plan to include other structures which were associated with the 98 structures in the first round of analysis. For example: a buyout plan that only considered a warehouse but not the main business was incomplete. To find associated structures, the GIS specialist used a shapefile of structures within the maximum projected floodplain to create a geodatabase. Next, the FDA_Struct.out spreadsheet for the Without Project condition was loaded as a geodatabase table. A-38
39 The corps_id field was a common element in the feature class. Using the corps_id the geodatabase table was joined to the feature class. Then, using a definition query within ArcMap, properties were displayed by their damages in certain return-period categories (2-year, 5-year, 10-year, etc). For the 10- year footprint plan, 12 structures which shared a common parcel owner were included. The buyout analysis result for the additional screening is presented in Table 22. Table 22: Further Analysis for Non-Structural Footprint Plan Footprint Plan Structure Count EAD AAC BCR 10-year 110 $4,277,900 $5,082, Third Round Occasionally, spreadsheet calculations of EAD underestimate the EAD that FDA computes. To verify that spreadsheet analysis of buyout plans was not under-representing the damages, a separate FDA model was built and executed, with the 110 structures removed from inventory. FDA calculated the EAD of the 110 structures at $4,202,339 insignificantly different than the spreadsheet analysis. Given the professional judgment of Real Estate specialists that acquisition costs were conservatively estimated at a multiple of 2.5 the structural values, a BCR of less than 1.0 stopped further analysis of a non-structural buyout plan. 4.2 STRUCTURAL MEASURES ANALYSIS In the plan formulation process, many structural plans were created and analyzed with FDA. Several structural plans were eliminated through four rounds of the formulation process as documented in the main report. Plans A, B, C, D, E, F, and G were eliminated from further evaluation due to inefficiency as compared to Plan G and then to Plan G2. Net benefits and benefit-cost ratios which were calculated in early formulation are presented in Table Table 23: Benefits and BCR for Plans A through G, Early Formulation Plan Net Benefits BCR A 1,752, B 2,798, C 3,017, D 2,335, E 3,243, F 3,208, G 3,858, Estimated benefits and benefit-cost ratios from early formulation cannot be compared to benefits and benefitcost ratios for Plans G2 and J. Benefits during early formulation were ordinal correct, meaning that Plan G had greater benefits than Plans A through F; however, the benefits were not accurate. In refined formulation, only Plan G retained a benefit-cost ratio greater than 1. A-39
40 Plans H and I were eliminated from further consideration due to inefficiency as compared to Plan J. Net benefits and benefit-cost ratios which were calculated in refined formulation are presented in Table 24. Table 24: Benefits and BCR for Plans H and I, Refined Formulation Plan Net Benefits BCR G 336, G2 719, H 1,339, I 871, J 1,876, The following sections describe the final array of alternatives Detention Basins Detention basin analysis (as described in the H&H Appendix) showed the results of the reservoir routing through the basins to determine the basins that provide the most benefit to the project. The resulting basins are shown in Figure 9. The results of the H&H analysis showed five basins provided a significant reduction in flow, two on the North Branch and three on the South Branch. This configuration consists of five detention basins that were deemed efficient in a preliminary H&H analysis. In a preliminary analysis, three detention pond FDA models were created: North Branch only, South Branch only, and All Basins. The benefits from reducing EAD for the three plans in early formulation were compared to initial cost estimates. Table 25: Detention Pond Screening Plan Net Benefits BCR North Branch Only 301, South Branch Only 112, All Basins (North and South) 334, The detention plan with all five detention basins provided greater annual net benefits than the North Branch only plan and the South Branch only plan. A-40

41 Figure 9: Detention Basins Estimates of single-event damages for Detention Basin Plan, in each of the reaches in the study area for specified frequency events, are provided in Table 26; the damages shown are at October 2012 price levels. There is a significant change in start of damages between the Without Project and the Detention Basins between the 1/10 ACE and the 1/25 ACE given the overtopping of a floodwall in Reach 1 and overtopping of the box culvert in Reach 3. Adding detention basins to the Jordan Creek system adds storage capacity to the system and has the effect of decreasing the flood damages for frequent events (1/2 ACE, 1/5 ACE, 1/10 ACE). As flood events get larger (and less frequent), the detention basins fill to capacity and are not as effective in reducing flood damages. A-41
42 Table 26: Single Event Damages, Detention Basins 0.99 (1- yr) 0.5 (2-yr) Annual Chance Exceedence (Recurrence Interval) Damages 0.2 (5-yr) 0.1 (10-yr) 0.04 (25-yr) 0.02 (50-yr) 0.01 (100-yr) (500-yr) Reach E1 Damage ($) ,200 20,867,900 24,533,700 27,003,800 29,678,400 Structures (#) Reach E2 Damage ($) 3,000 68, , , ,700 1,241,000 1,701,300 2,537,600 Structures (#) Reach E3 Damage ($) - 77, ,200 1,607,500 3,699,100 4,757,200 6,590,900 14,997,500 Structures (#) Reach E4 Damage ($) - 1,500 25,400 69, , , ,900 1,314,700 Structures (#) Reach E5 Damage ($) - 1,500 5,300 13,300 25,100 33,200 39,900 65,400 Structures (#) Reach E6 Damage ($) - 12, , ,600 2,386,900 4,702,500 6,739,300 11,765,900 Structures (#) Total Damage ($) 3, ,200 1,223,400 3,153,600 28,100,300 35,627,800 42,680,100 60,359,600 Total Structures (#) Damages per Structure ($) 1,514 10,745 23,987 42, , , , ,015 Damage Reduced % 46.71% 59.53% 37.83% 79.82% 9.45% 8.24% 10.45% 11.73% A-42
43 The estimates of EAD for Detention Plan as provided by FDA are shown in Table 27. Table 27: EAD, Detention Plan Reach EAD $ Infrastructure EAD $ Total EAD $ E1 2,218,390 26,856 2,245,246 E2 240,857 8, ,585 E3 717,055 23, ,123 E4 49,363 2,571 51,934 E5 6, ,590 E6 520,865 31, ,117 Total 3,752,636 92,959 3,845, Plan G2 Plan G2 provides a varying level of protection through each of the reaches. Plan G2 includes: Regional Detention Basins Channel modifications included narrowing the channel and linear feet of modified channel to accommodate a lower level of protection than Plan A or B. Channel improvements occur along about 2.2 miles of channel. Channel widths vary from 5 feet on South Branch to about 37 feet on the lower end of Jordan Creek and on Wilsons Creek. Side slopes vary from 3v to 1h to 5v to 1h depending on real estate restrictions. The estimates of Equivalent Annual Damages for Plan G2 as provided by FDA are shown in Table 28. Table 28: EAD, Plan G2 Reach EAD $ Infrastructure EAD $ Total EAD $ E1 21, ,505 E2 242,470 8, ,146 E3 58,765 1,708 60,473 E4 43,280 2,530 45,809 E5 6, ,497 E6 110,173 3, ,306 Total 481,880 16, ,736 Plan G2 estimates of single-event damages in each of the reaches in the study area for specified frequency events are provided in Table 29; the damages shown are at October 2012 price levels. A-43
44 Table 29: Single Event Damages, Plan G (1- yr) 0.5 (2-yr) Annual Chance Exceedence (Recurrence Interval) Damages (5-yr) (10-yr) (25-yr) (50-yr) 0.01 (100-yr) (500-yr) Reach E1 Damage ($) ,300 Structures (#) Reach E2 Damage ($) 3,000 67, , , ,100 1,239,100 1,699,700 2,633,200 Structures (#) Reach E3 Damage ($) , , , ,900 3,731,200 Structures (#) Reach E4 Damage ($) ,300 63, , , , ,600 Structures (#) Reach E5 Damage ($) - 1,600 5,300 13,300 25,100 33,200 39,900 65,400 Structures (#) Reach E6 Damage ($) - - 5,400 15, ,300 1,368,700 1,915,600 4,111,900 Structures (#) Total Damage ($) 3,000 69, , ,400 1,829,600 3,237,100 4,645,900 11,597,700 Total Structures (#) Damages per Structure ($) 1,516 11,565 20,961 27,056 49,448 56,791 58,073 88,532 Damage Reduced % 46.63% 82.58% 79.76% 95.50% 94.10% 91.66% 90.25% 83.04% A-44
45 4.2.3 Plan J Plan J is the optimized Plan. It includes only the channel increments that produce the most net benefits. Plan J includes: Regional Detention Channel modifications only in the Reach E1 to protect against the 1/500 ACE. Stream Crossings One stream crossing was built for the railroad and one for vehicles. Another stream crossing was modified to accommodate a wider channel. The estimates of Equivalent Annual Damages for the Plan J as provided by FDA are displayed in Table 30. Table 30: EAD, Plan J Reach EAD $ Infrastructure EAD $ Total EAD $ E1 21, ,505 E2 240,857 8, ,585 E3 717,055 23, ,123 E4 49,363 2,571 51,934 E5 6, ,590 E6 520,865 31, ,117 Total 1,555,400 66,454 1,621,854 Plan J estimates of single-event damages in each of the reaches in the study area for specified frequency events are provided in Table 31; the damages shown are at October 2012 price levels. A-45
46 Table 31: Single Event Damages, Plan J 0.99 (1- yr) 0.5 (2-yr) Annual Chance Exceedence (Recurrence Interval) Damages (5-yr) (10-yr) (25-yr) (50-yr) (100-yr) (500-yr) Reach E1 Damage ($) ,300 Structures (#) Reach E2 Damage ($) 3,000 68, , , ,700 1,241,000 1,701,300 2,537,600 Structures (#) Reach E3 Damage ($) - 77, ,200 1,607,500 3,699,100 4,757,200 6,590,900 14,997,500 Structures (#) Reach E4 Damage ($) - 1,500 25,400 69, , , ,900 1,314,700 Structures (#) Reach E5 Damage ($) - 1,500 5,300 13,300 25,100 33,200 39,900 65,400 Structures (#) Reach E6 Damage ($) - 12, , ,600 2,386,900 4,702,500 6,739,300 11,765,900 Structures (#) Total Damage ($) 3, ,200 1,222,800 3,115,400 7,232,400 11,094,100 15,676,500 30,780,500 Total Structures (#) Damages per Structure ($) 1,514 11,513 25,474 45,151 81, , , ,844 Damage Reduced % 46.71% 59.53% 37.86% 80.06% 76.69% 71.43% 67.11% 54.98% A-46
47 4.3 FLOOD DAMAGE REDUCTION TO RESIDENTIAL AND NONRESIDENTIAL PROPERTIES Detention Basins The estimated benefits of the Detention Basins were calculated as the difference between Total EAD for the without project condition less the Total EAD for the Detention Basins. The benefits for Detention Basins are shown in Table 32. Table 32: Benefits of Detention Basins Reach Without: Total EAD $ Detention Basins: Total EAD $ Benefit of Detention Basins $ E1 2,270,088 2,245,246 24,842 E2 289, ,585 39,426 E3 1,070, , ,186 E4 75,594 51,934 23,660 E5 10,247 6,590 3,658 E6 936, , ,050 Total 4,651,417 3,845, , Plan G2 The estimated benefits of Plan G2 were calculated as the difference between Total EAD for the without project condition less the Total EAD for Plan G2. The benefits of Plan G2 are displayed in Table 33. Table 33: Benefits of Plan G2 Reach Without: Total EAD $ Plan G2: Total EAD $ Benefit of Plan G2 $ E1 2,270,088 21,505 2,248,583 E2 289, ,146 37,865 E3 1,070,309 60,473 1,009,836 E4 75,594 45,809 29,785 E5 10,248 6,497 3,751 E6 936, , ,861 Total 4,651, ,736 4,152, Plan J The estimated benefits of Plan J were calculated as the difference between Total EAD for the without project condition less the Total EAD for Plan J. The benefits of Plan J are displayed in Table 34. A-47
48 Table 34: Benefits of Plan J Reach Without: Total EAD $ Plan J: Total EAD $ Benefit of Plan J $ E1 2,270,088 21,505 2,248,583 E2 289, ,585 39,426 E3 1,069, , ,186 E4 75,594 51,934 23,660 E5 10,248 6,590 3,698 E6 936, , ,050 Total 4,651,417 1,621,854 3,029, INDUCED DAMAGES Through FDA output, there was no expected inducement of damages in the Jordan Creek Watershed for Detention Basins, Plan G2, or Plan J. 4.5 SUMMARY OF BENEFITS Benefits for the Jordan Creek watershed were measured by Equivalent Annual Damages reduced as measured by FDA. Benefits for Detention Basins, Plan G2, and Plan J are shown in Table 35. Table 35: Benefits Compared Reach Benefit of Detention Basins $ Benefit of Plan G2 $ Benefit of Plan J $ E1 24,842 2,248,583 2,248,583 E2 39,426 37,865 39,426 E3 330,186 1,009, ,186 E4 23,660 29,785 23,660 E5 3,658 3,751 3,698 E6 384, , ,050 Total 805,821 4,152,681 3,029, RISK AND UNCERTAINTY ANALYSIS The analysis followed guidance described in ER : Risk Analysis for Flood Damage Reduction Studies. As stated in the ER, A variety of planning and design variables may be incorporated into risk analysis in a flood damage reduction study. Economic Variables in an urban situation may include, but are not limited to, depth-damage curves, structure values, content values, structure first-floor elevations, structure types, flood warning times, and flood evacuation effectiveness. The uncertainty of these variables may be due to sampling, measurement, estimation, and forecasting. A-48
49 4.6.1 First Floor Elevations The first floor elevations (FFE) for each structure indentified from the maps, as well as structures requested to be examined by the City of Springfield, were obtained by a professional survey team. FFE, as defined by the surveyors, is the lowest point of the lowest, non-basement floor. Error associated with the professional survey was entered as a normal distribution with 0.02 feet standard deviation Structure Value Most commercial, industrial, and residential property values were obtained from the Greene County Tax Assessor whose estimates are updated every 2 years and can be accessed online. The assessor s estimates, confirmed by the assessor s office, were derived by taking the structure s replacement cost less its depreciation. Error associated with the structure values were entered as a normal distribution with 2.5 percent standard deviation Content Value Content values for non-residential properties were estimated using ARW (as referenced in section ). Error associated with the non-residential content values was entered as a normal distribution with 5 percent standard deviation. Content values for residential properties were based on a Contentto-Structure ratio as given in EGM Vehicle Value Vehicle values were derived with the methodology from the Fort Worth District s Lower Colorado River Basin study, with no uncertainty on values (given the uncertainty in structure values on which the vehicle values are based) H&H Exceedance Probability Functions Functions were derived by using the Analytical from WSP function using Log Pearson III statistics with a 20 year equivalent record length within FDA program for each reach along each stream. From EM Table 4-5, Estimated with rainfall-runoff-routing model calibrated to several events recorded at short-interval event gauge in watershed: 20 to 30 years was chosen given the information from the H&H Appendix in section 2.3. The H&H model used USGS gages at Scenic Avenue and Bennett Street for the 2000 flood to calibrate the model H&H Stage-Discharge Function Functions were derived by using the Retrieve from WSP function using Normal Distribution. Defined uncertainty was calculated within FDA using a normal distribution with stage where stage becomes constant and the standard deviation of error for entered stage defined by the H&H engineer for each reach along each stream Depth-Percent Damage Functions Depth-percent damage functions were entered for all structures, contents, and vehicles based on the source of the original values. Residential functions were obtained from EGM Commercial (as A-49


50 well as industrial and public) functions were entered for all businesses and public structures. Those functions, as well as vehicle functions obtained from ARW. 4.7 CONSEQUENCE OF PROJECT EXCEEDANCE AND RESIDUAL RISK As stated in ER , The flood protection performance will be presented. The risk analysis will quantify the performance of all scales of all alternatives considered for final recommendation. The analysis will evaluate and report residual risk, which includes consequence of project capacity exceedance. In accordance with the policy, several figures (FDA output tables) are presented which depict long-term residual risk by original H&H delineated reaches. Figure 10: Project Performance, Without Project A-50


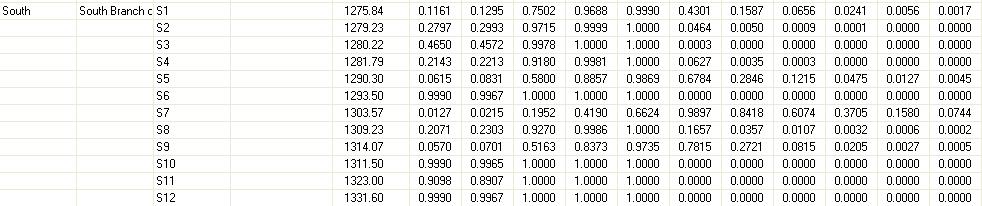
51 Figure 11: Project Performance, Detention Basins A-51


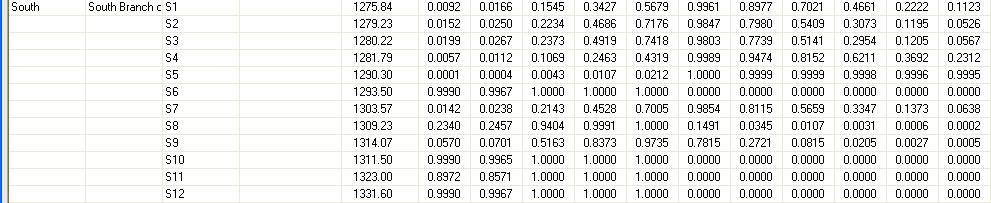
52 Figure 12: Project Performance, Plan G2 A-52


53 Figure 13: Project Performance, Plan J It is also important to relay the residual risk human health and safety risk in such a way that people can easily understand the risk of residual flooding. Given the Tentatively Selected Plan is Plan J, the single event damages for that Plan, as reported as FDA output in Table 36, shows remaining damages by reach and frequency. A-53
54 Table 36: Residual Flooding, Plan J 0.99 (1- yr) 0.5 (2-yr) Annual Chance Exceedence (Recurrence Interval) Damages (5-yr) (10-yr) (25-yr) (50-yr) (100-yr) (500-yr) Reach E1 Damage ($) ,300 Structures (#) Reach E2 Damage ($) 3,000 68, , , ,700 1,241,000 1,701,300 2,537,600 Structures (#) Reach E3 Damage ($) - 77, ,200 1,607,500 3,699,100 4,757,200 6,590,900 14,997,500 Structures (#) Reach E4 Damage ($) - 1,500 25,400 69, , , ,900 1,314,700 Structures (#) Reach E5 Damage ($) - 1,500 5,300 13,300 25,100 33,200 39,900 65,400 Structures (#) Reach E6 Damage ($) - 12, , ,600 2,386,900 4,702,500 6,739,300 11,765,900 Structures (#) Total Damage ($) 3, ,200 1,222,800 3,115,400 7,232,400 11,094,100 15,676,500 30,780,500 Total Structures (#) Damages per Structure ($) 1,514 11,513 25,474 45,151 81, , , ,844 A-54
55 5 COST ANALYSIS 5.1 CONSTRUCTION COST Cost estimates for Detention Basins, G2, and J are presented in the following two figures. In plans G2 and J, the detention pond costs were allocated across reaches by the percentage of benefits provided to each reach. Tables as presented in the following figures do not match exactly to costs in Table 39 and Table 41 due to the allocation of detention pond costs across the reaches. A-55

56 Figure 14: Cost Estimate for Plan G2 and Detention Basins A-56

57 Figure 15: Cost Estimate for Plan J and Detention Basins A-57
58 5.2 OPERATIONS AND MAINTENANCE Operations, Maintenance, Repair, Rehabilitation, and Replacement (OMRR&R) cost estimates for Detention Basins, G2, and J are presented in the following estimates (Figure 16 and Figure 17). As the construction costs were allocated, the costs for detention ponds were allocated across the six reaches by the same percentages. A-58
59 Figure 16: OMRR&R for G2 and Detention A-59
60 A-60
61 A-61
62 Figure 17: OMRR&R for J and Detention A-62
63 A-63
64 5.3 INTEREST DURING CONSTRUCTION Interest during construction was calculated with the following formula: IDC = (((1+r)^(n*12)-1)/(r))*(p/(n*12))-p; where r=monthly interest rate, n=construction period in years, and p=total project cost. Construction duration was provided by the cost estimator. 6 BENEFIT/COST EVALUATION OF PLANS Detention Basins Given cost estimates, interest rates, construction period, and the period of analysis, the annual benefits were compared to the average annual cost of the Detention Basins. Average annual benefits and costs, as well as the benefit-to-cost ratio and the net benefits for Detention Basins are displayed in Table 37. Table 37: Detention Basin Benefits and Costs Item Amount Interest Rate,% 3.750% Interest Rate, Monthly 0.307% Construction Period, Years 1.25 Period of Analysis, Years 50 Total Project Cost $11,261,700 Interest During Construction ($) 245,500 Investment Cost ($) 11,507,200 Annual Cost Amortized Cost ($) 512,900 OMRR&R ($) 186,100 Total Annual Cost ($) 699,000 Annual Benefits Structures, Contents, Other ($) 770,800 Infrastructure ($) 35,100 Total Annual Benefits ($) 805,900 Benefit-to-Cost Ratio 1.15 Net Benefits ($) 106, Plan G2 Given cost estimates, interest rates, construction period, and the period of analysis, the annual benefits were compared to the average annual cost of the Plan G2. Average annual benefits and costs, as well as the benefit-to-cost ratio and the net benefits for Plan G2 at 3.75 percent and 7 percent are displayed Table 38. A-64
65 Table 38: Plan G2 Benefits and Costs Item Amount Amount Interest Rate,% 3.750% 7% Interest Rate, Monthly 0.307% 0.565% Construction Period, Years Period of Analysis, Years Total Project Cost $59,358,500 $59,358,500 Interest During Construction ($) 2,540,800 4,787,600 Investment Cost ($) 61,899,300 64,146,100 Annual Cost Amortized Cost ($) 2,759,100 4,648,000 OMRR&R ($) 642, ,600 Total Annual Cost ($) 3,401,700 5,290,600 Annual Benefits Structures, Contents, Other ($) 4,041,400 4,041,400 Infrastructure ($) 111, ,200 Total Annual Benefits ($) 4,152,600 4,152,600 Benefit-to-Cost Ratio Net Benefits($) 750,900 (1,138,000) Looking at G2 by reach, as in Table 38, it was evident that the channel plan in Reach E1 enabled the economic justification of the channels in Reaches E3 and E6. A-65
66 Table 39: Plan G2, Benefits and Costs for All Reaches Reach E1 Reach E2 Reach E3 Reach E4 Reach E5 Reach E6 Interest Rate,% 3.750% 3.750% 3.750% 3.750% 3.750% 3.750% Construction Period, Years Period of Analysis, Years Total Project Cost $7,958,000 $557,200 $27,982,000 $331,900 $50,100 $22,479,300 Interest During Construction ($) 287,600 12,100 1,420,300 7,200 1, ,500 Investment Cost ($) 8,245, ,300 29,402, ,100 51,200 23,291,800 Annual Cost Amortized Cost ($) 367,500 25,400 1,310,600 15,100 2,300 1,038,200 OMRR&R ($) 54,100 9, ,000 5, ,000 Total Annual Cost ($) 421,600 34,600 1,760,600 20,600 3,100 1,161,200 Annual Benefits Structures, Contents, Other ($) 2,221,500 36, ,500 28,800 3, ,600 Infrastructure ($) 27,100 1,300 31,300 1, ,200 Total Annual Benefits ($) 2,248,600 37,800 1,009,800 29,800 3, ,800 BC Ratio Net Benefits $1,827,000 $3,200 ($750,800) $9,200 $700 ($338,400) Plan J Given cost estimates, interest rates, construction period, and the period of analysis, the annual benefits were compared to the average annual cost of the Plan J. Average annual benefits and costs, as well as the benefit-to-cost ratios and the net benefits for Plan J at 3.75 percent and at 7 percent are displayed in Table 40. With $1,831,300 in net benefits, Plan J is the National Economic Development (NED) Plan. Plan J is the alternative plan that reasonably maximizes the net economic benefits consistent with protecting the Nation s environment. A-66
67 Table 40: Plan J Benefits and Costs Item Amount Amount Interest Rate,% 3.750% 7.0% Interest Rate, Monthly 0.307% 0.565% Construction Period, Years Period of Analysis, Years Total Project Cost $20,479,600 $20,479,600 Interest During Construction ($) 1,140,500 2,162,500 Investment Cost ($) 21,620,100 22,642,100 Annual Cost Amortized Cost ($) 963,700 1,640,600 OMRR&R ($) 234, ,400 Total Annual Cost ($) 1,198,100 1,875,000 Annual Benefits Structures, Contents, Other ($) 2,967,800 2,967,800 Infrastructure ($) 61,600 61,600 Total Annual Benefits ($) 3,029,400 3,029,400 Benefit-to-Cost Ratio Net Benefits ($) 1,831,300 1,154,400 The benefits and cost by reach are presented in Table 41. All reaches have positive net benefits. A-67
68 Table 41: Plan J, Benefits and Costs for All Reaches Reach E1 Reach E2 Reach E3 Reach E4 Reach E5 Reach E6 Interest Rate,% 3.750% 3.750% 3.750% 3.750% 3.750% 3.750% Construction Period, Years Period of Analysis, Years Total Project Cost $9,572,300 $557,200 $4,679,300 $331,900 $50,100 $5,288,800 Interest During Construction ($) 346,000 12, ,000 7,200 1, ,300 Investment Cost ($) 9,918, ,300 4,781, ,100 51,200 5,404,100 Annual Cost Amortized Cost ($) 442,100 25, ,100 15,100 2, ,900 OMRR&R ($) 48, Total Annual Cost ($) 490,400 25, ,100 15,100 2, ,900 Annual Benefits Structures, Contents, Other ($) 2,221,500 38, ,200 22,700 3, ,900 Infrastructure ($) 27,100 1,300 10, ,100 Total Annual Benefits ($) 2,248,600 39, ,200 23,600 3, ,000 BC Ratio Net Benefits $1,758,200 $14,000 $117,100 $8,500 $1,300 $143,100 7 BENEFITS OUTSIDE OF FEDERAL INTEREST In evaluating benefits for FRM projects in urban areas, the Corps participates in projects that address discharges that represent a serious threat to life and property. The threshold for determining flows that fall within this category is outlined in 33 CFR Part 238 (ER , Water Resources Policies and Authorities: Flood Damage Reduction Measures in Urban Areas). This law states that urban water damage associated with a natural stream or modified natural waterway may be addressed by the Corps only downstream from the point where the discharge for the 10 percent chance, or 10 year, flood is greater than 800 cfs, unless an exemption is granted. The analysis to this point has only included structures which were stationed below the points on North Branch and South Branch where the discharge for the 10 percent chance event was greater than 800 cfs. There are other structures in the Jordan Creek watershed that are affected by flood risk. These structures are located above the point that meets the 800 cfs 1.5 square mile criteria as discussed in ER , Paragraph 7.a.(1) and were initially considered to be out of the scope of this project. However, the detention measures are located upstream of the criteria point and upstream of a number of these structures. ER , Paragraph 7.a.(4) states Flood reduction measures, such as dams or diversions, may be located upstream of the particular point where the hydrologic criteria (and area criterion, if appropriate) are met, if economically justified by benefits derived within the stream reach which does qualify for flood control improvement. The detention measures are economically justified by benefits derived below the criteria point with a BCR of 1.27 as presented in Table 37. The location of A-68

69 the detention measure essentially re-sets the upper limit of the project scope and the limit of Federal interest. The structures that were initially considered outside of Federal interest will subsequently be included in the total benefits as derived below the detention measures and above initial criteria point. For Jordan Creek, two additional reaches were delineated for areas outside of the 800 cfs urban limit. E0-North and E0-South are displayed in Figure 18. Figure 18: Economic Reaches There were 253 additional structures in the area outside Federal interest. E0-N contained 130 structures. E0-South contained 123 structures. The number and type of structures that fell within the maximum projected floodplain are shown in Table 42. A-69
70 Table 42: Structure Inventory, Including E0-N AND E0-S Number of structures in Structures by type Reach reach Residential Commercial Industrial Public Structure values ($) E ,438,000 E ,068,800 E ,215,800 E ,930,800 E ,447,600 E ,759,800 E0-N ,098,400 E0-S ,458,000 Total ,417,200 Equivalent Annual Damages were calculated for damages to structures, contents, and vehicles by the FDA program. Table 43 provides the without project estimates of EAD as provided by FDA. Table 43: EAD, Without Project, Including E0-N AND E0-S Reach EAD: Without Project $ E1 2,242,650 E2 278,992 E3 1,037,289 E4 72,076 E5 9,533 E6 882,811 E0-N 58,302 E0-S 143,284 Total 4,724,937 The infrastructure model was run to calculate EAD for structural damages. Expected annual infrastructure damage in the Without Project condition was $142,041 as shown in Table 44. A-70
71 Table 44: EAD, Infrastructure Damages, Without Project, Including E0-N AND E0-S Reach Structural EAD: Without Project $ Percentage of Damage Infrastructure EAD: Without Project $ E1 175, % 27,438 E2 64, % 10,019 E3 211, % 33,020 E4 22, % 3,518 E5 4, % 716 E6 342, % 53,356 E0-N 14, % 2,238 E0-S 74, % 11,696 Total 910, ,001 The estimates of Equivalent Annual Damages for the Plan J as provided by FDA are displayed in Table 44. Table 45: EAD, Plan J, Including E0-N and E0-S Reach EAD $ Infrastructure EAD $ Total EAD $ E1 21, ,505 E2 240,857 8, ,585 E3 717,055 23, ,123 E4 49,363 2,571 51,934 E5 6, ,590 E6 520,865 31, ,117 E0-N 56,808 2,176 58,984 E0-S 47,793 3,780 51,572 Total 1,660,000 72,410 1,732,410 The estimated benefits of Plan J, calculated as the difference between Total EAD for the without project condition less the Total EAD for Plan J, are displayed in Table 46. A-71
72 Table 46: Benefits of Plan J, Including E0-N and E0-S Reach Without: Total EAD $ Plan G: Total EAD $ Benefit of Plan G $ Plan J: Total EAD $ Benefit of Plan J $ E1 2,270,088 21,505 2,248,583 21,505 2,248,583 E2 289, ,146 37, ,585 39,426 E3 1,070,309 60,473 1,009, , ,186 E4 75,594 45,809 29,785 51,934 23,660 E5 10,247 6,497 3,750 6,590 3,658 E6 936, , , , ,050 E0-N 60,541 58,984 1,556 58,984 1,556 E0-S 154,980 51, ,408 51, ,408 Total 4,866, ,292 4,257,645 1,732,410 3,134,527 Given cost estimates, interest rates, construction period, and the period of analysis, the annual benefits were compared to the average annual cost of the Plan J. Average annual benefits and costs, benefit-tocost ratios and the net benefits for Plan G and Plan J at 3.75% and at 7% are displayed in Table 47. With $1,936,300 in net benefits, Plan J remains the NED plan. Table 47: Plan G2 and Plan J Benefits and Costs, Including E0-N and E0-S Item G2 G2 J J Interest Rate,% 3.750% 7.0% 3.750% 7.0% Interest Rate, Monthly 0.307% 0.565% 0.307% 0.565% Construction Period, Years Period of Analysis, Years Total Project Cost $59,358,500 $59,358,500 $20,479,600 $20,479,600 Interest During Construction ($) 2,540,800 4,787,600 1,140,500 2,162,500 Investment Cost ($) 61,899,300 64,146,100 21,620,100 22,642,100 Annual Cost Amortized Cost ($) 2,759,100 4,648, ,700 1,640,600 OMRR&R ($) 642, , , ,400 Total Annual Cost ($) 3,401,700 5,290,600 1,198,100 1,875,000 Annual Benefits Structures, Contents, Other ($) 4,138,400 4,138,400 3,064,800 3,064,800 Infrastructure ($) 119, ,200 69,600 69,600 Total Annual Benefits ($) 4,257,600 4,257,600 3,134,400 3,134,400 Benefit-to-Cost Ratio Net Benefits ($) 855,900 (1,033,000) 1,936,300 1,259,400 A-72
73 8 ANALYSIS OF ECONOMIC VIABILITY 8.1 Sensitivity of Hydrology As discussed in Section 3.1, the plan formulation and economic analysis were based on the Ultimate Conditions hydrology model. As a sensitivity test, Plan G2 and Plan J were also analyzed with the 2003 hydrology model. As seen in Table 48, Plan G2 is not an economically viable plan under 2003 hydrology. Plan J remains economically viable with 2003 hydrology. Table 48: Sensitivity Test: Plan G2 and Plan J Benefits and Costs, 2003 Hydrology Item G2 G2 J J Interest Rate,% 3.750% 7.0% 3.750% 7.0% Interest Rate, Monthly 0.307% 0.565% 0.307% 0.565% Construction Period, Years Period of Analysis, Years Total Project Cost $59,358,500 $59,358,500 $20,479,600 $20,479,600 Interest During Construction ($) 2,540,800 4,787,600 1,140,500 2,162,500 Investment Cost ($) 61,899,300 64,146,100 21,620,100 22,642,100 Annual Cost Amortized Cost ($) 2,759,100 4,648, ,700 1,640,600 OMRR&R ($) 642, , , ,400 Total Annual Cost ($) 3,401,700 5,290,600 1,198,100 1,875,000 Annual Benefits Structures, Contents, Other ($) 2,628,800 2,628,800 1,872,600 1,872,600 Infrastructure ($) 110, ,100 61,300 61,300 Total Annual Benefits ($) 2,738,900 2,738,900 1,933,900 1,933,900 Benefit-to-Cost Ratio Net Benefits ($) (662,800) (2,551,700) 735,800 58, Monte Carlo Analysis of Viability The analysis followed guidance described in ER : Risk Analysis for Flood Damage Reduction Studies. As stated in the ER: The estimate of net NED benefits and benefit/cost ratio will be reported both as a single expected value and on a probabilistic basis for each planning alternative. The probability that net benefits are positive and that the benefit-to-cost ratio is at or above 1.0 will be presented for each planning alternative. A-73
74 To estimate the probability that economic annual net benefits for Plan J (with Ultimate Hydrology and Outside of Federal Interest benefits) are positive, an uncertainty model was created For the benefits, FDA provided amounts that damage reduced exceed for three probabilities: 0.25, 0.5, and The probabilities and benefits were entered into a cumulative distribution function with the benefits rounded to the hundred-thousand with a minimum and maximum estimated by a polynomial function. Cost estimating provided three values from the MII cost estimating program: 0 percent contingency, 23 percent contingency, and 30 percent contingency. Without performing a more robust uncertainty cost analysis, a triangular distribution with the most likely value and the 10 and 90 percentiles was used. Benefits: RiskCumul( , ,{ , , },{0.25,0.5,0.75}) Costs: =RiskTrigen( , , ,10,90) A simulation was created with the following characteristics: 10,000 iterations, Latin Hypercube Sampling, Mersenne Twister Generator, Fixed Initial Seed of Expected and probabilistic values of the net benefits and costs are shown in Table 49. Expected and probabilistic values of the benefit/cost ratio are shown in Table 50. Table 49: Expected and Probabilistic Values of Net Benefits Expected Annual Benefit and Cost Net Benefits Prob. Net Benefit is > 0 Net Benefit that is Exceeded with Specified Probability Plan Benefit Cost Mean Std. Dev Plan J 4,474,900 1,234,500 3,240,300 2,135, ,550,000 3,500,000 5,000,000 Table 50: Expected and Probabilistic Benefit/Cost Ratios Expected Benefit/Cost Ratio Prob. Net Benefit is > 0 B/C Ratio that is Exceeded with Specified Probability Plan Mean Std. Dev Plan J Given the inputs of the simulation, there is a 91 percent chance that the BC ratio is greater than 1 at the current discount rate as shown in Figure 19 and that net benefits are greater than zero as shown in Figure 20. There is an 83.4 percent chance that the BC ratio is greater than 1 at a discount rate of 7 percent as shown in Figure 21, and that net benefits are greater than zero as shown in Figure 22. A-74

75 Figure 19: Probability of Economic Viability at 3.75% A-75

76 Figure 20: Probability of Positive Net Benefits at 3.75% A-76

77 Figure 21: Probability of Economic Viability at 7% A-77

78 Figure 22: Probability of Positive Net Benefits at 7% 9 FINANCIAL ANALYSIS 9.1 COST APPORTIONMENT For information on cost apportionment, refer to the main report. 9.2 ABILITY TO PAY The ability-to-pay test is applied to all flood risk management projects. As a result of the application of the test, some projects may be cost shared at a lower level than the standard non-federal share, which is the share that would apply to the project before any ability-to-pay consideration. Economic Guidance Memorandum is the most current guidance on Ability-to-Pay and provides the procedures and parameters listed within this section. The Ability-to-Pay procedure calculates an Eligibility Factor. The Eligibility Factor (EF) is: EF= a b1 x (state income index) b2 (county income index) Where: state income index is the average over three years of the state per capita income index (state per capita income divided by the national per capita income) for the state (or states) in which the project is located, and the county income index is the average over three years of the county per capita A-78
Westfield Boulevard Alternative
 Westfield Boulevard Alternative Supplemental Concept-Level Economic Analysis 1 - Introduction and Alternative Description This document presents results of a concept-level 1 incremental analysis of the
DuPage County East Branch DuPage River Resiliency Project. Benefit Cost Analysis
 DuPage County East Branch DuPage River Resiliency Project Benefit Cost Analysis 1.0 Benefit Cost Analysis Preparation The BCA for this proposal was a collaborative effort between DuPage County, V3 engineering
Development Fee Program: Comparative risk analysis
 Development Fee Program: Comparative risk analysis January 2008 Sacramento Area Flood Control Agency David Ford Consulting Engineers, Inc. 2015 J Street, Suite 200 Sacramento, CA 95811 Ph. 916.447.8779
APPENDIX E - ECONOMICS For WESTMINSTER, EAST GARDEN GROVE FLOOD RISK MANAGEMENT STUDY
 APPENDIX E - ECONOMICS For WESTMINSTER, EAST GARDEN GROVE FLOOD RISK MANAGEMENT STUDY October 2018 Page intentionally left blank Contents 1.0 Purpose and Overview... 1 1.1 Problems and Opportunities...
CONTINUING AUTHORITIES PROJECT (CAP) Federal Interest Determination
 Federal Interest Determination") Date: 8 May 2013 Division: Great Lakes and Ohio River Division District: Nashville District CONTINUING AUTHORITIES PROJECT (CAP) Federal Interest Determination 1. Project: Cumberland River, Metropolitan
Date: 8 May 2013 Division: Great Lakes and Ohio River Division District: Nashville District CONTINUING AUTHORITIES PROJECT (CAP) Federal Interest Determination 1. Project: Cumberland River, Metropolitan
Update of Project Benefits
 Update of Project Benefits February 2014 Contents 1. Introduction 1 2. Purpose of the Revaluation Study 2 3. Original Project Benefits 2 4. Update of Residential Structure Benefits 3 5. Update of Non Residential
APPENDIX E ECONOMICS
 APPENDIX E ECONOMICS American River Watershed Common Features General Reevaluation Report Draft Economics Appendix E February 2015 Cover Photos courtesy of the Sacramento District: Sacramento Weir during
CRISP COUNTY, GEORGIA AND INCORPORATED AREAS
 CRISP COUNTY, GEORGIA AND INCORPORATED AREAS Community Name Community Number ARABI, CITY OF 130514 CORDELE, CITY OF 130214 CRISP COUNTY (UNINCORPORATED AREAS) 130504 Crisp County EFFECTIVE: SEPTEMBER 25,
Appendix B ECONOMIC CONSIDERATIONS: B-01 Areas of Consideration: B-02 General Computational Procedures:
 Appendix B ECONOMIC CONSIDERATIONS: B-01 Areas of Consideration: The study area comprises a stretch of the west bank of the Rio Grande extending from Bridge Blvd. south to the I-25 crossing over the Rio
Rifle city Demographic and Economic Profile
 Rifle city Demographic and Economic Profile Community Quick Facts Population (2014) 9,289 Population Change 2010 to 2014 156 Place Median HH Income (ACS 10-14) $52,539 State Median HH Income (ACS 10-14)
Appendix D Economic Analysis
 Westchester County Streams, Byram River Basin Flood Risk Management Fairfield County, Connecticut and Westchester County, New York Draft Integrated Feasibility Report & Environmental Impact Statement Appendix
Chapter 6 - Floodplains
 Chapter 6 - Floodplains 6.1 Overview The goal of floodplain management is to reduce the potential risks to both existing and future developments, and infrastructure, in the 100-year floodplain. Over the
ASFPM Partnerships for Statewide Mitigation Actions. Alicia Williams GIS and HMP Section Manager, Amec Foster Wheeler June 2016
 ASFPM Partnerships for Statewide Mitigation Actions Alicia Williams GIS and HMP Section Manager, Amec Foster Wheeler June 2016 Summary The Concept Leveraging Existing Data and Partnerships to reduce risk
STORMWATER MANAGEMENT FUND Department of Environmental Services
 Department of Environmental Services Mission: To implement a comprehensive stormwater management program that balances the following goals: 1) to reduce the potential for stormwater threats to public health,
ANNEX B: TOWN OF BLUE RIVER
 ANNEX B: TOWN OF BLUE RIVER B.1 Community Profile Figure B.1 shows a map of the Town of Blue River and its location within Summit County. Figure B.1. Map of Blue River Summit County (Blue River) Annex
FREQUENTLY ASKED QUESTION ABOUT FLOODPLAINS Michigan Department of Environmental Quality
 FREQUENTLY ASKED QUESTION ABOUT FLOODPLAINS Michigan Department of Environmental Quality WHAT IS A FLOOD? The National Flood Insurance Program defines a flood as a general and temporary condition of partial
Lower San Joaquin River Feasibility Report
 Sacramento District Planning Division Lower San Joaquin River Feasibility Report San Joaquin County, California APPENDIX A: ECONOMICS This page intentionally left blank RISK ANALYSIS OVERVIEW Risk is defined
Frequently Asked Questions Oxbow / Hickson / Bakke Ring Levee Option
 Frequently Asked Questions Oxbow / Hickson / Bakke Ring Levee Option October 16, 2012 Q1. Why has the position on a ring-levee changed? The feasibility study recommended buy-outs for areas with staging
Upper Joachim Creek Public Survey on Potential Flood Risk Reduction
 Upper Joachim Creek Public Survey on Potential Flood Risk Reduction This survey is intended to help the interagency planning committee to receive public feedback on specific flood risk reduction techniques,
APPENDIX B SOCIOECONOMIC ANALYSIS
 U.S. Army Corps of Engineers, Kansas City District Final Feasibility Report APPENDIX B SOCIOECONOMIC ANALYSIS Kansas Citys, Missouri and Kansas Flood Risk Management Project Final Feasibility Report PAGE
Public Information Meeting Rahway River Basin, New Jersey Flood Risk Management Feasibility Study
 Public Information Meeting Rahway River Basin, New Jersey Flood Risk Management Feasibility Study U.S. Army Corps of Engineers, New York District New Jersey Department of Environmental Protection 11 &
5419 S Decatur Blvd, Las Vegas, NV 89118
 10% Down, Call Center, Office, Showroom, Warehouse, Auto, Flex 5419 S Decatur Blvd, Las Vegas, NV 89118 Listing ID: 29978727 Status: Active Property Type: Industrial For Sale Industrial Type: Flex Space,
ECONOMIC ISSUES AND OPPORTUNITIES PAPER
 ECONOMIC ISSUES AND OPPORTUNITIES PAPER Introduction The purpose of this paper is to identify important economic issues that need to be addressed in order to create policy options for the City of Simi
SKECHERS HERMOSA BEACH DESIGN CENTER & EXECUTIVE OFFICES
 SKECHERS HERMOSA BEACH DESIGN CENTER & EXECUTIVE OFFICES NET FISCAL IMPACT & ECONOMIC BENEFIT ANALYSIS HERMOSA BEACH, CA Prepared For: SKECHERS U.S.A., INC. Prepared By: KOSMONT COMPANIES 1601 N. Sepulveda
Stormwater System Development Charges
 Methodology Report Stormwater System Development Charges Prepared For City of Springfield April 20, 2009 GALARDI CONSULTING, LLC PAGE 1 OF 9 SECTION 1 Introduction Oregon legislation establishes guidelines
Overview of Capabilities and Current Limitations
 Overview of Capabilities and Current Limitations Overview of the National Flood Risk Characterization Tool (NFRCT) Map based viewer of relative flood risk around the U.S., with supporting reports for more
The AIR Inland Flood Model for the United States
 The AIR Inland Flood Model for the United States In Spring 2011, heavy rainfall and snowmelt produced massive flooding along the Mississippi River, inundating huge swaths of land across seven states. As
City of Pensacola and Escambia County Flood Risk and Flood Insurance Study
 City of Pensacola and Escambia County Flood Risk and Flood Insurance Study Preliminary Report 1: Long Hollow and Sanders Beach Tracts Wharton Risk Management and Decision Processes Center November 8, 2016
Green Stormwater. Flood Risk Reduction. Infrastructure for. June Presented by: Kari Mackenbach, CFM ms consultants Lynn Mayo, PE, CFM AECOM
 Green Stormwater Infrastructure for Flood Risk Reduction June 2016 Presented by: Kari Mackenbach, CFM ms consultants Lynn Mayo, PE, CFM AECOM Topics 1. Proposed ASFPM Policy Paper 2. Background Why is
Shingle Creek. Minneapolis neighborhood profile. About this area. Trends in the area. Neighborhood in Minneapolis. October 2011
 neighborhood profile October 2011 About this area The neighborhood is bordered by 53rd Avenue North, Humboldt Avenue North, 49th Avenue North, and Xerxes Avenue North. It is home to Olson Middle School.
TOWN OF HINESBURG FIRE PROTECTION IMPACT FEE ANALYSIS. Prepared By. Michael J. Munson, Ph.D., FAICP
 TOWN OF HINESBURG FIRE PROTECTION IMPACT FEE ANALYSIS Prepared By Michael J. Munson, Ph.D., FAICP September 23, 2009 I. INTRODUCTION: The Town of Hinesburg, Vermont, has recently updated its Town Plan
Economic Overview Capital District
 August 29, 2017 Economic Overview Capital District Contact: Lisa.Montiel@suny.edu DEMOGRAPHIC PROFILE... 3 EMPLOYMENT TRENDS... 5 UNEMPLOYMENT RATE... 5 WAGE TRENDS... 6 COST OF LIVING INDEX... 6 INDUSTRY
Economic Overview Long Island
 Report created on August 29, 2017 Economic Overview Long Island Contact: Lisa.Montiel@suny.edu DEMOGRAPHIC PROFILE... 3 EMPLOYMENT TRENDS... 5 UNEMPLOYMENT RATE... 5 WAGE TRENDS... 6 COST OF LIVING INDEX...
Tookany Creek Watershed Flood Damage Reduction Feasibility Study Data Collection Checklist General Information Requirements
 Tookany Creek Watershed Flood Damage Reduction Feasibility Study Data Collection Checklist General Information Requirements Date of Flooding Incident Time of Flood Peak (highest water point) Height of
Economic Overview Long Island
 Report created on October 20, 2015 Economic Overview Long Island Created using: Contact: Lisa.Montiel@suny.edu DEMOGRAPHIC PROFILE...3 EMPLOYMENT TRENDS...5 UNEMPLOYMENT RATE...5 WAGE TRENDS...6 COST OF
SOUTH SAN FRANCISCO BAY SHORELINE PHASE I STUDY ALVISO PONDS AND SANTA CLARA COUNTY, CA. Economics Appendix. (Appendix C to Feasibility Report/EIS)
") SOUTH SAN FRANCISCO BAY SHORELINE PHASE I STUDY ALVISO PONDS AND SANTA CLARA COUNTY, CA Economics Appendix (Appendix C to Feasibility Report/EIS) U.S. Army USACE of Engineers San Francisco District i Table
SOUTH SAN FRANCISCO BAY SHORELINE PHASE I STUDY ALVISO PONDS AND SANTA CLARA COUNTY, CA Economics Appendix (Appendix C to Feasibility Report/EIS) U.S. Army USACE of Engineers San Francisco District i Table
1320 S Casino Center Blvd, Las Vegas, NV 89104
 Professional or Attorney Office Arts District Casino Center 1320 S Casino Center Blvd, Las Vegas, NV 89104 Listing ID: 30030990 Status: Active Property Type: Office For Sale Office Type: Business Park,
Not Your Average Risk Assessment: Multi-Stage Risk Assessments for Sites in the Passaic River Basin Stuart Geiger, CFM Joseph Ruggeri, PE, CFM
 Not Your Average Risk Assessment: Multi-Stage Risk Assessments for Sites in the Passaic River Basin Stuart Geiger, CFM Joseph Ruggeri, PE, CFM Agenda Project Background Risk Assessment Development Refined
Independence, MO Data Profile 2015
 , MO Data Profile 2015 5 year American Community Survey (ACS) Jackson County, Missouri Data sources: U.S. Census Bureau, American Community Survey (ACS), 2011 2015 (released December 8, 2016), compared
Rahway River Basin, New Jersey. Coastal Storm Risk Management Feasibility Study
 Draft Economic Appendix New Jersey Department of Environmental Protection U.S. Army Corps of Engineers New York District May 2017 Table of Contents 1 Introduction... 1 2 Description of Study Area... 1
LELAND CONSULTING GROUP
 Memorandum Date 25 April 2013 To From CC Thomas Puttman, Puttman Infrastructure April Chastain, Leland Consulting Group Chris Zahas, Leland Consulting Group Matt Arnold, SERA Architects Kevin Cronin, Portland
FINAL TECHNICAL MEMORANDUM AWD FLOWS THROUGH FLOOD DAMAGE REDUCTION AREA July 16, 2012
 FINAL TECHNICAL MEMORANDUM AWD-00002 FLOWS THROUGH FLOOD DAMAGE REDUCTION AREA July 16, 2012 Table of Contents TABLE OF CONTENTS Table of Contents... 1 Executive Summary... 2 1 Objective... 4 2 Study Approach...
University of Minnesota
 neighborhood profile October 2011 About this area The University neighborhood is bordered by 11th Avenue Southeast, University Avenue, 15th Avenue Southeast, the railroad tracks, Oak Street, and the Mississippi
Financing Floods in Chicago. Sephra Thomas. GIS for Water Resources C E 394K. Dr. David Maidment
 Financing Floods in Chicago Sephra Thomas GIS for Water Resources C E 394K Dr. David Maidment Fall 2018 Abstract The objective of this term paper is to study the hydrology and social vulnerability of Chicago,
Mid - City Industrial
 Minneapolis neighborhood profile October 2011 Mid - City Industrial About this area The Mid-City Industrial neighborhood is bordered by I- 35W, Highway 280, East Hennepin Avenue, and Winter Street Northeast.
DES MOINES CITY OF TWO RIVERS. Flooding Risk & Impact to Development
 DES MOINES CITY OF TWO RIVERS Flooding Risk & Impact to Development River System Des Moines Flood Protection Des Moines Flood Protection cont. Infrastructure Over 24 miles of levees 21stormwater pump stations
2415 Reynolds Ave, North Las Vegas, NV 89030
 7,221' *Reynolds Medical Center* Gray Shell w/ Elevator 89030 2415 Reynolds Ave, North Las Vegas, NV 89030 Listing ID: 29944098 Status: Active Property Type: Office For Sale (also listed as Special Purpose)
Appendix C: Economics
 Shrewsbury River Basin, Sea Bright, New Jersey Coastal Storm Risk Management Feasibility Study Draft Integrated Feasibility Report & Environmental Assessment Appendix C: Economics Shrewsbury River Basin,
Camden Industrial. Minneapolis neighborhood profile. About this area. Trends in the area. Neighborhood in Minneapolis.
 Minneapolis neighborhood profile October 2011 Camden Industrial About this area The Camden Industrial neighborhood is bordered by 48th Avenue North, the Mississippi River, Dowling Avenue North, Washington
Economic Overview Monterey County, California. July 22, 2016
 Economic Overview Monterey July 22, 2016 DEMOGRAPHIC PROFILE... 3 EMPLOYMENT TRENDS... 5 UNEMPLOYMENT RATE... 5 WAGE TRENDS... 6 COST OF LIVING INDEX... 6 INDUSTRY SNAPSHOT... 7 OCCUPATION SNAPSHOT...
Pierce County, Wisconsin. Bridge at Trenton Island. Photo by Rebecca Kihslinger.
 Pierce County, Wisconsin Bridge at Trenton Island. Photo by Rebecca Kihslinger. Background Pierce County (pop. 41,019) is located in northwestern Wisconsin and shares a border with Minnesota along the
Economic Overview New York
 Report created on October 20, 2015 Economic Overview Created using: Contact: Lisa.Montiel@suny.edu DEMOGRAPHIC PROFILE...3 EMPLOYMENT TRENDS...5 UNEMPLOYMENT RATE...5 WAGE TRENDS...6 COST OF LIVING INDEX...6
Economic Overview City of Tyler, TX. January 8, 2018
 Economic Overview City of Tyler, TX January 8, 2018 DEMOGRAPHIC PROFILE...3 EMPLOYMENT TRENDS...5 WAGE TRENDS...5 COST OF LIVING INDEX...6 INDUSTRY SNAPSHOT...7 OCCUPATION SNAPSHOT...9 INDUSTRY CLUSTERS...
DEMOGRAPHIC PROFILE...3 EMPLOYMENT TRENDS...5 UNEMPLOYMENT RATE...5 WAGE TRENDS...6 COST OF LIVING INDEX...6 INDUSTRY SNAPSHOT...7
 March 14, 2017 DEMOGRAPHIC PROFILE...3 EMPLOYMENT TRENDS...5 UNEMPLOYMENT RATE...5 WAGE TRENDS...6 COST OF LIVING INDEX...6 INDUSTRY SNAPSHOT...7 OCCUPATION SNAPSHOT...9 INDUSTRY CLUSTERS... 12 EDUCATION
Economic Overview Loudoun County, Virginia. October 23, 2017
 Economic Overview October 23, 2017 DEMOGRAPHIC PROFILE... 3 EMPLOYMENT TRENDS... 5 UNEMPLOYMENT RATE... 5 WAGE TRENDS... 6 COST OF LIVING INDEX... 6 INDUSTRY SNAPSHOT... 7 OCCUPATION SNAPSHOT... 9 INDUSTRY
Lake Tahoe Basin Census Trends Report
 Lake Tahoe Basin Census Trends Report 1990-2000-2010 Prepared August 2013 Contents Page Executive Summary 1 Findings 1 Definitions 3 Section 1. Demographics 4 Population 4 Age 6 Race 6 Housing 10 Tenancy
Subject: Upper Merrimack and Pemigewasset River Study Task 9 - Water Supply Evaluation
 Memorandum To: From: Barbara Blumeris, USACE Ginger Croom and Kirk Westphal, CDM Date: April 14, 2008 Subject: Upper Merrimack and Pemigewasset River Study Task 9 - Water Supply Evaluation Executive Summary
Economic Overview Western New York
 Report created on August 29, 2017 Economic Overview Western New Contact: Lisa.Montiel@suny.edu DEMOGRAPHIC PROFILE... 3 EMPLOYMENT TRENDS... 5 UNEMPLOYMENT RATE... 5 WAGE TRENDS... 6 COST OF LIVING INDEX...
2365 Reynolds Ave, North Las Vegas, NV 89030
 10% Down $77 psf 7,072' Medical Office Elevator & Gray Shell 2365 Reynolds Ave, North Las Vegas, NV 89030 Listing ID: 29944110 Status: Active Property Type: Office For Sale Office Type: Business Park,
Economic Overview York County, South Carolina. February 14, 2018
 Economic Overview York County, February 14, 2018 DEMOGRAPHIC PROFILE... 3 EMPLOYMENT TRENDS... 5 UNEMPLOYMENT RATE... 5 WAGE TRENDS... 6 COST OF LIVING INDEX... 6 INDUSTRY SNAPSHOT... 7 OCCUPATION SNAPSHOT...
October 28, Economic Overview Yellowstone County, Montana
 October 28, 2016 Economic Overview Yellowstone DEMOGRAPHIC PROFILE...3 EMPLOYMENT TRENDS...5 UNEMPLOYMENT RATE...5 WAGE TRENDS...6 COST OF LIVING INDEX...6 INDUSTRY SNAPSHOT...7 OCCUPATION SNAPSHOT...9
BUTTS COUNTY, GEORGIA AND INCORPORATED AREAS
 BUTTS COUNTY, GEORGIA AND INCORPORATED AREAS Butts County Community Name Community Number BUTTS COUNTY (UNICORPORATED AREAS) 130518 FLOVILLA, CITY OF 130283 JACKSON, CITY OF 130222 JENKINSBURG, TOWN OF
Economic Overview Fairfax / Falls Church. October 23, 2017
 Economic Overview Fairfax / Falls Church October 23, 2017 DEMOGRAPHIC PROFILE... 3 EMPLOYMENT TRENDS... 5 UNEMPLOYMENT RATE... 5 WAGE TRENDS... 6 COST OF LIVING INDEX... 6 INDUSTRY SNAPSHOT... 7 OCCUPATION
RESOLUTION - APPROVING FINAL FISCAL YEAR BUDGET
 ITEM 12 TO: FROM: SUBJECT: Sacramento Area Flood Control Agency Board of Directors Richard M. Johnson, Executive Director (916) 874-7606 RESOLUTION - APPROVING FINAL FISCAL YEAR 2015-16 BUDGET OVERVIEW:
Demographic and Economic Profile. Nevada. Updated May 2006
 Demographic and Economic Profile Nevada Updated May 2006 Metro and Nonmetro Counties in Nevada Based on the most recent listing of core based statistical areas by the Office of Management and Budget (December
Economic Overview 45-Minute Commute From Airport Park. June 6, 2017
 Economic Overview 45-Minute Commute From Airport Park June 6, 2017 DEMOGRAPHIC PROFILE... 3 EMPLOYMENT TRENDS... 5 WAGE TRENDS... 5 COST OF LIVING INDEX... 6 INDUSTRY SNAPSHOT... 7 OCCUPATION SNAPSHOT...
ECONOMIC OVERVIEW DuPage County, Illinois
 ECONOMIC OVERVIEW DuPage County, Illinois DEMOGRAPHIC PROFILE... 3 EMPLOYMENT TRENDS... 5 UNEMPLOYMENT RATE... 5 WAGE TRENDS... 6 COST OF LIVING INDEX... 7 INDUSTRY SNAPSHOT... 8 OCCUPATION SNAPSHOT...
Economic Overview Prince William/Manassas. October 23, 2017
 Economic Overview Prince William/Manassas October 23, 2017 DEMOGRAPHIC PROFILE... 3 EMPLOYMENT TRENDS... 5 UNEMPLOYMENT RATE... 5 WAGE TRENDS... 6 COST OF LIVING INDEX... 6 INDUSTRY SNAPSHOT... 7 OCCUPATION
Integrating Hazus into the Flood Risk Assessment
 Integrating Hazus into the Flood Risk Assessment GAFM Conference, March 22, 2016 Mapping Assessment Planning Agenda What is Hazus & Risk Assessment? Census Block vs. Site Specific Analysis User Defined
UPDATE ON DALLAS FLOODWAY
 UPDATE ON DALLAS FLOODWAY ENVIRONMENTAL IMPACT STATEMENT [ EIS ] Transportation and Trinity River Project Committee Rob Newman Director, Trinity River Corridor Project, Fort Worth District 28 April 2014
Wetzel County Floodplain Ordinance
 Wetzel County Floodplain Ordinance AUTHORITY AND PURPOSE: THE PROVISIONS OF THIS ORDINANCE HAVE BEEN PREPARED WITH THE INTENTION OF MEETING THE REQUIREMENTS OF SECTION 60.3 (D) OF THE NATIONAL FLOOD INSURANCE
IN THE LITTLE APPLE A PRESENTATION FOR THE 2017 ASFPM ANNUAL CONFERENCE IN KANSAS CITY, MO, MANAGING FLOOD RISK IN THE HEARTLAND
 A PRESENTATION FOR THE 2017 ASFPM ANNUAL CONFERENCE IN KANSAS CITY, MO, MANAGING FLOOD RISK IN THE HEARTLAND NONSTRUCTURAL 237 217 200 ASSESSMENT 80 252 237 217 200 119 174 237 217 200 27.59 IN THE LITTLE
REQUEST FOR PROPOSALS. Planning in Water s Way: Flood Resilient Economic Development Strategy for the I-86 Innovation Corridor
 REQUEST FOR PROPOSALS Planning in Water s Way: Flood Resilient Economic Development Strategy for the I-86 Innovation Corridor Southern Tier Central Regional Planning and Development Board (STC) is seeking
Commission District 4 Census Data Aggregation
 Commission District 4 Census Data Aggregation 2011-2015 American Community Survey Data, U.S. Census Bureau Table 1 (page 2) Table 2 (page 2) Table 3 (page 3) Table 4 (page 4) Table 5 (page 4) Table 6 (page
Town Profiles: Demographic, Economic, and Housing Statistics for De Smet City and Wall Town, SOuth Dakota
 South Dakota State University Open PRAIRIE: Open Public Research Access Institutional Repository and Information Exchange Census Data Center News Releases SDSU Census Data Center 12-7-2017 Town Profiles:
Population, Housing, and Employment Methodology
 Appendix O Population, Housing, and Employment Methodology Final EIR APPENDIX O Methodology Population, Housing, and Employment Methodology This appendix describes the data sources and methodologies employed
The maximum allowable valley storage decrease for the 100-year flood and Standard Project Flood are 0.0% and 5.0%, respectively.
 2.1.1.2 HYDRAULIC IMPACTS VALLEY The maximum allowable valley storage decrease for the 100-year flood and Standard Project Flood are 0.0% and 5.0%, respectively. General. The computation of valley storage
Economic Overview. Lawrence, KS MSA
 Economic Overview Lawrence, KS MSA March 5, 2019 DEMOGRAPHIC PROFILE... 3 EMPLOYMENT TRENDS... 5 UNEMPLOYMENT RATE... 5 WAGE TRENDS... 6 COST OF LIVING INDEX... 7 INDUSTRY SNAPSHOT... 8 OCCUPATION SNAPSHOT...
Demographic and Economic Profile. North Dakota. Updated June 2006
 Demographic and Economic Profile North Dakota Updated June 2006 Metro and Nonmetro Counties in North Dakota Based on the most recent listing of core based statistical areas by the Office of Management
Pennsylvania. Demographic and Economic Profile. Metro and Nonmetro Counties in Pennsylvania
 Demographic and Economic Profile Pennsylvania Updated June 2006 Metro and Nonmetro Counties in Pennsylvania Based on the most recent listing of core based statistical areas by the Office of Management
SECTION 9: MAPS AND DATA
 SECTION 9: MAPS AND DATA Contents 9.1. NFIP Maps and Data... 9-2 9.1.1. Adopting and enforcing NFIP floodplain maps and data... 9-2 9.1.2. Adopting and enforcing more restrictive data... 9-2 9.1.3. Annexations...
Demographic and Economic Profile. New Jersey. Updated December 2006
 Demographic and Economic Profile New Jersey Updated December 2006 Metro and Nonmetro Counties in New Jersey Based on the most recent listing of core based statistical areas by the Office of Management
June 9, Economic Overview Billings, MT MSA
 June 9, 2016 Economic Overview Billings, MT MSA DEMOGRAPHIC PROFILE... 3 EMPLOYMENT TRENDS... 5 UNEMPLOYMENT RATE... 5 WAGE TRENDS... 6 COST OF LIVING INDEX... 6 INDUSTRY SNAPSHOT... 7 OCCUPATION SNAPSHOT...
Chapter 5 Floodplain Management
 Chapter 5 Floodplain Management Contents 1.0 Introduction... 1 2.0 Floodplain Management and Regulation... 1 2.1 City Code... 1 2.2 Floodplain Management... 1 2.3 Level of Flood Protection... 2 2.3.1 Standard
A Review of Our Legacy System, History of Neglect, Current Issues, and the Path Forward for Levee Safety
 4 th NACGEA GEOTECHNICAL WORKSHOP January 29, 2010 A Review of Our Legacy System, History of Neglect, Current Issues, and the Path Forward for Levee Safety Presented by: Leslie F. Harder, Jr., Phd, PE,
7. Understand effect of multiple annual exposures e.g., 30-yr period and multiple independent locations yr event over 30 years 3%
 I. FLOOD HAZARD A. Definition 1. Hazard: probability of water height 2. At a Specific XY floodplain location; 3. Z can be expressed as elevation (NAVD88); gauge height; height above ground (depth). 4.
Northwest Census Data Aggregation
 Northwest Census Data Aggregation 2011-2015 American Community Survey Data, U.S. Census Bureau Table 1 (page 2) Table 2 (page 2) Table 3 (page 3) Table 4 (page 4) Table 5 (page 4) Table 6 (page 5) Table
Riverview Census Data Aggregation
 Riverview Census Data Aggregation 2011-2015 American Community Survey Data, U.S. Census Bureau Table 1 (page 2) Table 2 (page 2) Table 3 (page 3) Table 4 (page 4) Table 5 (page 4) Table 6 (page 5) Table
3424 East Road, Saginaw, MI 48601
 R & W Investment 3424 East Road, Saginaw, MI 48601 Listing ID: 30298825 Status: Active Property Type: Industrial For Sale Industrial Type: Flex Space, Free-Standing Size: 7,564 SF Sale Price: $230,000
Zipe Code Census Data Aggregation
 Zipe Code 66101 Census Data Aggregation 2011-2015 American Community Survey Data, U.S. Census Bureau Table 1 (page 2) Table 2 (page 2) Table 3 (page 3) Table 4 (page 4) Table 5 (page 4) Table 6 (page 5)
Zipe Code Census Data Aggregation
 Zipe Code 66103 Census Data Aggregation 2011-2015 American Community Survey Data, U.S. Census Bureau Table 1 (page 2) Table 2 (page 2) Table 3 (page 3) Table 4 (page 4) Table 5 (page 4) Table 6 (page 5)
TECHNICAL REPORT NO. 11 (5 TH EDITION) THE POPULATION OF SOUTHEASTERN WISCONSIN PRELIMINARY DRAFT SOUTHEASTERN WISCONSIN REGIONAL PLANNING COMMISSION
 THE POPULATION OF SOUTHEASTERN WISCONSIN PRELIMINARY DRAFT SOUTHEASTERN WISCONSIN REGIONAL PLANNING COMMISSION") TECHNICAL REPORT NO. 11 (5 TH EDITION) THE POPULATION OF SOUTHEASTERN WISCONSIN PRELIMINARY DRAFT 208903 SOUTHEASTERN WISCONSIN REGIONAL PLANNING COMMISSION KRY/WJS/lgh 12/17/12 203905 SEWRPC Technical
TECHNICAL REPORT NO. 11 (5 TH EDITION) THE POPULATION OF SOUTHEASTERN WISCONSIN PRELIMINARY DRAFT 208903 SOUTHEASTERN WISCONSIN REGIONAL PLANNING COMMISSION KRY/WJS/lgh 12/17/12 203905 SEWRPC Technical
Demographic and Economic Profile. Delaware. Updated December 2006
 Demographic and Economic Profile Delaware Updated December 2006 Metro and Nonmetro Counties in Delaware Based on the most recent listing of core based statistical areas by the Office of Management and
Comprehensive Flood Mitigation for 12,000 Properties
 Comprehensive Flood Mitigation for 12,000 Properties Lori Rafferty, PE, CFM, Louisville MSD & Louie Greenwell, GISP, CFM, T&M Associates Association of State Floodplain Managers 2014 State Conference June
Modernization, FEMA is Recognizing the connection between damage reduction and
 EXECUTIVE SUMMARY Every year, devastating floods impact the Nation by taking lives and damaging homes, businesses, public infrastructure, and other property. This damage could be reduced significantly
Monte Vista Population, ,744 4,651 4,564 4,467 4,458 4,432 4,451
 1 Monte Vista 4,8 4,7 4,6 4,5 4,4 4,3 4,2 4,1 4,61 4,612 4,61 4,676 Monte Vista, 2-213 4,744 4,651 4,564 4,467 4,458 4,432 4,451 4,418 4,412 4,355 2 21 22 23 24 25 26 27 28 29 21 211 212 213 Year Monte
Demographic and Economic Profile. Texas. Updated April 2006
 Demographic and Economic Profile Texas Updated April 2006 Metro and Nonmetro Counties in Texas Based on the most recent listing of core based statistical areas by the Office of Management and Budget (December
Mill Creek Floodplain Proposed Bylaw Frequently Asked Questions
 Mill Creek Floodplain Proposed Bylaw Frequently Asked Questions Q: What is a Floodplain Bylaw? A: A Floodplain Bylaw is a flood hazard management tool to ensure future land use will be planned and buildings
Canada s exposure to flood risk. Who is affected, where are they located, and what is at stake
 Canada s exposure to flood risk Who is affected, where are they located, and what is at stake Why a flood model for Canada? Catastrophic losses Insurance industry Federal government Average industry CAT
Stronger Storm Water Standards Will Reduce Flood Risks and Cut Costs
 Stronger Storm Water Standards Will Reduce Flood Risks and Cut Costs Author: Victor O. Ukpolo; Clean Water Fund and Prince George s County Clean Water Coalition Flood Prone Communities There are many flood