BERGRIVIER MUNICIPALITY REPORT BY THE STRATEGIC MANAGER
|
|
|
- Alvin Cornelius Hall
- 5 years ago
- Views:
Transcription
1 BERGRIVIER MUNICIPLITY REPORT BY THE STRTEGIC MNGER REPORT TO: MYORL COMMITTEE COUNCIL 2016/17 MID-YER BUDGET ND PERFORMNCE SSESSMENT COMPILED IN TERMS OF SECTION 72 OF THE MUNICIPL FINNCE MNGEMENT CT, CT 56 OF INTRODUCTION The purpose of this report is to present the 2016/17 Mid-Year Performance ssessment to the Council. 2 DISCUSSION Section 72 of the Municipal Finance Management ct, ct 56 of 2003 (MFM) requires the ccounting Officer to assess the performance of the Municipality over the first half of the financial year submit a report on this assessment to the Executive Mayor of the Municipality as well as the National Treasury Provincial Treasury by the 25 January year. Section 54(1)(f) of the MFM requires the Executive Mayor to submit the Section 72 report, to the Council by 31 January of each year. The Municipal Reporting Regulations published under notice GG of pril 2009 require that this report be made public by placing it on the Municipal website within 5 working days of 25 January. The Municipal Manager must also make public any other information that the Municipal Council considers appropriate to facilitate public awareness of the Mid-year Performance ssessment including summaries in alternate languages predominant in the community Information relevant to each ward in the Municipality. The 2016/17 Midyear Performance ssessment Report is attached. 3 RECOMMENDTION 1
2 3.1 That the Mayoral Committee Council note the 2016/17 Mid-year Performance ssessment Report submitted in terms of Sections 72(1) 54(1)(f) of the Municipal Finance Management ct, ct 56 of That following the consideration of the Mid-year Performance ssessment Report, a municipal adjustment budget be prepared in terms of section 72(3)(a) read together with Section 28 of the MFM by 29 February as required by Regulation 23 of the Municipal reporting regulations That 2016/17 Midyear Performance ssessment Report be made public by placing it on the municipal website in terms of Regulation 34 of the Municipal Reporting Regulations GG of pril

3 3
4 Office of the Municipal Manager Bergrivier Municipality Section 72 - Mid-Year Report 2016/17 Ref Directorate Strategic Objective KPI Unit of Measurement nnua l Target Revise d Target KPI Calculation Type Targe t ctual Sep-16 R Department al Corrective Measures Targe t ctual Dec-16 R Department al Corrective Measures Overall Performance for Sep - Dec 2016 Targe t ctual R TL1 4 Office of the Municipal Manager To maintain bulk service infrastructure that will address backlogs for future development The percentage of the municipal capital budget ly spent on capital projects as at 30 June (ctual amount spent on capital projects/ Total amount budgeted for capital projects)x1 00 % of Capital budget spent as at 30 June [(ctual amount spent on capital projects/to tal amount budgeted for capital projects)x1 00] 95% 95% Last Value 0% 0% N/ 10% % B 10% % B 4
5 TL1 5 TL1 6 TL1 7 Office of the Municipal Manager Office of the Municipal Manager Office of the Municipal Manager To create an efficient, effective, accountable administration To create an efficient, effective, accountable administration To open transparent corruptio n free governanc e 100% compliance with Selection & Recruitmen t Policy when vacant posts within the 3 highest levels of manageme nt are filled subject to suitably qualified cidates Improve staff productivity & responsiveness through quarterly leadership developme nt meetings /or initiatives MFM Section 131(1): Ensure that any issues raised by the uditor General in an udit Report are addressed % compliance with the selection recruitment policy Leadership Forum Meetings /or other leadership initiatives % of issues raised by the uditor General in an audit report addressed. 100% 100% St- lone 4 4 ccumulati ve 100 % 100% G [D48] Municipal Manager: None required (September 2016) 1 1 G [D49] Municipal Manager: None (September 2016) 100% 100% Carry Over 0% 0% N/ 100 % 100% G [D48] Municipal Manager: None required (December 2016) 1 1 G [D49] Municipal Manager: None required (December 2016) 0% 0% N/ 100 % 100% G 2 2 G 0% 0% N/ 5
6 TL1 8 TL1 9 TL2 0 Office of the Municipal Manager Office of the Municipal Manager Office of the Municipal Manager To open transparent corruptio n free governanc e To open transparent corruptio n free governanc e To communicate effectively be responsive to the needs of the Community Develop a risk based audit plan with an internal audit plan (RBP) (MFM - Section 165(2)(a)) & submit to udit Committee by 30 June Convene a Councillor & Senior Manageme nt strategic planning session for IDP Review & budget process by 30 Nov 2016 Communicate with the public on a quarterly basis through printed media RBP with internal audit programme submitted to the udit Committee by 30 June Strategic planning session held by 30 November 2016 editions / or communications 1 1 Carry Over 1 1 Carry Over 8 8 ccumulative 2 3 B [D53] Municipal Manager: None (September 2016) 1 1 G 1 1 G 2 2 G [D53] Municipal Manager: None required (December 2016) 4 5 G 2 6
7 TL2 1 TL2 2 TL2 3 Office of the Municipal Manager Office of the Municipal Manager Office of the Municipal Manager To communicate effectively be responsive to the needs of the Community To communicate effectively be responsive to the needs of the Community To promote cultural socio economic development of our communit y Regular ward committee meetings /or engagemen ts Undertake an annual Customer Service evaluation & submit report with recommendation on customer service to Mayoral Committee by 30 June Implement the LED Strategy by implementi ng at least 2 projects identified by working committees by June Summary of Results: Office of the Municipal Manager KPI Not Yet Measured 4 KPI Not Met 0 meetings /or engagements per frequency Customer service evaluations completed report with recommendations submitted to the Mayoral Committee by 30 June Implement at least 2 projects by June ccumulative 7 0 R [D54] Municipal Manager: Ward committee elections to be held in October 2016 as well as the first IDP ward committee meetings in October 2016 (September 2016) 1 1 Carry Over 2 2 ccumulati ve 7 17 B [D54] Municipal Manager: None (October 2016)[D54] Municipal Manager: See comments in Performanc e Comment (December 2016) G 2 7
8 KPI lmost Met 0 KPI Met 3 KPI Well Met 2 KPI Extremely Well Met 1 Total KPIs 10 Corporate Services Ref Directorate Strategic Objective KPI Unit of Measuremen t nnua l Target Revise d Target KPI Calculation Type Targe t ctual Sep-16 R Department al Corrective Measures Targe t ctual Dec-16 R Department al Corrective Measures Overall Performance for Sep - Dec 2016 Targe t ctual R TL2 4 Corporate Services To maintain bulk service infrastructure that will address backlogs for future development The percentage of the municipal capital budget excl MIG & libraries ly spent on capital projects as at 30 June (ctual amount spent on capital projects/ Total amount budgeted for capital projects)x1 00 % of Capital budget excl MIG & libraries spent as at 30 June [(ctual amount spent on capital projects/to tal amount budgeted for capital projects) X100] 95% 95% Last Value 0% 0% N/ 10% % B 10% % B 8
9 TL2 5 TL2 6 Corporate Services Corporate Services To create an efficient, effective, accountable administration To promote the wellbeing, health, safety security of our communit y Submit a regular report on human resource manageme nt in the municipality to Corporate Services Portfolio Committee 95% of MIG conditional grant allocated to sport spent by 30 June to upgrade sport infrastructure in accordance with business plan (Subject to MIG Funding approval) [(ctual amount spent on projects/ Total allocation for projects)x1 00] reports submitted % of the MIG conditional grant allocated to sport spent by 30 June 9 9 ccumulati ve 2 3 B [D213] Director Corporate Services: The target must be 1 report (September 2016) 95% 95% Last Value 0% 0% N/ 2 4 B 4 7 B 10% 25% B 10% 25% B 9
10 TL2 7 TL2 8 TL2 9 Corporate Services Corporate Services Corporate Services To budget strategically, grow diversify our revenue ensure value for money services To budget strategically, grow diversify our revenue ensure value for money services To promote the wellbeing, health, safety security of our communit y Collect 95% of budgeted income by 30 June for resorts (Excl budgeted debt provision) [(ctual amount collected/to tal amount budgeted) x100] Collect 95% of budgeted income by 30 June for speeding fines (Excl budgeted debt provision) [(ctual amount collected/ total amount budgeted) x100] 95% spent of library grant by 30 June i.t.o approved business plan [(ctual amount spent/total allocation received)x 100] % of budgeted income for resorts collected by 30 June % of budgeted income for speeding fines collected by 30 June % of library grant spent by 30 June 95% 95% Last Value 10% 30% B 50% 63% G 2 95% 95% Last Value 10% 11% G 2 95% 95% Last Value 0% 0% N/ 25% 23% O [D216] Director Corporate Services: Meeting will be held on 25 January with the service r to discuss the performanc e. (December 2016) 50% 63% G 2 25% 23% O 20% 55% B 20% 55% B 10
11 TL3 0 Corporate Services To create an efficient, effective, accountable administration 95% of training budget spent by 30 June to implement the Work Place Skills Plan [(Total amount spent on training/tot al amount budgeted)x 100] % of the training budget spent by 30 June to implement the Work Place Skills Plan 95% 95% Last Value 0% 0% N/ 20% % B 20% % B Summary of Results: Corporate Services KPI Not Yet Measured 0 KPI Not Met 0 KPI lmost Met 1 KPI Met 0 KPI Well Met 1 KPI Extremely Well Met 5 Total KPIs 7 Technical Services Ref Directorate Strategic Objective KPI Unit of Measurem ent nnu al Targe t Revise d Target KPI Calculatio n Type Targ et ctua l Sep-16 R Departmen tal Corrective Measures Targ et ctua l Dec-16 R Departmen tal Corrective Measures Overall Performance for Sep -Dec 2016 Targ et ctua l R 11
12 TL3 1 TL3 2 Technical Services Technical Services To maintain bulk service infrastructure that will address backlogs for future development To budget strategically, grow diversify our revenue ensure value for money services The percentage of municipal capital budget ly spent on capital projects as at 30 June (ctual amount spent on capital projects /Total amount budgeted for capital projects) X100 Limit unaccounte d for water to 10% by 30 June {(Number of Kilolitres Water Purchased or Purified minus Kilolitres Water Sold (incl free basic water) / Number of Kilolitres Water Purchased or Purified 100} % of Capital budget spent as at 30 June [(ctual amount spent on capital projects/ Total amount budgeted for capital projects) X100] % unaccounte d water by 30 June {(Number of Kilolitres Water Purchased or Purified minus Kilolitres Water Sold (including Free basic water) / Kilolitres Water Purchased or Purified 100} 95% 95% Last Value 0% 0% N/ 10% 10% Reverse Last Value 0% 0% N/ 10% % 0% 0% N/ B 10% % B 0% 0% N/ 12
13 TL3 3 TL3 4 Technical Services Technical Services To maintain bulk service infrastructure that will address backlogs for future development To budget strategically, grow diversify our revenue ensure value for money services 100% of MIG funding allocated for the financial year to build a new waste water treatment works in Porterville by 30 June [(Total amount spent/total amount allocated) x100] Limit unaccounted for electricity to 10% by 30 June {(Number of Electricity Units Purchased /or Generated - Electricity Units Sold (incl Free basic electricity)) / Electricity Units Purchased /or Generated) 100} % of MIG funding allocated for the financial year to build a new waste water treatment works in Porterville by 30 June % unaccounted electricity by 30 June {(Number of Electr-- city Units Purchased /or Generated - Electricity Units Sold (incl Free basic electricity)) / Electricity Units Purchased /or Generated) 100} 100% 100% Last Value 0% 0% N/ 10% 10% Reverse Last Value 0% 0% N/ 0% 0% N/ 0% 0% N/ 0% 0% N/ 0% 0% N/ 13
14 TL3 5 Technical Services To maintain bulk service infrastructure that will address backlogs for future development 100% of the MIG conditional grant spent by 30 June to upgrade infrastructure [(Total amount spent/total allocation received) x100] % of MIG conditional grant spent by 30 June 100% 100% Last Value 0% 0% N/ 0% 0% N/ 0% 0% N/ TL3 6 Technical Services To maintain bulk service infrastructure that will address backlogs for future development 100% of conditional road maintenance operational grant spent by 30 June [(Total amount spent/total allocation received) x100] % of conditional road maintenance operational grant spent by 30 June 100% 100% Last Value 0% 0% N/ 0% 0% N/ 0% 0% N/ 14
15 TL3 7 Technical Services To maintain bulk service infrastructure that will address backlogs for future development To complete a 5 megaliter reservoir at Velddrif by 30 June Completion of a 5- megaliter at Velddrif by 20 June 100% 100% Carry Over 0% 0% N/ 0% 0% N/ 0% 0% N/ TL3 8 Technical Services To maintain bulk service infrastructure that will address backlogs for future development Complete services Slelie East, Velddrif by 30 June services completed in Slelie East, Velddrif by 30 June ccumulati ve 15
16 TL3 9 Technical Services To maintain bulk service infrastructure that will address backlogs for future development Complete the top structures in lbatros Street in Velddrif by 30 June top structures completed by 30 June ccumulati ve TL4 0 Technical Services To maintain bulk service infrastructure that will address backlogs for future development Complete the top structures in Eendekuil by 30 June top structures completed in Eendekuil by 30 June ccumulati ve TL4 1 Technical Services To conserve manage the natural environment mitigate the impacts of climate change Raise public awareness on recycling to reduce household waste with awareness initiatives awareness initiatives 2 2 ccumulati ve 1 1 G [D486] Director: Technical Services: Continue public awareness of recycling initiatives (December 2016) 1 1 G 16
17 TL4 2 Technical Services To promote the wellbeing, health, safety security of our community 95% water quality level obtained as per SNS 241 physical & micro parameters as at 31 December June % water quality level as at 31 December June 95% 95% Last Value 0% 0% N/ 95% % O [D487] Director: Technical Services: Monitor ongoing basis (December 2016) 95% % O Summary of Results: Technical Services KPI Not Yet Measured 9 KPI Not Met 0 KPI lmost Met 1 KPI Met 1 KPI Well Met 0 KPI Extremely Well Met 1 Total KPIs 12 Financial Services Ref Directorate Strategic Objective KPI Unit of Measurem ent nnu al Targe t Revise d Target KPI Calculatio n Type Targ et ctua l Sep-16 R Departmen tal Corrective Measures Targ et ctua l Dec-16 R Departmen tal Corrective Measures Overall Performance for Sep -Dec 2016 Targ et ctua l R 17
18 TL4 3 Financial Services To budget strategically, grow diversify our revenue ensure value for money services Institute legal processes by 30 June against 95% of nonexchange debtors to improve credit control ( rates & availability charges debtors older than 90 days hed over for collection/ Total number of rates & availability chargers debtors older than 90 days)x100] % of nonexchange debtors against whom legal action can be was instituted by 30 June 95% 95% Carry Over 0% 0% N/ 50% 0% R [D288] Director Finance: Ongoing process (December 2016) 50% 0% R 18
19 TL4 4 TL4 5 TL4 6 Financial Services Financial Services Financial Services To budget strategically, grow diversify our revenue ensure value for money services To budget strategically, grow diversify our revenue ensure value for money services To budget strategically, grow diversify our revenue ensure value for money services chieve a payment percentage of 97% as at 30 June ((Gross Debtors Closing Balance + Billed Revenue - Gross Debtors Opening Balance + Bad Debts Written Off)/Billed Revenue) x 100) Complete the monthly bank reconciliations within 15 days after month end Submit monthly Section 71 Report to National Treasury i.t.o. MFM before 10th working day of each month Payment % as at 30 June ((Gross Debtors Closing Balance + Billed Revenue - Gross Debtors Opening Balance + Bad Debts Written Off)/Billed Revenue) x 100) bank reconciliations completed monthly within 15 days after month end reports submitted 96% 97% Last Value 60% % ccumulati ve ccumulati ve G 2 96% % O [D289] Director Finance: Unreceipted income due to festive season closure dates (December 2016) 96% % 3 3 G 3 3 G 6 6 G 3 3 G 3 3 G 6 6 G O 19
20 TL4 7 Financial Services To budget strategically, grow diversify our revenue ensure value for money services Submit monthly VT 201 returns to SRS by 25th of each month VT 201 returns submitted to SRS ccumulati ve 3 3 G 3 3 G 6 6 G TL4 8 Financial Services To budget strategically, grow diversify our revenue ensure value for money services 100% of the conditional FMG conditional grant spent by 30 June [(Total amount spent/total allocation received) x100] % of conditional FMG grant spent by 30 June 100% 100% Last Value 40% % R [D293] Director Finance: Project in process (September 2016) 60% % R [D293] Director Finance: Project in process (December 2016) 60% % R Summary of Results: Financial Services KPI Not Yet Measured 0 KPI Not Met 2 KPI lmost Met 1 KPI Met 3 KPI Well Met 0 KPI Extremely Well Met 0 Total KPIs 6 Council Ref Directorate Strategic Objective KPI Unit of Measurem ent nnu al Targe t Revise d Target KPI Calculatio n Type Targ et ctua l Sep-16 R Departmen tal Corrective Measures Targ et ctua l Dec-16 R Departmen tal Corrective Measures Overall Performance for Sep - Dec 2016 Targ et ctua l R 20
21 TL1 Council To maintain bulk service infrastructure that will address backlogs for future development TL2 Council To maintain bulk service infrastructure that will address backlogs for future development formal households that receive piped water (credit & prepaid water) that is connected to the municipal water infrastructure network as at 30 June formal households connected to the municipal electrical infrastructure network (credit & prepaid electrical metering) (Excl Eskom areas) at 30 June households which are billed for water or have prepaid meters as at 30 June (W/WB/1) households billed for electricity or have prepaid meters (Excl Eskom areas) at 30 June (E.1 + Conlog + ctive meters) 8,658 8,7 Last Value 8,953 9,2 Last Value 21
22 TL3 Council To maintain bulk service infrastructure that will address backlogs for future development TL4 Council To maintain bulk service infrastructure that will address backlogs for future development formal households connected to the municipal waste water sanitation/ sewerage network for sewerage service, irrespective of number of water closets (toilets) at 30 June formal households for which refuse is removed once per week at 30 June households which are billed for sewerage at 30 June (S/SI/1) households which are billed for refuse removal at 30 June (R/RD/1) 6,861 7 Last Value 9,118 9,2 Last Value 22
23 TL5 Council To & maintain bulk service infrastructure that will address backlogs for future development Provide free basic water to indigent households households receiving free basic water 1,882 2,245 Last Value TL6 Council To & maintain bulk service infrastructure that will address backlogs for future development Provide free basic electricity to indigent households households receiving free basic electricity 1,662 2 Last Value TL7 Council To & maintain bulk service infrastructure that will address backlogs for future development Provide free basic sanitation to indigent households households receiving free basic sanitation 1,721 2 Last Value 23
24 TL8 Council To & maintain bulk service infrastructure that will address backlogs for future development Provide free basic refuse removal to indigent households households receiving free basic refuse removal 1,885 2,245 Last Value TL9 Council To promote cultural socio economic development of our community Create full time equivalents (FTE's) in terms of the EPWP programme by 30 June FTE's created by 30 June Last Value 24
25 TL1 0 Council To create an efficient, effective, accountable administration The % of a municiality s personnel budget ly spent on implemen its workplace skills plan as at 30 June [(Total expenditure on training /total personnel budget) /100] % of personnel budget spent on training [(Total expenditure on training/ total personnel budget)/10 0] as at 30 June 1% 1% Last Value 0% 0% N/ 0% 0% N/ 0% 0% N/ 25
26 TL1 1 Council To budget strategical ly, grow diversify our revenue ensure value for money services Financial viability measured ito municipality's ability to meet its service debt obligations as at 30 June (Short Term Borrowing + Bank Overdraft + Short Term Lease +Long Term Borrowing + Long Term Lease) /Total Operating Revenue - Operating Conditional Grant) Debt to Revenue as at 30 June (Short Term Borrowing + Bank Over-draft + Short Term Lease + Long Term Borrowing + Long Term Lease) / Total Operating Revenue - Operating Conditional Grant) 2.40 % 23% Last Value 0% 0% N/ 0% 0% N/ 0% 0% N/ TL1 2 Council To budget strategical ly, grow diversify our revenue ensure value for money services Financial viability measured in terms of outsting service debtors as at 30 June (Total outsting service debtors/ revenue received for services) Service debtors to revenue as at 30 June (Total outsting service debtors/ revenue received for services) 32% 35% Last Value 0% 0% N/ 0% 0% N/ 0% 0% N/ 26
27 TL1 3 Council To budget strategical ly, grow diversify our revenue ensure value for money services Financial viability measured ito available cash to cover fixed operating expenditure as at 30 June ((Cash Cash Equivalents Unspent Conditional Grants Overdraft) + Short Term Investment) /Monthly Fixed Operational Expenditure excluding (Depreciati on, mortization, & Provision for Bad Debts, Impairment & Loss on Disposal of ssets)) Cost coverage as at 30 June ((Cash Cash Equivalents - Unspent Conditional Grants - Overdraft) + Short Term Investment) / Monthly Fixed Operational Expenditure excluding (Depreciati on, mortisatio n, Provision for Bad Debts, Impairment Loss on Disposal of ssets)) Last Value Summary of Results: Council KPI Not Yet Measured 13 KPI Not Met 0 KPI lmost Met 0 KPI Met 0 KPI Well Met 0 KPI Extremely Well Met 0 Total KPIs 13 27
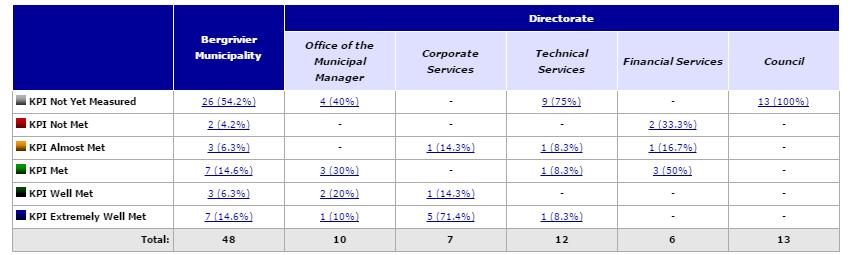
28 Summary of Results KPI Not Yet Measured 26 KPI Not Met 2 KPI lmost Met 3 KPI Met 7 KPI Well Met 3 KPI Extremely Well Met 7 Total KPIs 48 Report generated on 20 January at 08:09. 28
 Municipal Reporting Regulations, Government Gazette 32141, 17 pril 2009.")
29 Bergrivier Municipality Berivier In Year Report of Municipalities Prepared in terms of the Local Government Municipal Finance Management ct (56/2003) Municipal Reporting Regulations, Government Gazette 32141, 17 pril Quarterly Monthly Statement December 2016 PRT 1: IN-YER REPORT 29 P a g e
30 Section 1 - Mayor s Report Section 2 - Resolutions Section 3 - Executive Summary Section 4 - In-year budget statement tables PRT 2: SUPPORTING DOCUMENTTION Section 5 - Debtors analysis Section 6 - Creditors analysis Section 7 - Investment portfolio analysis Section 8 - llocation grant receipts expenditure Section 9 - Councillor board members allowances Employee benefits Section 10 - Capital programme performance Section 11 - Municipal manager s quality certification PRT 1 IN-YER REPORT Section 1 Mayor s Report In-Year Report - Monthly The monthly budget statement for December 2016 has been prepared to meet the legislative requirements of the Municipal Reporting Regulations. 30 P a g e
31 1.1.2 Financial problems or risks facing the municipality No problems or risks are facing the municipality currently. The municipality shows a positive cash flow. Section 2 - Resolutions RECOMMENDTION: That Council notes the monthly budget statement supporting documentation for December Section 3 Executive Summary 3.1 Introduction The Municipal Manager, as ccounting Officer of the Municipality, is required by Section 71(1) of the Municipal Finance Management ct to submit a report in a prescribed format to the Mayor within 10 working days after the end of each month on the state of the Municipality s budget. 3.2 Consolidated performance The following table summarises the overall position on the capital operating s Year to date Description Total Revenue (excluding capital transfers contributions) Original djusted YearTD YearTD budget 298,612, ,791, ,469, ,395, , % Total Expenditure 305,576, ,636, ,764, ,818, ,053, % Total Capital Expenditure 32,478, ,328, ,405, ,664, ,258, % gainst annual budget (original approved latest adjustments) The statement of Financial Performance compares the expenditure revenue against budget for the period ended 31 December Revenue by Source (Table C4) 31 P a g e
32 2015/16 Year 2016/17 Description udited Outcome Original djusted YearTD YearTD budget R thouss % Revenue By Source Property rates 52,508 55,677 55,677 33,133 27,839 5,294 19% Service charges - electricity revenue 86, , ,386 49,328 50,193 (865) -2% Service charges - water revenue 23,629 24,765 24,765 11,508 12,383 (874) -7% Service charges - sanitation revenue 10,212 10,278 10,278 5,504 5, % Service charges - refuse revenue 17,072 17,111 17,111 9,200 8, % Rental of facilities equipment 4,323 4,242 4,242 3,199 2,121 1,078 51% Interest earned - ex ternal inv estments 4,297 3,200 3,200 2,684 1,600 1,084 68% Interest earned - outsting debtors 3,776 4,240 4,240 2,025 2,120 (95) -4% Fines 7,001 4,307 4, ,154 (1,664) -77% Licences permits 1,219 1,560 1, (67) -9% gency serv ices 2,200 2,041 2,041 1,075 1, % Transfers recognised - operational 42,111 67,211 67,390 28,960 33,606 (4,646) -14% Other revenue 3,918 3,594 3,594 1,652 1,797 (145) -8% Gains on disposal of PPE 69 Total Revenue (excluding capital transfers contributions) 258, , , , , % The annual billing for rates charges takes place in July is reflected in this report. Operating expenditure by type (Table C4) 2015/16 Description udited Original djusted Outcome Year 2016/17 YearTD YearTD budget R thouss % Expenditure By Type Employee related costs 96, , ,291 52,229 53,645 (1,416) -3% Remuneration of councillors 5,282 4,861 4,861 2,621 2, % Debt impairment 7,764 8,795 8,795 4,398 4,398 (0) 0% Depreciation & asset impairment 17,521 18,539 18,539 9,289 9, % Finance charges 11,582 12,214 12,214 5,701 6,107 (406) -7% Bulk purchases 73,029 75,397 75,397 41,584 37,699 3,886 10% Other materials Contracted serv ices Transfers grants 3,214 3,561 3,561 1,388 1,780 (393) -22% Other expenditure 38,842 74,919 74,979 22,555 37,460 (14,905) -40% Loss on disposal of PPE Total Expenditure 253, , , , ,788 (13,024) -9% Refer to Table C4 for further details on both revenue by source expenditure by type. Capital expenditure (Table C5) 32 P a g e
33 Year 2016/17 Vote Description Original djusted YearTD YearTD budget R thouss % Multi-Year expenditure appropriation Vote 1 - Municipal Manager Vote 2 - Finance (400) -94% Vote 3 - Corporate Serv ices % Vote 4 - Technical Serv ices 1,385 1, (608) -88% Total Capital Multi-year expenditure 2,615 2, ,308 (875) -67% Single Year expenditure appropriation Vote 1 - Municipal Manager (188) -91% Vote 2 - Finance 1,030 1, (169) -33% Vote 3 - Corporate Serv ices 4,449 4,699 1,905 2,350 (445) -19% Vote 4 - Technical Serv ices 23,968 24,569 5,702 12,284 (6,583) -54% Total Capital single-year expenditure 29,863 30,714 7,973 15,357 (7,384) -48% Total Capital Expenditure 32,478 33,329 8,406 16,664 (8,259) -50% Capital Expenditure: The total capital expenditure as at 31 December 2016 amounts to R 8,406 million of the approved capital budget of R 33,329 million. Refer to Table C5 for more detail Reports, tables, charts & explanations Summary tables or charts are included under the section Other Supporting Documentation. 3.3 Material s from SDBIP There are no material s between the year to date budget the year to date. 3.4 Remedial or corrective steps No action required. 33 P a g e
34 3.5 Performance in relation to quarterly SDBIP targets WC013 Bergrivier - Supporting Table SC2 Monthly Statement - performance indicators - Mid-Year ssessment 2015/16 Year 2016/17 Description of financial indicator Basis of calculation Ref udited Outcome Original djusted YearTD Full Year Forecast Borrowing Management Capital Charges to Operating Ex penditure Interest & principal paid/operating Ex penditure 3.0% 10.1% 10.1% 4.1% 5.6% Borrow ed funding of 'ow n' capital ex penditure Borrow ings/capital ex penditure ex cl. transfers grants 0.0% 20.8% 20.3% 4.0% 20.3% Safety of Capital Debt to Equity Loans, ccounts Pay able, Ov erdraft & Tax 27.4% 33.6% 33.4% % 33.6% Provision/ Funds & Reserves Gearing Long Term Borrowing/ Funds & Reserves 307.6% 351.8% 351.8% 0.0% 351.8% Liquidity Current Ratio Current assets/current liabilities % 270.9% 271.1% -21.0% 270.9% Liquidity Ratio Monetary ssets/current Liabilities 147.5% 126.8% 127.0% 9.4% 126.8% Revenue Management nnual Debtors Collection Rate Last 12 Mths Receipts/ Last 12 Mths Billing (Pay ment Lev el %) Outsting Debtors to Revenue Total Outsting Debtors to nnual Revenue 27.3% 25.7% 25.7% 2.7% 25.7% Longsting Debtors Recov ered Debtors > 12 Mths Recov ered/total Debtors > 0.0% 0.0% 0.0% 0.0% 0.0% 12 Months Old Creditors Management Creditors Sy stem Efficiency % of Creditors Paid Within Terms (w ithin MFM s 65(e)) Funding of Provisions Percentage Of Prov isions Not Funded Unfunded Prov isions/total Prov isions Other Indicators Electricity Distribution Losses % Volume (units purchased generated less % units sold)/units purchased generated Water Distribution Losses % Volume (units purchased ow n source less % units sold)/total units purchased own source Employee costs Employee costs/total Revenue - capital revenue 37.1% 35.9% 35.9% 34.9% 35.9% Repairs & Maintenance R&M/Total Revenue - capital revenue 0.0% 0.0% 0.0% 0.0% 0.0% Interest & Depreciation I&D/Total Rev enue - capital rev enue 11.2% 10.3% 10.3% 3.8% 5.7% IDP regulation financial viability indicators i. Debt cov erage (Total Operating Rev enue - Operating Grants)/Debt service payments due w ithin financial y ear) ii. O/S Serv ice Debtors to Rev enue Total outsting serv ice debtors/annual rev enue received for services iii. Cost cov erage (v ailable cash + Inv estments)/monthly fix ed operational expenditure Section 4 In-year budget statement tables 4.1 Monthly budget statements Table C1: s71 Monthly Statement Summary 34 P a g e
35 WC013 Bergrivier - Table C1 Monthly Statement Summary - Mid-Year ssessment 2015/16 udited Original djusted Monthly Outcome budget R thouss % Financial Performance YearTD YearTD Full Year Forecast Property rates 52,508 55,677 55,677 3,866 33,133 27,839 5,294 19% 55,677 Service charges 137, , ,540 11,845 75,540 76,270 (730) -1% 152,540 Inv estment rev enue 4,297 3,200 3, ,684 1,600 1,084 68% 3,200 Transfers recognised - operational 42,111 67,211 67,390 12,056 28,960 33,606 (4,646) -14% 67,211 Other own revenue 22,506 19,984 19,984 2,477 9,153 9,992 (839) -8% 19,984 Total Revenue (excluding capital transfers 258, , ,792 30, , , % 298,613 contributions) Employee costs 96, , ,291 8,139 52,229 53,645 (1,416) -3% 107,291 Remuneration of Councillors 5,282 4,861 4, ,621 2, % 4,861 Depreciation & asset impairment 17,521 18,539 18,539 1,545 9,289 9, % 18,539 Finance charges 11,582 12,214 12,214 3,069 5,701 6,107 (406) -7% 12,214 Materials bulk purchases 73,029 75,397 75,397 5,696 41,584 37,699 3,886 10% 75,397 Transfers grants 3,214 3,561 3, ,388 1,780 (393) -22% 3,561 Other expenditure 46,607 83,714 83,774 4,967 26,952 41,857 (14,905) -36% 83,714 Total Expenditure 253, , ,637 23, , ,788 (13,024) -9% 305,577 Surplus/(Deficit) 5,517 (6,964) (6,845) 6,868 9,705 (3,482) 13, % (6,964) Transfers recognised - capital 19,954 15,044 15, ,702 7,522 (3,820) -51% 15,044 Contributions & Contributed assets Surplus/(Deficit) after capital transfers & contributions 25,471 8,080 9,050 7,637 13,407 4,040 9, % 8,080 Share of surplus/ (deficit) of associate Surplus/ (Deficit) for the year 25,471 8,080 9,050 7,637 13,407 4,040 9, % 8,080 Capital expenditure & funds sources Capital expenditure 32,478 33,329 1,896 8,406 16,664 (8,259) -50% 33,329 Capital transfers recognised 14,844 15,695 1,314 5,008 7,847 (2,840) -36% 15,695 Public contributions & donations % 200 Borrow ing 6,750 6, ,375 (3,035) -90% 6,750 Internally generated funds 10,684 10, ,906 5,342 (2,436) -46% 10,684 Total sources of capital funds 32,478 33,329 1,896 8,406 16,664 (8,259) -50% 33,329 Financial position Total current assets 137, , ,739 3, ,620 Total non current assets 349, , ,252 (1,130) 366,401 Total current liabilities 44,515 53,762 53,762 (14,340) 53,762 Total non current liabilities 147, , ,928 2, ,928 Community wealth/equity 294, , ,301 13, ,331 Cash flows Net cash from (used) operating 46,970 27,866 28,717 2,248 (22,064) 13,933 35, % 27,866 Net cash from (used) inv esting (32,116) (32,845) (33,696) (1,648) 22,595 (16,423) (39,018) 238% (32,845) Net cash from (used) financing 2,461 3,050 3,050 (1,537) (1,878) 1,525 3, % 3,050 Cash/cash equivalents at the month/year end 65,660 68,181 68,181 64,313 69,146 4,833 7% 63,731 Debtors & creditors analysis 0-30 Days Days Days Days Dys Dys Debtors ge nalysis Description 181 Dys- Over 1Yr 1 Yr Total By Income Source 14,936 5,575 2,248 1,962 3,630 48,661 77,011 Creditors ge nalysis Year 2016/17 Total Creditors Total Table C2: Monthly Statement - Financial Performance (stard classification) This table reflects the operating budget (Financial Performance) in the stard classifications which are the Government Finance Statistics Functions Subfunctions. These are used by National Treasury to assist the compilation of national international accounts for comparison purposes, regardless of the unique organisational structures used by the different institutions. 35 P a g e
36 WC013 Bergrivier - Table C2 Monthly Statement - Financial Performance (stard classification) - Mid-Year ssessment 2015/16 Year 2016/17 Description Ref udited Outcome Original djusted Monthly YearTD YearTD budget Full Year Forecast R thouss 1 % Revenue - Stard Governance administration 83,686 89,342 89,402 16,472 64,242 44,671 19,570 44% 89,342 Executiv e council 18,788 23,314 23,314 11,096 24,996 11,657 13, % 23,314 treasury office 63,185 65,248 65,308 4,768 38,407 32,624 5,782 18% 65,248 Corporate services 1, % 780 Community public safety 19,321 39,441 39,726 1,788 6,067 19,721 (13,654) -69% 39,441 Community social services 6,341 7,076 7, ,849 3,538 (689) -19% 7,076 Sport recreation 5,942 4,708 4, ,714 2, % 4,708 Public safety 6,990 4,340 4, ,170 (1,688) -78% 4,340 Housing 48 23,317 23, ,659 (11,637) -100% 23,317 Health Economic environmental services 6,007 5,890 5, ,949 2, % 5,890 Planning development 1, % 787 Road transport 4,721 5,103 5, ,361 2,552 (191) -7% 5,103 Env ironmental protection Trading services 169, , ,668 12,711 79,913 89,492 (9,578) -11% 178,983 Electricity 91, , ,581 7,308 50,219 51,948 (1,729) -3% 103,896 Water 39,907 39,997 39,997 2,954 14,820 19,999 (5,178) -26% 39,997 Waste water management 16,033 13,266 13, ,506 6,633 (1,127) -17% 13,266 Waste management 21,909 21,824 21,824 1,569 9,368 10,912 (1,544) -14% 21,824 Other 4 Total Revenue - Stard 2 278, , ,687 31, , ,828 (3,657) -2% 313,657 Expenditure - Stard Governance administration 56,302 45,781 45,841 3,945 19,160 22,890 (3,730) -16% 45,781 Executiv e council 16,090 20,573 20,573 1,225 8,227 10,287 (2,060) -20% 20,573 treasury office 15,900 2,742 2, ,371 (980) -71% 2,742 Corporate services 24,311 22,465 22,465 2,674 10,542 11,233 (691) -6% 22,465 Community public safety 35,825 60,541 60,541 3,263 18,457 30,271 (11,813) -39% 60,541 Community social services 6,644 7,251 7, ,676 3, % 7,251 Sport recreation 12,685 15,154 15,154 1,272 7,729 7, % 15,154 Public safety 15,218 13,457 13,457 1,116 6,506 6,729 (223) -3% 13,457 Housing 1,278 24,679 24, ,340 (11,793) -96% 24,679 Health Economic environmental services 28,626 35,119 35,119 2,833 17,321 17,559 (238) -1% 35,119 Planning development 4,208 4,511 4, ,104 2,255 (152) -7% 4,511 Road transport 24,418 30,608 30,608 2,528 15,217 15,304 (87) -1% 30,608 Env ironmental protection Trading services 132, , ,136 13,821 84,826 82,068 2,758 3% 164,136 Electricity 86, , ,145 7,904 55,709 51,572 4,137 8% 103,145 Water 18,044 21,845 21,845 2,406 10,657 10,923 (265) -2% 21,845 Waste water management 8,198 13,578 13,578 1,437 7,006 6, % 13,578 Waste management 20,113 25,568 25,568 2,073 11,453 12,784 (1,331) -10% 25,568 Other Total Expenditure - Stard 3 253, , ,637 23, , ,788 (13,024) -9% 305,577 Surplus/ (Deficit) for the year 25,471 8,080 9,050 7,637 13,407 4,040 9, % 8, Table C3: Monthly Statement - Financial Performance (revenue expenditure by municipal vote) The municipal votes reflect the organisational structure of the municipality which is made up of the following directorates: Municipal Manager, Finance, Corporate Services Technical Services. 36 P a g e
37 WC013 Bergrivier - Table C3 Monthly Statement - Financial Performance (revenue expenditure by municipal vote) - Mid-Year Vote Description 2015/16 udited Outcome Original djusted Monthly YearTD YearTD budget R thouss % Revenue by Vote 1 Full Year Forecast Vote 1 - Municipal Manager 18,788 23,314 23,314 11,096 24,996 11,657 13, % 23,314 Vote 2 - Finance 63,185 65,248 65,308 4,768 38,407 32,624 5, % 65,248 Vote 3 - Corporate Services 22,316 19,541 19,541 2,036 7,559 9,771 (2,211) -22.6% 19,541 Vote 4 - Technical Services 174, , ,523 13,598 82, ,777 (20,568) -20.0% 205,553 Total Revenue by Vote 2 278, , ,687 31, , ,828 (3,657) -2.3% 313,657 Expenditure by Vote 1 Ref Year 2016/17 Vote 1 - Municipal Manager 16,090 20,573 20,573 1,225 8,227 10,287 (2,060) -20.0% 20,573 Vote 2 - Finance 15,900 2,742 2, ,371 (980) -71.4% 2,742 Vote 3 - Corporate Services 47,447 44,182 44,191 3,658 21,268 22,095 (828) -3.7% 44,182 Vote 4 - Technical Services 173, , ,070 18, , ,035 (9,157) -7.7% 238,064 Total Expenditure by Vote 2 253, , ,637 23, , ,788 (13,024) -8.5% 305,562 Surplus/ (Deficit) for the year 2 25,471 8,094 9,050 7,637 13,407 4,040 9, % 8, Table C4: Monthly Statement - Financial Performance (revenue expenditure) 37 P a g e
38 WC013 Bergrivier - Table C4 Monthly Statement - Financial Performance (revenue expenditure) - Mid-Year ssessment 2015/16 udited Outcome Original djusted Monthly YearTD YearTD budget R thouss % Full Year Revenue By Source Property rates 52,508 55,677 55,677 3,866 33,133 27,839 5,294 19% 55,677 Property rates - penalties & collection charges Service charges - electricity revenue 86, , ,386 7,205 49,328 50,193 (865) -2% 100,386 Service charges - water revenue 23,629 24,765 24,765 2,219 11,508 12,383 (874) -7% 24,765 Service charges - sanitation revenue 10,212 10,278 10, ,504 5, % 10,278 Service charges - refuse revenue 17,072 17,111 17,111 1,541 9,200 8, % 17,111 Serv ice charges - other Rental of facilities equipment 4,323 4,242 4,242 1,225 3,199 2,121 1,078 51% 4,242 Interest earned - ex ternal inv estments 4,297 3,200 3, ,684 1,600 1,084 68% 3,200 Interest earned - outsting debtors 3,776 4,240 4, ,025 2,120 (95) -4% 4,240 Div idends receiv ed Fines 7,001 4,307 4, ,154 (1,664) -77% 4,307 Licences permits 1,219 1,560 1, (67) -9% 1,560 gency serv ices 2,200 2,041 2, ,075 1, % 2,041 Transfers recognised - operational 42,111 67,211 67,390 12,056 28,960 33,606 (4,646) -14% 67,211 Other revenue 3,918 3,594 3, ,652 1,797 (145) -8% 3,594 Gains on disposal of PPE 69 Total Revenue (excluding capital transfers contributions) 258, , ,792 30, , , % 298,613 Expenditure By Type Forecast Employee related costs 96, , ,291 8,139 52,229 53,645 (1,416) -3% 107,291 Remuneration of councillors 5,282 4,861 4, ,621 2, % 4,861 Debt impairment 7,764 8,795 8, ,398 4,398 (0) 0% 8,795 Depreciation & asset impairment 17,521 18,539 18,539 1,545 9,289 9, % 18,539 Finance charges 11,582 12,214 12,214 3,069 5,701 6,107 (406) -7% 12,214 Bulk purchases 73,029 75,397 75,397 5,696 41,584 37,699 3,886 10% 75,397 Other materials Contracted serv ices Transfers grants 3,214 3,561 3, ,388 1,780 (393) -22% 3,561 Other expenditure 38,842 74,919 74,979 4,234 22,555 37,460 (14,905) -40% 74,919 Loss on disposal of PPE Total Expenditure 253, , ,637 23, , ,788 (13,024) -9% 305,577 Surplus/(Deficit) 5,517 (6,964) (6,845) 6,868 9,705 (3,482) 13,187 (0) (6,964) Transfers recognised - capital 19,954 15,044 15, ,702 7,522 (3,820) (0) 15,044 Contributions recognised - capital Contributed assets Surplus/(Deficit) after capital transfers & contributions Tax ation 25,471 8,080 9,050 7,637 13,407 4,040 8,080 Surplus/(Deficit) after taxation 25,471 8,080 9,050 7,637 13,407 4,040 8,080 ttributable to minorities Description Surplus/(Deficit) attributable to municipality 25,471 8,080 9,050 7,637 13,407 4,040 8,080 Share of surplus/ (deficit) of associate Ref Year 2016/17 Surplus/ (Deficit) for the year 25,471 8,080 9,050 7,637 13,407 4,040 8,080 The following tables reflect the percentage for revenue by source expenditure by type, reasons for material deviations the remedial action thereof. ppendix : Material explanations for revenue by source (refer Table C4) 38 P a g e
39 YearTD YearTD Description budget Reasons for material deviations R thouss % Revenue By Source Property rates 33,133 27,839 5,294 19% Variance are due to the misalignment betw een the budget the billing Serv ice charges - electricity rev enue 49,328 50,193 (865) -2% Immaterial Variance Serv ice charges - water rev enue 11,508 12,383 (874) -7% Immaterial Variance Serv ice charges - sanitation rev enue 5,504 5, % Immaterial Variance Serv ice charges - refuse rev enue 9,200 8, % Immaterial Variance Rental of facilities equipment 3,199 2,121 1,078 51% The v ariance is due to an increase in the usage of facilities Interest earned - external inv estments 2,684 1,600 1,084 68% The ov er recov ery is due to the higher than expected cash balances available Interest earned - outsting debtors 2,025 2,120 (95) -4% Immaterial Variance Fines 490 2,154 (1,664) -77% The budget is not in line w ith the receipts Licences permits (67) -9% Immaterial Variance gency serv ices 1,075 1, % Immaterial Variance Transfers recognised - operational 28,960 33,606 (4,646) -14% The non-alignment of projections to the National Treasury pay ment schedule w hich is only av ailable after the approv al of the MTREF resulted in this v ariance Other rev enue 1,652 1,797 (145) -8% Immaterial Variance Expenditure By Type Employee related costs 52,229 53,645 (1,416) -3% Immaterial Variance Remuneration of councillors 2,621 2, % Immaterial Variance Debt impairment 4,398 4,398 (0) 0% Immaterial Variance Depreciation & asset impairment 9,289 9, % Immaterial Variance Finance charges 5,701 6,107 (406) -7% Immaterial Variance Bulk purchases 41,584 37,699 3,886 10% Immaterial Variance Transfers grants 1,388 1,780 (393) -22% Transfers grants solely gets paid out w hen a claim gets hed in according to legislation Other ex penditure 22,555 37,460 (14,905) -40% not align to spending 39 P a g e
40 4.1.5 Table C5: Monthly Statement - Capital Expenditure (municipal vote, stard classification funding) WC013 Bergrivier - Table C5 Monthly Statement - Capital Expenditure (municipal vote, stard classification funding) - Mid-Year ssessment 2015/16 Year 2016/17 udited Outcome Original djusted Monthly YearTD YearTD budget R thouss 1 % Multi-Year expenditure appropriation 2 Full Year Forecast Vote 1 - Municipal Manager Vote 2 - Finance (400) -94% 850 Vote 3 - Corporate Services % 380 Vote 4 - Technical Services 1,385 1, (608) -88% 1,385 Total Capital Multi-year expenditure 4,7 2,615 2, ,308 (875) -67% 2,615 Single Year expenditure appropriation 2 Vote 1 - Municipal Manager (188) -91% 416 Vote 2 - Finance 1,030 1, (169) -33% 1,030 Vote 3 - Corporate Services 4,449 4, ,905 2,350 (445) -19% 4,699 Vote 4 - Technical Services 23,968 24,569 1,254 5,702 12,284 (6,583) -54% 24,569 Total Capital single-year expenditure 4 29,863 30,714 1,762 7,973 15,357 (7,384) -48% 30,714 Total Capital Expenditure 32,478 33,329 1,896 8,406 16,664 (8,259) -50% 33,329 Capital Expenditure - Stard Classification Governance administration 4,610 4, ,409 2,305 (896) -39% 4,610 Executiv e council (188) -91% 416 treasury office 1,880 1, (568) -60% 1,880 Corporate services 2,314 2, ,018 1,157 (139) -12% 2,314 Community public safety 4,387 4, ,597 2,319 (721) -31% 4,387 Community social services 1,249 1, (21) -3% 1,249 Sport recreation 1,678 1, (87) -9% 1,678 Public safety 1,460 1, (614) -84% 1,460 Housing Health Economic environmental services 3,315 3, ,658 (906) -55% 3,315 Planning development (4) -83% 10 Road transport 3,305 3, ,653 (902) -55% 3,305 Env ironmental protection Trading services 20,166 20,767 1,075 4,648 10,383 (5,736) -55% 20,767 Electricity 3,646 4, ,123 (1,481) -70% 4,247 Water 6,352 6, ,441 3, % 6,352 Waste water management 7,870 7, ,935 (3,396) -86% 7,870 Waste management 2,298 2, ,149 (1,123) -98% 2,298 Other Total Capital Expenditure - Stard Classification 3 32,478 33,329 1,896 8,406 16,664 (8,259) -50% 33,079 Funded by: Vote Description Ref National Government 14,074 14, ,455 7,462 (3,007) -40% 14,925 Provincial Government % 770 District Municipality Other transfers grants Transfers recognised - capital 14,844 15,695 1,314 5,008 7,847 (2,840) -36% 15,695 Public contributions & donations % 200 Borrowing 6 6,750 6, ,375 (3,035) -90% 6,750 Internally generated funds 10,684 10, ,906 5,342 (2,436) -46% 10,684 Total Capital Funding 32,478 33,329 1,896 8,406 16,664 (8,259) -50% 33, P a g e
41 4.1.6 Table C6: Monthly Statement - Financial Position WC013 Bergrivier - Table C6 Monthly Statement - Financial Position - Mid-Year ssessment 2015/16 Year 2016/17 Description Ref udited Original djusted YearTD Full Year R thouss 1 SSETS Current assets Outcome Forecast Cash 65,660 28,181 28,300 (1,347) 28,181 Call inv estment deposits 40,000 40,000 40,000 Consumer debtors 62,146 70,565 70,565 4,324 70,565 Other debtors 4,656 3,893 3,893 (49) 3,893 Current portion of long-term receiv ables 1,813 Inv entory 3,059 2,981 2, ,981 Total current assets 137, , ,739 3, ,620 Non current assets Long-term receiv ables 1,943 2,220 2,220 (266) 2,220 Inv estments Inv estment property 12,861 12,861 12,861 12,861 Inv estments in ssociate Property, plant equipment 332, , ,050 (864) 346,199 gricultural Biological assets Intangible assets 2,044 5,122 5,122 5,122 Other non-current assets Total non current assets 349, , ,252 (1,130) 366,401 TOTL SSETS 486, , ,991 1, ,021 LIBILITIES Current liabilities Bank ov erdraft Borrow ing Consumer deposits 3,149 3,196 3, ,196 Trade other pay ables 32,283 43,775 43,775 (14,331) 43,775 Prov isions 9,082 6,790 6,790 (82) 6,790 Total current liabilities 44,515 53,762 53,762 (14,340) 53,762 Non current liabilities Borrow ing 48,401 54,984 54,984 (1,625) 54,984 Prov isions 99, , ,944 4, ,944 Total non current liabilities 147, , ,928 2, ,928 TOTL LIBILITIES 192, , ,690 (11,518) 217,690 NET SSETS 2 294, , ,301 13, ,331 COMMUNITY WELTH/EQUITY ccumulated Surplus/(Deficit) 278, , ,669 13, ,699 Reserv es 15,735 15,631 15,631 15,631 TOTL COMMUNITY WELTH/EQUITY 2 294, , ,301 13, , Table C7: Monthly Statement - Cash Flow 41 P a g e
42 WC013 Bergrivier - Table C7 Monthly Statement - Cash Flow - Mid-Year ssessment 2015/16 Year 2016/17 Description Ref udited Outcome Original djusted Monthly YearTD YearTD budget Full Year Forecast R thouss 1 % CSH FLOW FROM OPERTING CTIVITIES Receipts Property rates, penalties & collection charges 51,010 54,383 54,383 3,655 29,185 27,191 1,994 7% 54,383 Service charges 139, , ,025 11,910 77,565 74,013 3,552 5% 148,025 Other revenue 9,702 11,468 11,468 3,159 17,898 5,734 12, % 11,468 Gov ernment - operating 42,398 67,211 67,330 11,092 32,997 33,606 (609) -2% 67,211 Gov ernment - capital 19,670 15,044 15,895 4,904 9,017 7,522 1,495 20% 15,044 Interest 4,297 7,440 7, ,677 3,720 (2,043) -55% 7,440 Div idends Payments Suppliers employees (210,471) (259,930) (260,049) (30,151) (186,473) (129,965) 56,508-43% (259,930) Finance charges (5,798) (12,214) (12,214) (2,542) (2,542) (6,107) (3,565) 58% (12,214) Transfers Grants (3,214) (3,561) (3,561) (14) (1,388) (1,780) (393) 22% (3,561) NET CSH FROM/(USED) OPERTING CTIVITIES 46,970 27,866 28,717 2,248 (22,064) 13,933 35, % 27,866 CSH FLOWS FROM INVESTING CTIVITIES Receipts Proceeds on disposal of PPE Decrease (Increase) in non-current debtors Decrease (increase) other non-current receiv ables (367) (367) (184) % (367) Decrease (increase) in non-current inv estments ,001 31,001 #DIV/0! Payments Capital assets (32,116) (32,478) (33,329) (1,896) (8,406) (16,239) (7,833) 48% (32,478) NET CSH FROM/(USED) INVESTING CTIVITIES (32,116) (32,845) (33,696) (1,648) 22,595 (16,423) (39,018) 238% (32,845) CSH FLOWS FROM FINNCING CTIVITIES Receipts Short term loans Borrowing long term/refinancing 6,130 6,750 6, ,375 (2,945) -87% 6,750 Increase (decrease) in consumer deposits (62) -100% 123 Payments Repay ment of borrow ing (3,945) (3,823) (3,823) (1,537) (2,308) (1,911) % (3,823) NET CSH FROM/(USED) FINNCING CTIVITIES 2,461 3,050 3,050 (1,537) (1,878) 1,525 3, % 3,050 NET INCRESE/ (DECRESE) IN CSH HELD 17,315 (1,929) (1,929) (936) (1,347) (964) (1,929) Cash/cash equiv alents at beginning: 48,344 70,110 70,110 65,660 70,110 65,660 Cash/cash equiv alents at month/y ear end: 65,660 68,181 68,181 64,313 69,146 63, P a g e
BERGRIVIER MUNICIPALITY REPORT BY THE STRATEGIC MANAGER
 BERGRIVIER MUNICIPALITY REPORT BY THE STRATEGIC MANAGER TO: MAYORAL COMMITTEE COUNCIL 2015/16 QUARTERLY BUDGET AND PERFORMANCE REPORT FOR QUARTER 4: 1 APRIL 30 JUNE 2016 SUBMITTED IN TERMS O F SECTION
Monthly Budget Statement January 2015
 SWELLENDAM MUNICIPALITY PAGE 1 SWELLENDAM MUNICIPALITY In-Year Report Prepared in terms of the Local Government: Municipal Finance Management Act (56/2003): Municipal and Reporting Regulations, Government
BERGRIVIER MUNICIPALITY REPORT BY THE STRATEGIC MANAGER
 1 BERGRIVIER MUNICIPALITY REPORT BY THE STRATEGIC MANAGER TO: MAYORAL COMMITTEE COUNCIL 016/17 QUARTERLY BUDGET AND PERFORMANCE REPORT FOR QUARTER 4: 1 APRIL 30 JUNE SUBMITTED IN TERMS OF SECTION 5(d)
BERGRIVIER MUNICIPALITY REPORT BY THE STRATEGIC MANAGER
 BERGRIVIER MUNICIPALITY REPORT BY THE STRATEGIC MANAGER TO: MAYORAL COMMITTEE COUNCIL 2018/19 QUARTERLY BUDGET AND PERFORMANCE REPORT FOR QUARTER 1: 1 JULY 30 SEPTEMBER 2018 SUBMITTED IN TERMS OF SECTION
Theewaterskloof Municipality
 Theewaterskloof Municipality Final Budget 2018/2019 to 2020/2021 29 May 2018 English is original version Copies of this document can be viewed: In the foyer of all municipal offices All public libraries
NAMA KHOI LOCAL MUNICIPALITY
 NAMA KHOI LOCAL MUNICIPALITY FINAL BUDGET 2017/18 TO 2019/20 Copies of this document can be viewed: In the foyers of all municipal buildings All public libraries within the municipality At www.namakhoi.gov.za
Verslag Ingxelo Report
 Verslag Ingxelo Report Kantoor van die Direkteur: Finansies 18 Oktober 2018 7/1/2/2-2 WYK: ALLE ITEM 7.1 VAN DIE AGENDA VAN N RAADSVERGADERING WAT GEHOU SAL WORD OP 25 OKTOBER 2018. ONDERWERP: KWARTAALVERSLAG
Verslag Ingxelo Report
 Verslag Ingxelo Report Kantoor van die Direkteur: Finansies 20 Julie 2017 7/1/2/2-2 WYK: ALLE ITEM 7.4 VAN DIE AGENDA VAN N GEWONE RAADSVERGADERING WAT GEHOU SAL WORD OP 27 JULIE 2017 ONDERWERP: KWARTAALVERSLAG
Bergrivier Municipality
 Bergrivier Municipality 1 st ADJUSTMENT BUDGET 2017-2018 27 February 2018 Table of Contents PART 1 ADJUSTMENTS BUDGET * Mayor s report * Resolutions * Executive summary * Adjustments budget tables PART
2012/13 MEDIUM TERM REVENUE AND EXPENDITURE FORECASTS
 ANNUAL BUDGET OF LEJWELEPUTSWA DISTRICT MUNICIPALITY 2012/13 MEDIUM TERM REVENUE AND EXPENDITURE FORECASTS Copies of this document can be viewed: In the foyers of all municipal buildings All public libraries
ADJUSTMENT BUDGET 2017/18
 SOL PLAATJE LOCAL MUNICIPALITY (NC091) ADJUSTMENT BUDGET 2017/18 27 February 2018 Table of Contents PART 1 - ADJUSTMENT BUDGET... 4 1. Executive Mayor s Report... 5 2. Resolutions... 5 3. Executive Summary...
ANNEXURE 23 CAPE TOWN INTERNATIONAL CONVENTION CENTRE (CTICC) (MUNICIPAL ENTITY) SCHEDULE D (ANNUAL BUDGET AND SUPPORTING TABLES)
 (MUNICIPAL ENTITY) SCHEDULE D (ANNUAL BUDGET AND SUPPORTING TABLES)") ANNEXURE 23 CAPE TOWN INTERNATIONAL CONVENTION CENTRE (CTICC) (MUNICIPAL ENTITY) SCHEDULE D (ANNUAL BUDGET AND SUPPORTING TABLES) 2018/19 Budget (March 2018) 2018/2019 CTICC SCHEDULE D ANNUAL BUDGETS AND
ANNEXURE 23 CAPE TOWN INTERNATIONAL CONVENTION CENTRE (CTICC) (MUNICIPAL ENTITY) SCHEDULE D (ANNUAL BUDGET AND SUPPORTING TABLES) 2018/19 Budget (March 2018) 2018/2019 CTICC SCHEDULE D ANNUAL BUDGETS AND
MUNICIPAL FINANCE MANAGEMENT ACT (MFMA): PRELIMINARY MONTHLY FINANCIAL REPORT FOR THE PERIOD ENDED 30 SEPTEMBER 2018 (MONTHLY BUDGET STATEMENT)
: PRELIMINARY MONTHLY FINANCIAL REPORT FOR THE PERIOD ENDED 30 SEPTEMBER 2018 (MONTHLY BUDGET STATEMENT)") 10 October 2018 THE CITY MANAGER THE EXECUTIVE MAYOR MUNICIPAL FINANCE MANAGEMENT ACT (MFMA): PRELIMINARY MONTHLY FINANCIAL REPORT FOR THE PERIOD ENDED 30 SEPTEMBER 2018 (MONTHLY BUDGET STATEMENT) 1. PURPOSE
10 October 2018 THE CITY MANAGER THE EXECUTIVE MAYOR MUNICIPAL FINANCE MANAGEMENT ACT (MFMA): PRELIMINARY MONTHLY FINANCIAL REPORT FOR THE PERIOD ENDED 30 SEPTEMBER 2018 (MONTHLY BUDGET STATEMENT) 1. PURPOSE
Bergrivier Municipality
 Bergrivier Municipality 2 nd ADJUSTMENT BUDGET 2016-2017 9 February 2017 Table of Contents PART 1 ADJUSTMENTS BUDGET * Mayor s report * Resolutions * Executive summary * Adjustments budget tables PART
MUNICIPAL FINANCE MANAGEMENT ACT (MFMA): PRELIMINARY MONTHLY FINANCIAL REPORT FOR THE PERIOD ENDED 31 DECEMBER 2017 (MONTHLY BUDGET STATEMENT)
: PRELIMINARY MONTHLY FINANCIAL REPORT FOR THE PERIOD ENDED 31 DECEMBER 2017 (MONTHLY BUDGET STATEMENT)") 12 JANUARY 2018 THE CITY MANAGER THE EXECUTIVE MAYOR MUNICIPAL FINANCE MANAGEMENT ACT (MFMA): PRELIMINARY MONTHLY FINANCIAL REPORT FOR THE PERIOD ENDED 31 DECEMBER 2017 (MONTHLY BUDGET STATEMENT) 1. PURPOSE
12 JANUARY 2018 THE CITY MANAGER THE EXECUTIVE MAYOR MUNICIPAL FINANCE MANAGEMENT ACT (MFMA): PRELIMINARY MONTHLY FINANCIAL REPORT FOR THE PERIOD ENDED 31 DECEMBER 2017 (MONTHLY BUDGET STATEMENT) 1. PURPOSE
Adjustments Budget of Kareeberg Municipality
 Adjustments Budget of Kareeberg Municipality 2015/16 VISION A SUSTAINABLE, AFFORDABLE and DEVELOPMENTAL QUALITY SERVICE for ALL MISSION WE WLL ACHIEVE OUR VISION BY ENSURING THAT WE: Provide a continuous
NW371 Moretele - Table A1 Budget Summary
 NW371 Moretele - Table A1 Summary Description 2012/13 2013/14 2014/15 Medium Term Revenue & Expenditure R thousands Pre-audit outcome Year Year +1 2017/18 Year +2 2018/19 Financial Performance Property
C51/07/2013 FINANCES: ADJUSTMENT BUDGET FOR THE 2012/2013 FINANCIAL YEAR: JULY /1/2 (B)/wm
/wm") Adjustment July 2013 C51/07/2013 FINANCES: ADJUSTMENT BUDGET FOR THE 2012/2013 FINANCIAL YEAR: JULY 2013 5/1/2 (B)/wm RESOLVED BY COUNCIL 1. THAT the unauthorised expenditure of R350 000 on P1100224 due
Adjustment July 2013 C51/07/2013 FINANCES: ADJUSTMENT BUDGET FOR THE 2012/2013 FINANCIAL YEAR: JULY 2013 5/1/2 (B)/wm RESOLVED BY COUNCIL 1. THAT the unauthorised expenditure of R350 000 on P1100224 due
MUNICIPAL FINANCE MANAGEMENT ACT (MFMA): PRELIMINARY MONTHLY FINANCIAL REPORT FOR THE PERIOD ENDED 31 MARCH 2018 (MONTHLY BUDGET STATEMENT)
: PRELIMINARY MONTHLY FINANCIAL REPORT FOR THE PERIOD ENDED 31 MARCH 2018 (MONTHLY BUDGET STATEMENT)") 16 APRIL 2018 THE CITY MANAGER THE EXECUTIVE MAYOR MUNICIPAL FINANCE MANAGEMENT ACT (MFMA): PRELIMINARY MONTHLY FINANCIAL REPORT FOR THE PERIOD ENDED 31 MARCH 2018 (MONTHLY BUDGET STATEMENT) 1. PURPOSE
16 APRIL 2018 THE CITY MANAGER THE EXECUTIVE MAYOR MUNICIPAL FINANCE MANAGEMENT ACT (MFMA): PRELIMINARY MONTHLY FINANCIAL REPORT FOR THE PERIOD ENDED 31 MARCH 2018 (MONTHLY BUDGET STATEMENT) 1. PURPOSE
MUNICIPAL FINANCE MANAGEMENT ACT (MFMA): MONTHLY FINANCIAL REPORT FOR THE PERIOD ENDED 30 APRIL 2016 (MONTHLY BUDGET STATEMENT)
: MONTHLY FINANCIAL REPORT FOR THE PERIOD ENDED 30 APRIL 2016 (MONTHLY BUDGET STATEMENT)") 11 MAY 2016 THE CITY MANAGER THE EXECUTIVE MAYOR MUNICIPAL FINANCE MANAGEMENT ACT (MFMA): MONTHLY FINANCIAL REPORT FOR THE PERIOD ENDED 30 APRIL 2016 (MONTHLY BUDGET STATEMENT) 1. PURPOSE To comply with
11 MAY 2016 THE CITY MANAGER THE EXECUTIVE MAYOR MUNICIPAL FINANCE MANAGEMENT ACT (MFMA): MONTHLY FINANCIAL REPORT FOR THE PERIOD ENDED 30 APRIL 2016 (MONTHLY BUDGET STATEMENT) 1. PURPOSE To comply with
MUNICIPAL FINANCE MANAGEMENT ACT (MFMA): BUDGET AND PERFORMANCE ASSESSMENT REPORT IN TERMS OF THE MFMA, SECTION
: BUDGET AND PERFORMANCE ASSESSMENT REPORT IN TERMS OF THE MFMA, SECTION") 16 JANUARY 2018 MUNICIPAL FINANCE MANAGEMENT ACT (MFMA): BUDGET AND PERFORMANCE ASSESSMENT REPORT IN TERMS OF THE MFMA, SECTION 72 (1) (a), FOR THE SIX (6) MONTHS ENDED 31 DECEMBER 2017 INDEX PAGE 1. Purpose
16 JANUARY 2018 MUNICIPAL FINANCE MANAGEMENT ACT (MFMA): BUDGET AND PERFORMANCE ASSESSMENT REPORT IN TERMS OF THE MFMA, SECTION 72 (1) (a), FOR THE SIX (6) MONTHS ENDED 31 DECEMBER 2017 INDEX PAGE 1. Purpose
THABA CHWEU LOCAL MUNICIPALITY
 Thaba Chweu Municipality 2017/18 Annual Budget and MTREF THABA CHWEU LOCAL MUNICIPALITY MEDUIM TERM REVENUE AND EXPENDITURE FRAMEWORK 2017/18 TO 2019/20 Copies of this document can be viewed: In the foyers
29 March 2012 MBOMBELA LOCAL MUNICIPALITY DRAFT 2012/ /2015 ANNUAL BUDGET AND MEDIUM- TERM REVENUE AND EXPENDITURE FRAMEWORK
 29 March 2012 MBOMBELA LOCAL MUNICIPALITY DRAFT 2012/2013 2014/2015 ANNUAL BUDGET AND MEDIUM- TERM REVENUE AND EXPENDITURE FRAMEWORK MBOMBELA LOCAL MUNICIPALITY 2012/13 TO 2014/15 DRAFT ANNUAL BUDGET AND
Bergrivier Municipality
 Bergrivier Municipality 3 rd ADJUSTMENT BUDGET 2015-2016 23 February 2016 Table of Contents PART 1 ADJUSTMENTS BUDGET * Mayor s report * Resolutions * Executive summary * Adjustments budget tables PART
NONGOMA MUNICIPALITY
 ANNUAL BUDGET OF NONGOMA MUNICIPALITY 2018/19 TO 2020/21 MEDIUM TERM REVENUE AND EXPENDITURE FORECASTS Draft budget and Medium Term Revenue Expenditure Framework for 2018/19 year Page 1 of 66 Table of
Toplayer Service Delivery Budget Implementation Plan for 2016/17
 Toplayer Service Delivery Budget Implementation Plan for 206/7 Provincial Strategic Outcome KPI Calculation Type Assist Directorate [R] [R] National KPA [R] IDP Objective [R] KPI Name [R] Unit of Measurement
QUARTERLY PERFORMANCE REPORT FOR QUARTER 3: 1 JANUARY MARCH 2016
 ANNEXURE C QUARTERLY PERFORMANCE REPORT FOR QUARTER 3: 1 JANUARY 2016 31 MARCH 2016 2/9/2 REPORT BY THE MANAGER STRATEGIC SERVICES 1 PURPOSE The purpose of this report is to present the quarterly performance
FINANCIAL REPORT ITEM. The purpose of this report is to inform the Council on the current financial state as at 31 October 2018.
 FINANCIAL REPORT ITEM INTRODUCTION / AIM The purpose of this report is to inform the Council on the current financial state as at 31 October 2018. LEGAL REQUIREMENTS In terms of Section 71 of the Municipal
Click for Instructions!
 mscoa Version 6.1 Click for Instructions! Contact details: Elsabé Rossouw National Treasury Tel: (012) 315-5534 Electronic submissions: lgdocuments@treasury.gov.za 2020 Preparation Instructions Municipality
THE BUDGET OF DR RUTH SEGOMOTSI MOMPATI DISTRICT MUNICIPALITY
 THE BUDGET OF DR RUTH SEGOMOTSI MOMPATI DISTRICT MUNICIPALITY 2017/18 TO 2019/20 MEDIUM TERM REVENUE AND EXPENDITURE FORECASTS SCHEDULE A ANNUAL BUDGET AND SUPPORTING DOCUMENTATION OF A MUNICIPALITY ii
CAPE AGULHAS MUNICIPALITY
 CAPE AGULHAS MUNICIPALITY MTREF 2018/2019 2020/2021 - Version 1 23 March 2018 CAPE AGULHAS MUNICIPALITY MEDIUM TERM REVENUE AND EXPENDITURE FRAMEWORK 2018/2019 TO 2020/2021 March 2018 1 ANNUAL BUDGET OF
LEKWA-TEEMANE LOCAL MUNICIPALITY MID-TERM BUDGET & PERFORMANCE ASSESSMENT REPORT. 1 P a g e
 LEKWA-TEEMANE LOCAL MUNICIPALITY MID-TERM BUDGET & PERFORMANCE ASSESSMENT REPORT 1 P a g e TABLE OF CONTENTS PART 1 1.1. MAYOR S REPORT 1.2. EXECUTIVE SUMMARY 1.3. RESOLUTIONS 1.4. IN-YEAR BUDGET STATEMENT
MONTHLY BUDGET SUMMARY
 REPORT IN TERMS OF SECTION 71 OF THE MUNICIPAL FINANCE MANAGEMENT ACT NO. 56 OF 2003: IMPLEMENTATION OF THE BUDGET AND FINANCIAL STATE OF AFFAIRS OF THE ELUNDINI MUNICIPALITY FOR THE PERIOD ENDED 31 AUGUST
Draft Medium-Term Budget 2019/ /22 CITY OF JOHANNESBURG DRAFT MEDIUM-TERM BUDGET 2019/20 TO 2021/22
 CITY OF JOHANNESBURG DRAFT MEDIUM-TERM BUDGET 2019/20 TO 2021/22 MARCH 2019 1 Table of Contents Page No PART1- ANNUAL BUDGET 1.1. EXECUTIVE SUMMARY 9 1.2. OPERATING BUDGET FRAMEWORK 11 1.3. CAPITAL EXPENDITURE
NONGOMA MUNICIPALITY
 ANNUAL BUDGET OF NONGOMA MUNICIPALITY 2018/19 TO 2020/21 MEDIUM TERM REVENUE AND EXPENDITURE FORECASTS Final budget and Medium Term Revenue Expenditure Framework for 2018/19 year Page 1 of 66 Table of
FUNDING & RESERVES POLICY
 FUNDING & RESERVES POLICY UNCHANGED 1 JULY 2016 STEVE TSHWETE LOCAL MUNICIPALITY MP 313 Approved May 2016 C36/05/2016 1. INTRODUCTION The funding and reserves policy is aimed to ensure that the municipality
4.1. To obtain approval for the Adjustment Operating Budget for the 2017/18 financial year.
 4.1 4 ADJUSTMENT OPERATING BUDGET FOR THE 2017/18 FINANCIAL YEAR 1 STRATEGIC THRUST Well Governed and Managed City. 2 OBJECTIVE To obtain approval for the Adjustment Operating for the 2017/18 financial
MEDIUM TERM REVENUE AND EXPENDITURE FRAMEWORK 2014/ /17
 MANGAUNG METROPOLITAN MUNICIPALITY MEDIUM TERM REVENUE AND EXPENDITURE FRAMEWORK 2014/15-2016/17 MANGAUNG METROPOLITAN MUNICIPALITY TABLE OF CONTENTS PART 1 - ANNUAL BUDGET 1. Executive Summary 4 2. Summary
Annual Performance Report
 T a b l e o f C o n t e n t s TABLE OF CONTENTS 2 CHAPTER 3 3 3.1 OVERVIEW OF PERFORMANCE WITHIN THE ORGANISATION 3 3.1.1 Legislative Requirements 3 3.1.2 Organisational Performance 3 3.1.3 The Performance
STEVE TSHWETE LOCAL MUNICIPALITY MP
 BUDGET POLICY AMENDED 1 JULY 2016 STEVE TSHWETE LOCAL MUNICIPALITY MP 313 Approved May 2016 C36/05/2016 TABLE OF CONTENTS 1. Definitions 2. Introduction 3. Objective 4. Budgeting principles 5. Budget preparation
SETSOTO LOCALL MUNICIPALITY
 ANNUAL BUDGET OF SETSOTO LOCALL MUNICIPALITY Page 1 TABLE OF CONTENTS 2013/14 TO 2015/16 MEDIUM TERM REVENUE AND EXPENDITURE FORECASTS PART 1: ANNUAL BUDGET 6 1.1 MAYOR S REPORT 6 (REFER TO THE ATTACHMENT)
Medium-Term Budget 2018/ /21 CITY OF JOHANNESBURG MEDIUM-TERM BUDGET 2018/19 TO 2020/21
 CITY OF JOHANNESBURG MEDIUM-TERM BUDGET 2018/19 TO 2020/21 1 Table of Contents Page No PART1- ANNUAL BUDGET 1.1. EXECUTIVE SUMMARY 9 1.2. OPERATING BUDGET FRAMEWORK 9 1.3. CAPITAL EXPENDITURE 16 1.4. ANNUAL
Draft budget and Medium Term Revenue & Expenditure Framework for 2017/18term
 2017/18term ANNUAL BUDGET OF NONGOMA MUNICIPALITY 2017/18 TO 2019/20 MEDIUM TERM REVENUE AND EXPENDITURE FORECASTS Final budget and Medium Term Revenue Expenditure Framework for 2016/17 year Page 1 of
CHAPTER 2: MUNICIPAL DEVELOPMENT PROFILE KPA: Municipal Transformation and Organizational Development
 CHAPTER 2: MUNICIPAL DEVELOPMENT PROFILE 2.3.1 KPA: Transformation Organizational 2.3.2.1 Macro Structure Manager Manager Support IDP Performance Management Director: Community & Technical Services Director:
Provincial Gazette Extraordinary Buitengewone Provinsiale Koerant
 THE PROVINCE OF GAUTENG G A U T E N G PROVINCIAL GOVERNMENT UNITY IN DIVERSITY DIE PROVINSIE GAUTENG Provincial Gazette Extraordinary Buitengewone Provinsiale Koerant Vol 20 PRETORIA, 12 FEBRUARY FEBRUARIE
UNPACKING INFRASTRUCTURE DEVELOPMENT SPENDING IN LOCAL GOVERNMENT
 UNPACKING INFRASTRUCTURE DEVELOPMENT SPENDING IN LOCAL GOVERNMENT MUNICIPAL INFRASTRUCTURE SUMMIT 25 MAY 2015 OUT LINE Municipal Infrastructure Matrix Access to Basic services backlogs Capital Budget Funding
LEKWA-TEEMANE LOCAL MUNICIPALITY NW 396
 LEKWA-TEEMANE LOCAL MUNICIPALITY NW 396 Mid-Year Budget Performance Assessment Report 2015/ TABLE OF CONTENTS 1. MUNICIPAL MANAGER S FOREWORD... 1 2. INTRODUCTION... 6 3. SECTION A: MID-YEAR BUDGET ASSESSMENT...
PLAN AND MANAGE THE BUDGET POLICY & PROCEDURE MANUAL
 PLAN AND MANAGE THE BUDGET POLICY & PROCEDURE MANUAL THABA CHWEU LOCAL MUNICIPALITY Approved 25 June 2012 Resolution no: A50/2012 TABLE OF CONTENTS 1 INTRODUCTION... 1 1.1 Vision and value statement...
CITY OF HAMILTON TAX OPERATING BUDGET VARIANCE REPORT AS AT APRIL ($ OOO's)
") CITY OF HAMILTON TAX OPERATING BUDGET VARIANCE REPORT AS AT APRIL Page 1 of 6 30, 2018 2018 2018 Projected Approved Actuals Actuals Budget Apr YTD to Dec. 31 PLANNING & ECONOMIC DEVELOPMENT General Manager
CITY OF HAMILTON TAX OPERATING BUDGET VARIANCE REPORT AS AT APRIL Page 1 of 6 30, 2018 2018 2018 Projected Approved Actuals Actuals Budget Apr YTD to Dec. 31 PLANNING & ECONOMIC DEVELOPMENT General Manager
MEDIUM TERM REVENUE AND EXPENDITURE FRAMEWORK 2015/ /18
 MANGAUNG METROPOLITAN MUNICIPALITY MEDIUM TERM REVENUE AND EXPENDITURE FRAMEWORK - 2017/18 MANGAUNG METROPOLITAN MUNICIPALITY TABLE OF CONTENTS PART 1 - ANNUAL BUDGET 1. Executive Summary 4 2. Summary
2. LEGAL FRAMEWORK This Performance Report is submitted in compliance with;
 . INTRODUCTION The purpose of this report is to present the Performance Report of the Municipality for Midyear/section 72 report ( July 26 to 3 December 26) 2. LEGAL FRAMEWORK This Performance Report is
Performance management provides mechanism to measure whether strategic targets set by an organisation and employees are met.
 . . OVERVIEW OF PERFORMANCE WITHIN THE ORGANISATION. Municipal Performance system is a tool used to measure the implementation of Organisational strategies. It is a planning tool used to monitor, measure
MANGAUNG METROPOLITAN MUNICIPALITY BUDGET POLICY
 MANGAUNG METROPOLITAN MUNICIPALITY BUDGET POLICY 2 INDEX 1. Statutory Framework... 3 2. Policy Objectives... 8 3. Votes, Categories of Expenditure and Line Items... 8 4. Capital Budget Mythology... 9 5.
JOE MOROLONG LOCAL MUNICIPALITY TOP LAYER (SDBIP) SERVICE DELIVERY AND BUDGET IMPLEMENTATION PLAN 2017/ 18 FINANCIAL YEAR
 SERVICE DELIVERY AND BUDGET IMPLEMENTATION PLAN 2017/ 18 FINANCIAL YEAR") JOE MOROLONG LOCAL MUNICIPALITY TOP LAYER (SDBIP) SERVICE DELIVERY AND BUDGET IMPLEMENTATION PLAN / 18 FINANCIAL YEAR 1 Table of contents No Chapter Heading Page No 1. Foreword Mayor 2 2. 1 Chapter 1 Introduction
JOE MOROLONG LOCAL MUNICIPALITY TOP LAYER (SDBIP) SERVICE DELIVERY AND BUDGET IMPLEMENTATION PLAN / 18 FINANCIAL YEAR 1 Table of contents No Chapter Heading Page No 1. Foreword Mayor 2 2. 1 Chapter 1 Introduction
Part A of examination paper
 Prof Johan Burger 2017 Managing Institutional Capacity 1 Diploma Programme in Public Accountability Module code 13 206 171; twenty credits Preparation for November examination June examination MEMORANDUM
1.1 Executive Mayor s Report Council Resolutions Executive Summary Operating Expenditure Framework Capital Expenditure 22
 TABLE OF CONTENTS 2 PART 1 ANNUAL BUDGET Page 1.1 Executive Mayor s Report 5 1.2 Council Resolutions 7 1.3 Executive Summary 8 1.4 Operating Revenue Framework 10 1.5 Operating 18 1.6 Capital Expenditure
MEDIUM TERM REVENUE AND EXPENDITURE FRAMEWORK 2017/ /20
 MANGAUNG METROPOLITAN MUNICIPALITY MEDIUM TERM REVENUE AND EXPENDITURE FRAMEWORK 2017/18-2019/20 MANGAUNG METROPOLITAN MUNICIPALITY TABLE OF CONTENTS PART 1 - ANNUAL BUDGET 1. Executive Summary 4 2. Summary
 UACN PROPERTY DEVELOPMENT COMPANY PLC FINANCIAL STATEMENT FOR THE YEAR ENDED 31 DECEMBER 2017 Financial highlights 2017 2016 % 2017 2016 % N'000 N'000 Change N'000 N'000 Change Continuing operations Revenue
PROCURRI CORPORATION LIMITED (Registration No: W) UNAUDITED FINANCIAL STATEMENTS ANNOUNCEMENT FOR THE PERIOD ENDED 31 March 2018 ( 1Q2018 )
 UNAUDITED FINANCIAL STATEMENTS ANNOUNCEMENT FOR THE PERIOD ENDED 31 March 2018 ( 1Q2018 )") PROCURRI CORPORATION LIMITED (Registration No: 201306969W) UNAUDITED FINANCIAL STATEMENTS ANNOUNCEMENT FOR THE PERIOD ENDED 31 March 2018 ( 1Q2018 ) PART I - INFORMATION REQUIRED FOR QUARTERLY (Q1, Q2
PROCURRI CORPORATION LIMITED (Registration No: 201306969W) UNAUDITED FINANCIAL STATEMENTS ANNOUNCEMENT FOR THE PERIOD ENDED 31 March 2018 ( 1Q2018 ) PART I - INFORMATION REQUIRED FOR QUARTERLY (Q1, Q2
LEKWA-TEEMANE LOCAL MUNICIPALITY TERMS OF REFERENCE OVERSIGHT COMMITTEE
 LEKWA-TEEMANE LOCAL MUNICIPALITY TERMS OF REFERENCE OVERSIGHT COMMITTEE To be read in conjunction with National Treasury MFMA Circular 32 The Oversight Report CONTENTS 1. INTRODUCTION 3 2. BACKGROUND 3
Statement of Accounts Summary 2012/13
 Introduction Statement of Accounts Summary 2012/13 Doncaster Council is required to produce an annual Statement of Accounts to provide assurance to the public that the Council has used public money legally
PIXLEY KA SEME DISTRICT MUNICIPALITY
 PIXLEY KA SEME DISTRICT MUNICIPALITY FINAL SERVICE DELIVERY BUDGET IMPLEMENTATION PLAN ( SDBIP ) 2014/2015 1 Table of Contents Page no. 1. Introduction 3 2. Legislative Framework in terms of MFMA 3 3.
WALTER SISULU LOCAL MUNICIPALITY
 ANNUAL FINANCIAL STATEMENTS 30 JUNE 2017 INDEX Content General Information Approval of the Financial Statements Statement of Financial Position Statement of Financial Performance Statement of Changes In
Q Earnings Call. 13 February 2017
 Q4 2016 Earnings Call 13 February 2017 1 Forward-Looking Statements Forward-Looking Statements: Certain of the statements made in this Release are forward-looking statements within the meaning and protections
Changes made in mscoa Chart version 5.5 and incorporated into mscoa Chart version 6.0 :
 Changes made in mscoa Chart version 5.5 incorporated into mscoa Chart version 6.0 : 1. General 1.1 The wording of some definitions changed to broaden, clarify or include specific examples to assist in
EARNINGS REPORT. 3 rd QUARTER 2014 SACI FALABELLA
 EARNINGS REPORT 3 rd QUARTER 2014 SACI FALABELLA Index I. Executive Summary... 3 II. Consolidated Income Statement as of September 30 th, 2014... 4 III. Main Events during the Period... 9 IV. Retail Indicators...
Prospective Financial Statements
 Consultation 2017/18 Support Papers Prospective Financial Statements For 2017/2018 PROSPECTIVE STATEMENT OF FINANCIAL PERFORMANCE Operating Revenue Rates 10,833,328 11,309,300 11,039,256 Rates penalties
Sol Plaatje Local Municipality (NC091)
") Sol Plaatje Local ity (NC091) Annual Performance Report for the period 1 July 2016 to 30 June Table of Contents 1. Introduction... 2 2. Legislative Background... 2 3. Statistical Background of the ity...
Sol Plaatje Local ity (NC091) Annual Performance Report for the period 1 July 2016 to 30 June Table of Contents 1. Introduction... 2 2. Legislative Background... 2 3. Statistical Background of the ity...
The reports and statements set out below comprise the consolidated financial statements presented to the provincial legislature:
 Consolidated Financial Statements for the year ended 30 June 2016 Index The reports and statements set out below comprise the consolidated financial statements presented to the provincial legislature:
KEY DATES FOR THE MANGAUNG METROPOLITAN MUNCIPALITY IDP REVIEW/BUDGET 2017/18
 KEY DATES FOR THE MANGAUNG METROPOLITAN MUNCIPALITY IDP REVIEW/BUDGET 2017/18 Mangaung Metropolitan Municipality wishes to inform all its stakeholders and communities of the key opportunity to make inputs
RELATIONSHIP BETWEEN THE BUDGET AND THE IDP 28 FEBRUARY 2017
 RELATIONSHIP BETWEEN THE BUDGET AND THE IDP 28 FEBRUARY 2017 1 Contents Introduction Legislative Requirements Inc. MSCOA Why MSCOA Local Government Accountability Cycle Budget Process and linkage to IDP
FMIA Agreement of. between
 FMIA Agreement of between And ("") ("") LEI: LEI: Email: Email: 1. Scope 1.1 and (the "Parties" and each a "Party") enter into transactions (the "Transactions") f or which they may become subject to risk
MEDIUM TERM REVENUE AND EXPENDITURE FRAMEWORK. (Including NALEDI) 2016/ /19
 2016/ /19") MANGAUNG METROPOLITAN MUNICIPALITY MEDIUM TERM REVENUE AND EXPENDITURE FRAMEWORK (Including NALEDI) 2016/17-2018/19 MANGAUNG METROPOLITAN MUNICIPALITY TABLE OF CONTENTS PART 1 - ANNUAL BUDGET 1. Executive
MANGAUNG METROPOLITAN MUNICIPALITY MEDIUM TERM REVENUE AND EXPENDITURE FRAMEWORK (Including NALEDI) 2016/17-2018/19 MANGAUNG METROPOLITAN MUNICIPALITY TABLE OF CONTENTS PART 1 - ANNUAL BUDGET 1. Executive
IFRS First-time adoption at 1 January 2004 Main impacts on the financial statements. 9 February 2005
 IFRS First-time adoption at 1 January 2004 Main impacts on the financial statements 9 February 2005 Warning This document presents a summary of the impacts on VINCI's financial statements of the IFRSs
CONSOLIDATED STATEMENT OF COMPREHENSIVE INCOME CONSOLIDATED STATEMENT OF FINANCIAL POSITION CONSOLIDATED STATEMENT OF CHANGES IN EQUITY
 UNAUDITED INTERIM FINANCIAL STATEMENTS FOR THE PERIOD ENDED 30TH SEPTEMBER, 2016 OUTLINE PAGE CONSOLIDATED STATEMENT OF COMPREHENSIVE INCOME 1 CONSOLIDATED STATEMENT OF FINANCIAL POSITION 2 CONSOLIDATED
CORPORATION OF THE TOWN OF ST. MARYS CONSOLIDATED FINANCIAL STATEMENTS DECEMBER 31, 2011
 CORPORATION OF THE TOWN OF ST. MARYS CONSOLIDATED FINANCIAL STATEMENTS DECEMBER 31, 2011 INDEPENDENT AUDITORS' REPORT To the Members of Council, Inhabitants and Ratepayers of the Corporation of the Town
RUSTENBURG LOCAL MUNICIPALITY ANNUAL FINANCIAL STATEMENTS for the year ended 30 June 2012
 USTENBUG LOCAL MUNICIPALITY ANNUAL FINANCIAL STATEMENTS for the year ended 30 June 2012 USTENBUG LOCAL MUNICIPALITY ANNUAL FINANCIAL STATEMENTS for the year ended 30 June 2012 EPOT OF THE CHIEF FINANCIAL
Trust Board Meeting: Wednesday 8 July 2015 TB Title Financial Performance to 31 May 2015
 Trust Board Meeting: Wednesday 8 July 2015 Title Financial Performance to 31 May 2015 Status History A paper for report. Regular report Board Lead Mr Mark Mansfield, Director of Finance and Procurement
Moretele Local Municipality. IDP/Budget Process Plan 2018/ ( IDP: Process Plan)
") Moretele Local Municipality IDP/Budget Process Plan /2019 1 Revision Control Final - August 2017 Strategic Services IDP/PMS Unit Enquiries: 012 716 1321 / 1324 (tel) thabo.makwela@moretele.org.za nyakale.lale@moretele.org.za
Moretele Local Municipality IDP/Budget Process Plan /2019 1 Revision Control Final - August 2017 Strategic Services IDP/PMS Unit Enquiries: 012 716 1321 / 1324 (tel) thabo.makwela@moretele.org.za nyakale.lale@moretele.org.za
PART A: Working Capital Management (US marks)
") Diploma in Public Accountability Managing Institutional Capacity I Examination Time: 3 hours Marks: 100 Surname & names: Student number: Date: 12 June 2017 OPEN BOOK: Answer in spaces provided. You may
Diploma in Public Accountability Managing Institutional Capacity I Examination Time: 3 hours Marks: 100 Surname & names: Student number: Date: 12 June 2017 OPEN BOOK: Answer in spaces provided. You may
Financial Statements Whole of Council Financial Statements
 Whole of Council Financial Statements Annual Plan Disclosure Statement for the Year Ending 30 June 2017 The purpose of this statement is to disclose the council s planned financial performance in relation
BUDGET DRAFT 1 November 19, 2019
 BUDGET 2019 DRAFT 1 November 19, 2019 Executive summary For the consideration of our Mayor and Council, City of Lloydminster Administration is pleased to provide a first draft of the 2019 Municipal Budget.
International Triathlon Union Lausanne. Report of the statutory auditor to the General Meeting on the combined financial statements 2014
 Lausanne Report of the statutory auditor to the General Meeting on the combined financial statements 2014 Report of the statutory auditor to the General Meeting of Lausanne Report of the statutory auditor
uthungulu District Municipality 2014/2015
 149 uthungulu District 2014/2015 9. Intangible Assets 2015 2014 Accumulated amortisation and accumulated impairment Accumulated amortisation and accumulated impairment Cost Carrying value Cost Carrying
ACCOUNTING POLICIES OF THE ECONOMIC ENTITY TO ACCOMPANY ITS FINANCIAL STATEMENTS FOR THE YEAR ENDED 30 JUNE 2014
 8 1. BASIS OF PREPARATION and STATEMENT OF COMPLIANCE These Consolidated Financial Statements have been prepared in accordance with Generally Recognised Accounting Practice (GRAP) including any interpretations,
6/10/2017 NOTE ORIENTATION. Unit Standard Apply the principles of budgeting within a municipality
 NOTE DIPLOMA IN PUBLIC ACCOUNTABILITY MODULE 13 208 191 / Compliance and control 1 (4 UNIT STANDARDS) US 116345 Dr Len Mortimer Participants are advised to have access to: The respective learner guide,
Mayor WT Cloete (resigned 31 August 2012) SW Lubbe (appointed 1 September 2012)
 SW Lubbe (appointed 1 September 2012)") NAMA KHOI LOCAL MUNICIPALITY ANNUAL FINANCIAL STATEMENTS FOR THE YEAR ENDED 30 JUNE 2013 GENERAL INFORMATION NATURE OF BUSINESS AND PRINCIPAL ACTIVITIES Nama Khoi Local Municipality is a local municipality
NAMA KHOI LOCAL MUNICIPALITY ANNUAL FINANCIAL STATEMENTS FOR THE YEAR ENDED 30 JUNE 2013 GENERAL INFORMATION NATURE OF BUSINESS AND PRINCIPAL ACTIVITIES Nama Khoi Local Municipality is a local municipality
Steve Tshwete Local Municipality MP313. July 2008 June 2009 High Level Service Delivery & Budget Implementation Plan
 Steve Tshwete Local Municipality MP313 July 2008 June 2009 High Level Service Delivery Budget Implementation Plan STEVE TSHWETE LOCAL MUNICIPALITY HIGH LEVEL SERVICE DELIVERY BUDGET IMPLEMENTATION PLAN
Pre-Election Report. July 2016 Clare Hadley, Chief Executive
 Pre-Election Report July 2016 Clare Hadley, Chief Executive This document constitutes the pre-election report for the purposes of Section 99A of the Local Government Act 2002 Contents Contents... 2 Introduction...
AUDIT COMMITTEE MEETING AGENDA
 AUDIT COMMITTEE MEETING AGENDA TUESDAY, JUNE 23, 2015 6 P.M. COUNCIL CHAMBERS AURORA TOWN HALL PUBLIC RELEASE June 19, 2015 TOWN OF AURORA AUDIT COMMITTEE MEETING AGENDA 6 p.m. Council Chambers 1. DECLARATION
Fleet Services CAPITAL BUDGET AND PLAN OVERVIEW Capital Budget and Plan Highlights CAPITAL ANALYST NOTES.
 CAPITAL ANALYST NOTES Contents Fleet Services 2023 CAPITAL BUDGET AND PLAN OVERVIEW 2023 Capital Budget and Highlights Fleet Services manages a City fleet of over 5,000 vehicles and pieces of equipment,
ASSOCIATED BENEFITS OF mscoa IN THE ASSET LIFE CYCLE
 ASSOCIATED BENEFITS OF mscoa IN THE ASSET LIFE CYCLE Asset life cycle TABLE OF CONTENTS Current challenges in the asset life cycle Associated benefits of mscoa segments in the asset life cycle Other benefits
COMMON LANGUAGE GUIDE TO MUNICIPAL FINANCIAL STATEMENTS MINISTRY OF MUNICIPAL AFFAIRS
 COMMON LANGUAGE GUIDE TO MUNICIPAL FINANCIAL STATEMENTS MINISTRY OF MUNICIPAL AFFAIRS TABLE OF CONTENTS Introduction... 3 Selected Legislative Requirements and Reporting Standards... 3 The Common Language
Operational Grants and Subsidies Graph /17 YTD Actual: What makes up this revenue
 Statement of Comprehensive Revenue and Expenses For the 11 months ended 31 May 2017 YTD YTD Actual YTD AP Variance May16 Note May17 2017 2017 $000s $000s $000s $000s REVENUE FROM NONEXCHANGE TRANSACTIONS
Report to: Public Trust Board Agenda item: 2.2 Date of Meeting: 12 May 2010
 Report to: Public Trust Board Agenda item: 2.2 Date of Meeting: 12 May 2010 Title of Report: Status: Board Sponsor: Author: Appendices 1 2 3 4 5 6 7 Finance report Discussion Catherine Phillips, Director
Unit Standard : Apply the principles of budgeting within a municipality. Karel van der Molen
 Unit Standard 116345: Apply the principles of budgeting within a municipality Karel van der Molen Group The full programme 1. Strategic Management; Budgeting Implementation & Performance Management 2.
A GUI DE TO T HE NATI ONAL PLANNING FRAM EWORK
 A GUI DE TO T HE NATI ONAL PLANNING FRAM EWORK FOREWORD BY DIRECTOR-GENERAL IN THE PRESIDENCY, CABINET SECRETARY AND CHAIRPERSON OF T HE FORUM OF SA DIRECTORS- GENERAL Tow ards the end of the first term
0% 2% 1% 96% Information Services Civic Three waters Solid Waste 07 Metered Water Rates
 Statement of Comprehensive Revenue and Expenses For the 10 months ended 30 April 2017 YTD YTD Actual YTD AP Variance Apr16 Note Apr17 2017 2017 $000s $000s $000s $000s REVENUE FROM NONEXCHANGE TRANSACTIONS
NATIONAL TREASURY MFMA IMPLEMENTATION PLAN - TEMPLATE (Medium Capacity Municipality Only)
") NATIONAL TREASURY MFMA IMPLEMENTATION PLAN - TEMPLATE (Medium Capacity Municipality Only) Name of municipality: SIYANDA DISTRICT (eg: City of Johannesburg) Demarcation code:_dc8 (eg: GT001) Plan Action
NATIONAL TREASURY MFMA IMPLEMENTATION PLAN - TEMPLATE (Medium Capacity Municipality Only) Name of municipality: SIYANDA DISTRICT (eg: City of Johannesburg) Demarcation code:_dc8 (eg: GT001) Plan Action
Local Government Model Financial Report
 Local Government Model Financial Report 2016-17 2016-17 2017-18 Local Government Victoria, FG 4-2018 Instruction: Type in information indicated into the cell provided and this will populate the relevant