Annual Performance Report
|
|
|
- Jocelyn Small
- 5 years ago
- Views:
Transcription

1
2 T a b l e o f C o n t e n t s TABLE OF CONTENTS 2 CHAPTER OVERVIEW OF PERFORMANCE WITHIN THE ORGANISATION Legislative Requirements Organisational Performance The Performance System Followed for 2016/ Monitoring of the Service Delivery Budget Implementation Plan INTRODUCTION TO STRATEGIC AND MUNICIPAL PERFORMANCE FOR 2016/ Strategic Service Delivery Budget Implementation Plan (Top Layer) Service Providers Performance Municipal Functions COMPONENT A: BASIC SERVICES Water Services Waste Water (Sanitation) Provision Electricity Waste Management (Refuse collections, waste disposal, street cleaning and recycling) Housing Free Basic Services and Indigent Support COMPONENT B: ROAD TRANSPORT Roads Waste Water (Stormwater Drainage) COMPONENT C: PLANNING AND LOCAL ECONOMIC DEVELOPMENT Town Planning and Building Control Local Economic Development (LED) COMPONENT D: COMMUNITY AND SOCIAL SERVICES Libraries Cemeteries COMPONENT E: ENVIRONMENTAL PROTECTION Environmental Protection COMPONENT F: SECURITY AND SAFETY Law Enforcement Traffic Services COMPONENT G: SPORT AND RECREATION Sport and Recreation COMPONENT H: CORPORATE POLICY OFFICES AND OTHER SERVICES Executive and Council Financial Services Human Resource Services Procurement Services COMPONENT I: SERVICE DELIVERY PRIORITIES FOR 2017/ To create a capacitated, people-centered institution To create a safe and healthy living environment To enhance access to basic services and address maintenance backlogs To enhance economic development with focus on both first and second economies To improve financial viability and management To promote good governance and community participation 83 CHAPTER NATIONAL KEY PERFORMANCE INDICATORS MUNICIPAL TRANSFORMATION AND ORGANISATIONAL DEVELOPMENT INTRODUCTION TO THE MUNICIPAL WORKFORCE Employment Equity Vacancy Rate MANAGING THE MUNICIPAL WORKFORCE Injuries Sick Leave CAPACITATING THE MUNICIPAL WORKFORCE Skills Matrix Skills Development - Budget Allocation Municipal Minimum Competency Course Status MANAGING THE MUNICIPAL WORKFORCE EXPENDITURE Personnel Expenditure 91 LIST OF ABBREVIATIONS 93 LIST OF TABLES 95 LIST OF FIGURES 96 LIST OF GRAPHS 96 2
3 CHAPTER O V E R V I E W O F P E R F O R M A N C E W I T H I N T H E O R G A N I S A T I O N Performance management is a process which measures the implementation of the organisation s strategy. It is also a management tool to plan, monitor, measure and review performance indicators to ensure efficiency, effectiveness and the impact of service delivery by the Municipality. At local government level performance management is institutionalized through the legislative requirements on the performance management process for local government. Performance management provides the mechanism to measure whether targets to meet its strategic goals, set by the organisation and its employees, are met Legislative Requirements The Constitution of S.A (1996), Section 152, dealing with the objectives of local government paves the way for performance management with the requirements for an accountable government. The democratic values and principles in terms of Section 195 (1) are also linked with the concept of performance management, with reference to the principles of inter alia: the promotion of efficient, economic and effective use of resources, accountable public administration to be transparent by providing information to be responsive to the needs of the community to facilitate a culture of public service and accountability amongst staff The Municipal Systems Act (MSA), (Act 32 of 2000) requires municipalities to establish a performance management system. Further, the MSA and the Municipal Finance Management Act (MFMA) requires the Integrated Development Plan (IDP) to be aligned to the municipal budget and to be monitored for the performance of the budget against the IDP via the Service Delivery and the Budget Implementation Plan (SDBIP). In terms of Section 46(1)(a) of the MSA a municipality must prepare for each financial year a performance report reflecting the municipality s and any service provider s performance during the financial year, including comparison with targets of and with performance in the previous financial year. The report must furthermore, indicate the development and service delivery priorities and the performance targets set by the municipality for the following financial year and measures that were or are to be taken to improve performance Organisational Performance Strategic performance indicates how well the Municipality is meeting its objectives and which policies and processes are working. All government institutions must report on strategic performance to ensure that service delivery is efficient, 3
4 effective and economical. Municipalities must develop strategic plans and allocate resources for the implementation. The implementation must be monitored on an ongoing basis and the results must be reported on during the financial year to various role-players to enable them to timeously implement corrective measures where required. This report highlights the strategic performance in terms of the Municipality s Top Layer SDBIP, performance on the National Key Performance Indicators prescribed in terms of Section 43 of the MSA and an overall summary of performance on municipal services The Performance System Followed for 2016/17 a) Adoption of a Performance Management Framework The Municipality adopted a performance management framework that was approved by Council in 2007 and the Municipality engaged with Ignite Advisory Services for a web-based Performance Management System (PMS). The Ignite web-based PMS deals with both organisational and individual performances. Performance management has been properly implemented for the first time in Swellendam Municipality in the 2014/15 financial year and has produced the results of the first clean audit opinion. All senior managers have signed performance agreements and the PMS has been successfully implemented to the first manager s level, reporting directly to the senior managers. The Municipality has also reported on performance quality for the mid-year in January The job description process was finalised and implemented on 1 July 2016, which equipped the Municipality to cascade the individual PMS down to key personnel below the level of the first manager. b) The IDP and the Budget The reviewed IDP for 2016/17 and the budget for 2016/17 was approved by Council on 31 May The IDP process and the performance management process are integrated. The IDP fulfils the planning stage of performance management. Performance management in turn, fulfils the implementation management, monitoring and evaluation of the IDP. The Municipality has since reviewed the Performance Management Framework and adopted a new Performance Management Framework in June In compliance with the framework, the Mayor approved the Top Layer SDBIP on 2 June The Top Layer SDBIP indicators are aligned with the budget, which was prepared in terms of the reviewed IDP. The indicators in the Top Layer SDBIP include indicators prescribed by legislation, indicators that will help to achieve the objectives adopted in the IDP and indicators that measure service delivery related responsibilities. The actual performance achieved in terms of the Key Performance Indicators (KPIs) was reported on quarterly. The indicators and targets were adjusted after the finalisation of the previous year s budget and mid-year budget assessment. The Top Layer 4
5 SDBIP was revised with the Adjustments Budget in terms of Section 26 (2)(c) of the Municipal Budget and Reporting Regulations and an amended Top Layer SDBIP was approved by the Council. The performance agreements of the senior managers were compiled and revised in terms of the SDBIP indicators as well as the portfolio of evidence that supports the actual targets reported. c) Actual Performance The Municipality utilises an electronic web-based system on which KPI owners update actual performance on a monthly basis. KPI owners report on the results of the KPI by documenting the following information on the performance system: The actual result in terms of the target set All performance comments Actions to improve the performance in alignment with the designated target, if the target was not achieved It is the responsibility of every KPI owner to maintain a portfolio of evidence to support actual performance results updated Monitoring of the Service Delivery Budget Implementation Plan Municipal performance was measured in the following way: Quarterly reports were submitted to Council concerning the actual performance in terms of the Top Layer SDBIP The mid-year assessment was completed along with the submission of the mid-year report to the Mayor in terms of Sections 72(1) (a) and 52(d) of the MFMA in order to assess the performance of the Municipality during the first half of the financial year a) Organisational Performance The organisational performance is monitored and evaluated via the SDBIP and the performance process can be summarised as follows: The Mayor approved the Top Layer SDBIP on 2 June 2016 and the information was loaded on the electronic web based system. The web-based system routinely sent automated s to the users of the system as a reminder to all staff responsible for updating their actual performance against KPIs targets by the 10th of every month for the previous month s performance The performance agreement of the senior managers are aligned with the approved Top Layer SDBIP. b) Municipal Manager and Managers Directly Accountable to the Municipal Manager The MSA prescribes that the municipality must enter into performance based agreements with the all Section 57-employees and that performance agreements must be reviewed annually. This process and the format are further regulated by 5
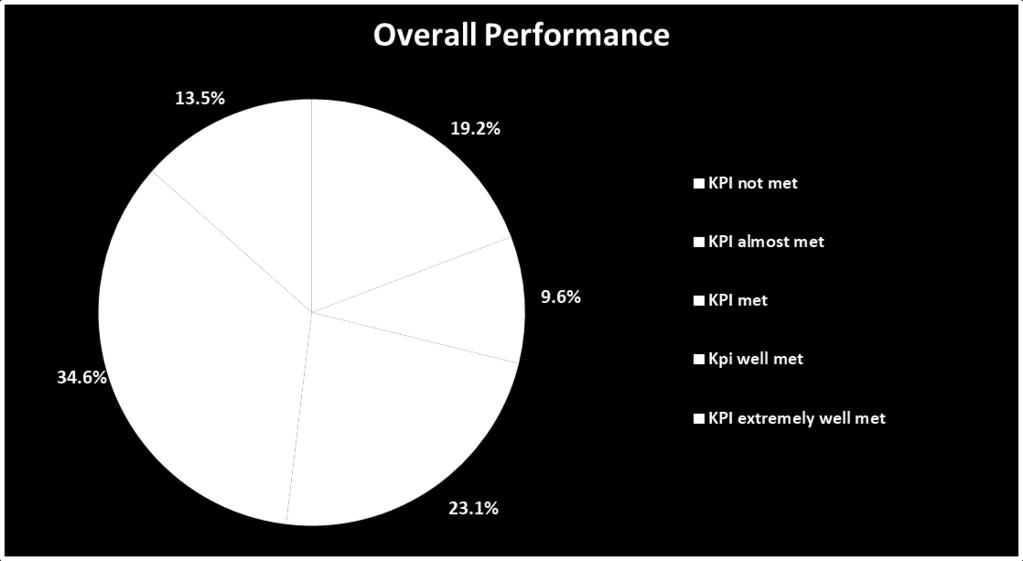
6 Regulation 805 (August 2006). The performance agreements for the Municipal Manager and applicable directors for the 2016/17 financial year was signed on 13 June The formal appraisal of the actual performance takes place twice per annum as regulated. The final evaluation of the 2015/16 financial year (1 January 2016 to 30 June 2016) took place on 2 November 2016 and the mid-year performance of 2016/17 (1 July 2016 to 31 December 2016) took place on 8 February The appraisals were done by an evaluation panel as indicated in the signed performance agreements and in terms of Regulation 805 and consisted of the following people: Mayor Portfolio Councillor Municipal Manager Chairperson of the Audit Committee External Municipal Manager 3. 2 I N T R O D U C T I O N T O S T R A T E G I C A N D M U N I C I P A L P E R F O R M A N C E F O R / 1 7 This section provides an overview on the achievement of the Municipality in terms of the strategic intent and deliverables achieved as stated in the IDP Strategic Service Delivery Budget Implementation Plan (Top Layer) The Top Layer SDBIP assists with documenting and monitoring of the Municipality s strategic plan and shows the strategic alignment between the IDP, Budget and Performance plans. In the paragraphs below the performance achieved is illustrated against the Top Layer SDBIP KPI s applicable to 2016/17 in terms of the IDP strategic objectives. The following table explains the method by which the overall assessment of the actual performance against the targets set for the KPI s of the SDBIP are measured: Category Colour Explanation KPI Not Yet Measured KPI s with no targets or actuals in the selected period KPI Not Met 0% > = Actual/Target< 75% KPI Almost Met 75% > = Actual/Target < 100% KPI Met Actual/Target = 100% KPI Well Met 100% > Actual/Target < 150% KPI Extremely Well Met Actual/Target > = 150% F i g u r e 1. : S D B I P M e a s u r e m e n t C r i t e r i a 6

7 7
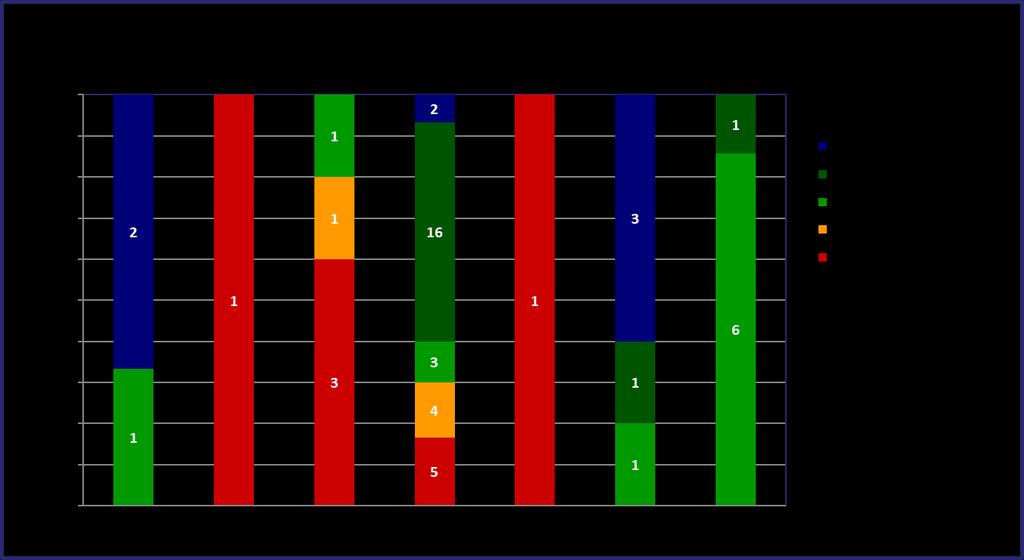
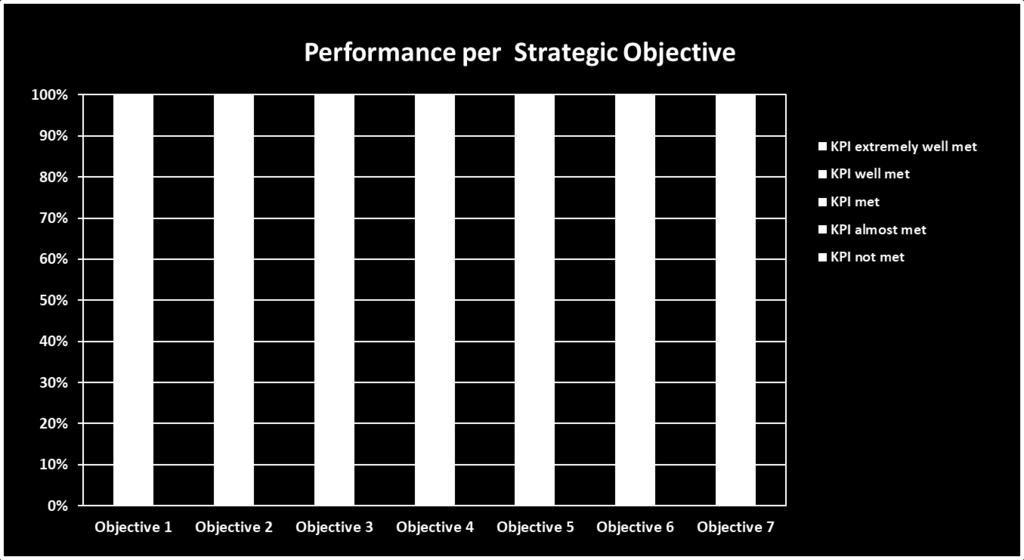
8 Objective 1 Objective 2 Objective 3 Objective 4 Objective 5 Objective 6 Objective 7 Measurement Category To create a capacitated, peoplecentered institution To create a safe and healthy living environment To develop integrated and sustainable settlements with the view to correct spatial imbalances To enhance access to basic services and address maintenance backlogs To enhance economic development with focus on both first and second economies To improve financial viability and management To promote good governance and community participation Total KPI Not Met KPI Almost Met KPI Met KPI Well Met KPI Extremely Well Met Total Graph 1.: Overall Performance per Strategic Objective a) To Create a Capacitated, People-Centered Institution Ref KPI Unit of Measurement Ward Previous Year Performance Overall performance for 2016/17 Target Q1 Q2 Q3 Q4 Annual Actual TL11 The number of people from employment equity target groups employed in the three highest levels of management in compliance with the equity plan Number of people employed in the three highest levels of management in compliance with the equity plan by 30 June 2017 All G TL12 The percentage of the municipality's personnel budget actually spent on implementing its workplace skills plan by 30 June 2017 [(Actual amount spent on training/total personnel budget)x100] (Actual amount spent on training/total personnel budget)x100 All 0.30% 0% 0% 0% 0.10% 0.10% 16% B TL23 Limit quarterly vacancy rate to less than 30% of funded posts [(Number of funded posts vacant / number of funded posts) x100] (Number of funded posts vacant / Number of funded posts) x100 All 10.77% 30% 30% 30% 30% 30% 9.23% B To Create a Capacitated, People-Centered Institution 8
9 b) To Create a Safe and Healthy Living Environment Ref KPI Unit of Measurement Ward Previous Year Performance Overall performance for 2016/17 Target Q1 Q2 Q3 Q4 Annual Actual TL46 Review the Disaster Management Plan and submit to Council by 31 March 2017 Disaster Management Plan reviewed and submitted to Council by 31 March 2017 All R Corrective actions The Disaster Management Plan will be reviewed during the 2017/18 financial year To Create a Safe and Healthy Living Environment c) To Develop Integrated and Sustainable Settlements with the View to Correct Spatial Imbalances Ref KPI Unit of Measurement Ward Previous Year Performance Overall performance for 2016/17 Target Q1 Q2 Q3 Q4 Annual Actual TL45 Upgrade the Suurbraak library hall by 30 June 2017 Suurbraak library hall upgraded by 30 June New performance indicator for 2016/17. No audited comparatives available G TL48 Construct 35 top structures in Suurbraak by 30 June 2017 Number of top structure constructed in Suurbraak by 30 June New performance indicator for 2016/17. No audited comparatives available R Corrective actions Delays were experience with the Department of Human Settlements. Meetings will be conducted with the department to unblock the projects TL49 Spend 95% of the funding allocated ito the Division of Revenue Act for the planning of Swellendam and surrounds housing plan by 30 June 2017 {(Actual expenditure divided by the total approved budget)x100} % of allocated funding spent for the planning of Swellendam and surrounds housing plan by 30 June 2017 {(Actual expenditure divided by the total approved budget)x100} 4 New performance indicator for 2016/17. No audited comparatives available 0% 0% 0% 95% 95% 23% R Corrective actions Project was successfully completed however the related housing matters will be addressed and completed within the 2017/18 financial year TL54 Upgrading of the Railton Sport Stadium phase 2 by 30 June 2017 Phase 2 upgrades done at the Railton sports stadium y 30 June 2017 All New KPI R Corrective actions Project will be completed in the 2017/18 financial year TL73 Spend 90% of the % spent on allocated 4 New KPI 0% 0% 0% 90% 90% 86% O 9
10 Ref KPI Unit of Measurement Ward allocated budget for the upgrading of the Caravan park by 30 June 2017 budget for the Caravan Park by 30 June 2017 Previous Year Performance Overall performance for 2016/17 Target Q1 Q2 Q3 Q4 Annual Actual Corrective actions The upgrading of the Caravan Park will be completed in the 2017/18 financial year To Develop Integrated and Sustainable Settlements with the View to Correct Spatial Imbalances d) To Enhance Access to Basic Services and Address Maintenance Backlogs Ref KPI Unit of Measurement Ward Previous Year Performance Overall performance for 2016/17 Target Q1 Q2 Q3 Q4 Annual Actual TL1 Number of formal residential properties that receive piped water that is connected to the municipal water infrastructure network as at 30 June 2017 Number of residential properties which are billed for water or have pre paid meters as at 30 June 2017 All 6, , ,087 6,087 6,196 G2 TL2 Number of formal residential properties connected to the municipal electrical infrastructure network (credit and prepaid electrical metering)(excluding Eskom areas) as at 30 June 2017 Number of residential properties which are billed for electricity or have pre paid meters (Excluding Eskom areas) as at 30 June 2017 All 6, , ,128 6,128 6,087 O Corrective actions The target should be amended to be more realistic TL3 Number of formal residential properties connected to the municipal waste water sanitation/sewerage network for sewerage service, irrespective of the number of water closets (toilets) as at 30 June 2017 Number of residential properties which are billed for sewerage as at 30 June 2017 All 6, , ,087 6,087 6,429 G2 TL4 Number of formal residential properties for which refuse is removed once per week as at 30 June 2017 Number of residential properties which are billed for refuse removal as at 30 June 2017 All 6, , ,123 6,123 6,139 G2 TL5 Provide 6kl free basic water to indigent households in terms of the approved indigent policy Number of indigent households receiving free basic water All 1, , ,880 1,880 1,930 G2 10
11 Ref KPI Unit of Measurement Ward Previous Year Performance Overall performance for 2016/17 Target Q1 Q2 Q3 Q4 Annual Actual TL6 Provide 50kwh free basic electricity to indigent households in terms of the approved indigent policy Number of indigent households receiving free basic electricity All 1, , ,755 1,755 1,786 G2 TL7 Provide free basic sanitation to indigent households in terms of the approved indigent policy Number of indigent households receiving free basic sanitation All 1, , ,880 1,880 1,930 G2 TL8 Provide free basic refuse removal to indigent households in terms of the approved indigent policy Number of indigent households receiving free basic refuse removal All 1, , ,880 1,880 1,930 G2 TL9 The percentage of a municipality s capital budget actually spent by 30 June 2017 [(Amount actually spent on capital projects/ Amount budgeted for capital projects)x100] % of capital budget spent (Amount actually spent on capital projects/ Amount budgeted for capital projects)x100 All 91% 0% 0% 0% 80% 80% 72% O Corrective actions The Municipality will look at increasing the capital expenditure throughout the 2017/18 financial year TL26 Limit unaccounted for water to less than 30% by 30 June 2017 {(Number of Kilolitres Water Purchased or Purified - Number of Kilolitres Water Sold) / Number of Kilolitres Water Purchased or Purified 100} % unaccounted for water by 30 June 2017 All 33.60% 0% 30% 0% 30% 30% 23% B TL27 Limit unaccounted for electricity to less than 15% by 30 June 2017 {(Number of Electricity Units Purchased and/or Generated - Number of Electricity Units Sold) / Number of Electricity Units Purchased and/or Generated) 100} % unaccounted for electricity by 30 June 2017 All 13% 0% 15% 0% 15% 15% 13% B TL29 Spend 90% of the roads and storm water maintenance budget by 30 June 2017 {(Actual expenditure on maintenance divided by the total approved maintenance budget)x100} % of the roads and storm water maintenance budget spent by 30 June 2017 (Actual expenditure on maintenance divided by the total approved maintenance budget)x100 All 98% 15% 30% 60% 90% 90% 96% G2 11
12 Ref KPI Unit of Measurement Ward Previous Year Performance Overall performance for 2016/17 Target Q1 Q2 Q3 Q4 Annual Actual TL30 Spend 90% of the waste water maintenance budget by 30 June 2017 {(Actual expenditure on maintenance divided by the total approved maintenance budget)x100} % of the waste water maintenance budget spent by 30 June 2017(Actual expenditure on maintenance divided by the total approved maintenance budget)x100 All 94% 15% 30% 60% 90% 90% 96% G2 TL31 Spend 90% of the water maintenance budget by 30 June 2017 {(Actual expenditure on maintenance divided by the total approved maintenance budget)x100} % of the water maintenance budget spent by 30 June 2017 (Actual expenditure on maintenance divided by the total approved maintenance budget)x100 All 92% 15% 30% 60% 90% 90% 95% G2 TL32 Spend 90% of the electricity maintenance budget by 30 June 2017 {(Actual expenditure on maintenance divided by the total approved maintenance budget)x100} % of the electricity maintenance budget spent by 30 June 2017(Actual expenditure on maintenance divided by the total approved maintenance budget)x100 All 86% 15% 30% 60% 90% 90% 96% G2 TL33 Achieve 85% microbiological quality level for water as per SANS 241 by 30 June 2017 % microbiological water quality level achieved as per SANS 241 criteria by 30 June 2017 All 99.40% 85% 85% 85% 85% 85% 90.30% G2 TL34 Achieve 85% physical quality level for water as per SANS 241 by 30 June 2017 % physical water quality level achieved as per SANS 241 criteria by 30 June 2017 All 99.60% 85% 85% 85% 85% 85% 88% G2 TL35 Complete the project to upgrade the gravel roads of Railton, by 30 June 2017 Upgrading project of the gravel roads Railton, completed by 30 June New performance indicator for 2016/17. No audited comparatives available G TL36 Complete phase 2 of the Barrydale bulk water supply by 30 June 2017 Phase 2 of Barrydale bulk water supply completed by 30 June New performance indicator for 2016/17. No audited comparatives available R Corrective actions The project is already underway and will be completed in the 2017/18 financial year TL37 Complete the Rialton Sports Stadium upgrade of by 30 June 2017 The Rialton Sports Stadium upgrade completed by 30 June ; 5 New performance indicator for 2016/17. No audited R 12
13 Ref KPI Unit of Measurement Ward Previous Year Performance comparatives available Overall performance for 2016/17 Target Q1 Q2 Q3 Q4 Annual Actual Corrective actions The project will be completed in the 2017/18 financial year TL38 Spend 95% of the allocated budget for the paving of two intersections (Station and Bontebok street) by 30 June 2017 {(Actual expenditure divided by the total approved budget)x100} % of allocated budget spent for the paving of two intersections ( Station and Bontebok street) by 30 June 2017 {(Actual expenditure divided by the total approved budget)x100} 5 New performance indicator for 2016/17. No audited comparatives available 15% 30% 60% 95% 95% 90% O Corrective actions The project was successfully completed with budget savings TL41 Spend 95% of allocated budget for the replacement of water pipes according to the master plan - Barrydale Phase 1 by 30 June 2017 {(Actual expenditure divided by the total approved budget)x100} % of allocated budget spent for the replacement of water pipes according to master plan - Barrydale Phase 1 by 30 June 2017 {(Actual expenditure divided by the total approved budget)x100} 2 New performance indicator for 2016/17. No audited comparatives available 15% 30% 60% 95% 95% 62% R Corrective actions The project was successfully completed with budget savings TL42 Spend 95% of allocated budget for the upgrading of sidewalks by 30 June 2017 {(Actual expenditure divided by the total approved budget)x100} % of allocated budget spent for the upgrading of sidewalks by 30 June 2017 {(Actual expenditure divided by the total approved budget)x100} All New performance indicator for 2016/17. No audited comparatives available 15% 30% 60% 95% 95% 99% G2 TL44 Spend 90% of the waste management maintenance budget by 30 June 2017 (Actual expenditure on maintenance divided by the total approved maintenance budget)x100 % of the waste management maintenance budget spent (Actual expenditure on maintenance divided by the total approved maintenance budget)x100 All 99% 15% 30% 60% 90% 90% 98% G2 TL50 Provide 20kwh free basic electricity to indigent households in terms of the approved indigent policy Number of indigent households receiving free basic electricity All New performance indicator for 2016/17. No audited comparatives available G2 TL66 Complete the electrification of Railton Phase 2 & 3 by 30 June 2017 The Completion of the electrification of Railton Phase 2 & 3 by 30 June New performance indicator for 2016/17. No audited G 13
14 Ref KPI Unit of Measurement Ward Previous Year Performance comparatives available Overall performance for 2016/17 Target Q1 Q2 Q3 Q4 Annual Actual TL67 Spend 90% of the allocated budget on the Upgrading of the outlet of the Grootkloof No3 dam by 30 June 2017 % of budget spent on the upgrading of the Grootkloof No 3 dam by 30 June 2017 All New performance indicator for 2016/17. No audited comparatives available 0% 0% 0% 90% 90% 0% R Corrective actions New investigations will be done as no funding allocations could be received for this project, hens the project has been cancelled TL70 Complete the design for the Upgrade the Suurbraak WWTW by 30 June 2017 Number of design completed for the upgrade for Suurbraak by 30 June ; 3 New performance indicator for 2016/17. No audited comparatives available G TL71 Spent 90% of allocated budget on Suurbraak new reservoir by 30 June 2017 % spent on allocated budget for Suurbraak new reservoir by 30 June ; 3 New performance indicator for 2016/17. No audited comparatives available 0% 0% 0% 90% 90% 52% R Corrective actions Project has been cancelled and a redesign to make provision for the entire upgrade of the bulk water supply is being investigated TL72 Spend 90% of the allocated budget for Buffelsjagsrivier Water Resorvoir by 30 June 2017 % spent on allocated budget for Buffelsjagsrivier resorvoir by 30 June New performance indicator for 2016/17. No audited comparatives available 0% 0% 0% 90% 90% 88% O Corrective actions The project was successfully completed with budget savings To Enhance Access to Basic Services and Address Maintenance Backlogs e) To Enhance Economic Development with Focus on Both First and Second Economies Ref KPI Unit of Measurement Ward Previous Year Performance Overall performance for 2016/17 Target Q1 Q2 Q3 Q4 Annual Actual TL10 Create temporary work opportunities in terms of EPWP by 30 June 2017 Number of temporary work opportunities created by 30 June 2017 All R Corrective actions The Municipality will register more projects in terms of the EPWP Programmes To Enhance Economic Development with Focus on Both First and Second Economies f) To Improve Financial Viability and Management 14
15 Ref KPI Unit of Measurement Ward Previous Year Performance Overall performance for 2016/17 Target Q1 Q2 Q3 Q4 Annual Actual TL13 Financial viability measured in terms of the municipality's ability to meet it's service debt obligations as at 30 June 2017 Debt to Revenue as at 30 June 2017 (Short Term Borrowing + Bank Overdraft + Short Term Lease + Long Term Borrowing + Long Term Lease) / Total Operating Revenue - Operating Conditional Grant All 19.20% 0% 0% 0% 25.30% 25.30% 16% B TL14 Financial viability measured in terms of the outstanding service debtors as at 30 June 2017 Service debtors to revenue as at 30 June 2017 (Total outstanding service debtors/ revenue received for services) All 9% 0% 0% 0% 18% 18% 8% B TL15 Financial viability measured in terms of the available cash to cover fixed operating expenditure as at 30 June 2017 Cost coverage as at 30 June 2017 ((Cash and Cash Equivalents - Unspent Conditional Grants - Overdraft) + Short Term Investment) / Monthly Fixed Operational Expenditure excluding (Depreciation, Amortisation, and Provision for Bad Debts, Impairment and Loss on Disposal of Assets)). All % 0% 0% 1.80% 1.80% 23% B TL22 Compile an action plan to address all the issues raised in the management letter of the Auditor General and submit to the Municipal Manager by 31 December 2016 Action plan approved by the Municipal Manager by 31 December 2016 All G TL28 Achieve a debtors payment percentage of 95% by 30 June 2017 ((Gross Debtors Closing Balance + Billed Revenue - Gross Debtors Opening Balance + Bad Debts Written Off)/Billed Revenue) x 100 All % 0% 95% 0% 95% 95% 106% G2 To Improve Financial Viability and Management g) To Promote Good Governance and Community Participation Ref KPI Unit of Measurement Ward Previous Year Performance Overall performance for 2016/17 Target Q1 Q2 Q3 Q4 Annual Actual 15
16 Ref KPI Unit of Measurement Ward Previous Year Performance Overall performance for 2016/17 Target Q1 Q2 Q3 Q4 Annual Actual TL16 Compile the Risk Based Audit Plan (RBAP) for 2017/18 and submit to the Audit Committee by 30 June 2017 RBAP for 2017/18 compiled and submitted to the Audit Committee by 30 June 2017 All G TL17 90% of the RBAP for 2016/17 implemented by 30 June 2017 [(Number of audits and tasks completed for the period/ Number of audits and tasks identified in the RBAP for 2016/17)x100] (Number of audits and tasks completed for the period/ Number of audits and tasks identified in the RBAP to complete for the period)x100 All 100% 0% 30% 0% 90% 90% 100% G2 TL19 Review the Customer Care Service Charter and submit to council by 30 June 2017 Customer Care Service Charter reviewed and submitted to council by 30 June 2017 All New performance indicator for 2016/17. No audited comparatives available G TL20 Review the Social Media policy and submit to council by 30 November 2016 Social Media policy reviewed and submitted to council by 30 November 2016 All New performance indicator for 2016/17. No audited comparatives available G TL21 Review the Communication Strategy and submit to council by 30 November 2016 Communication Strategy reviewed and submitted to council by 30 November 2016 All New performance indicator for 2016/17. No audited comparatives available G TL24 Review the Records Management policy and submit to council by 30 June 2017 Records Management Policy reviewed and submitted to council by30 June 2017 All New performance indicator for 2016/17. No audited comparatives available G TL25 Complete the annual risk assessment and submit to the municipal Fraud and Risk Committee by 30 April 2017 Completed risk assessment submitted to the municipal Fraud and Risk Committee by 30 April 2017 All G To Promote Good Governance and Community Participation 16
17 3.2.2 Service Providers Performance Section 76(b) of the MSA states that KPIs should inform the indicators set for every municipal entity and service provider with whom the municipality has entered into a service delivery agreement. A service provider: means a person or institution or any combination of persons and institutions which provide a municipal service to or for the benefit of the local community means an external mechanism referred to in Section 76(b) which provides a municipal service for a municipality service delivery agreement means an agreement between a municipality and an institution or person mentioned in section 76(b) in terms of which a municipal service is provided by that institution or person, either for its own account or on behalf of the municipality During the year under review the Municipality did not appoint any service providers who provided a municipal service to or for the benefit of the local community on behalf of the Municipality and therefore this report contains no such details. All other contract appointments are regularly monitored and ensured, that the requirements of the contract are complied with Municipal Functions a) Analysis of Functions The table below indicates the functional areas that the Municipality are responsible for in terms of the Constitution: Municipal Function Municipal Function Yes / No Constitution Schedule 4, Part B functions: Air pollution Building regulations Child care facilities Electricity and gas reticulation Firefighting services Local tourism Municipal airports Municipal planning Municipal health services Municipal public transport Municipal public works only in respect of the needs of municipalities in the discharge of their responsibilities to administer functions specifically assigned to them under this Constitution or any other law Pontoons, ferries, jetties, piers and harbours, excluding the regulation of international and national shipping and matters related thereto Yes Yes Yes Yes Yes Yes No Yes No Yes Yes Yes 17
18 Stormwater management systems in built-up areas Trading regulations Municipal Function Water and sanitation services limited to potable water supply systems and domestic waste-water and sewerage disposal systems Municipal Function Yes / No Yes Yes Yes Constitution Schedule 5, Part B functions: Billboards and the display of advertisements in public places Cemeteries, funeral parlours and crematoria Cleansing Control of public nuisances Control of undertakings that sell liquor to the public Facilities for the accommodation, care and burial of animals Fencing and fences Licensing of dogs Licensing and control of undertakings that sell food to the public Local amenities Local sport facilities Markets Municipal abattoirs Municipal parks and recreation Municipal roads Noise pollution Pounds Public places Refuse removal, refuse dumps and solid waste disposal Street trading Street lighting Traffic and parking Yes Yes Yes Yes Yes Yes Yes Yes Yes Yes Yes Yes Yes Yes Yes Yes No Yes Yes Yes Yes Yes Functional Areas 18
19 3. 3 C O M P O N E N T A : B A S I C S E R V I C E S This component includes basic service delivery highlights and challenges, includes details of services provided for water, waste water (sanitation), electricity, waste management, housing services and a summary of free basic services Water Services a) Introduction to Water Services The status of the provision of water infrastructure as key municipal service for each of the towns, villages and hamlets in the municipal area are as follows: Swellendam The upper reaches of the Klippe River are the main water source for the town of Swellendam. The water source (raw water) for the town of Swellendam is adequate and can accommodate future growth. However, with the current change in weather patterns compels the Infrastructure Department to urgently investigate other raw water sources and upgrade the existing. Consulting Engineers has been tasked to do these investigations. Water is extracted from the source via a weir into a 450mm diameter pipe that is routed to a distribution chamber. From here it is distributed by means of a 250mm diameter pipe to the Swellendam Water Treatment Works (WTW). Surplus water is routed to three conservancy dams, namely Grootkloof 1, 2 and 3. An additional conservancy dam (Grootkloof 4) need to be constructed in future to accommodate future growth. The WTW was upgraded as in We are busy with the planning phase of the upgrade of the WTW to accommodate for future demand and to comply to Blue Drop Certification. Five reservoirs are available in Swellendam to provide storage capacity for potable water. Water pressure and reticulation capacity has been identified in the Bakenskop area of Swellendam and a second reservoir need to be constructed for the involved area to address the problems experienced. The water reticulation network is adequate, although the completion of various ring feeds in the network can improve water distribution management. Portions of the water reticulation network for Swellendam was installed in 1921 and need urgent replacement. Water losses incurred through water pipe breakages will in the near future result in considerable potable water losses and affect income streams. Barrydale The Huis River is the main water source for both potable and irrigation water for the town of Barrydale. The Municipality has a water right of 78 hours per week from the water source. The water extracted from the water source is stored in two separate reservoirs for potable water and two dams for irrigation water. The storage capacity for water must be urgently enlarged, to ensure the availability of potable water for future growth and during the dry season. The availability of water for use by the town need to be augmented, and the use of boreholes as sources of water will have to be investigated in the near future. A new water treatment facility was constructed in 2005 for Barrydale. To allow for future growth of the town, the capacity of the facility need to be upgraded again. Purified water is stored in five reservoirs in the reticulation system, for distribution to the various residential areas of the town. To optimize the storage and distribution of potable water, the reticulation system of Barrydale need to be revised and upgraded. At present a project to upgrade the raw water channel to the town is under construction. High Density Polyethylene (HDPE) lining will to be fitted to the inner 19
20 of the channel and two raw water reservoirs. This initiative will reduce the loss of water due to seepage of water through the weathered concrete channel. Suurbraak The water source for Suurbraak is located at the origin of a tributary of the Buffeljags River up in the Langeberg Mountain. The water received from the water source is piped and routed through the Buffeljags River to the WTW in Suurbraak. The WTW has recently been upgraded and has a purification capacity of 32 Kl per hour. The treatment capacity is considered sufficient for a population of up to people. No storage facility for raw water, before treatment, is available and the lack thereof is considered a weakness in the water provision system of Suurbraak. The purified water is pumped to five small reservoirs in the reticulation system for Suurbraak, for further distribution. The reservoirs available for the storage of potable water is insufficient and capacity need to be upgraded. The water reticulation system has not been extended to erven north of the Buffeljags River and the few individuals occupying residency there on a fulltime basis, obtain their water from rainwater storage facilities. The extension of the water distribution network to the involved area is not a present a priority because of the low occupancy rate of the area and due to other urgent priorities, that need to be addressed. Rietkuil The rural area known as Rietkuil, is an adjoining small holding area supplied with potable water by the Overberg Water Board, an independent water board under the auspices of the National Department of Water Service (DWS). The transfer of the Rietkuil Water Scheme to the Municipality of Swellendam is being negotiated with the DWS. Buffeljags River The village of Buffeljags River is supplied with raw water by an open irrigation channel from the Buffeljags Dam. The water is treated in the WTW of the village and then stored in two reservoirs for distribution. The WTW has been upgraded and a second reservoir has been constructed. The capacity of the current water supply storage facility, as well as the WTW, are sufficient to accommodate the residents of the village in terms of supply demand or to ensure good quality potable water. The Buffeljags water reticulation system is in the planning phase. Infanta Water supply for domestic and other uses are provided by the residents themselves, either by means of rainwater collection or from boreholes. Water used is treated individually for domestic consumption. No municipal water provision service is currently rendered to the village of Infanta. Concerns exist about the future use of boreholes, because the area is serviced by soak away sanitation septic tanks, which may be contaminating ground water. Long term solutions for the supply of potable water are presently being investigated. The lack of available water sources for domestic consumption is restricting the further development of the village. Malagas Some of the properties in the village have access to potable water supplied by the Overberg Water Board, while others make use of water sources such as rainwater collection, ground water from boreholes or water pumped directly from the Breede River. Water used is treated individually for domestic consumption. No municipal water provision service is rendered to the village of Malagas. The emergency housing project under construction at Malagas, will place further strain on potable water provision. Long term solutions for the supply of potable water are being investigated. The lack of available water supply for domestic consumption is restricting the further development of the village. 20
21 Stormsvlei - Water supply for domestic and other uses are provided by residents themselves, by means of rainwater collection, from boreholes or water pumped directly from the Sonderend River. Water used is treated individually for domestic consumption. No municipal water provision service is currently rendered to the hamlet of Stormsvlei, because of various reasons, such as sustainability and viability. Other rural areas The Overberg Water Board is the main supplier of potable water to the rural areas. On agricultural holdings rivers and groundwater sources provide water for irrigation and farming purposes. The largest dam in the Swellendam municipal area is the Buffeljags Dam, with a storage capacity of thousand million cubic meters of water. Various rural settlements and farm schools experience problems with sustainable access to and consistency of water sources, and the quality of the water available for domestic usage. Farm schools are in some instances serviced by municipal water tankers, to supply water for basic sanitation and human consumption. Service delivery contracts for the supply of potable water to communities are being negotiated with the Overberg Water Board. Water losses are reduced to the minimum, the average water losses for 2016/17 was 8.2%. These losses are measured from the source to the sector meters. These losses include the losses in the purification works. b) Highlights: Water Services The table below specifies the highlights for the year: Highlights New pump station Bakenskop WTW Repairs to Railton Pump Station Barrydale Bulk Water Project Buffeljags WTW Description Installation of 2 new water supply pumps Repair and replaced old non-return valves and fittings Upgrade the raw water channel to the town is under construction. HDPE lining will be fitted to the inner of the channel and two raw water reservoirs The WTW has been upgraded and a second reservoir has been constructed Water Services Highlights c) Challenges: Water Services The table below specifies the challenges for the year: Description Upgrade Suurbraak and Barrydale bulk infrastructure capacity Theft and vandalism of telemetry monitoring equipment and data management systems at the water reservoirs Upgrading of old infrastructure Actions to address Upgrade of the bulk raw water canal is currently in progress Install security access control and upgrade security measures Funding applications was submitted for MIG bulk water supply Water Services Challenges 21
22 d) Service Delivery Levels The table below specifies the service delivery levels for the year: Water Service Delivery Levels Households 2015/ /17 Description Actual Actual No. No. Water: (above min level) Piped water inside dwelling Total number reflects the number of residential properties which are billed for water or have pre-paid meters Water Service Delivery Levels: Households e) Employees: Water Services The following table indicates the staff composition for this division: Job Level Posts Employees: Water Services Employees 2016/17 Vacancies (fulltime equivalents) Vacancies (as a % of total posts) No. No. No. % *P.T.I Total *P.T.I. personal to incumbent Employees and Posts numbers are as at 30 June Employees: Water Services 22
23 f) Capital: Water Services The following table indicates the capital expenditure for this division: Capital Projects Capital Expenditure 2016/17: Water Services Budget R'000 Adjustment Budget 2016/17 Actual Expenditure Variance from Adjustment Budget Total Project Value Health and safety measures Upgrading of Barrydale bulk water infrastructure Suurbraak - New reservoir Replace of pipes according to masterplan - Barrydale Phase Buffeljagsriver water reservoir Total Total project value represents the estimated cost of the project on approval by Council Capital Expenditure: Water Services Waste Water (Sanitation) Provision a) Introduction to Waste Water (Sanitation) Provision Swellendam operates 5 Waste Water Treatment Works (WWTW), 2 in Swellendam and 1 in Buffeljags River, Suurbraak and Barrydale respectively. All residents have access to basic satiation services, however the provision of sanitation infrastructure for towns, villages and hamlets of the municipal area, is mainly determined by access to a sustainable water source. Only areas with sufficient available water can be serviced by waterborne sewerage systems. In the absence of such systems, sewerage suction services, septic tanks, soak away sanitation facilities and conservancy sewerage tanks must be used for sanitation purposes. The status of the provision of sanitation infrastructure as key municipal service for each of the involved towns, villages and hamlets in the municipal area are as follows: Swellendam Two WWTW, namely the Klippe River WWTW and the N2 WWTW, are operated for the town of Swellendam. A decision has been taken by the Council to close the N2 WWTW and to move the plant to another location. The rationale behind this decision is that the N2 WWTW was located right at the entrance of the town in a very narrow urban corridor created by restricting geographical and topographical characteristics of the surrounding area and restricted the future urban growth of the town of Swellendam. The existing Klippe River WWTW, located on the north-west urban edge of the town, is in the final stage of upgrade to replace the capacity lost because of the intended closure of the N2 WWTW. The upgrade of the Klippe River WWTW also allows for the creation of capacity for the future growth of the town of 23
24 Swellendam for the next 20-years. The existing sewerage works are exceeding its capacity and the upgrade of sewerage disposal capacity is a very high priority. The sewerage reticulation system for the town is fairly old and need to be upgraded to provide for sufficient level of service for new developments resulting from the densification of the urban area. Barrydale The older part of Barrydale is serviced by conservancy sewerage tanks, while the newer residential area of Smitsville has a waterborne sewerage system. The WWTW in Barrydale has not been completed and consist of oxidation tanks. The sewerage purification system is therefore problematic and need urgent upgrade. The present location of the Smitsville WWTW is also problematic, because it is restricting the future extension of the adjoining residential area (Smitsville) and can only service the Smitsville residential area, because of the restricting topography. Consideration must therefore be given for relocation, to provide a sewerage treatment plant that can service the Barrydale, as well as future developments. The treatment plant is also lacking capacity and need to be expanded significantly to comply to purification standards and to serve the entire urban area. The planning for this project has already started and is considered a priority. Suurbraak Nearly all houses (680 units) on the south side of the Buffeljags River have waterborne sewerage. All sewerage gravitates to a pump station on the north-eastern edge of the town, from where it is pumped to a sewerage treatment plant located on the western edge of the town. The pumping system used, require maximum maintenance and must be considered a limiting factor in the effectiveness of the system and the management of capacity. The rising main connecting the pump station and treatment plant is also inadequate and need to be upgraded. The capacity and quality of the treatment plant is inadequate and cannot accommodate any future growth. Several alternatives are under investigation to address the problems experienced. The erven to the north of the Buffeljags River have not yet been provided with waterborne sewerage and are making use of conservancy sewerage tanks. Buffeljags River All houses in the village of Buffeljags River have waterborne sewerage connections. The capacity of the present WWTW is sufficient to serve 400 houses. The location of the treatment plant is limiting future development possibilities. Infanta No waterborne sewerage system is used in the village. Sewerage is dealt with by means of in-situ conservancy and septic sewerage tanks. The replacement of the sewerage system is under investigation, because of the high risk of contaminating the ground water of the village. This problem is restricting further development of the village and a solution is urgently required. Malagas No waterborne sewerage system is used in the village. Sewerage is dealt with by means of in-situ conservancy sewerage tanks, septic sewerage tanks and soak-away sanitation facilities. A sewerage suction service is rendered by the Municipality. Serious concerns have been expressed on the negative impact that the sewerage system might have on the Breede River. The replacement of the present sewerage system is under investigation. Other rural areas A sewerage suction service is rendered for households and schools within the rural area. The projection is that this service will need to be extended in future, as the type of sanitation facilities used in the rural area are changed from soak away sewerage facilities to conservancy sewerage tanks and septic tanks. 24
25 b) Highlights: Waste Water (Sanitation) Provision The table below specifies the highlights for the year: Highlights Repairs to sewerage works infrastructure in Swellendam, Suurbraak, Barrydale Laboratory equipment procured Upgrade of Information and Communication Technology (ICT) network Description Repairs was done to the clarifier and air valves at Klippe River, refurbishment of sewerage pumps at Suurbraak and refurbishment of sewerage pumps at Barrydale (Smitsville) New laboratory glassware was procured Swellendam (Klippe River) ICT network upgraded c) Challenges: Waste Water (Sanitation) Provision The table below specifies the challenges for the year: Waste Water (Sanitation) Provision Highlights Description Reduce Klippe River sludge accumulation Inadequate funding for bulk infrastructure Upgrade of Suurbraak WWTW and pipeline Actions to address Investigate the possibility to provide farmers for agricultural fertilization. Alternatively transport to Vissershok for disposal. The MIG allocation is based on a generic formula. The MIG allocation will be divided into smaller portions to fund the project implementation in phases The Suurbraak WWTW will be funded by the Rural Development Fund, once approved by National Government Waste Water (Sanitation) Provision Challenges d) Service Delivery Levels The table below specifies the service delivery levels for the year: Waste Water (Sanitation) Provision Service Delivery Levels Households 2015/ /17 Description Actual Actual No. No. Sanitation/sewerage: (above minimum level) Flush toilet (connected to sewerage) Total reflects the number of residential properties which are billed for sewerage Waste Water (Sanitation) Provision Service Delivery Levels 25
26 e) Employees: Waste Water (Sanitation) Provision The following table indicates the staff composition for this division: Employees: Waste Water (Sanitation) Provision 2016/17 Job Level Posts Employees Vacancies (fulltime equivalents) Vacancies (as a % of total posts) No. No. No. % *P.T.I Total *P.T.I. personal to incumbent Employees and Posts numbers are as at 30 June Employees Waste Water (Sanitation) Provision f) Capital: Waste Water (Sanitation) Provision The following table indicates the capital expenditure for this division: Capital Project Capital Expenditure 2016/17: Waste Water (Sanitation) Provision Budget R' 000 Adjustment Budget 2016/17 Actual Expenditure Variance from Adjustment Budget Total Project Value Monitoring devices Waste water sampler Suurbraak WWTW Total Total project value represents the estimated cost of the project on approval by Council Capital Expenditure: Waste Water (Sanitation) Provision 26
27 3.3.3 Electricity a) Introduction to Electricity Local Government holds executive authority over electricity reticulation in accordance with the Constitution. Furthermore, the Electricity Regulating Act makes provision for the establishment of the National Energy Regulator that sets specific standards and guidelines concerning the distribution of Electricity Distribution Licenses. This places a responsibility on municipalities to ensure the provision of electricity services to communities in a sustainable manner for economic and social support. Eskom provides grid electricity for further distribution in Swellendam, Barrydale and Suurbraak. Eskom undertakes electrical distribution for all other communities such as Buffeljags River and the rural areas, which include Malagas and Infanta all of which are under the Municipal area. The status of the provision of electrical infrastructure as a key municipal service in Swellendam, Barrydale and Suurbraak is as follows: Swellendam The current and projected growth of Swellendam is placing enormous strain on the current electricity supply capacity provided by Eskom. Considerable upgrading of Eskom supply points and the bulk electrical infrastructure must be prioritised as a matter of urgency. The completion of an electrical master plan confirmed the se constraints and various projects are in progress to address the electrical infrastructural and supply constraints. The projects as per the Electricity Master Plan must be implemented to replace old, unsafe switchgears and old low - and high- voltage (LV and HV) Lines. In Railton 630 (year to date) new connections to the informal settlement were made as part of the INEP Grant funding received from the Department of Energy (DOE). Barrydale The Eskom substation is operational for consistent supply to Barrydale with its own dedicated feeder and has significantly improved the electrical supply to Barrydale consumers. The electrical distribution infrastructure needs to be upgraded and capital to fund the electrical infrastructure, is of the essence. Suurbraak The electrical distribution network capacity is sufficient for any further development in this area. The overhead 11 kv distribution network in Suurbraak is in need of upgrade. Master planning for the supply of electricity in Suurbraak has been completed and the plan initiatives, for the established constraints and problems, can now be prioritised for implementation. Provision must be made in future capital budgets to attend to these matters. Several operational electrical maintenance projects were conducted during the financial year. The Railton electrification and connections were successfully completed within the available budget and timeframes. However, the Suurbraak electrification and connections could not be completed due to constraints concerning the housing project. This will be dealt with within the 2017/18 financial year. 27
28 b) Highlights: Electricity The table below specifies the highlights for the year: Highlights Railton electrification project Electrical Master Plan Staff skills development Municipal Electricity Utilities (AMEU) Description The project was successfully completed with the available budget and resulted in the successful electrification of 105 households The Electrical Master Plan was successfully updated and includes current GIS and forecasting for the next 10 year growth prospects for the entire area Supervisors, Senior Electricians, Electricians and Linesmen successfully completed their High Voltage Regulations Certificates The AMEU conversance comprising of Western Cape Electrical Engineers, was successfully hosted by the Swellendam Municipality for the first time Electricity Highlights c) Challenges: Electricity The table below specifies the challenges for the year: Limited budget Capital programmes Staff capacity Skills development Description Actions to address Funding applications were submitted No capital programmes have been listed for electrical infrastructure Requests have been made to fill vacancies as per the approved organogram Individual development programmes need to be addressed Electricity Challenges d) Service Delivery Levels The table below specifies the service delivery levels for the year: Electricity Service Delivery Levels Households 2015/ /17 Description Actual Actual No. No. Energy: (above minimum level) Electricity (at least min.service level) Electricity - prepaid (min.service level) Minimum Service Level and Above sub-total Number of residential properties which are billed for electricity or have pre-paid meters (Excluding Eskom areas) Electricity Service Delivery Levels 28
29 e) Employees: Electricity The following table indicates the staff composition for this division: Employees: Electricity 2016/17 Job Level Posts Employees Vacancies (fulltime equivalents) Vacancies (as a % of total posts) No. No. No. % *P.T.I Total *P.T.I. personal to incumbent Employees and Posts numbers are as at 30 June Employees: Electricity f) Capital: Electricity The following table indicates the capital expenditure for this division: Capital Projects Budget Capital Expenditure 2016/17: Electricity R' 000 Adjustment Budget 2016/17 Actual Expenditure Variance from Adjustment Budget Total Project Value Electrification of Railton Phase 2 & Electrification of Suurbraak Electrification of Railton Total Total project value represents the estimated cost of the project on approval by Council Capital Expenditure: Electricity 29
30 3.3.4 Waste Management (Refuse collections, waste disposal, street cleaning and recycling) a) Introduction to Waste Management Swellendam Municipality renders a solid waste management service to all the residents. Waste collections takes place on a weekly basis for all residents and businesses. The Municipality has five main waste management sites situated in the Infanta; Barrydale; Malagas; Suurbraak and Swellendam. All facilities, except for Bontebok and Suurbraak, have no licences. However, only Bontebok will remain operational in the coming years. All household refuse from Infanta and Malagas is transported to the Bontebok site by means of outsourced services. The Swellendam Bontebok Landfill Site is situated 1.2 km south of the N2, adjacent to the Swellengrebel Road leading to the Bontebok National Park. The site can be extended towards the railway line in the South West. Refuse transfer stations have been established at Infanta, Matjieskloof, Lemoenfontein and Malagas where waste is collected on a weekly basis and transported to the Bontebok Landfill Site. Household refuse from Barrydale, Suurbraak and Buffeljags River is collected on a door-to-door basis and transported to the Bontebok Landfill Site. The Municipality has a weekly waste removal service in Swellendam, Suurbraak, Barrydale and other smaller settlements like Buffeljags River where waste in bags are collected and transported to the Swellendam Landfill Site. Domestic waste is removed from all residential and business zones within Swellendam service area and disposed at the Bontebok Landfill Site. The service is limited to a black bag system for domestic refuse. Garden refuse must be removed and delivered to the landfill site by the residents themselves. The Municipality has stopped the unauthorised removal of recyclable refuse by salvagers and has created an opportunity for a private person to establish a proper recycle facility which is in operation at Bontebok Landfill Site. Agri-World Recycling, a privately-owned company, started operation on 11 November Agri-World Recycling recycles paper, glass, plastic, tin and cardboard. It is estimated that only 12% of the recyclable waste received will be send to the Bontebok Landfill Site as and when the facility is in full operation. The environmental impact assessment for this facility was approved in the 2015/16 financial year at the cost of Agri-World Recycling. The management of the Bontebok Landfill Site, that posed a huge challenge, has been addressed. This process that started during September 2013, have gained momentum in the current financial year and the site has been properly reconstructed and cleaned up. This project has made a huge positive impact on the management of the site. A proper fence has been erected in the 2016/17 financial year. The draft Integrated Waste Management Plan will be presented to Council in the first half of the 2017/18 financial year for approval. 30
31 b) Highlights: Waste Management The table below specifies the highlights for the year: Highlights Upgrade of the Bontebok Landfill Site Agri-World Recycling Environmental Protection and Infrastructure Programmes (EPIP) Description New fencing was erected at the Bontebok Landfill Site Recycling improves the lifespan of the landfill site Assists with the maintenance of the landfill site Waste Management Highlights c) Challenges: Waste Management The table below specifies the challenges for the year: Description Unauthorised individuals at the landfill site Weighbridge Actions to address Stricter security measure must be investigated Not yet in operation to measure loads accurately Waste Management Challenges d) Service Delivery Levels The table below specifies the service delivery levels for the year: Waste Management Service Delivery Levels Households Description 2015/ /17 Actual Actual No. No. Solid Waste Removal: (Minimum level) Removed at least once a week Number of residential properties which are billed for refuse removal Waste Management Service Delivery Levels e) Employees: Waste Management The following table indicates the staff composition for this division: Job Level Posts Employees: Waste Management Employees 2016/17 Vacancies (fulltime equivalents) Vacancies (as a % of total posts) No. No. No. %
32 Job Level Posts Employees: Waste Management Employees 2016/17 Vacancies (fulltime equivalents) Vacancies (as a % of total posts) No. No. No. % *P.T.I Total *P.T.I. personal to incumbent Employees and Posts numbers are as at 30 June Employees: Waste Management Housing a) Introduction to Housing The Swellendam Municipality envisions the provision of sustainable housing opportunities as an on-going process beyond the five-year planning of the IDP, and sees the five-year span of the IDP as part of a planning mechanism. The Spatial Development Framework (SDF) together with government`s strategy for integration of towns, serve as guidelines for the development of the Swellendam Municipalities approach to providing sustainable human settlements. The vision of the Human Settlement Unit of Swellendam Municipality is not only to provide housing, but also to build communities. The department also complies with government`s approach to shift from housing construction to sustainable settlements, thus addressing both integration of the poor and previously disadvantaged and providing housing opportunities, opportunities being the operative word. The Government s primary objective is to undertake housing development, which Section 1 of the Housing Act, No. 107 defines as being: the establishment and maintenance of habitable, stable and sustainable public and private residential environments. This is to ensure viable households and communities in areas allowing convenient access to economic opportunities, and to health, educational and social amenities in which all citizens and permanent residents of the Republic will, on a progressive basis, have access to housing. This includes permanent residential structures with secure tenure, ensuring internal and external privacy, and providing adequate protection against the elements, potable water, adequate sanitary facilities and domestic energy supply. 32
33 The existing national human settlements programmes are based on this objective and the principles embodied therein. Municipalities are required to take a leading role in identifying land for the location of housing supply, to facilitate spatial planning and transportation systems and integrate ousing into municipal IDPs. This embodies the vision and mission of the Swellendam Municipality. The National Housing Code is currently under scrutiny to ensure that the mistakes made in the past are corrected and addressed thoroughly. The need for housing: The need for an integrated residential development approach, that addresses the whole spectrum of residential needs, has been identified and the following main income categories have been considered: Subsidy housing greater than R3 500 per month Gap housing R3 500-R per month The following table indicates the prioritised housing sites: Site Property Units Subsidy Priority Serviced sites Suurbraak n/a 35 Total 35 Prioritised Housing Sites b) Highlights: Housing The table below specifies the highlights for the year: Highlights Planning for Swellendam Railton Housing Project Title Deeds Restoration Project Planning for Barrydale Housing Project Description Planning for Swellendam Railton Housing Project, which include 950 housing opportunities, has been completed The backlog has proactively been addressed. Subsidy beneficiaries in older projects have been given property ownership Planning for Barrydale Housing Project, which include 87 housing opportunities, has been completed Housing Highlights c) Challenges: Housing The table below specifies the challenges for the year: Staff shortages Description Differences in financial year end between provincial, national and local government as the main source of funding for development of Human Settlements in the third sphere of government Actions to address Funding must be obtained in order to fill vacancies Proper planning must be done in order to manage the situation 33
34 Description Erection of illegal dwellings and slow judicial process if illegal dwellings are erected Shortage of bulk infrastructure for the development of human settlements in municipal area Actions to address Initiate discussion with the National Department of Human Settlements to intervene Municipal Infrastructure Grant (MIG) funding application has been completed and submitted Housing Challenges d) Service Delivery Levels There are currently approximately housing units on the waiting list. The following table shows the increase in the number of people on the housing waiting list. Financial year Number of housing units on waiting list % Housing waiting list increase/(decrease) 2015/ (4.6) 2016/ Housing Waiting List e) Employees: Housing The following table indicates the staff composition for this division: Job Level Posts Employees: Housing Employees 2016/17 Vacancies (fulltime equivalents) Vacancies (as a % of total posts) No. No. No. % Total Employees and Posts numbers are as at 30 June Employees: Housing 34
35 3.3.6 Free Basic Services and Indigent Support a) Introduction Basic municipal services are rendered to all urban areas and some rural areas within the municipal boundaries. Lack of funding is restricting progress with the extension of basic services to areas still requiring services or the upgrading of existing services. Basic services are currently rendered in towns and villages as follows: Barrydale: All households receive electricity, water, sanitation and refuse removal Infanta: 63 households receive basic services for refuse removal Buffeljags Riverr: All households receive basic services for water, sanitation and waste removal. Eskom supply electricity to all households Suurbraak: All households receive electricity, water, sanitation and refuse removal Malagas: All households receive refuse removal Swellendam: All households receive electricity, water, sanitation and refuse removal Businesses: All businesses receive electricity, water, sanitation and refuse removal Farms: No basic services The tables below indicate the households that received free basic services in the 2016/17 financial year: Financial year Total no of HH Number of households Free Basic Electricity Free Basic Water Free Basic Sanitation Free Basic Refuse Removal No. Access % No. Access % No. Access % No. Access 2015/ / Financial year No. of HH Free Basic Services to Households Electricity Indigent Households Non-indigent households Households in Eskom areas Unit per HH (kwh) Value No. of Unit per Value Unit per Value No. of HH R 000 HH HH (kwh) R 000 HH (kwh) R / / Free Basic Electricity Services to Indigent Households % 35
36 Water Indigent Households Non-indigent households Financial year Value Value No. of HH Unit per HH (kl) No. of HH Unit per HH (kl) R 000 R / / Free Basic Water Services to Indigent Households Financial Performance 2016/17: Cost to Municipality of Free Basic Services Delivered 2015/ /17 Services Delivered Actual Actual R 000 Water Electricity Sanitation Refuse removal Total Financial Performance 2016/17: Cost to The Municipality of Free Basic Services Delivered 3.4 C O M P O N E N T B : R O A D T R A N S P O R T This component includes an in-depth report and description of all road transport related issues including physical roads, transport, and wastewater (stormwater drainage) Roads a) Introduction to Roads The Swellendam Municipality area has 88km paved road systems, which include tar and block paving. The estimated replacement value is around R200 million and the average condition can be rated as fair, as per Pavement Management System. The estimated funding backlog in terms of operation and maintenance in 2008 was R35 million, with a R25 million short term and R31 million medium term backlog. 21% Of the surfacing and structural components of the system is in a poor to very poor condition. It is clear that the priority is general maintenance, including pothole repair, general resealing, crack sealing and addressing base and surface failure. Minor routine maintenance was carried out during the 2014/15 year through the operating budget, but no capital projects were undertaken since no capital funds were available. 36
37 The department s overall strategy is to eliminate the backlog that currently exists. This can only be achieved by attending to the necessary rehabilitation and resealing of backlogs. The greatest concern is, however, the lack of a sustainable funding source. The current operating funds available for roads are merely 1% of the replacement value. Statistics have been taken and adjusted from the Pavement Management System It is the intention of the Municipality to review the Pavement Management System during the 2014/15 financial year. The current backlog is around R55 million for surfacing and structural projects. To address this proves to be problematic, as no capital budget for roads were allocated for the last three years. Funds to the value of R16 million were made available through MIG in order to address roads and stormwater issues in one of the housing projects. During the 2012/13 financial year R8.5 million was spent compared to R3 million in the 2013/14 financial year. The third phase was completed during the 2014/15 financial year. The shortage of staff was partially addressed by the EPWP program, but vacancies should still be filled to optimise the departments operations. Pothole repairs and other maintenance programmes were short-lived, since pipe bursts were the primary activity for maintenance teams during the 2014/15 financial year. All of these were backfilled and repaired by the roads department, interfering with planned maintenance works. The department s top 3 priorities are: The maintenance of existing streets: This has created a partial impact, as no capital budget was available The provision of proper access for every resident: This has created an average impact, as a small amount of complaints have been received The rehabilitation of old infrastructure: This initiative has achieved no impact, as no capital budget has been allocated The Overberg District Municipality initiated a project to establish a rural road asset management system (RRAMS). The system will include an asset register, value of assets, pavement management system and master planning. The project will be bound to a three-year period. Whether or not funding will be made available to implement the system, is yet to be confirmed. 37
38 b) Highlights: Roads The table below specifies the highlights for the year: Railton stormwater project Highlights Description This R9 million project was successfully completed and forms part of the MIG funding that is committed to improving service delivery to all communities Roads Highlights c) Challenges: Roads The table below specifies the challenges for the year: Eliminating backlog Funding Description Actions to address Budgetary provision must be made to eliminate the backlog Dependency on grant funding allocations dampens the efficacy and potential of initiatives. Funding applications were submitted Roads Challenges d) Services Delivery Levels The tables below specify the service delivery levels for the year: Gravel Road Infrastructure: Kilometres Year Total gravel roads New gravel roads constructed Gravel roads upgraded to tar Gravel roads graded/maintained 2015/ / Gravel Road Infrastructure Tarred Road Infrastructure: Kilometres Year Total tarred roads New tar roads Existing tar roads retarred Existing tar roads resheeted 2015/ / Tarred Road Infrastructure Tar roads are being maintained as reports of problems are received or as maintenance is required. 38
39 The table below shows the costs involved for the maintenance and construction of roads within the municipal area: Financial year New & Replacements Resealed Maintained R / / Cost of Construction/Maintenance of Roads e) Employees: Roads The following table indicates the staff composition for this division: Job Level Posts Employees: Roads Employees 2016/17 Vacancies (fulltime equivalents) Vacancies (as a % of total posts) No. No. No. % P.T.I.* Total f) Capital: Roads *P.T.I. personal to incumbent Employees and Posts numbers are as at 30 June The following table indicates the capital expenditure for this division: Employees: Roads Capital Expenditure 2016/17: Roads R' /17 Capital Projects Paving stone intersections x 2 (Station, Bontebok) Budget Adjustment Budget Actual Expenditure Variance from Adjustment Budget Total Project Value
40 Capital Projects Railton: Upgrading of gravel roads with kerbs and stormwater Budget Capital Expenditure 2016/17: Roads R' 000 Adjustment Budget 2016/17 Actual Expenditure Variance from Adjustment Budget Total Project Value Concrete mixer x Upgrading of pavements Speedbumps Total Total project value represents the estimated cost of the project on approval by Council Capital Expenditure: Roads Waste Water (Stormwater Drainage) a) Introduction to Waste Water (Stormwater Drainage) Stormwater systems exist in most of the residential areas. In informal and low-cost housing areas, provisions are made by creating open channels and side drains. Some provisions were made in the latest low-cost housing project. Stormwater master planning needs to be conducted in Smitsville and Suurbraak in order to rectify issues, since little to no systems exist there. Financial provision will be made to compile master plans for these areas, but due to budget constraints only Buffeljags River was completed in 2014/15. The Department of Human Settlements granted funding for a stormwater master plan for Railton, which was implemented by the Provincial Reconstruction Team (PRT). As a result, the upgrades of stormwater drainage in Railton could be completed during the 2016/17 financial year. Daily maintenance consists of opening and cleaning catch pits, manholes, side drains and open channels. This still seems to be challenging due to capacity constraints. Isolated problematic areas where flooding occurred were resolved, due to innovative actions. These areas are closely monitored, with the relevant maintenance and aftercare at hand. 40
41 b) Highlights: Waste Water (Stormwater Drainage) The table below specifies the highlights for the year: Railton stormwater project Damage assessment Highlights Description This R9 million project was successfully completed and forms part of the MIG funding that is committed to improving service delivery to all communities A damage assessment was compiled upon the request of the Provincial and National Disaster Management after heavy storms were experienced in the Western Cape Waste Water (Stormwater Drainage) Highlights c) Challenges: Waste Water (Stormwater Drainage) The table below specifies the challenges for the year: Description Lack of funding to eliminate the backlog Dependency on grant funding allocations dampens the efficacy and potential of initiatives Actions to address Budgetary provision must be made to eliminate the backlog Funding applications were submitted d) Employees: Waste Water (Stormwater Drainage) The following table indicates the staff composition for this division: Waste Water (Stormwater Drainage) Challenges Job Level Posts Employees: Waste Water (Stormwater Drainage) Employees 2016/17 Vacancies (fulltime equivalents) Vacancies (as a % of total posts) No. No. No. % P.T.I.* Total *P.T.I. personal to incumbent Employees and Posts numbers are as at 30 June Employees: Waste Water (Stormwater Drainage) 41
42 e) Employees: Mechanical Workshop The following table indicates the staff composition for this division: Job Level Posts Employees: Mechanical Workshop Employees 2016/17 Vacancies (fulltime equivalents) Vacancies (as a % of total posts) No. No. No. % P.T.I.* Total f) Capital: Stormwater *P.T.I. personal to incumbent Employees and Posts numbers are as at 30 June The following table indicates the capital expenditure for this division: Employees: Mechanical Workshop Capital Projects Upgrading S/W ditch Du Toitsrus/church grounds Phase 2 Budget Capital Expenditure 2016/17: Stormwater R' 000 Adjustment Budget 2016/17 Actual Expenditure Variance from Adjustment Budget Total Project Value Total Total project value represents the estimated cost of the project on approval by Council Capital Expenditure: Stormwater 42
43 3. 5 C O M P O N E N T C : P L A N N I N G A N D L O C A L E C O N O M I C D E V E L O P M E N T Town Planning and Building Control a) Introduction to Town Planning and Building Control The Municipality provides a full spectrum of town planning and building control services within its administrative area. The Town Planning and Building Control Division also includes a compliance component which is responsible for the enforcement of the regulations relating to municipal planning and building control, as well as environmental issues. The Spatial Land Use and Management Act (SPLUMA) and the Land Use Planning Act (LUPA), together with the municipal by-law on land use planning and the National Building Regulations serve as the legislative framework for all land use planning and development. Land use planning and decision making is guided by the SDF, which is the spatial articulation of the IDP and is reviewed every 5 years. The specific land use parameters and development rules are set out in the Swellendam Integrated Zoning Scheme Regulations. All building plans are considered during consultation with Infrastructure Services. Input on development initiatives, particularly in rural areas, is also requested from various district and provincial authorities (Cape Nature, Department of Agriculture, Department of Environmental Affairs and Development Planning, DWS, Department of Transport and Public Works, Heritage Western Cape) before decisions are made. The division works closely with its Aesthetics and Conservation Committees to manage heritage listed buildings, conservation areas and signage. Land use planning applications are advertised in the local press and on the municipal website for public consideration and inputs. b) Highlights: Town Planning and Building Control The table below specifies the highlights for the year: Highlights Introduction of the municipal by-law on land use planning Introduction of the Outdoor Advertising and Signage By-law Use and updating of Geographic Information Systems (GIS) viewers Description This has facilitated a more streamlined decision-making process as well as the introduction of strict timelines in the application process. The new legislation enabled updates of the municipal application forms and related administrative requirements The by-law sets out defined parameters that will enable a uniform approach to the nature, size, and placement of all relevant signage Ongoing investment in the department s GIS, particularly the GIS viewers, has speeded up access to key property information and the Department s ability to assist the public with queries Town Planning and Building Control Highlights 43
44 c) Challenges: Town Planning and Building Control The table below specifies the challenges for the year: Description Attracting skilled, professional staff Proliferation of informal house shops Actions to address The following actions are necessary to attract skilled, professional staff: Focused advertising Introduction of scarcity allowances Improved skills transfer for existing staff The following actions are necessary to ensure success: More regular inspections Stricter implementation of compliance measures Amendment of current House Shop Policy Town Planning and Building Control Challenges d) Service Delivery Levels The tables below specify the service delivery levels for the year: Detail Applications for Land Use Development Formalisation of Townships Rezoning Built Environment 2015/ / / / / /17 Planning application received Determination made in year of receipt Applications withdrawn Applications outstanding at year end Awaiting DEA&DP decision Applications for Land Use Development Type of service 2015/ /17 Building plans application processed Total surface (m2) m² m² Approximate value (Rand) R Land use applications processed Additional Performance Town Planning and Building Control 44
45 e) Employees: Town Planning and Building Control The following table indicates the staff composition for this division: Employees: Planning 2016/17 Job Level Posts Employees Vacancies (fulltime equivalents) Vacancies (as a % of total posts) No. No. No. % Total *P.T.I. personal to incumbent Employees and Posts numbers are as at 30 June Employees: Town Planning and Building Control f) Capital: Town Planning and Building Control The following table indicates the capital expenditure for this division: Capital Expenditure 2016/17: Planning R' /17 Capital Project Budget Adjustment Budget Actual Expenditure Variance from Adjustment Budget Total Project Value Extension of GIS Steel cabinets Total Total project value represents the estimated cost of the project on approval by Council Capital Expenditure: Town Planning and Building Control 45
46 3.5.2 Local Economic Development (LED) The Swellendam Tourism Organisation (STO) as the implementing partner for the Swellendam Municipality, delivers tourism, destination management and local economic development (LED) functions on behalf of the Municipality. The STO was in 2014 awarded a jobs fund contract to implement a local economic and job creation project in the municipal area. The Swellendam Tourism Economic Empowerment Partnership (STEEP) project is a catalyst for local economic development, empowerment and radical transformation. The STO re-engineered the organisation to fulfil a broader mandate and take on the role as the lead development agency within the region. STEEP was designed as a partnershipbased model aimed to transform the tourism economic landscape and yield positively to economic growth and job creation. As a jobs fund project, its primary objective was to stimulate and create jobs for marginalised unemployed and disadvantaged community members. STEEP took on a mandate to create an initial 837 jobs over a 3-year period. In the early stages, the target was found to be unachievable and unrealistic within the current economic climate. This target was revised and adjusted to 671 new jobs. STEEP s vision is as achieve the following: To implement in the Swellendam municipal area an innovative best practice sustainable job creation partnership model that will contribute to economic transformation and social upliftment of the local communities. Although the project was approved in December 2014 and officially commenced in January 2015, it was only effective onthe-ground with roll-out of the project starting in June STEEP aimed to create jobs, provide skills training and unlock new enterprise opportunities to benefit the disadvantaged communities, as well as grow and sustain the local tourism and related economies through enhanced destination marketing and management. Ultimately creating a conducive environment for job creation. Project key objectives were: Create jobs and economic development in the local tourism sector Diversify and expand the local tourism economy Increase local previously disadvantaged individuals (PDI) participation and beneficiation in the tourism sector Empower local people through training and skills development Grow the local tourism economy through effective destination marketing Develop municipal infrastructure to support the above and be catalytic for local economic development The key deliverables of STEEP over the 3 year period is as per the revised model approved in 2016 as follows: Create 671 permanent jobs Work placement and training opportunities Support the start-up of 38 new Small, Medium and Micro-sized Enterprises (SMME) 46
47 Renovate and upgrade dilapidated strategic municipal tourism assets for economic opportunities and job creation Facilitate development of new tourism activities and routes to diversify the tourism economy Jobs in the tourism and agricultural sector are primarily short-term in nature. Swellendam needs to expand and diverse its tourism offerings to mitigate the negative influencing factor of seasonality. This can be achieved by expanding its tourism offerings and focussing on the diversity of natural resources, such as: eco, adventure, sport and cultural tourism. a) Highlights: LED The following performance highlights with regard to the implementation of the LED strategy are: Highlights Increase in permanent job opportunities Increase in short term job opportunities An increase in the participation of skills and enterprise development training and development internships increasing the skills and competency levels of job seekers Increase in access to training and development workshops and programmes within the skills and entrepreneurial development arena Increase in new registered small businesses/ stimulation of new venture creation Establishment of a centralised business hub and resource centre. A one-stop shop for businesses to access support and development services Introduction and setup of sector specific entry level incubators in the Swellendam municipal area Introduction of a SMME Start-up Capital Support Transfer Programme Creating and stimulating an enabling supportive environment for SMME/ Co-operative development Introduction of The Big Shanty rural micro enterprise development programme Introduction of international exchange mentorship and coaching Description Created 196 validated permanent jobs for the period of 1 July 2015 to 30 June 2017 Created of 192 validated short-term jobs for the period 1 January 2015 to 30 June learners/unemployed job seekers entered into placement internships between 1 July 2015 to 31 March beneficiaries received various forms of training through the coordination and facilitation of various workshops. A joint initiative was conducted to start the Automation Works/ STEEP Skills Training Academy Assisted and supported the registration and formalisation of 74 new business start-ups between 1 July 2015 to 30 June 2017 A total of 414 aspiring, emerging and existing entrepreneurs were supported for the period 1 July 2015 to 30 June 2017 through various business support, advisory and development interventions offered by STEEP STEEP supported and assisted the creation of 5 new physical incubator facilities which aims to nurture and support SMME development by providing virtual and physical incubation products and services The programme awarded 9 SMME s with start-up support of which 7 clients redeemed the award in terms of capital transfer assistance to help them with their enterprises STEEP facilitated and entered into collaboration agreements with strategic partners to create a conducive environment for business development support, training, coaching and mentorship. These include collaborations with Small Enterprise Development Agency (Seda), South African National Apex cooperative (SANACO), Angels Business Kits and Belgium Exchange STEEP together with Angels Business Kits and the Forward Fund introduced a customized programme to support 50 micro and informal entrepreneurs. This is a 12 month training and mentoring programme specifically designed for the informal traders/vendors and micro enterprises Entered into a partnership with Belgium Exchange. This led to the 47
48 Highlights Description programme with Belgium introduction of an international Small Business Mentorship Programme and has to date supported a total of 45 local SMME s with mentoring and coaching support over a period of 10 months Increased focus and support to the development of community co operatives Stimulating and increasing women in business Stimulating diversification and transformation of the local economy Upgrading of municipal-owned tourism infrastructure assets Stimulating growth and access to markets for the informal sector Increase in tourism promotion and destination management Unlocking potential for new development initiatives and interventions Introduction of the Cape Trade Route brand b) Challenges: LED In collaboration with SANACO, STEEP supported and assisted about 20 co-operatives with various support interventions STEEP and Angels Business Kits facilitated local women entrepreneurs to mobilize themselves into an association or formal structure which advocates, lobby s and drives women economic empowerment. The Women-in-Business (WIB) network is now an active and formally registered body addressing and supporting the needs of women in business. Currently more than 50 women are actively participating STEEP introduced the concept of rural tourism development precincts and have been catalytic in the design and planning of various diverse and new tourism routes and products to be developed, which will stimulate the growth of the tourism sector STEEP assisted the Municipality in upgrading and improving tourism infrastructure assets. It has contributed to the upgrading of municipal owned assets into improved facilities for future use and benefit of the local communities Introduction of programmes to support the informal craft market to grow the informal arts and crafts sector Through destination marketing, the STO positively contributed to Swellendam receiving positive media coverage and winning various tourism related awards. This compliments its status as the number 1 Municipality. This led to an increase in tourists STEEP has been catalytic to unlock potential new development initiatives which would positive stimulate and support local economic development within the region Strategic promotion of a new and more inclusive brand of the Municipality. This creates opportunities for marketing and brand promotion of the town holistically and focusing on the uniqueness of the town LED Highlights The following challenges with regard to the implementation of the LED strategy are: Description Sustainability planning: access to LED functions/services and products post-project STEEP Lack of a functional and a dedicated LED Unit within the Municipality Stimulating and creating an enabling economic environment and Actions to address STEEP is a project of the STO and therefore is implemented within a specific timeframe. The sustainability and continuity of the project s success is critical to ensure continued economic growth and development The Municipality does not have a LED Manager or officer to ensure the implementation of the LED Strategy to enhance the LED support network at national, provincial and local level The Municipality must secure and invest adequate resources into 48
49 climate for LED c) LED Strategy Description Actions to address infrastructure development to create an enabling and conducive environment for economic, industrial, commercial and SMME development Challenges LED The LED strategy identifies various issues and strategic areas for intervention such as: Strategic Areas Skills development and training SMME and co operatives development and growth Promote rural tourism development and growth Investment promotion Infrastructure / tourism assets upgrades and development Description Increase the skills and competency levels of unemployed people to provide the local labour market with a skilled and competent workforce. Improve employability of the unemployed by providing a range of gap and specialised skills training programmes Develop and support an active SMME sector. Provide opportunities for enterprise development and training, access to business development support services and opportunities for business linkages. Increase and develop a robust local supply chain. Focus on diversification of the economy by expanding and unlocking opportunities in other growth sectors. Diverse the economy and expand into logistics, distribution, manufacturing sector. The Municipality must maximize all resources by capitalising on natural, cultural, historical assets (tangible and intangible) which aims to offer diversity to the tourism market. Swellendam needs to use this to its competitive advantage by introducing an integrated approach to tourism transformation and growing a strong tourism footprint Develop and implement an investment promotion and incentive strategy to attract investment into the area to promote and support LED Develop and implement a municipal tourism asset upgrading, improvement, management and maintenance plan. Conduct an asset inventory of all tourism assets. Scope the development of a broad-based tourism portfolio which will support destination management and marketing and which is inclusive of all assets owned by the Municipality. Currently the Municipality has assets which are not used efficiently and effectively and therefore do not derive maximum LED benefits LED Strategic Areas d) Tourism Overview A new marketing brand has been adopted under the banner of Cape Trade Route, linking the region to its unique, sustained history with trade. It encompasses the seven towns under a consolidated banner to maximise and explore market trends using innovation technology and visual aids to entice new business and increase visitor numbers. A strong branding campaign, sufficient supporting written information, good signage and a method of monitoring feedback of visitors for continuous improvement will ensure that the region fulfils its tourism potential. The multiplier-effect would automatically share the financial benefits of the tourism spend and increase the growth of the economy. 49
50 e) Informal Street Trading Annually the Municipality provides sites to informal traders at nominal fee. There are 17 full year permits and most of the sites are occupied. Trading takes place daily from 07:00 to 18:00 and peaks over weekends and on paydays. f) Employees: LED The following table indicates the staff composition for this division: Employees: Local Economic Development 2016/17 Job Level Posts Employees Vacancies (fulltime equivalents) Vacancies (as a % of total posts) No. No. No. % Total Employees and Posts numbers are as at 30 June Employees: Local Economic Development f) Capital: LED The following table indicates the capital expenditure for this division: Capital Expenditure 2016/17: LED R' /17 Capital Project Budget Adjustment Budget Actual Expenditure Variance from Adjustment Budget Total Project Value Security Cameras Total Total project value represents the estimated cost of the project on approval by Council Capital Expenditure: LED 50
51 3. 6 C O M P O N E N T D : C O M M U N I T Y A N D S O C I A L S E R V I C E S Libraries a) Introduction to Libraries The Greater Swellendam Municipality is proud to have five public libraries and two wheelie wagons that meet the needs of the different communities. The main library is Swellendam Public Library, with Railton Public Library serving as the branch library. Barrydale, Suurbraak, and Buffeljags River have their own libraries, but inhabitants are not limited to utilise one library only as library cards can be used at any library, at the convenience of the library user. All libraries are equipped with free computers and Internet access for the creation of documents and research purposes. Broadband access has been installed at all community libraries. Many community members make use of the library to access the Internet and do work, to read newspapers and to page through the latest magazines. Library Services are fully funded by Provincial Library Services (DCAS) and national government. Although library staff is on the municipal payroll, the Municipal Replacement Funding (MRF) and conditional grant cover salaries and benefits. A lack of funding is one of the reasons why new books are limited. There is a very good working relationship between Tedcor and the different library staff. Tedcor assisted the libraries with recycling activities and library programmes. Programmes were well attended during the past year by not only children but also by our senior citizens. The Suurbraak Public Library has been extended, expanded, and upgraded to be able to accommodate more reading material and to ensure that there is optimal space for all library users. All libraries are privileged to have Britannica-online (electronic encyclopedias). There are three different levels and it is available in 104 languages. It is updated daily, so the latest information is available immediately. Malagas Wheelie Wagon went on SLIMS (SITA Library Information Management System) in April New library cards have been issued to library users, which they can use at any library in the municipal area. The wheelie wagons have been replaced with old shelves from Suurbraak Public Library. There is more space available and a comfortable atmosphere has been created. Although Suurbraak Public Library has been completed, the planned official inauguration on 29 May 2017 did not take place because of public unrest. This community asset is a real masterpiece and houses the latest technology. Suurbraak Public Library s first Library Forum took place on 28 June Barrydale in Bloom donated books to Barrydale Public Library to the value of R This was a real blessing, since new books are so scarce due to budget cuts. All libraries and wheelie wagons received new equipment and furniture. 51
52 b) Highlights: Libraries The table below specifies the highlights for the year: Suurbraak Library upgrade Holiday Programmes hosted Highlights An additional R was received for furniture and equipment from conditional grants Description The Suurbraak Library upgrades was successfully completed. The project cost R and has provided for more space for reading material and users of the library The successful attendance of scholars during school holidays this past year, has made the holiday programmes hosted by Library services invaluable Furniture and equipment were purchased for all libraries and wheelie wagons Libraries Highlights c) Challenges: Libraries The table below specifies the challenges for the year: Funding Description Actions to address As Library Services are dependent on grant funding, the available budget remains to be problematic. Applications for funding was submitted Libraries Challenges d) Services Delivery Levels The table below specifies the service delivery levels for the year: Type of service 2015/ /17 Library members Books circulated Exhibitions held Internet users Childrens programmes Visits by school groups Old age home visits n/a 92 Wheelie wagon visits n/a 16 Services Delivery Levels for Libraries 52
53 e) Employees: Libraries The following table indicates the staff composition for this division: Employees: Libraries 2016/17 Job Level Posts Employees Vacancies (fulltime equivalents) Vacancies (as a % of total posts) No. No. No. % P.T.I.* Total *P.T.I. personal to incumbent Employees and Posts numbers are as at 30 June Employees: Libraries f) Capital: Libraries The following table indicates the capital expenditure for this division: Capital Project Upgrading of Suurbraak Library Furniture and Equipment All Libraries Budget Capital Expenditure 2016/17: Libraries R'000 Adjustment Budget 2016/17 Actual Expenditure Variance from Adjustment Budget Total Project Value Total Total project value represents the estimated cost of the project on approval by Council Capital Expenditure: Libraries 53
54 3.6.2 Cemeteries a) Introduction to Cemeteries The Municipality is responsible for 9 cemeteries of which 4 is full to capacity. There are 5 currently in use, which is situated in Swellendam (2), Barrydale (2) and in Suurbraak (1). All cemeteries are maintained on a continuous basis and are generally in a good condition. New schedules were implemented to ensure that maintenance is being done on a regular basis. The fencing of cemeteries was upgraded to reduce illegal dumping and littering as was as vandalism. In general, the cemeteries division have made remarkable strides by implementing a new electronic burial record system and also updating old records to the system. This provides for clear and precise record keep of information that is easily excisable. b) Highlights: Cemeteries The table below specifies the highlights for the year: Maintenance of cemeteries Highlights Description Cleaning takes place on a continuous basis as per maintenance schedules Cemeteries Highlights c) Challenges: Cemeteries The table below specifies the challenges for the year: Description Barrydale (Smitsville) Cemetery (digging surface hard) Actions to address Digging of graves to be done in advance, as the surface is extremely hard, to ensure graves are available upon request Cemeteries Challenges d) Services Delivery Levels The table below specifies the service delivery levels for the year: Type of service 2015/ /17 Pauper burials 5 2 Services Delivery Levels for Cemeteries 54
55 3. 7 C O M P O N E N T E : E N V I R O N M E N T A L P R O T E C T I O N Environmental Protection a) Introduction to Environmental Protection Although environmental protection and management vests primarily with the Provincial Department of Environmental Affairs and Development Planning, certain environmental functions are the responsibility of the Municipality. These include air and noise pollution, biodiversity and landscape management, and coastal protection. The National Estuarine Management Protocol (NEMP) was published in May 2013, with the overarching management over the Breede River now being a provincial function. The province is currently in the process of finalising the draft management plan for the estuary, in accordance with various legislation including NEMP, the Integrated Coastal Management Act (ICMA), the National and Western Cape Coastal Management Programme, as well as the White Paper on Sustainable Coastal Development in South Africa. The Breede River Estuary Management Plan was initiated in 2008, and was reviewed in 2009, 2011 and As part of the finalisation process, the EMP was advertised for comment in August 2016 and will be submitted to the National Minister of Environmental Affairs for approval during In terms of the ICMA, the management of estuaries is a municipal competency, excluding those areas that reside under the authority of conservation and protected area management agencies in which the estuary is located. Management of the lower stretches of the Breede River is currently done in terms of a service level agreement between the Hessequa Municipality and Swellendam Municipality and the Lower Breede River Conservancy Trust (LBRCT). Both municipalities have promulgated a By-Law on the control and management of the Breede River. The following estuarine matters are specific municipal competencies: To institute invasive alien vegetation clearing and management, according to the Integrated Invasive Vegetation Management Plan To actively promote a better understanding, appreciation, use and conservation of the limited natural resources within the municipal area (including biodiversity, soil, water and energy) by the owners and staff of, and visitors to, the area Environmental Officers have to be appointed to manage and control the environmental issues Promotion of the conservation of the environment (biophysical, socio-economic and cultural historic characteristics) Promotion of the integrated management of Reserves and natural areas within the municipal jurisdiction To develop and maintain high quality visitor infrastructure, facilities and recreational activities along sound financial lines To enhance the tourist potential of the Swellendam Municipal area through the actions mentioned above Manage the interface between the Natural and Urban Environment, for example Baboon Management The key municipal challenge in this regard is to generate sustainable funding for environmental management and for all of the above functions. 55
56 Pollution Control The Municipality is mandated to establish specialized units for air quality and noise control within its administrative area. At this stage, the Municipality has allocated this responsibility to one of its Compliance Officers. The Air Quality By-law has been promulgated and the Air Quality Management Plan is in the developmental phase. The Compliance Officer has already undergone basic training on noise control. Biodiversity and Landscape Biodiversity management is a process and is monitored on an ongoing basis. The Municipality has access to fairly detailed mapping setting out the Critical Biodiversity Areas (aquatic and terrestrial) in its area of operation. This mapping is consulted when assessing applications for new development within the area. The South African National Biodiversity Institute ensures that this mapping is added to regularly and kept up to date. The management and control of landscapes is also monitored when assessing new development, with the National Heritage and Resources Act playing a key role in rural areas. The Overberg District Municipality and Department of Environmental Affairs and Development Planning have introduced the coastal setback line process for the Overberg Region. The Municipality currently uses the 5m contour line for the Breede River which will be in place until the setback lines for the relevant Overberg Municipalities have been finalised. Coastal Management The Municipality has addressed the cleaning of the public beach at Infanta as well as the maintenance of infrastructure (signs, trails, paths, benches, ablutions, boardwalks and bridges). Issues still to be addressed are the registration of public boat launch sites. Environmental management plans for the public launch sites at Infanta, Moddergat and Malagas have been completed and have been submitted to province for approval by the Minister of Environmental Affairs and Development Management. The requisite by-law will be promulgated thereafter. b) Highlights: Environmental Protection The table below specifies the highlights for the year: Highlights Appointment of an Environmental Education and Awareness Office in January 2017 Data gathering and measurement task for the Estuary Management Plan (EMP) continues Illegal developments identified and corrective steps taken Presentations and talks conducted Description Increase of public knowledge and awareness of environmental impacts of their actions will be enhanced A variety of tasks regarding water quality and habitat protection have been assigned to the LBRCT to inform the EMP process and finalization Illegal or non-compliant buildings and developments were inspected and either stopped or handed to Province for action in terms of the NEMA regulations Topics included: wetland awareness, pollution (land, estuary and sea), mammal strandings, efficient water use and alien vegetation removal 56
57 Publications Highlights Description Increased use of social media and issuing of information pamphlets has improved public awareness and cooperation Environmental Protection Highlights c) Challenges: Environmental Protection The table below specifies the challenges for the year: Illegal developments Description Actions to address Faster response from lead agencies where province has jurisdiction. Additional municipal resources to be applied to preventing illegal building activities Marine Living Resources Act Department of Agriculture, Forestry and Fisheries (DAFF) to be encouraged to renew the compliance agreement to assist the Municipality to control illegal fishing and bait organism collection Environmental Protection Challenges d) Lower Breede River Conservancy Trust (LBRCT) Environmental Activities The following table indicates the activities of LBRCT Inspections at slipways 2015/ /17 Recreational river boats Recreational sea boats 5 4 Commercial sea boats 9 13 Inspections at Slipways The LBRCT has four appointed Environmental Law Enforcement Officers to act in terms of the municipal by-laws as well as the Marine Living Resources Act. There are six public slipways which need to be checked. The majority of anglers use the estuary for fishing as well as for access to the sea and need to be checked in terms of fish catches and compliance to the municipal by-laws. The LBRCT are tasked to record catch statistics which are sent to the relevant DAFF scientists. The table below specifies the number of patrols: Patrols 2015/ /17 Vehicle/motorbike patrols Foot patrols Boat patrols Number of Patrols There are about 470 slipways and jetties located on the Swellendam side of the estuary. The best way (and sometimes only way) to check these boats is on the water by patrol boat. The LBRCT conducts boat patrols to check boats and conducts foot and motorbike patrols to reach the more difficult places where bait organisms are being removed. Boat patrols are also 57
58 used to check other environmental concerns such as illegal developments and contraventions in terms of NEMA. The LBRCT is expected to conduct site inspections for development applications as well as EIA s. The table below specifies the number of fish outlet inspections: Number of fish outlet inspections 2015/ /17 Restaurant 5 0 Fish shop 0 (Outlet Closed) 0 Hotel 4 0 Fish Outlet Inspection This is an important control method to ensure that no recreational fish is sold illegally. The table below specifies the number of commercial fisheries inspections: Commercial fisheries inspections 2015/ /17 Line fish 12 0 Oysters 24 0 Commercial Fisheries Inspections Commercial catches are monitored as operators have certain permit conditions and quotas that need to be complied with. No commercial fishing is allowed in the estuary. The following table indicates the number of warnings and prosecutions: Warnings(W) and prosecutions (P) 2015/ /17 W P W P MLRA Municipal by-law NEMA Warnings and Prosecutions e) Environmental Education and Liaison Activities The table below specifies the environmental education and liaison activities: Liaison Meetings 2015/ /17 Number of meetings Liaison Meetings The LBRCT / Municipality is well represented at all major local conservation initiatives, including the Municipal Coastal Committee and the Breede River Estuary Advice Forum, just to name just two. 58
59 The following table indicates the educational presentations for the year: Educational Presentations 2015/ /17 Number of education activities Number that attended Educational Presentations The LBRCT has kept up regular educational activities and presentations to improve the knowledge of local communities. Topics of presentations are kept around local issues and have been well received. There is also a monthly conservator report that is sent out to a wide support base that focuses on the conservation of the Breede River Estuary. The following table indicates the media release issued during the year: Media releases 2015/ /17 Local information By-Law Information DAFF Do s and Don ts By-Law notices 0 (no new by-laws published) 0 (no new by-laws published) Monthly conservator reports Article in News paper 5 28 Social media (Facebook) Weekly postings Weekly postings Media Releases The table below specifies the special events and workshops hosted: Special events and workshops 2015/ /17 Number of events Special Events and Workshops The table below specifies the angling competitions hosted: Angling Competitions 2015/ /17 Number of competitions 3 3 Number of anglers Angling Competitions The municipal by-law requires any activity such as fishing competitions, regattas and other events to be approved by the Municipality before commencement. 59
60 3. 8 C O M P O N E N T F : S E C U R I T Y A N D S A F E T Y This component includes: traffic; law enforcement; fire and disaster management The Swellendam Municipality is eager to ensure a safe environment for the public, personnel and councillors. The Municipality therefore makes use of private security firms to ensure the safety of the personnel and councillors, as well as members of the public that visit municipal offices. The council chambers are under camera surveillance and specialised security forces are contracted to oversee the security during council meetings. Traffic Services also assists in this regard. Security is restricted to the main office building in Voortrekker Street and the engineering offices and stores in Lindt Street. All municipal buildings are equipped with alarms systems connected to armed response security. The Municipality needs to work towards improving relations with the South African Police Service (SAPS). The situation in the central business area of Barrydale has become a major challenge and a full-time Law Enforcement Officer man the area on Friday afternoons and Saturday mornings. Regular meetings with SAPS in Barrydale is scheduled on Friday mornings in order to coordinate the actions for the weekend. The use of a vacant municipal building in Swellendam has been granted to the Neighbourhood Watch in Swellendam, free of charge Law Enforcement a) Introduction to Law Enforcement Law Enforcement is basically a SAPS function and the municipal services in this regard is restricted to policing of municipal by-laws. The aim of the Law Enforcement Unit is to ensure obedience to municipal by-laws and to create an environment that will further the social and economic development of the community. It is of utmost importance that the community feel safe and can participate without fear and prejudice in the affairs of the Municipality. The quality of life of the inhabitants and the visitors is dependent on a healthy and safe environment and therefore the municipal by-laws must be adhered to. The community and their families must feel safe to make use of and relax in public open spaces and municipal facilities. It is for this reason that we are currently employing 10 Law Enforcement Officers who hailed from the funding acquired from the Provincial Government via the EPWP programme to enrol 12 students for training over a period of 24 months. These students have completed their training and received their certificates and are now active within the community. This has resulted into law enforcement of the Municipality being much more visible and rules and regulations being enforced successfully. The nuisances created by culprits must be addressed efficiently and effectively. The challenges faced in this regard relates to the division of powers between the local and district municipality and the grey areas that were created. Furthermore, unfunded mandates are enforced on municipalities to assist with provincial competencies such as environmental control. A lack of trained staff to cope with air pollution and noise control is a major challenge to overcome. New by-laws have been published and implemented. 60
61 b) Highlights: Law Enforcement The table below specifies the highlights for the year: Highlights Description 10 Law Enforcement Officers appointed Fully qualified as Peace Officers and Traffic Wardens Received a second safety kiosk from the Department of Community Safety Wolwekloof Elite Drill Squad Training c) Challenges: Law Enforcement The table below specifies the challenges for the year: For more visibility at hotspots to utilized crime prevention Two students were elected for the Wolwekloof Elite Drill Squad to perform at the closing ceremony First aid, basic firefighting, handling of hazardous materials, introduction to disaster management and emergency evacuation, peace officer and traffic warden training were received Law Enforcement Highlights New uniforms required Lack of Equipment Description Actions to address Budgetary provision must be made to purchase more law enforcement equipment Budgetary provision must be made to purchase more law enforcement equipment Law Enforcement Challenges d) Employees: Law Enforcement The following table indicates the staff composition for this division: Job Level Posts Employees: Law Enforcement Employees 2016/17 Vacancies (fulltime equivalents) Vacancies (as a % of total posts) No. No. No. % Total
62 Employees: Law Enforcement 2016/17 Job Level Posts Employees Vacancies (fulltime equivalents) Vacancies (as a % of total posts) No. No. No. % *P.T.I. personal to incumbent Employees and Posts numbers are as at 30 June Employees: Law Enforcement Traffic Services a) Introduction to Traffic Services The Municipality renders a comprehensive traffic service including traffic law enforcement, road markings, road traffic signs, law enforcement in general and a shared disaster management in conjunction with the Overberg District Disaster Management Unit. We endeavor to educate and create a culture of compliance and willingness to obey to traffic law, rules and regulations and operate on the legal mandate of NRTA 93/96 and NLTA 5/2009. Operational activities inter alia include roadblocks, high visibility, random vehicle checkpoints, execution of traffic related warrants and traffic laws and policing of municipal bylaws. Traffic also partner with other law enforcement agencies, like the SAPS, LBRCT and Provincial Traffic Services to minimized road deaths and other crime related problems. The Municipality does not have a Disaster Management Unit, even so the service must be provided to the community and actions to address this matter has been set into play. Several awareness campaigns regarding road safety and fire protection are conducted throughout the year. The Municipality prides itself in enforcing its by-laws diligently and ensuring the Swellendam municipal area is a safer place for all. b) Highlights: Traffic Services The table below specifies the highlights for the year: Double Century Cycling Tour Highlights Description The Municipality was the host area of this 202km cycle tour that comprises of over cyclists. The event is organized by the Cape Town Cycle Tour Trust and has been running for its 10 th consecutive year. No incidents were reported and traffic was running smoothly under the watchful eye of the Traffic Department 62
63 Highlights Description Filling of vacant positions The following positions were filled: Snr Traffic Officer; Supervisor (Registration, Licensing and cashiering); Snr Clerk Licensing Traffic Services Highlights c) Challenges: Traffic Services The table below specifies the challenges for the year: Challenges Shortage of traffic officers and administrative staff Vacancy of Manager Traffic Services Limited space at cashier point Actions to overcome Budgetary provision must be made to appoint additional personnel The position Manager Traffic Services became vacant at 30 June 2017 and will be advertised to ensure that the position is filled The extensions were budgeted for and the project was earmarked to be completed in June 2017, however due to budget constraints the project will now only be completed in the 2017/18 financial year Traffic Services Challenges d) Services Delivery Levels The table below specifies the service delivery levels for the year: Details 2015/ /17 Motor vehicle licenses processed Learner driver licenses processed Driver licenses processed Driver licenses issued Fines issued for traffic offenses Provincial/Mun (speed ) Provincial/Mun (Speed ) R-value of fines collected Roadblocks held Complaints attended to by Traffic Officers Number of officers in the field on an average day Number of officers on duty on an average day Services Delivery Levels for Traffic Services 63
64 e) Employees: Traffic Services The following table indicates the staff composition for this division: Job Level Posts Employees: Traffic Services Employees 2016/17 Vacancies (fulltime equivalents) Vacancies (as a % of total posts) No. No. No. % Total f) Capital: Traffic Services Employees and Posts numbers are as at 30 June The following table indicates the capital expenditure for this division: Employees: Traffic Services Capital Project Budget Capital Expenditure 2016/17: Traffic R'000 Adjustment Budget 2016/17 Actual Expenditure Variance from Adjustment Budget Total Project Value Extension of the traffic offices Total Total project value represents the estimated cost of the project on approval by Council Capital Expenditure 2016/17: Traffic Services 3. 9 C O M P O N E N T G : S P O R T A N D R E C R E A T I O N This component includes: community parks; sports fields; sports halls; stadiums; swimming pools; and camp sites. 64
65 3.9.1 Sport and Recreation In terms of our mandate we make facilities, such as sport fields, available to the broader community. The Municipality is responsible for development of the facilities and the upgrading thereof whilst the sport clubs leases the facilities and as agreed upon, must maintain it. The Municipality develops and maintains community parks, halls, camp sites and the caravan park. This service places an enormous financial burden on the Municipality, with its limited staff capacity and finances. The vastness of the municipal footprint demands a duplication of all services throughout the area and poses to be a welloiled machine due to strict adherence to planning and implementation schedules. The following infrastructure presently exist: sport grounds for rugby, soccer and netball in Swellemdan, Barrydale, Suurbraak, Buffelsjagsriver and cricket pitch. Community Halls are the Swellendam Town Hall, Railton Community Hall, Suurbraak Community Hall, Buffeljags River Community Hall and Barrydale Community Hall. The Municipality is also responsible for maintaining community parks throughout the area and the Swellendam Caravan Park is in the process of being upgraded and beautified. a) Highlights: Sport and Recreation The table below specifies the highlights for the year: Highlights Railton Sportfield under construction Description Upgrading of facility is in progress and will be finalised during the 2017/18 financial year Sport and Recreation Highlights b) Challenges: Sport and Recreation The table below specifies the challenges for the year: Description Ability of facilities to cater for all sporting codes Actions to address Apply for MIG and other funding sources in order to ensure facilities can cater for all sporting codes Sport and Recreation Challenges 65
66 c) Employees: Parks and Recreation The following table indicates the staff composition for this division: Employees: Parks and Recreation 2016/17 Job Level Posts Employees Vacancies (fulltime equivalents) Vacancies (as a % of total posts) No. No. No. % P.T.I Total Employees and Posts numbers are as at 30 June P.T.I. personal to incumbent Employees: Parks and Recreation d) Capital: Sport and Recreation The following table indicates the capital expenditure for this division: Capital Project Shelter Sport grounds Buffeljags River Railton - Upgrade Sport Stadium Railton - Upgrade Sport Stadium Phase 2 Budget Capital Expenditure 2016/17: Sport and Recreation R'000 Adjustment Budget 2016/17 Actual Expenditure Variance from Adjustment Budget Total Project Value Total Total project value represents the estimated cost of the project on approval by Council Capital Expenditure: Sport and Recreation 66
67 C O M P O N E N T H : C O R P O R A T E P O L I C Y O F F I C E S A N D O T H E R S E R V I C E S This component includes: executive and council; financial services; human resource services; ICT services; legal services; and procurement services Executive and Council This component includes: Executive Office (Mayor; councillors; and Municipal Manager). The Council consists of 11 councillors, including the Executive Mayor, Deputy Executive Mayor and Speaker as determined by the MEC for Local Government in the Western Cape. It is a category B municipality with a mayoral executive system combined with a ward participatory system as provided for in the Western Cape Determination of Types of Municipalities Act, In terms of Section 57 of the Municipal Structures Act, 1998 (Act no 117 of 1998) the Municipal Council elects an Executive Mayor and Deputy Executive Mayor. The Executive Mayor is entitled to receive reports from council committees and to forward it to Council with a recommendation, or dispose of the matter in terms of his delegated powers. a) Highlights: Executive and Council The table below specifies the highlights for the year: Highlights Office Bearers and Committees Senior managers Councillor training Ward committees Description The Office Bearers and Committees were successfully established in August 2016 soon after the General Local Government Elections. All senior manager positions were filled for the entire financial year. No positions became vacant A number of training sessions were done for councillors by SALGA and by the Provincial Government The election process of the ward committees was successfully completed and all 6 ward committees elected. A number of training sessions were done for ward committee members Executive and Council Highlights b) Challenges: Executive and Council The table below specifies the challenges for the year: Description Functionality of Municipal Public Accounts Committee (MPAC) Recruitment of Municipal Manager Transgression of the code of conduct Actions to address The MPAC has not met since the new council was elected. The Chairperson was not satisfied with the compilation and the fact that the Chairperson will not be additionally remunerated. The Oversight report was referred directly to the Mayoral Committee and Council The position of Municipal Manager has been advertised for filling in the ensuing financial year but as no suitable candidates could be appointed the position will be re-advertised A number of councillors were found guilty on charges of transgression 67
68 Description Actions to address of the code of conduct. They repeatedly disrupted Council and committee meetings Executive and Council Challenges c) Employees: Executive and Council The following table indicates the staff composition for this division: Job Level Posts Employees: Executive and Council Employees 2016/17 Vacancies (fulltime equivalents) Vacancies (as a % of total posts) No. No. No. % P.T.I MM & Directors Total P.T.I. personal to incumbent (Personal Assistants of Mayor and Deputy-Mayor) Employees and Posts numbers are as at 30 June Employees: Executive and Council Financial Services a) Introduction to Financial Services Sound financial management practises are essential for municipalities. The major challenge for municipalities is long term financial sustainability. The MFMA aims at directing municipalities in a sustainable financial environment and to modernise financial management practices. The act places municipalities on a financially sustainable footing and supports co-operative government between all spheres of government. Successful implementation of the provisions of the act will maximise the capacity of municipalities to deliver services to their residents, users and customers. It is critical for the Municipality to review how we conduct our business to ensure that value for money is obtained in all our expenditures, that revenue administration systems are operating effectively, and that creditors (including bulk service providers) continue to be paid timeously and in full. 68
69 b) Highlights: Financial Services The table below specifies the highlights for the year: Highlights Description Clean audit Received second clean audit 2015/16 Payment percentage The fourth year the payment percentage exceeding 99% Cash flow Improvement of the cash flow situation of the Council Financial Services Highlights d) Employees: Financial Services The following table indicates the staff composition for this division: Job Level Posts Employees: Financial Services Employees 2016/17 Vacancies (fulltime equivalents) Vacancies (as a % of total posts) No. No. No. % P.T.I Total Employees and Posts numbers are as at 30 June P.T.I. personal to incumbent Employees: Financial Services Human Resource Services a) Introduction to Human Resource Services The broader objectives of the Human Resource Services division of the Municipality are to ensure that: The appropriate staff members are recruited and appointed Staff members are optimally placed in relation to the needs of the organisation An environment is created conducive of staff performing their functions in line with their knowledge, experience and skills 69
70 Staff members are adequately compensated and that their vested interests and benefits are professionally administered Staff members are allowed the opportunity to develop and be promoted in a physical environment that is free from safety, health and psychological hazards An organisational design is implemented that promotes productivity and sustains high levels of morale and ethical behavior A culture of discipline, equally, transparency and fairness is promoted in the workplace The organisation is free from all forms of discrimination and prejudice In order to achieve these broader objectives, the Human Resource Services is organized in a manner to respond to the following functions: Organisational efficiency and improvement Staffing in relation to recruitment, selection and appointments Administration of employee benefits Skills development and training Occupational health and safety Labour relations Employee wellness (EAP) Performance management Employment equity Change Management Statistics and Reporting Organisational Efficiency and Improvement This function endeavors to develop, implement and maintain a structure that is effective and can maintain the organisational and individual productivity required for efficient service delivery to the community. The review of the organisational structure of the Swellendam Municipality and the identification and filling of critical posts were key areas for consultation with the two unions at the Local Labour Forum (LLF) and at various other management forums over the past four years. This process has started in all earnest when PWC was awarded a tender in May 2013 to do a Structure Review and to draft corresponding job descriptions for all employees in the Task- format. Job descriptions were issued to all employees after they were placed on the new organisational structure and the evaluation of posts by an Overberg Task Job Evaluation Committee started in the second semester of The process was completed and implemented in July 2016 after the Provincial Task-Audit Committee (PAC) recommends the audited results for final approval by the Municipal Manager. Each staff member now has a post on the organisational structure and a TASK-evaluated job description. Staff members who feel unhappy with the process or the evaluation results, can request a re-evaluation that must be motivated 70
71 by his/her manager/director and approved by the Municipal Manager. Human Resource Services will continue to offer advice, support and manage this process. Staffing Function It is evident from the employment statistics below that a number of new appointments were made during the past year. Human Resources reports on vacant posts and the filling thereof on a monthly basis at the Corporate Portfolio Committee. Changes to the Employment Policy allowed councillors to be represented on selection panels. Some of the challenges that remain unresolved include: possible political influence over the selection of staff the scarcity of local candidates with appropriate skills to fill vacant posts the ever-increasing costs to appoint candidates with relevant qualifications and experience the costs of advertising and the additional cost that relocation of new staff can bring about the shortage of candidates meeting the equity profile who apply for vacant posts The focus of this function remains the filling of posts which are directly related to service delivery and legal compliance in the context of the Employment Equity Plan Three financial interns are in the system. Their general conditions of employment were set out in the MFMA and the guidelines supplied by the National Treasury. The Internship Programme is funded by the National Treasury. These contracts continue to provide much needed capacity to the Finance Department of Swellendam Municipality while they are accumulating valuable experience. During the year under review, seven students who are doing their Work Integrated Learning (WIL) were placed in different departments. These students have all completed their N6 Theory at a Technical and Vocational Education and Training (TVET) college and must do 18 months practical in order to obtain their national diplomas. Whilst we offer these students the platform to gain valuable practical experience, they provide the Municipality with much needed administrative and clerical skills. These students are part of the WIL-project funded by the LGSETA and are paid a monthly stipend of R1 500 to cover their transport and accommodation. In addition to the above, Human Resources also placed four Cape Peninsula University of Technology (CPUT) students for periods ranging from three to six months in the town planning, waste water and supply chain departments. The Human Resources Services also administers the Expanded Public Works Programme (EPWP) which is funded by the national and provincial government. During the period 1 July 2016 to March 2016 alone, 245 work opportunities were offered on short term contracts which ranged between 3 to 6 months on average. The salary payments and benefits of the EPWP employees are administered through the same systems as that of the permanent staff and they receive similar rights and benefits to ensure that they are not in any way discriminated against or disadvantaged. This programme is a powerful 71
72 mechanism to alleviate unemployment in this municipal area and offer participant short term financial relief during trying times. Administration of Employee Benefits The administration of the various types of leave and benefits is done on SAMRAS-software. During the past financial year, further progress was made in this functional area. All leave is now captured and stored electronically. Information or leave status reports can now be generated when required. It is envisaged that the number of leave days available to employees will in future be printed on monthly pay-slips, as soon as the payroll- and leave systems are synchronized. This function meets all the legal requirements and that the staff is the beneficiaries of this improved user-friendly system. The following claims were successfully settled during the period under review: Death claim of a staff members who died while in the employment of the Municipality was finalized successfully Four retirement/pension payouts were finalized Awareness sessions to explain the benefit structures of both medical aid schemes and retirement funds were held regularly and forms part of a compulsory induction session for new employees. Skills Development and Training The Municipality has an obligation in terms of the Skills Development Act, 97 of 1998, to develop its employees by providing training and development opportunities for them. A workplace skills plan (WSP) which outlines the needs with regards to training and skills development was submitted before the due date of 31 April The biggest challenges facing this function remain: LGSETA is inconsistent and functions irresponsive to the needs of municipalities The Western Cape office is hampered due to capacity problems and cannot manage its workload in a manner that will offer better and more support to municipalities in rural areas Locally, there is still no dedicated municipal official to handle this function and tasks are shared among already overstretched officials in the HR-department There is a very limited internal budget available for training and development LGSETA funds are conditional to volumes of paperwork and bureaucratic processes with endless delays and uncertainties Despite the challenges, during the period under review, the following courses where offered: Name of Course Name of Service Provider Number of Learners Computer Course Swellendam E-Learner Centre 18 Introduction to Middle Management Western Cape Provincial Training Institute 6 Task Job Evaluation SALGA 1 72
73 Name of Course Name of Service Provider Number of Learners Records Management Course Western Cape Government 4 Public Sector Risk Management Department National Treasury 2 Municipal Finance Management Act, No56 of 2003 (MFMA) National Treasury 2 Supply Chain Management Stellenbosch University 2 Electrical Belcomec Training 5 Plumber Belcomec Training 2 Bruschcutter Training Room to Grow Business Skills and Landscape Training 10 E-Natis Drivers Course TASIMA 9 ArcGIS Basic ESRI 1 Project Management Workshop Community Chest 2 Ethics in the Workplace Progressive Concepts cc 7 Marketing of Public Library Services Dr Gavin Davis 4 Cataloguing Marilyn McIntosh 3 Read Readiness Workshop WCED 6 Advance Slims Training Provincial Library Services 20 MMC Stellenbosch University 23 MMC Pretoria University 3 Water and Wastewater Treatment Process Control NQF Level 04 Water Governance for Water Leaders (Skills Programme) LGSETA 5 Stellenbosch University (EWSETA) 1 ORHVS Level 4 ESKOM 7 Horticulture Learnership NQF Level 02 Boland Agri Training & Community Development Centre (LGSETA) LGAC Learnership BL2000CC (Ceres) BL2000CC (LGSETA) 3 OD ETDP Certificate Africa Competency (LGSETA) 1 LGAAC Learnership Deloitte (LGSETA) 2 BC Landscaping Training Room to Grow Business Skills (LGSETA) 5 Training 2016/17 The academic knowledge that these qualifications offer in the fields of financial management, strategic governance, ethics and legislation, will go a long way to better equip officials to understand the challenges in local government and to offer fresh and different solutions to overcome them. The supervisory courses at junior and middle management also contribute significantly to the management of staff, assets and operational budgets. Supervisors are now better equipped to fulfill their tasks and to ensure that all resources are utilized to the maximum and that waste is minimized. All these courses are linked to priority areas in the spectrum of 5 73
74 services that the Municipality must deliver to its constituency. Improved knowledge and understanding will inevitably enhance the outcomes of the service delivery process. Occupational Health and Safety The Occupational Health and Safety Act (85 of 1993) and the Compensation for Occupational Injuries and Diseases Act (130/1993) govern this field in South Africa. The first law intends to protect employees against accidents and diseases and the second set procedures in place to compensate employees who suffered injury or contracted diseases when control measures fail. Both these laws have stiff penalties and even prison sentences when it is proven that the employer was negligent or deliberately ignored his duties and responsibilities as outlined in these laws. The Municipality made consistent efforts during the year under review to meet its legal obligations in terms of these laws. A service provider was appointed through the SCM procedures to maintain and upgrade the fire equipment at the municipal buildings. This will be an ongoing process subjected to the availability of funds. Quarterly Health and Safety Committee Meetings are held and the Health and Safety Representatives are actively involved in all aspects. Health and Safety Inspections Reports of the different departments and the Injury on Duty Reports are tabled at these meetings for monitoring and discussion. All the Health and Safety Representatives will again receive formal training in first aid and on how to perform health and safety functions in a professional manner. The minutes of the Health and Safety Committee is tabled for discussion at LLF meetings and issues raised are taken up with the relevant line management to ensure that corrective action is taken. Departmental Health and Safety Committees in the Engineering Services Directorate also meet regularly to discuss and identify risks in their environments and have toolbox talks. The personnel of the waste-removal section had a special meeting to address their concerns and needs, due to their unique working conditions. The EPIP project started in January 2017 and will address the health and safety issues at the Swellendam dumpsite which was a big concern of the Municipality, staff and the community. All the current health and safety policies will be reviewed in the next financial year to ensure that health and safety legislation are adhered to. The number of injuries on duty and the causes thereof is monitored and these statistics are made available to the health and safety committee and the LLF. Labour Relations All labour relations administration matters are dealt with in accordance with the relevant collective agreements and applicable legislation. The Department is promoting and maintaining sound labour relations by rendering appropriate advice and guidance on labour relation matters to managers, supervisors and employees, as well as consulting with unions on matters of interest, when required. This professional manner in which labour relations are dealt with contributes to the building of relationships amongst all levels of employees and most importantly the trust relationship between the Municipality as employer, and the employees. Workshops with employees on the Code of Ethics, Code on Conduct and Discipline in the workplace and an Anti-Corruption 74
75 Campaign were held in all towns and departments. The workshops ensure that employees are updated with all new policies, procedures and employees get the opportunity to give input in this regard. The functionality of the LLF ensures continues deliberation on matters of mutual interest between the Municipality and organised labour. The forum meets monthly and parties are focused on resolving issues. The training and development of employees, occupational health and safety and the consultation of new and revised policies are standing items on the agenda of the LLF due to the fact that these items has a direct impact on the organisation and the functionality of employees. The department has a very high success rate with regard to the handling of disciplinary cases, appeals, grievances and subsequent disputes emanating there from. The success is due to the fact that disputes are dealt with in a procedurally and substantively fair manner. All labour relations matters that effects the maintenance and application of discipline in the workplace are dealt with through procedural means to ensure fair play, resolving problems and conflict as quickly as possible and to be consistent. Employee Wellness Even with the advent of technology, human beings are still by far the most valuable asset of most workplaces. Employees in the Municipality, often work under tremendous conditions, interfacing with the community, whilst confronted by their own personal challenges. Therefor an employer offers support and assistance to employees on a humanitarian and moral ground. Most adults spend more of their waking hours at work than anywhere else, making it a prime venue for promoting healthful habits. The worksite organizational culture and environment are powerful influences on human behavior and must be put to use as a means of assisting employees to adopt a healthier lifestyle. In the light of the financial constraints facing the Municipality, it is at present not possible to have a fully-fledged programme with dedicated official/s to deal with vulnerable employees or their families that are: Stressed and depressed due to work or personal situation Dependent on drugs / alcohol Experience trauma like divorce, domestic violence or death of family Diagnosed with chronic and live threatening disease Despite the above-mentioned fact, the Human Resource Department continues to coordinate support for employees in distress. Counseling sessions were done with employees whose personal circumstances affect their work performance negatively. The employee s spouses and their union representatives were involved in these sessions and the outcomes are very positive. 75
76 The Human Resources Department organised an awareness program on HIV/AIDS, TB and the effect of alcohol and drugs in the workplace. The program was held with the support of the department of health and employees were given the opportunity to be voluntary tested for various diseases. The program was well attended by the staff and they actively took part in the interactive sessions. The Human Resources Department will focus on similar interventions as well as life skills programs in the following year. Employment Equity The Employment Equity Plan (EEP) must be taken into consideration when posts are filled and race classification, gender and disability status must be in line with the goal set for the specific occupational level in which the vacant post falls. A new EEP was drawn up and was finalized in December The formulation process was done in full consultation with all the stakeholders, including the two unions. A number of awareness sessions were arranged to highlight the importance and purpose of the EEP 2016/2018 before it was submitted to the LLF for final approval. Annual Employment Equity Reports will be submitted to the Department Labour in January of each year to report on progress. The main challenges regarding the equity profile of the municipality include: The low application rate of candidates meeting the equity profile The poor quality of applications from target groups High cost of living in Swellendam to attract persons in target groups Lack of rental properties to accommodate candidates who would like to move to Swellendam from the target groups. Change Management A popular definition of change management reads as follows: Change management is the process, tools and techniques to manage the people-side of business change to achieve the required business outcome and to realize that business change effectively within the social infrastructure of the workplace. From the above it is clear that change management consists of efforts that aim to change or redirect human perceptions, attitudes and actions to achieve improved organisational and /or individual performance. In many respects, Human Resources is the best positioned to play this role to bring about new though in the way we manage and utilize our organisational and human resources. In harmony with other departments it continuously strives to bring about innovative and creative ways to maximize service delivery to the community whilst minimizing labour and organisational costs. Reporting and Provision of Statistical Data This has now become a fully-fledged function that demand dedicated time and energy from Human Resources. Monthly, quarterly, semester and annual reports to COGTA, National and Provincial Government and National and Provincial Treasury has become the order of the day. Often different government departments request the same information in different formats or templates. This function also put pressure on the software to provide faster and more accurate statistics more 76
77 often. We can only hope that a more standardized approach will be followed in future by those seeking information from municipalities in order to ease the pressure on Human Resource staff and resources. b) Employees: Human Resource Services The following table indicates the staff composition for this division: Job Level Posts Employees: Human Resource Services Employees 2016/17 Vacancies (fulltime equivalents) Vacancies (as a % of total posts) No. No. No. % Total c) Employees: Office Cleaners and Messengers Employees and Posts numbers are as at 30 June The following table indicates the staff composition for this division: Employees: Human Resource Services Job Level Posts Employees: Office Cleaners and Messengers Employees 2016/17 Vacancies (fulltime equivalents) Vacancies (as a % of total posts) No. No. No. % P.T.I.*
78 Job Level Posts Employees: Office Cleaners and Messengers Employees 2016/17 Vacancies (fulltime equivalents) Vacancies (as a % of total posts) No. No. No. % Total *P.T.I. personal to incumbent Employees and Posts numbers are as at 30 June Employees: Office Cleaners and Messengers Procurement Services a) Highlights: Procurement Services The table below specifies the highlights for the year: Bid Committee System Internal control Delegations Record keeping Highlights Description Improved and functional bid committee system in place Improved internal controls SCM delegations developed Improved record keeping and document control Procurement Services Highlights b) Challenges: Procurement Services The table below specifies the challenges for the year: Description Lack of planning and linking demand to the budget Too much decentralised procurement Inadequate contract management and administration Reporting Standard Operating Procedures Improve procurement planning Centralise procurement Actions to address Contracts should be monitored, expenditure on contracts should be reported, unfair amendments or variations must be avoided and the contract register improved Improve reporting by creating more reliable data Develop standard operating procedures to create institutional memory Procurement Services Challenges 78
79 c) Service Statistics for Procurement Services The table below specifies the service statistics for the year: Description Total Monthly Average Daily Average Requests processed Orders processed Requests cancelled or referred back Extensions Bids received (number of documents) Bids awarded Bids awarded R Appeals registered Successful Appeals Service Statistics for Procurement Division d) Details of Deviations for Procurement Services Type of deviation Value of deviations (R) Percentage of total deviations value (%) Value of deviations (R) Percentage of total deviations value (%) 2015/ /17 Clause 36(1)(a)(i)- Emergency Clause 36(1)(a)(ii)- Sole Supplier Clause 36(1)(a)(v)- Impractical / impossible Clause 36(1)(b) - Minor breaches Total Statistics of Deviations from the SCM Policy 79
80 C O M P O N E N T I : S E R V I C E D E L I V E R Y P R I O R I T I E S F O R /18 The main development and service delivery priorities for 2017/18 forms part of the Municipality s top layer SDBIP for 2017/18 and are indicated in the table below as per strategic objective: To create a capacitated, people-centered institution Ref KPI Unit of Measurement Wards TL18 TL19 TL20 The number of people from employment equity target groups employed in the three highest levels of management in compliance with the equity plan The percentage of the municipality's personnel budget actually spent on implementing its workplace skills plan by 30 June 2018 [(Actual amount spent on training/total operational budget)x100] Limit quarterly vacancy rate to less than 30% of funded posts [(Number of funded posts vacant / number of funded posts) x100] Annual Target Number of people employed All 2 % of the personnel budget spent on implementing the workplace skills plan by 30 June 2018 All 0.10% % quarterly vacancy rate All 30% Service Delivery Priorities for 2017/18 - To create a capacitated, people-centered institution To create a safe and healthy living environment Ref KPI Unit of Measurement Wards TL26 TL27 Complete Phase 2 of the Railton Sports Stadium upgrade by 30 June 2018 Review the Disaster Mangement Policy by 31 March 2018 Phase 2 of the Railton Sports Facility upgrade completed by 30 June 2018 Disaster Management Policy reviewed by 31 March 2018 Services Delivery Priorities for 2017/18 - To create a safe and healthy living environment Annual Target 4; 5 1 All To enhance access to basic services and address maintenance backlogs TL1 Ref KPI Unit of Measurement Wards TL2 Number of formal residential properties that receive piped water that is connected to the municipal water infrastructure network as at 30 June 2018 Number of formal residential properties connected to the municipal electrical infrastructure network (credit and prepaid electrical metering)(excluding Eskom areas) as at 30 June 2018 Number of residential properties which are billed for water or have pre paid meters as at 30 June 2018 Number of residential properties which are billed for electricity or have pre paid meters (Excluding Eskom areas) as at 30 June 2018 Annual Target All 6,138 All 6,128 80
81 Ref KPI Unit of Measurement Wards TL3 TL4 TL5 TL6 TL7 TL8 TL9 TL14 TL15 TL28 TL29 TL30 TL31 Number of formal residential properties connected to the municipal waste water sanitation/sewerage network for sewerage service, irrespective of the number of water closets (toilets) as at 30 June 2018 Number of formal residential properties for which refuse is removed once per week as at 30 June 2018 Provide 6kl free basic water to indigent households in terms of the approved indigent policy Provide 50kwh free basic electricity to indigent households in terms of the approved indigent policy Provide 20kwh free basic electricity to indigent households in terms of the approved indigent policy Provide free basic sanitation to indigent households in terms of the approved indigent policy Provide free basic refuse removal to indigent households in terms of the approved indigent policy Limit unaccounted for water to less than 30% by 30 June 2018 {(Number of Kilolitres Water Purchased or Purified - Number of Kilolitres Water Sold) / Number of Kilolitres Water Purchased or Purified 100} Limit unaccounted for electricity to less than 15% by 30 June 2018 {(Number of Electricity Units Purchased and/or Generated - Number of Electricity Units Sold) / Number of Electricity Units Purchased and/or Generated) 100} 90% of the roads and storm water maintenance budget spent by 30 June 2018 {(Actual expenditure on maintenance divided by the total approved maintenance budget)x100} 90% of the electricity maintenance budget spent by 30 June 2018 {(Actual expenditure on maintenance divided by the total approved maintenance budget)x100} 90% of the waste water maintenance budget spent by 30 June 2018 {(Actual expenditure on maintenance divided by the total approved maintenance budget)x100} 90% of the water maintenance budget spent by 30 June 2018 {(Actual expenditure on maintenance divided by the total approved Number of residential properties which are billed for sewerage as at 30 June 2018 Number of residential properties which are billed for refuse removal as at 30 June 2018 Number of indigent households receiving free basic water Number of indigent households receiving free basic electricity Number of indigent households receiving free basic electricity Number of indigent households receiving free basic sanitation Number of indigent households receiving free basic refuse removal Annual Target All 6,087 All 6,123 All 1,880 All 1,755 All 125 All 1,880 All 1,880 % unaccounted for water by 30 June 2018 All 30% % unaccounted for electricity by 30 June 2018 All 15% % of the maintenance budget spent by 30 June 2018 % of the maintenance budget spent by 30 June 2018 % of the maintenance budget spent by 30 June 2018 % of the maintenance budget spent by 30 June 2018 All 90% All 90% All 90% All 90% 81
82 Ref KPI Unit of Measurement Wards TL32 TL33 TL34 TL36 TL37 TL38 TL39 TL40 TL41 maintenance budget)x100} 90% of the refuse maintenance budget spent by 30 June 2018 {(Actual expenditure on maintenance divided by the total approved maintenance budget)x100} 85% microbiological quality level achieved for water as per SANS % physical quality level achieved for water as per SANS 241 Upgrade Suurbraak water purification and reservoir by 31 December 2017 Upgrade the Barrydale bulk water Infrastructure by 31 October 2017 Upgrade Suurbraak Waste Water Treatment Works by 31 March 2018 Complete the Upgrading of Phase 2 Railton gravel roads and stormwater channels of the MIG funding by 30 June % spent of the capital budget allocated for the Upgrade of the protection for the Swellendam main substation, by 30 June 2018 Spend 95% of the capital budget allocated for the purchase and Install Street lights by 30 June 2018 % of the maintenance budget spent by 30 June 2018 % microbiological water quality level achieved as per SANS 241 criteria % physical water quality level achieved as per SANS 241 criteria Number of Suurbraak water purification and reservoirs upgraded by 31 December 2017 Annual Target All 90% All 85% All 85% 3 1 Number of upgrades completed 2 1 Upgrade completed by 31 March Upgrading of Phase 2 Railton gravel roads and stormwater channels by 30 June ; 5 1 % of budget spent All 95% % of budget spent 2; 3; 4; 5 95 Services Delivery Priorities for 2017/18 - To enhance access to basic services and address maintenance backlogs To enhance economic development with focus on both first and second economies Ref KPI Unit of Measurement Wards TL35 Create temporary work opportunities in terms of EPWP by 30 June 2018 Number of temporary works created by 30 June 2018 Annual Target All 176 Services Delivery Priorities for 2017/18 - To enhance economic development with focus on both first and second economies To improve financial viability and management Ref KPI Unit of Measurement Wards TL10 The percentage of a municipality s capital budget actually spent by 30 June 2018[(Amount actually spent on capital projects/ Amount budgeted for capital projects)x100] (Amount actually spent on capital projects/ Amount budgeted for capital projects)x100 Annual Target All 80% 82
83 TL11 TL12 TL13 TL16 Financial viability measured in terms of the municipality's ability to meet it's service debt obligations as at 30 June 2018 ((Short Term Borrowing + Bank Overdraft + Short Term Lease + Long Term Borrowing + Long Term Lease) / Total Operating Revenue - Operating Conditional Grant) Financial viability measured in terms of the outstanding service debtors as at 30 June 2018 (Total outstanding service debtors/ revenue received for services) Financial viability measured in terms of the available cash to cover fixed operating expenditure as at 30 June 2018 ((Cash and Cash Equivalents - Unspent Conditional Grants - Overdraft) + Short Term Investment) / Monthly Fixed Operational Expenditure excluding (Depreciation, Amortisation, and Provision for Bad Debts, Impairment and Loss on Disposal of Assets)) Achieve a debtors payment percentage of 95% by 30 June 2018 ((Gross Debtors Closing Balance + Billed Revenue - Gross Debtors Opening Balance + Bad Debts Written Off)/Billed Revenue) x 100 Debt to Revenue as at 30 June 2018 All 25.30% Service debtors to revenue as at 30 June 2018 All 18% Cost coverage as at 30 June 2018 All 1.8 Debtors payment percentage as at 30 June 2018 All 95% TL17 Approve an action plan to address all the issues raised in the management letter of the Auditor General by 31 December 2017 Approved action plan by 31 December 2017 by MM All 1 Service Delivery Priorities for 201/18 - To improve financial viability and management To promote good governance and community participation Ref KPI Unit of Measurement Wards TL21 TL22 TL23 TL24 TL25 Oversee the draft annual report i.t.o. the MFMA and submit to Council by 31 January 2018 Review the Policy on Municipal property Management by 28 February 2018 Complete the annual risk assessment and submit to the audit committee by 30 June 2018 Compile the Risk Based Audit Plan (RBAP) and submit to the Audit Committee by 30 June % of the RBAP for 2017/18 implemented by end June 2018 [(Number of audits and tasks completed for the period/ Number of audits and tasks identified in the RBAP )x100] Draft report submitted to Council by 31 January 2018 Municipal Property Management by 30 October 2017 Completed risk assessment submitted to audit committee by 30 June 2018 RBAP submitted to the Audit Committee by 30 June 2018 Annual Target All 1 All 1 All 1 All 1 % of the RBAP implemented All 90% Service Delivery Priorities for 2017/18 - To promote good governance and community participation 83
84 CHAPTER N a t i o n a l K e y P e r f o r m a n c e I n d i c a t o r s M u n i c i p a l T r a n s f o r m a t i o n a n d O r g a n i s a t i o n a l D e v e l o p m e n t The following table indicates the municipality s performance in terms of the National Key Performance Indicators required in terms of the Local Government: Municipal Planning and the Performance Management Regulations of 2001 and section 43 of the MSA. These key performance indicators are linked to the National Key Performance Area Municipal Transformation and Organisational Development. KPA & Indicators The percentage of a municipality s budget actually spent on implementing its workplace skills plan Municipal Achievement Municipal Achievement 2015/ / % 0.1% National KPIs Municipal Transformation and Organisational Development 4. 2 I n t r o d u c t i o n t o t h e M u n i c i p a l W o r k f o r c e The Municipality currently employs 546 (excluding non-permanent positions) officials, who individually and collectively contribute to the achievement of municipality s objectives. The primary objective of Human Resource Management is to render an innovative HR service that addresses both skills development and an administrative function Employment Equity The Employment Equity Act (1998) Chapter 3, Section 15 (1) states that affirmative action measures are measures designed to ensure that suitable qualified people from designated groups have equal employment opportunities and are equitably represented in all occupational categories and levels in the workforce of a designated employer. The national performance indicator also refers to: Number of people from employment equity target groups employed in the three highest levels of management in compliance with a municipality s approved employment equity plan. 84
85 a) Employment Equity vs. Population The table below indicates the employment equity vs. population: Description African Coloured Indian White Total Population numbers % Population Number for positions filled % for Positions filled EE Population 2016/17 b) Specific Occupational Categories - Race The table below indicates the number of employees by race within the specific occupational categories: Race Occupational Levels A C I W Total Legislators, senior officials and managers Professionals Clerical and Administrative Workers Service and sales workers Craft and related trades workers Plant and machine operators and assemblers Elementary occupations Total Occupational Categories c) Specific Occupational Levels - Race The table below categories the number of employees by race within the occupational levels: Occupational Levels Race A C I W Top Management Senior management Professionally qualified and experienced specialists and mid- management Skilled technical and academically qualified workers, junior management, supervisors, foremen and superintendents Total Semi-skilled and discretionary decision making Unskilled and defined decision making
86 Race Occupational Levels A C I W Total Total Occupational Levels d) Departments - Race The following table categories the number of employees by race within the different departments: Department Male Female A C I W A C I W Total Municipal Manager Corporate Services Financial Services Community Services Engineering Services Total Department - Race Vacancy Rate The approved organogram for the municipality had 392 posts at the end of the 2016/17 financial year. The actual positions filled are indicated in the tables below by post level and by functional level. 135 Posts were vacant at the end of 2016/17, resulting in a vacancy rate of 34.4%. Below is a table that indicates the vacancies (as per organogram) within the municipality: Per Post Level Post level Filled Vacant MM & MSA section 57 & T19 - T T12 T T3 T Personal-to-incumbent 38 2 Total Per Functional Level Functional area Filled Vacant Municipal Manager 7 7 Corporate Services
87 Per Post Level Post level Filled Vacant Financial Services Community Services Engineering Services Total Vacancy Rate per Post and Functional Level The table below indicates the number of staff per level expressed as total positions and current vacancies express as fulltime staff equivalents: Salary Level Number of current critical vacancies Vacancy job title Municipal Manager 0 n/a Chief Financial Officer 0 n/a Other Section 57 Managers 0 n/a Senior / Middle Management (T14-T19) 3 Highly skilled supervision (T4-T13) 5 Manager: Revenue Manager: Administrative Support Manager: Project Management Artisan Plumber (x2) Learner Works Operator (Sewerage) Senior Building Inspector Foreman Parks Vacancy Rate per Salary Level 4. 3 M a n a g i n g t h e M u n i c i p a l W o r k f o r c e Managing the municipal workforce refers to analyzing and coordinating employee behavior Injuries An occupational injury is a personal injury, disease or death resulting from an occupational accident. Compensation claims for such occupational injuries are calculated according to the seriousness of the injury/disease and can be costly to a municipality. Occupational injury will influence the loss of man hours and therefore financial and productivity performance. The injury rate shows a slight increase for the 2016/17 financial year to 53 employees injured against 46 employees in the 2015/16 financial year. 87
88 The table below indicates the total number of injuries within the different directorates: Directorates 2015/ /17 Municipal Manager 0 0 Corporate Services 0 0 Financial Services 2 1 Community Services Engineering Services Sub total Contract personnel: EPWP Total Injuries Sick Leave The number of day s sick leave taken by employees has service delivery and cost implications. The monitoring of sick leave identifies certain patterns or trends. Once these patterns are identified, corrective action can be taken. The total number of employees that have taken sick leave during the 2016/17 financial year shows an increase when compared to the 2015/16 financial year. The 3-year sick leave cycle started on 1 January The table below indicates the total number of sick leave days taken within the different directorates: Department 2015/ /17 Municipal Manager Corporate Services Financial Services Community Services Engineering Services Total Sick Leave 4. 4 C a p a c i t a t i n g t h e M u n i c i p a l W o r k f o r c e Section 68(1) of the MSA states that municipality must develop its human resource capacity to a level that enables it to perform its functions and exercise its powers in an economical, effective, efficient and accountable way. For this purpose the human resource capacity of a municipality must comply with the Skills Development Act (SDA), 1998 (Act No. 81 of 1998), and the Skills Development Levies Act, (Act No. 28 of 1999). 88
89 4.4.1 Skills Matrix The table below indicates the number of employees that received training (skills programs, short courses, etc.) in the year under review: Department Male Female A C I W A C I W Total Legislators, senior officials and managers Professionals Technicians and associate professionals Clerks Service and sales workers Craft and related trades workers Plant and machine operators and assemblers Elementary occupations Total Skills Matrix Skills Development - Budget Allocation The table below indicates that a total amount of R94 930ere allocated to the workplace skills plan and that 16.29% of the total amount was spent in the 2016/17 financial year: Year Total personnel budget Total Allocated Total Spend % Spent 2015/16 R R R /17 R R R Budget Allocated and Spent for Skills Development Municipal Minimum Competency Course Status In terms of Section 83 (1) of the MFMA, the accounting officer, senior managers, the chief financial officer, non-financial managers and other financial officials of a municipality must meet the prescribed financial management competency levels that are key to the successful implementation of the Municipal Finance Management Act. National Treasury has prescribed such financial management competencies in Government Notice 493 dated 15 June To assist the above-mentioned officials to acquire the prescribed financial competencies, National Treasury, with the collaboration of various stakeholders and role players in the local government sphere, developed an outcomes-based NQF 89
90 Level 6 qualification in municipal finance management. In terms of the Government Notice 493 of 15 June 2007, (1) No municipality or municipal entity may, with effect 1 January 2013 (exempted until 30 September 2015 as per Government Notice No. 179 of 14 March 2014), employ a person as a financial official if that person does not meet the competency levels prescribed for the relevant position in terms of these Regulations. Swellendam Municipality must send officials on the Municipal Minimum Competency (MMC) course in terms of National Treasury Regulations. The MMC -training course consists of 15 modules for most candidates and the status of the process at the end of the financial year 2013 is as follows: Description Total number of officials employed by municipality (Regulation 14(4)(a) and (c)) Competency assessments completed (Regulation 14(4)(b) and (d)) Financial Officials Total number of officials whose performance agreements comply with Regulation 16 (Regulation 14(4)(f)) Total number of officials that meet prescribed competency levels (Regulation 14(4)(e)) Accounting officer Chief financial officer Senior managers Any other financial officials Heads of supply chain management units Supply chain management senior managers Supply Chain Management Officials Total MMC Course Status 4. 5 M a n a g i n g t h e M u n i c i p a l W o r k f o r c e E x p e n d i t u r e Section 66 of the MSA states that the accounting officer of a municipality must report to the Council on all expenditure incurred by the Municipality on staff salaries, wages, allowances and benefits. This is in line with the requirements of the Public Service Regulations, (2002), as well as National Treasury Budget and Reporting Regulations SA22 and SA23. 90
91 4.5.1 Personnel Expenditure The percentage personnel expenditure is essential in the budgeting process as it reflects on current and future efficiency. The table below indicates the percentage of the municipal budget that was spent on salaries and allowance for the past two financial years and that the Municipality is well within the national norm of between 35 to 40%: Financial year Total Expenditure salary and allowances Total Operating Expenditure R 000 R 000 Percentage 2015/ / Personnel Expenditure Below is a summary of Councilor and staff benefits for the year under review: Financial year 2015/ /17 Description Actual Original Budget Adjusted Budget Actual R R R R Councillors (Political Office Bearers plus Other) All inclusive package Sub Total % increase/ (decrease) -2.01% 41.34% -9.67% -6.15% Senior Managers of the Municipality Basic Salaries Pension Contributions Medical Aid Contributions Motor vehicle allowance Cell phone allowance Housing allowance Performance Bonus Other benefits or allowances In-kind benefits Sub Total % increase/ decrease 0.72% 5.24% 0% 11.28% Other Municipal Staff Basic Salaries and Wages Pension Contributions Medical Aid Contributions
92 Financial year 2015/ /17 Description Actual Original Budget Adjusted Budget Actual R R R R Motor vehicle allowance Cell phone allowance Housing allowance Overtime Other benefits or allowances Sub Total % increase/ decrease -6,95% 19.47% -0.4% -2.74% Total Municipality % increase/ decrease -6.19% 18.30% -0.38% -1.71% Personnel Expenditure 92
93 LIST OF ABBREVIATIONS AG CAPEX CBP CFO DCF DEDAT DPLG DWAF EE GAMAP GRAP HR IDP IFRS IMFO KPA KPI LED LLF MAYCOM Auditor-General Capital Expenditure Community Based Planning Chief Financial Officer District Coordinating Forum Department of Economic Development and Tourism Department of Provincial and Local Government Department of Water Affairs and Forestry Employment Equity Generally Accepted Municipal Accounting Practice Generally Recognised Accounting Practice Human Resources Integrated Development Plan International Financial Reporting Standards Institute for Municipal Finance Officers Key Performance Area Key Performance Indicator Local Economic Development Local Labour Forum Executive Mayoral Committee MFMA Municipal Finance Management Act (Act No. 56 of 2003) MGRO MIG MM MMC Municipal Governance Review & Outlook Municipal Infrastructure Grant Municipal Manager Member of Mayoral Committee MSA Municipal Systems Act No. 32 of

94 MTECH NGO NT OPEX PMS PCF PSG PT SALGA SAMDI SCM SDBIP SDF Medium Term Expenditure Committee Non-governmental organisation National Treasury Operating expenditure Performance Management System Premiers Coordinating Forum Provincial Strategic Goal Provincial Treasury South African Local Government Association South African Management Development Institute Supply Chain Management Service Delivery and Budget Implementation Plan Spatial Development Framework 94
BERGRIVIER MUNICIPALITY REPORT BY THE STRATEGIC MANAGER
 BERGRIVIER MUNICIPALITY REPORT BY THE STRATEGIC MANAGER TO: MAYORAL COMMITTEE COUNCIL 2018/19 QUARTERLY BUDGET AND PERFORMANCE REPORT FOR QUARTER 1: 1 JULY 30 SEPTEMBER 2018 SUBMITTED IN TERMS OF SECTION
QUARTERLY PERFORMANCE REPORT FOR QUARTER 3: 1 JANUARY MARCH 2016
 ANNEXURE C QUARTERLY PERFORMANCE REPORT FOR QUARTER 3: 1 JANUARY 2016 31 MARCH 2016 2/9/2 REPORT BY THE MANAGER STRATEGIC SERVICES 1 PURPOSE The purpose of this report is to present the quarterly performance
BERGRIVIER MUNICIPALITY REPORT BY THE STRATEGIC MANAGER
 BERGRIVIER MUNICIPALITY REPORT BY THE STRATEGIC MANAGER TO: MAYORAL COMMITTEE COUNCIL 2015/16 QUARTERLY BUDGET AND PERFORMANCE REPORT FOR QUARTER 4: 1 APRIL 30 JUNE 2016 SUBMITTED IN TERMS O F SECTION
Toplayer Service Delivery Budget Implementation Plan for 2016/17
 Toplayer Service Delivery Budget Implementation Plan for 206/7 Provincial Strategic Outcome KPI Calculation Type Assist Directorate [R] [R] National KPA [R] IDP Objective [R] KPI Name [R] Unit of Measurement
NW371 Moretele - Table A1 Budget Summary
 NW371 Moretele - Table A1 Summary Description 2012/13 2013/14 2014/15 Medium Term Revenue & Expenditure R thousands Pre-audit outcome Year Year +1 2017/18 Year +2 2018/19 Financial Performance Property
CHAPTER 2: MUNICIPAL DEVELOPMENT PROFILE KPA: Municipal Transformation and Organizational Development
 CHAPTER 2: MUNICIPAL DEVELOPMENT PROFILE 2.3.1 KPA: Transformation Organizational 2.3.2.1 Macro Structure Manager Manager Support IDP Performance Management Director: Community & Technical Services Director:
C51/07/2013 FINANCES: ADJUSTMENT BUDGET FOR THE 2012/2013 FINANCIAL YEAR: JULY /1/2 (B)/wm
/wm") Adjustment July 2013 C51/07/2013 FINANCES: ADJUSTMENT BUDGET FOR THE 2012/2013 FINANCIAL YEAR: JULY 2013 5/1/2 (B)/wm RESOLVED BY COUNCIL 1. THAT the unauthorised expenditure of R350 000 on P1100224 due
Adjustment July 2013 C51/07/2013 FINANCES: ADJUSTMENT BUDGET FOR THE 2012/2013 FINANCIAL YEAR: JULY 2013 5/1/2 (B)/wm RESOLVED BY COUNCIL 1. THAT the unauthorised expenditure of R350 000 on P1100224 due
MEDIUM TERM REVENUE AND EXPENDITURE FRAMEWORK 2014/ /17
 MANGAUNG METROPOLITAN MUNICIPALITY MEDIUM TERM REVENUE AND EXPENDITURE FRAMEWORK 2014/15-2016/17 MANGAUNG METROPOLITAN MUNICIPALITY TABLE OF CONTENTS PART 1 - ANNUAL BUDGET 1. Executive Summary 4 2. Summary
MEDIUM TERM REVENUE AND EXPENDITURE FRAMEWORK 2017/ /20
 MANGAUNG METROPOLITAN MUNICIPALITY MEDIUM TERM REVENUE AND EXPENDITURE FRAMEWORK 2017/18-2019/20 MANGAUNG METROPOLITAN MUNICIPALITY TABLE OF CONTENTS PART 1 - ANNUAL BUDGET 1. Executive Summary 4 2. Summary
MUNICIPAL FINANCE MANAGEMENT ACT (MFMA): PRELIMINARY MONTHLY FINANCIAL REPORT FOR THE PERIOD ENDED 31 MARCH 2018 (MONTHLY BUDGET STATEMENT)
: PRELIMINARY MONTHLY FINANCIAL REPORT FOR THE PERIOD ENDED 31 MARCH 2018 (MONTHLY BUDGET STATEMENT)") 16 APRIL 2018 THE CITY MANAGER THE EXECUTIVE MAYOR MUNICIPAL FINANCE MANAGEMENT ACT (MFMA): PRELIMINARY MONTHLY FINANCIAL REPORT FOR THE PERIOD ENDED 31 MARCH 2018 (MONTHLY BUDGET STATEMENT) 1. PURPOSE
16 APRIL 2018 THE CITY MANAGER THE EXECUTIVE MAYOR MUNICIPAL FINANCE MANAGEMENT ACT (MFMA): PRELIMINARY MONTHLY FINANCIAL REPORT FOR THE PERIOD ENDED 31 MARCH 2018 (MONTHLY BUDGET STATEMENT) 1. PURPOSE
SETSOTO LOCALL MUNICIPALITY
 ANNUAL BUDGET OF SETSOTO LOCALL MUNICIPALITY Page 1 TABLE OF CONTENTS 2013/14 TO 2015/16 MEDIUM TERM REVENUE AND EXPENDITURE FORECASTS PART 1: ANNUAL BUDGET 6 1.1 MAYOR S REPORT 6 (REFER TO THE ATTACHMENT)
Monthly Budget Statement January 2015
 SWELLENDAM MUNICIPALITY PAGE 1 SWELLENDAM MUNICIPALITY In-Year Report Prepared in terms of the Local Government: Municipal Finance Management Act (56/2003): Municipal and Reporting Regulations, Government
Swellendam Municipality 2015/16 Combined Assurance Plan SWELLENDAM MUNICIPALITY 2015/2016 COMBINED ASSURANCE PLAN
 SWELLENDAM MUNICIPALITY 2015/2016 COMBINED ASSURANCE PLAN APPROVED BY COUNCIL PER ITEM C20 ON 30 SEPTEMBER 2015 i Contents 1 Introduction 3 2 Objectives 3 3 Approach 3 4 Roles and Responsibilties 3 4.1
Strategic Performance Framework
 Strategic Performance Framework Overview The strategic performance framework is a list of Key Performance Indicators (KPIs), which enable the Council to report how successful it has been in delivering
uthungulu District Municipality
 The Municipality Tariff Policy TABLE OF CONTENTS 1. Definitions 2. Preamble 3. General Introduction and Objective 4. Principles 5. Classification and pricing strategies of services 6. Calculation of Tariffs
MUNICIPAL FINANCE MANAGEMENT ACT (MFMA): PRELIMINARY MONTHLY FINANCIAL REPORT FOR THE PERIOD ENDED 30 SEPTEMBER 2018 (MONTHLY BUDGET STATEMENT)
: PRELIMINARY MONTHLY FINANCIAL REPORT FOR THE PERIOD ENDED 30 SEPTEMBER 2018 (MONTHLY BUDGET STATEMENT)") 10 October 2018 THE CITY MANAGER THE EXECUTIVE MAYOR MUNICIPAL FINANCE MANAGEMENT ACT (MFMA): PRELIMINARY MONTHLY FINANCIAL REPORT FOR THE PERIOD ENDED 30 SEPTEMBER 2018 (MONTHLY BUDGET STATEMENT) 1. PURPOSE
10 October 2018 THE CITY MANAGER THE EXECUTIVE MAYOR MUNICIPAL FINANCE MANAGEMENT ACT (MFMA): PRELIMINARY MONTHLY FINANCIAL REPORT FOR THE PERIOD ENDED 30 SEPTEMBER 2018 (MONTHLY BUDGET STATEMENT) 1. PURPOSE
achieving results in the public sector Kāpiti Coast District Council Financial Investigation of a Kāpiti Coast Unitary April 2013
 AUCKLAND SYDNEY BRISBANE PERTH Kāpiti Coast District Council Financial Investigation of a Kāpiti Coast Unitary achieving results in the public sector TABLE OF CONTENTS 1. INTRODUCTION... 1 2. METHODOLOGY...
MUNICIPAL FINANCE MANAGEMENT ACT (MFMA): PRELIMINARY MONTHLY FINANCIAL REPORT FOR THE PERIOD ENDED 31 DECEMBER 2017 (MONTHLY BUDGET STATEMENT)
: PRELIMINARY MONTHLY FINANCIAL REPORT FOR THE PERIOD ENDED 31 DECEMBER 2017 (MONTHLY BUDGET STATEMENT)") 12 JANUARY 2018 THE CITY MANAGER THE EXECUTIVE MAYOR MUNICIPAL FINANCE MANAGEMENT ACT (MFMA): PRELIMINARY MONTHLY FINANCIAL REPORT FOR THE PERIOD ENDED 31 DECEMBER 2017 (MONTHLY BUDGET STATEMENT) 1. PURPOSE
12 JANUARY 2018 THE CITY MANAGER THE EXECUTIVE MAYOR MUNICIPAL FINANCE MANAGEMENT ACT (MFMA): PRELIMINARY MONTHLY FINANCIAL REPORT FOR THE PERIOD ENDED 31 DECEMBER 2017 (MONTHLY BUDGET STATEMENT) 1. PURPOSE
Area of Service Slides 3-6. Financials : 2009/2010 Financial Year Slides Strategic Objectives 2011/2012 Slides 11-12
 Area of Service Slides 3-6 Financials : 2009/2010 Financial Year Slides 7-10 Strategic Objectives 2011/2012 Slides 11-12 Tariffs 2011/2012 Slides 13-16 Budget 2011/2012 Slides 17-21 CAPEX Infrastructure
Click for Instructions!
 mscoa Version 6.1 Click for Instructions! Contact details: Elsabé Rossouw National Treasury Tel: (012) 315-5534 Electronic submissions: lgdocuments@treasury.gov.za 2020 Preparation Instructions Municipality
UNDERSTANDING YOUR RATES ACCOUNT. INSTALMENT 1: Last day for payment 30 September 2016
 UNDERSTANDING YOUR S ACCOUNT INSTALMENT 1: Last day for payment 30 September HOW ARE S CALCULATED? Your rates account will show the different kinds of rate that we collect. Most of them are based on the
Theewaterskloof Municipality
 Theewaterskloof Municipality Final Budget 2018/2019 to 2020/2021 29 May 2018 English is original version Copies of this document can be viewed: In the foyer of all municipal offices All public libraries
FUNDING & RESERVES POLICY
 FUNDING & RESERVES POLICY UNCHANGED 1 JULY 2016 STEVE TSHWETE LOCAL MUNICIPALITY MP 313 Approved May 2016 C36/05/2016 1. INTRODUCTION The funding and reserves policy is aimed to ensure that the municipality
PIXLEY KA SEME DISTRICT MUNICIPALITY
 PIXLEY KA SEME DISTRICT MUNICIPALITY FINAL SERVICE DELIVERY BUDGET IMPLEMENTATION PLAN ( SDBIP ) 2014/2015 1 Table of Contents Page no. 1. Introduction 3 2. Legislative Framework in terms of MFMA 3 3.
MEDIUM TERM REVENUE AND EXPENDITURE FRAMEWORK. (Including NALEDI) 2016/ /19
 2016/ /19") MANGAUNG METROPOLITAN MUNICIPALITY MEDIUM TERM REVENUE AND EXPENDITURE FRAMEWORK (Including NALEDI) 2016/17-2018/19 MANGAUNG METROPOLITAN MUNICIPALITY TABLE OF CONTENTS PART 1 - ANNUAL BUDGET 1. Executive
MANGAUNG METROPOLITAN MUNICIPALITY MEDIUM TERM REVENUE AND EXPENDITURE FRAMEWORK (Including NALEDI) 2016/17-2018/19 MANGAUNG METROPOLITAN MUNICIPALITY TABLE OF CONTENTS PART 1 - ANNUAL BUDGET 1. Executive
Bergrivier Municipality
 Bergrivier Municipality 3 rd ADJUSTMENT BUDGET 2015-2016 23 February 2016 Table of Contents PART 1 ADJUSTMENTS BUDGET * Mayor s report * Resolutions * Executive summary * Adjustments budget tables PART
TARIFF POLICY GEORGE MUNICIPALITY. 1 P a g e / D R A F T : 2 6 M A R C H A P P R O V E D : 2 7 M A Y
 TARIFF POLICY GEORGE MUNICIPALITY 1 P a g e 2 0 1 5 / 2 0 1 6 TARIFF POLICY GEORGE MUNICIPALITY INDEX 1. PART 1: PREAMBLE 3 2. PART 2: DEFINITIONS 3 3. PART 3: PURPOSE 8 4. PART 4: ALIGNMENT WITH THE MUNICIPALITY
Moretele Local Municipality. IDP/Budget Process Plan 2018/ ( IDP: Process Plan)
") Moretele Local Municipality IDP/Budget Process Plan /2019 1 Revision Control Final - August 2017 Strategic Services IDP/PMS Unit Enquiries: 012 716 1321 / 1324 (tel) thabo.makwela@moretele.org.za nyakale.lale@moretele.org.za
Moretele Local Municipality IDP/Budget Process Plan /2019 1 Revision Control Final - August 2017 Strategic Services IDP/PMS Unit Enquiries: 012 716 1321 / 1324 (tel) thabo.makwela@moretele.org.za nyakale.lale@moretele.org.za
Water Regulation and Pricing RSA EXPERIENCE
 Water Regulation and Pricing RSA EXPERIENCE Presenter: Avril Halstead Chief Director, National Treasury 26 June 2014 Outline Water Sector Value Chain Financial framework Framework for economic regulation
LEKWA-TEEMANE LOCAL MUNICIPALITY TERMS OF REFERENCE OVERSIGHT COMMITTEE
 LEKWA-TEEMANE LOCAL MUNICIPALITY TERMS OF REFERENCE OVERSIGHT COMMITTEE To be read in conjunction with National Treasury MFMA Circular 32 The Oversight Report CONTENTS 1. INTRODUCTION 3 2. BACKGROUND 3
PLAN AND MANAGE THE BUDGET POLICY & PROCEDURE MANUAL
 PLAN AND MANAGE THE BUDGET POLICY & PROCEDURE MANUAL THABA CHWEU LOCAL MUNICIPALITY Approved 25 June 2012 Resolution no: A50/2012 TABLE OF CONTENTS 1 INTRODUCTION... 1 1.1 Vision and value statement...
STEVE TSHWETE LOCAL MUNICIPALITY MP
 BUDGET POLICY AMENDED 1 JULY 2016 STEVE TSHWETE LOCAL MUNICIPALITY MP 313 Approved May 2016 C36/05/2016 TABLE OF CONTENTS 1. Definitions 2. Introduction 3. Objective 4. Budgeting principles 5. Budget preparation
THE CORPORATION OF THE VILLAGE OF ALERT BAY FINANCIAL STATEMENTS DECEMBER 31, 2013
 THE CORPORATION OF THE VILLAGE OF ALERT BAY FINANCIAL STATEMENTS DECEMBER 31, 2013 THE CORPORATION OF THE VILLAGE OF ALERT BAY 2013 ELECTED OFFICIALS Councilor D. Aberley Councilor K. Gordon Mayor M. Berry
GEORGE MUNICIPALITY TARIFF BY-LAW
 GEORGE MUNICIPALITY TARIFF BY-LAW 1. DEFINITIONS In this tariff by-law, unless the context otherwise indicates - 1) agricultural consumers means consumers engaged in agriculture as defined in the scheme
Sol Plaatje Local Municipality (NC091)
") Sol Plaatje Local ity (NC091) Annual Performance Report for the period 1 July 2016 to 30 June Table of Contents 1. Introduction... 2 2. Legislative Background... 2 3. Statistical Background of the ity...
Sol Plaatje Local ity (NC091) Annual Performance Report for the period 1 July 2016 to 30 June Table of Contents 1. Introduction... 2 2. Legislative Background... 2 3. Statistical Background of the ity...
Section 5 Dollars and Cents
 Section 5 Dollars and Cents section Revenue and financing policy 5a Financial statements 5b Funding impact statement rating implications 5c Rating changes 5d Balanced budget statement 5e Financial reporting
Draft Strategic Asset Management Plan
 Draft Strategic Asset Management Plan 2016-2026 December 2015 Revised to include Special Rate Variation Scenarios The capital works programs included in this Strategic Asset Management Plan are subjected
LEKWA-TEEMANE LOCAL MUNICIPALITY NW 396
 LEKWA-TEEMANE LOCAL MUNICIPALITY NW 396 Mid-Year Budget Performance Assessment Report 2015/ TABLE OF CONTENTS 1. MUNICIPAL MANAGER S FOREWORD... 1 2. INTRODUCTION... 6 3. SECTION A: MID-YEAR BUDGET ASSESSMENT...
MAIN BOARD LISTING RULES. Chapter 13
 MAIN BOARD LISTING RULES Chapter 13 EQUITY SECURITIES CONTINUING OBLIGATIONS Environmental and Social Matters 13.91 (1) The Environmental, Social and Governance ( ESG ) Reporting Guide in Appendix 27 comprises
PEOPLE PLAN PROGRESS. Our Achievements
 Our Achievements Our Achievements (service performance reporting) In the statements of service performance there are references to an Annual Survey. This survey was undertaken by Key Research and the sample
City of Yellowknife FINANCIAL REPORT 2013 NORTHWEST TERRITORIES. For the year ended December 31, 2013
 City of Yellowknife NORTHWEST TERRITORIES FINANCIAL REPORT 2013 For the year ended December 31, 2013 City of Yellowknife Table of Contents December 31, 2013 Page Introductory Section Management's Responsibility
Performance Management. Framework
 Management Framework Section Two Supporting Information LTP 2015-25 Structure of Groups of Activities Council carries out a number of activities or functions in order to meet it statutory responsibilities
RANDFONTEIN LOCAL MUNICIPALITY Municipal Profile
 introduction The Housing Development Agency ("HDA") is a national public development agency that promotes sustainable communities by making well located and appropriately planned land and buildings available
A loyal three made stronger in one. Loyalist Township Strategic Plan ( )
") A loyal three made stronger in one Loyalist Township Strategic Plan (2012-2015) Adopted by Council on August 13, 2012 Loyalist Township Strategic Plan I. Community Profile As prescribed by the Ministry
A loyal three made stronger in one Loyalist Township Strategic Plan (2012-2015) Adopted by Council on August 13, 2012 Loyalist Township Strategic Plan I. Community Profile As prescribed by the Ministry
2016 Financial Statements
 2016 Financial Statements The Corporation of the District of Saanich British Columbia Fiscal year ended December 31, 2016 Prepared by: District of Saanich Finance Department saanich.ca June 13, 2017 Mayor
2018 BUDGET AND FINANCIAL PLAN
 Questionnaire 2018 BUDGET AND FINANCIAL PLAN January 1, 2018 - January 23, 2018 The Township of Langley is reviewing the Draft 2018 2022 Five-Year Financial Plan with emphasis on the 2018 Budget. Your
3. DEVELOPMENT STRATEGIES
 3. DEVELOPMENT STRATEGIES Table 60: ZDM Development Strategies 1 Infrastructure and No (Powers and 1.1 Water & Sanitation Water & Sanitation 1.1.1 To progressively provide a cost effective, reliable water
City of Penticton: Financial Plan Reporting Structure
 City of Penticton: Financial Plan Reporting Structure General Utilities General Government Transportation Services Recreation and Culture Environmental Health Services Public Health and Safety Protective
City of Coquitlam. Statement of Financial Information 2016
 City of Coquitlam Statement of Financial Information 2016 June 10, 2017 Notice to Reader The Financial Information Act requires municipalities and other Government organizations to prepare annual financial
REPORT Finance and Information Technology
 REPORT Finance and Information Technology To: Mayor Coté and Members of Council Date: 6/11/2018 From: Colleen Ponzini, CPA, CGA Acting Chief Financial Officer File: Item #: 253/2018 Subject: 2017 Statement
The Corporation of the Municipality of Strathroy-Caradoc Consolidated Financial Statements For the year ended December 31, 2017
 The Corporation of the Municipality of Strathroy-Caradoc Consolidated Financial Statements For the year ended The Corporation of the Municipality of Strathroy-Caradoc Consolidated Financial Statements
NATIONAL ENERGY REGULATOR OF SOUTH AFRICA. Electricity Subcommittee Public Hearing 3 June 2010
 Presentation ti to the NATIONAL ENERGY REGULATOR OF SOUTH AFRICA Electricity Subcommittee Public Hearing 3 June 2010 1 Content of Presentation Motivation and background of Tariff Increases proposed General
THE CORPORATION OF THE TOWN OF SPANISH
 THE CORPORATION OF THE TOWN CONSOLIDATED FINANCIAL STATEMENTS FOR THE YEAR ENDED INDEPENDENT AUDITORS' REPORT To the Members of Council, Inhabitants and Ratepayers of the Corporation of the Town of Spanish
metrovancouver METRO VANCOUVER FINANCIAL INFORMATION ACT FILING STATEMENT OF FINANCIAL INFORMATION FOR THE YEAR ENDED DECEMBER 31, 2016
 metrovancouver METRO VANCOUVER FINANCIAL INFORMATION ACT FILING STATEMENT OF FINANCIAL INFORMATION FOR THE YEAR ENDED DECEMBER 31, 2016 THIS STATEMENT OF FINANCIAL INFORMATON INCLUDES THE ACCOUNTS OF:
29 March 2012 MBOMBELA LOCAL MUNICIPALITY DRAFT 2012/ /2015 ANNUAL BUDGET AND MEDIUM- TERM REVENUE AND EXPENDITURE FRAMEWORK
 29 March 2012 MBOMBELA LOCAL MUNICIPALITY DRAFT 2012/2013 2014/2015 ANNUAL BUDGET AND MEDIUM- TERM REVENUE AND EXPENDITURE FRAMEWORK MBOMBELA LOCAL MUNICIPALITY 2012/13 TO 2014/15 DRAFT ANNUAL BUDGET AND
THEEWATERSKLOOF MUNICIPALITY TARIFF POLICY
 THEEWATERSKLOOF MUNICIPALITY TARIFF POLICY Approved by Council : SC22/2016-26 May 2016 Contents 1. DEFINITIONS... 4 2. PURPOSE OF THIS POLICY... 6 3. TARIFF PRINCIPLES... 6 4. CATEGORIES OF CUSTOMERS...
2017 Mid-Year Financial Report
 2017 Mid-Year Financial Report BACKGROUND The mid-year report provides information regarding the City of Regina s (City) financial performance. This report provides a high level summary on how the City
Steve Tshwete Local Municipality
 Steve Tshwete Local Municipality 1 July 2008 30 June 2009 Service Delivery Budget Implementation Plan Adjusted September 2008 STEVE TSHWETE LOCAL MUNICIPALITY ADJUSTED (SEPT 2008) SERVICE DELIVERY BUDGET
MEDIUM TERM REVENUE AND EXPENDITURE FRAMEWORK 2015/ /18
 MANGAUNG METROPOLITAN MUNICIPALITY MEDIUM TERM REVENUE AND EXPENDITURE FRAMEWORK - 2017/18 MANGAUNG METROPOLITAN MUNICIPALITY TABLE OF CONTENTS PART 1 - ANNUAL BUDGET 1. Executive Summary 4 2. Summary
Monaghan County Council Comhairle Contae Mhuineacháin
 Monaghan County Council Comhairle Contae Mhuineacháin Monaghan County Council General Development Contributions Scheme 2013-2019 1 st December 2014 Revision Contents 1. Introduction... 3 2. General Development
Otorohanga District Council Summary Annual Report for the year ended 30 June 2016
 Otorohanga District Council Summary Annual Report for the year ended COMMENTS FROM THE MAYOR AND THE CHIEF EXECUTIVE The 2015/16 year was another year of steady performance by Council. Whilst there were
The Corporation of Haldimand County. Consolidated Financial Statements
 Consolidated Financial Statements December 31, 2016 Index to Consolidated Financial Statements December 31, 2016 Page INDEPENDENT AUDITORS' REPORT 2 CONSOLIDATED FINANCIAL STATEMENTS Management's Responsibility
1.1 Executive Mayor s Report Council Resolutions Executive Summary Operating Expenditure Framework Capital Expenditure 22
 TABLE OF CONTENTS 2 PART 1 ANNUAL BUDGET Page 1.1 Executive Mayor s Report 5 1.2 Council Resolutions 7 1.3 Executive Summary 8 1.4 Operating Revenue Framework 10 1.5 Operating 18 1.6 Capital Expenditure
Steve Tshwete Local Municipality MP313. July 2008 June 2009 High Level Service Delivery & Budget Implementation Plan
 Steve Tshwete Local Municipality MP313 July 2008 June 2009 High Level Service Delivery Budget Implementation Plan STEVE TSHWETE LOCAL MUNICIPALITY HIGH LEVEL SERVICE DELIVERY BUDGET IMPLEMENTATION PLAN
FINAL BUDGET 2017/2018 ZULULAND DISTRICT MUNICIPALITY UMKHANDLU WESIFUNDA SASE ZULULAND
 FINAL BUDGET 2017/2018 ZULULAND DISTRICT MUNICIPALITY UMKHANDLU WESIFUNDA SASE ZULULAND TABLE OF CONTENTS SECTION A BUDGET 1 Glossary 2 Mayors Report 3 Resolutions 4 Executive Summary 5 Annual budget tables:
1 Council Resolution: Item 09/08/26/10.2.1
 W e s t C o a s t D i s t r i c t M u n i c i p a l i t y A s s e t M a n a g e m e n t P o l i c y 1 Council Resolution: Item 09/08/26/10.2.1 T A B L E O F C O N T E N T S 1. INTRODUCTION 2. OBJECTIVE
achieving results in the public sector Wairarapa District Councils
 AUCKLAND SYDNEY BRISBANE PERTH Wairarapa District Councils Phase Three Report: Investigation into the formation of an Amalgamated Wairarapa District Council and a Wairarapa Unitary Authority achieving
2. LEGAL FRAMEWORK This Performance Report is submitted in compliance with;
 . INTRODUCTION The purpose of this report is to present the Performance Report of the Municipality for Midyear/section 72 report ( July 26 to 3 December 26) 2. LEGAL FRAMEWORK This Performance Report is
MEDIUM TERM REVENUE AND EXPENDITURE FRAMEWORK 2016/ /19
 MANGAUNG METROPOLITAN MUNICIPALITY MEDIUM TERM REVENUE AND EXPENDITURE FRAMEWORK 2016/17-2018/19 MANGAUNG METROPOLITAN MUNICIPALITY TABLE OF CONTENTS PART 1 - ANNUAL BUDGET 1. Executive Summary 4 2. Summary
TERMS OF REFERENCE FOR CONSULTING SERVICES FOR A STORMWATER FUNDING STUDY
 TERMS OF REFERENCE FOR CONSULTING SERVICES FOR A STORMWATER FUNDING STUDY PROJECT OVERVIEW The City of Guelph (City) wishes to retain a consulting engineering firm to complete a Stormwater Funding Study.
Annual Report Summary
 KAWERAU DISTRICT COUNCIL Annual Report Summary For the Year Ended 30 June 2015 1 MAYOR S MESSAGE Welcome to Council s annual report summary for 2014/15. It was another successful year and Council continues
THE BUDGET OF DR RUTH SEGOMOTSI MOMPATI DISTRICT MUNICIPALITY
 THE BUDGET OF DR RUTH SEGOMOTSI MOMPATI DISTRICT MUNICIPALITY 2017/18 TO 2019/20 MEDIUM TERM REVENUE AND EXPENDITURE FORECASTS SCHEDULE A ANNUAL BUDGET AND SUPPORTING DOCUMENTATION OF A MUNICIPALITY ii
VILLAGE OF NEW MARYLAND 2015 GENERAL OPERATING FUND BUDGET. 1. Total Budget - Total Page 17 $4,466,360
 1. Total Budget - Total Page 17 $4,466,360 2. Less: Non-Tax Revenue - Total Page 7 $311,392 3. Net Budget $4,154,968 4. Less: Community Funding and Equalization Grant $6,108 5. Warrant to be Raised by
Approved New Tariffs & Rates for City of Johannesburg Effective 1 July 2011 Principally Residential / Domestic Tariffs Prepared 30 th August 2011
 Approved New Tariffs & Rates for City of Johannesburg Effective 1 July 2011 Principally Residential / Domestic Tariffs Prepared 30 th August 2011 This document has been prepared by the DA caucus of the
CITY OF SACRAMENTO CALIFORNIA. April 27, 2012
 OFFICE OF THE CITY MANAGER CALIFORNIA April 27, 2012 CITY HALL 5 th FLOOR 915 I STREET SACRAMENTO, CA 95814-2684 PH 916-808-5704 FAX 916-808-7618 Honorable Mayor and City Council Sacramento, California
South Australian Water Corporation Fees and Charges Schedule Rates and Sales
 The following fees and charges are fixed for the period 1 July 2016 to 30 June 2017. s and Sales Annual Charge / s Charge / s Residential Tier 1 Use $2.27 first 0.3288kL Tier 2 Use $3.24 from 0.3288kL
South Africa s Intergovernmental Fiscal system. 22 June 2007
 South Africa s Intergovernmental Fiscal system 22 June 2007 South Africa: Are these really perceptions??? Federal/Central View: Giving money and power to sub-national governments is like giving whiskey
Section 4 C: Corporate and Managed Services Overview. Services to be provided
 Section 4 C: Corporate and Managed Services Overview Services to be provided Customer Service and Transformation is focused on fuelling the change that the Council is going through. We deliver some of
THE COUNTY GOVERNMENT OF MACHAKOS THE COUNTY TREASURY PROGRAMMME BASED BUDGET FY 2015/2016
 REPUBLIC OF KENYA THE COUNTY GOVERNMENT OF MACHAKOS THE COUNTY TREASURY PROGRAMMME BASED BUDGET FY JUNE 2015 0 Table of contents Table of contents... 1 Revenue Estimates FY 2015/16-2017-18... 2 Summary
Chapter 8 Development Management & Zoning Objectives
 Chapter 8 Development Management & Zoning Objectives 8.0 Introduction The Council, using its statutory powers granted under the Planning and Development Act 2000 (as amended) guides new development by
DRAFT PROCESS PLAN. to guide the planning, drafting, adoption and review of the SWARTLAND INTEGRATED DEVELOPMENT PLAN. for. 1 July June 2022
 DRAFT PROCESS PLAN to guide the planning, drafting, adoption and review of the SWARTLAND INTEGRATED DEVELOPMENT PLAN for 1 July 2017-30 June 2022 For public inputs and comments June 2016 Draft IDP Process
Logan River Water Supply Scheme
 Logan River Water Supply Scheme Annual Network Service Plan 2017-18 Published: September 2017 Contents Section Title Page 1. Introduction... 3 2. Scheme Details... 3 2.1 Scheme background and context...
Highlights From The Approved 2013 Budget Budget in Brief
 Highlights From The Approved 2013 Budget 2013 Budget in Brief Preparing for the FUTURE: The City of Brandon is committed to building a sustainable future. Our 2013 budget process was improved in many ways,
CORPORATION OF THE TOWN OF SOUTH BRUCE PENINSULA CONSOLIDATED FINANCIAL REPORT DECEMBER 31, 2011
 CONSOLIDATED FINANCIAL REPORT DECEMBER 31, 2011 DECEMBER 31, 2011 CONTENTS Independent Auditors' Report 1 Consolidated Statement of Financial Position 2 Consolidated Statement of Operations 3 Consolidated
Development Contributions Policy 2018: Springvale Urban Expansion Area and Otamatea West
 Development Contributions Policy 2018: Urban Expansion Area and West 1 P a g e Development Contributions Policy 2018: Urban Expansion Area and West Originator: Damien Wood, Development Engineer Contact
Murrumbidgee Shire Council. Darlington Point & Coleambally Peripheral Area Contributions Plan
 Murrumbidgee Shire Council Darlington Point & Coleambally Peripheral Area Contributions Plan UNDER SECTION 94 of the Environmental Planning and Assessment Act 1979 AND SECTION 64 of the Local Government
VILLAGE OF BOTHA VIABILITY PLAN
 VILLAGE OF BOTHA VIABILITY PLAN AND NEXT STEPS February 2017 A report concerning the viability of the Village of Botha Drafted by the Village of Botha Viability Review Team Viability Review Team Village
NONGOMA MUNICIPALITY
 ANNUAL BUDGET OF NONGOMA MUNICIPALITY 2018/19 TO 2020/21 MEDIUM TERM REVENUE AND EXPENDITURE FORECASTS Draft budget and Medium Term Revenue Expenditure Framework for 2018/19 year Page 1 of 66 Table of
Overview. Highland Creek Wastewater Treatment Plant. R.C. Harris Water Treatment Plant
 Presentation to Budget Committee October 19, 2009 2010 Operating Budget 2010-20192019 Capital Budget 1 Overview Serves 3.1 million residents and businesses in Toronto, and portions of York and Peel Over
Corporation of the Municipality of Red Lake Consolidated Financial Statements For the year ended December 31, 2017
 Corporation of the Municipality of Red Lake Consolidated Financial Statements For the year ended December 31, 2017 Contents Management's Responsibility for the Financial Statements 2 Independent Auditor's
HEMSON C o n s u l t i n g L t d
 DEVELOPMENT CHARGES BACKGROUND STUDY Town of Gravenhurst C o n s u l t i n g L t d April, 2014 TABLE OF CONTENTS EXECUTIVE SUMMARY... 1 I INTRODUCTION... 7 II A TOWN-WIDE UNIFORM CHARGE APPROACH TO ALIGN
HAVE YOUR SAY CONSULTATION DOCUMENT ON THE ANNUAL PLAN CARTERTON DISTRICT COUNCIL ISSN
 CONSULTATION DOCUMENT HAVE YOUR SAY ON THE ANNUAL PLAN 2017-2018 CARTERTON DISTRICT COUNCIL ISSN 1171 7459 FROM HIS WORSHIP THE MAYOR The biggest issue facing us now is finding a way to eventually discharge
Special Events on Private Property Permit Application
 APPLICABILITY This application is to be completed by every person/group operating or carrying on any special event outdoors on private property (real property that is not owned or controlled by the Municipality)
THEEWATERSKLOOF MUNICIPALITY
 THEEWATERSKLOOF MUNICIPALITY IDP/BUDGET REVIEW 2018/2019 DRAFT PROCESS PLAN Approved by Council: Reference: C Integrated Development Plan (IDP) Process Plan Compiled in terms of Sections 27, 28 and 29
TOWN OF CARY CAPITAL IMPROVEMENTS BUDGET OVERVIEW FOR FISCAL YEAR 2015
 TOWN OF CARY CAPITAL IMPROVEMENTS BUDGET OVERVIEW FOR FISCAL YEAR 2015 The Capital Improvements Budget/Plan Process Each year, staff prepares a capital improvements budget and a long range capital improvements
TOWN OF SHELBURNE CONSOLIDATED FINANCIAL STATEMENTS MARCH 31, 2014
 CONSOLIDATED FINANCIAL STATEMENTS MARCH 31, 2014 CONTENTS INDEX TO CONSOLIDATED FINANCIAL STATEMENTS MARCH 31, 2014 PAGE Independent Auditors' Report 1 Consolidated Financial Statements Consolidated Statement
TOWNSHIP OF SOUTH GLENGARRY FINANCIAL STATEMENTS
 FINANCIAL STATEMENTS December 31, 2017 December 31, 2017 CONTENTS Page INDEPENDENT AUDITORS' REPORT 1 FINANCIAL STATEMENTS Statement of Financial Position 2 Statement of Financial Activities 3 Statement
NAMA KHOI LOCAL MUNICIPALITY
 NAMA KHOI LOCAL MUNICIPALITY FINAL BUDGET 2017/18 TO 2019/20 Copies of this document can be viewed: In the foyers of all municipal buildings All public libraries within the municipality At www.namakhoi.gov.za
Quarterly Budget Report
 City of Chicago Quarterly Report 1st Quarter Mayor Rahm Emanuel Quarterly Report-1st Quarter Content and Purpose This quarterly report presents an overview of the City s operating revenues and expenditures
our city our future DRAFT RESOURCING STRATEGY July 2014 FOR PUBLIC EXHIBITION 4 August - 15 September 2014
 our city our future SUSTAINABLE BLUE MOUNTAINS FOR PUBLIC EXHIBITION 4 August - 15 September 2014 DRAFT RESOURCING STRATEGY 2014-2024 July 2014 Including three possible options for Resourcing Our Future