Theewaterskloof Municipality
|
|
|
- Cameron Doyle
- 5 years ago
- Views:
Transcription
1 Theewaterskloof Municipality Final Budget 2018/2019 to 2020/ May 2018 English is original version Copies of this document can be viewed: In the foyer of all municipal offices All public libraries within the municipality At
2 Table of Contents List of Tables... ii PART 1 ANNUAL BUDGET 1. Council Resolutions Executive summary Operating Revenue and Expenditure Framework Capital Expenditure Annual budget tables Overview of Annual Budget Process Overview of Alignment of Annual Budget with IDP Measurable performance objectives and Indicators Overview of Budget Related Policies Overview of Budget Assumptions Overview of Budget and Funding Expenditure on allocations and grant programmes Annual Budgets and Service delivery and Budget Implementation plans- Internal Departments Capital expenditure details Capital expenditure details Legislation Compliance Status Other supporting documents Municipal manager s quality certificate i
3 List of tables Description Page Budget Summary (Table A1)... 7 Budgeted Financial Performance (Revenue and Expenditure by standard classification) (Table A2). 9 Budgeted Financial Performance (Revenue and Expenditure by municipal vote)(table A3) Budgeted Financial Performance (Revenue and Expenditure) (Table A4) Budgeted Capital Expenditure by vote, standard classification and funding (Table A5) Budgeted Financial Position (Table A6) Budgeted Cash Flows (Table A7) Cash Backed reserves/accumulated surplus reconciliation (Table A8) Asset Management (Table A9) Basic Service Delivery measurement(table A10) Reconciliation between the IDP strategic objectives and budgeted revenue (Table SA4) Reconciliation between the IDP strategic objectives and budgeted operating expenditure (Table SA5) Key financial indicators and ratios (table SA8) Monetary investments by type (Table SA15) Detail of borrowings (Table SA17) Funding compliance measurement (Table SA10) Expenditure on allocations and grant programmes (Table SA19) Salaries,allowances & benefits (political office bearers, councillors/senior managers)(table SA23) 75 Summary councillor and staff benefits (Table SA22) Summary of personnel numbers (Table SA24) Capital expenditure on new assets by asset class (Table SA34a) Capital expenditure on renewal of existing assets by asset class (Table SA34b) Repairs and maintenance expenditure by asset class (Table SA34c) Capital expenditure details (Table SA36) Supporting detail to budgeted financial performance (Table SA1) Supporting detail to Statement of Financial Position (Table SA3) ii
4 Abbreviations and Acronyms IDP Integrated Development Plan MTREF Medium Term Revenue and Expenditure Framework NERSA National Electricity Regulator South Africa kl Kilolitre kwh Kilowatt VAT Value Added Tax SMME Small Micro and Medium Enterprises CPI Consumer Price index MFMA Municipal Finance Management Act 56 of 2003 GFS Government Financial Statistics MBRR Municipal Budget and Reporting Regulations GRAP Generally Recognized Accounting Practice MSA Municipal Systems Act MIG Municipal Infrastructure Grant LED Local Economic Development SDBIP Service Delivery Budget Implementation Plan DoRA Division of Revenue Act PDO Predetermined Objectives KPI Key Performance Indicator KPA Key Performance Area RBIG Regional Bulk Infrastructure Grant MTBPS Medium Term Budget Policy Statement iii
5 1. Council Resolutions 1. That Council resolves that the Final Annual Operating Budget of the municipality for the financial year 2018/2019 and indicative for the two projected Outer Years 2019/2020 and 2020/2021 be approved as set out on Tables A1, A2, A3 and A4.(pages 7-12). 2. That Council resolves that the Final Annual Capital Budget of the municipality for the financial year 2018/2019 and indicative for the two projected Outer Years 2019/2020 and 2020/2021 be approved as set out on Tables A1, A5 and SA36.(pages 7, 14, and 92). 3. That Council resolves that the Monthly Cash Flow Forecasts with appropriate amendments be approved as the Cash Flow Budget of the Council for the 2018/2019 financial year as set out on Tables A1 and A7. (Pages 7 and 18). 4. That Council resolves to adopt the Final Reviewed Integrated Development Plan. 5. That Council resolves to adopt the Spatial Development Framework as part of the Integrated Development Plan, as regulated by the Municipal Systems Act (Act 32 of 2000), a directed in terms of Section 22 of the Bill on the Land Use Planning Act. 6. That Council resolves that the Final Tariff Charges are approved for the Financial Year 2018/2019. (Annexure A). 7. That the Final Monthly Indigent Subsidy in respect of 6kl Water, 70KwH Electricity, Refuse, Sewer and Informal Settlement Plot Rental (where applicable) are approved and that the applicable free basic services subsidies be calculated on the approved tariffs for the applicable services and measurable units. 8. That it be noted that Unfunded Functions and Underfunded Functions are fully budgeted for at present service levels and in respect of Housing. 9. That note is taken that Internal Division of Costs(Departmental Charges) are calculated based on expected budgeted time spent, measurable units/quantities, cost, and that tariffs are determined accordingly. 1
6 2. Executive summary LEGAL REQUIREMENTS The MTREF for 2018/19 to 2020/2021 were compiled in accordance with the requirements of the relevant legislation, of which the following are the most important The Constitution of the Republic of South Africa, Act 108 of 1996; The Municipal Structures Act, Act 117 of 1998; The Municipal Systems Act, Act 32 of 2000; The Municipal Finance Management Act, Act 56 of 2003; The Municipal Budget and Reporting Regulations promulgated on 17 April 2009; and The Division of Revenue Act The main objective of a municipal budget is to allocate realistically expected resources to the service delivery goals or performance objectives identified as priorities in the Integrated Development Plan. The following budget principles and guidelines directly informed the compilation of the 2018/19 to 2020/2021 MTREF o National Treasury s MFMA Circulars were used to guide the compilation of the MTREF; o Headline inflation predictions; o National outcomes and priorities; o NERSA guidelines; o The priorities and targets in relation to the key strategic focus areas as determined in the IDP; o Tariff and property rates revenue stream increases should be affordable and should generally not exceed inflation as measured by the CPI, except where there are price increases in the inputs of services that are beyond the control of the municipality, or instance the cost-of-living increases and cost of bulk water and electricity. In addition, tariffs need to remain or move towards being cost reflective, and should take into account the need to address infrastructure backlogs; o There will be external borrowings taken up during this budget year as a means of a funding source that is available to support the Capital Budget, in view of financial affordability considerations and also to enhance service delivery. Growth to the Theewaterskloof Municipality s Medium Term Revenue and Expenditure Framework (MTREF) is based on a combination of factors such as (relatively low) generic growth to core tariff-based services, operational efficiencies, and revenue-related policies aimed at optimising and sustaining all income sources. The MTREF-based Revenue and Expenditure Projections assumed inflation-linked annual adjustments. The main challenges experienced during the compilation of the 2018/19 MTREF can be summarised as follows: o The increased costs associated with bulk water and electricity, placing upward pressure on tariff increases to consumers. Continued high tariff increases may soon render municipal services financially unaffordable; o Reprioritisation of capital projects and operating expenditure within the financial affordability limits of the Budget, taking the cash position into account; o Salary increases for municipal staff exceeding consumer inflation, and the requirement to fill funded vacant, critical and essential positions in accordance with the Salary and Wage Collective Agreement; 2
7 National and local economic difficulties (low economic growth) Above inflation increases in essential maintenance costs Old infrastructure which needs to be consistently maintained or replaced The following further key parameters which are informed by the need to recover costs and to balance the budget were considered for the 2018/19 financial year: Tariff increases: Assessment Rates 6.8% Electricity 6.84% (Subject to NERSA s final approval) Water 25.1% Sanitation (Sewer) 16.3% Solid Waste (Refuse) 18.25% The following table provides a consolidated overview of the proposed 2018/2019 MTREF taking into consideration tariff adjustments and increases to input costs: Description Current Year R thousand 2017/ / / /21 Total Operating Revenue (568,614) (580,022) (634,627) (663,951) Total Operating Expenditure 508, , , ,517 (Suplus)/Deficit for the year (60,053) (28,840) (46,659) (36,434) Total Capital Expenditure 130,284 78,756 47,110 45,693 Total operating revenue is projected to grow by 2 per cent or R 11,408 million for the 2018/19 financial year when compared to the 2017/18 Budget. For the two outer years, operational revenue will increase by 9.4% and 4.6% respectively, equating to a total revenue growth of R 83,929 million over the MTREF when compared to the 2017/18 financial year. The major items of operating revenue are as follows: Description R thousand Current Year 2017/ /19 % of Total Revenue Growth 2016/ /18 Property Rates 94, ,604 17% 7% Service Charges 200, ,028 39% 13% Operational grants 136, ,043 25% 7% Capital grants 79,306 47,348 8% -40% Other own Revenue 58,268 60,999 11% 5% 568, , % 2% Revenue from service charges represents the biggest part (39%) of the municipality s revenue followed by operational grants (25%), property rates (17%) and capital grants (8%). There has been a decrease in capital grants and an increase in other own revenue when compared to the 2017/18 financial year. 3
8 The major operating expenditure items are summarised below: Current Year 2017/ /19 % of Total Expenditure Growth 2016/ /18 Employee costs 182, ,998 37% 11% Remuneration of councillors 11,628 12,179 2% 5% Depreciation & asset impairment 28,302 31,305 6% 11% Finance charges 20,105 22,362 4% 11% Materials and bulk purchases 118, ,223 25% 16% Transfers and grants % 66% Other expenditure 147, ,884 26% -1% 508, , % 8.4% Total operating expenditure for the 2018/19 financial year amounts to R 551,182 million, which represents an increase of R 42,621 million (8.4%) over 2017/18 and increases of 6.7% for each of the respective outer years of the MTREF. Description R thousand Current Year 2017/ / / /21 Total Capital Expenditure 130,284 78,756 47,110 45,693 The capital expenditure amount to R 78,756 million and has decrease by 39.6% when compared to the 2017/18 adjustment budget. The outer years decline to R 47,110 million in 2019/2020 and R 45, 693 million in 2020/2021. Successful alignment of Theewaterskloof Municipality s service delivery priorities, as embodied in the updated IDP and its focus areas, objectives and perspectives, to that of National and Provincial Governments is seen as critical if the Municipality wants to achieve its developmental goals. The Strategic Focus Areas developed by Theewaterskloof Municipality are as follows: Financial Viability Good Governance Institutional Development Basic Service Delivery Local Economic Development 4
9 3. Operating Revenue and Expenditure Framework Vote Description 2014/ / /17 Current Year 2017/ /19 Medium Term Revenue & Expenditure Framework R thousand Audited Audited Audited Original Adjusted Full Year Outcome Outcome Outcome Budget Budget Forecast 2018/ / /21 Revenue by Vote Vote 1 - Budget and treasury office 134, , , , , , , , ,093 Vote 2 - Community and social serv ices 6,156 7,171 8,331 7,323 7,323 7,323 9,942 10,489 11,063 Vote 3 - Corporate serv ices 30,089 25,952 21,537 27,628 28,873 28,873 26,688 28,229 28,439 Vote 4 - Electricity 75,847 82,783 85,212 87,442 91,942 91,942 88, , ,223 Vote 5 - Env ironmental protection Vote 6 - Ex ecutiv e and council 7,372 9,851 8,074 1,150 1,294 1,294 1,130 1,190 1,254 Vote 7 - Housing 59,099 50,823 19,235 72,621 79,441 79,441 61,255 76,869 64,500 Vote 8 - Planning and dev elopment 2,004 5,239 5,086 2,625 3,404 3,404 2,558 2,817 2,874 Vote 9 - Public safety 25,340 31,275 31,111 30,435 30,435 30,435 32,261 34,840 37,626 Vote 10 - Road transport 5,078 5,423 4,554 5,913 10,384 10,384 6,263 6,638 7,169 Vote 11 - Sport and recreation (780) (673) (949) Vote 12 - Waste management 26,226 31,226 34,496 36,439 35,439 35,439 42,785 46,297 50,061 Vote 13 - Waste water management 25,581 30,289 31,703 35,599 34,899 34,899 40,341 43,648 47,192 Vote 14 - Water 45,445 51,760 69,465 58,460 67,993 67,993 79,970 86,442 93,407 Vote 15 - [NAME OF VOTE 15] Total Revenue by Vote 442, , , , , , , , ,951 Expenditure by Vote to be appropriated Vote 1 - Budget and treasury office 33,168 39,372 40,659 42,933 45,268 45,268 46,719 50,181 53,903 Vote 2 - Community and social serv ices 5,685 6,283 7,732 7,066 6,981 6,981 9,317 9,970 10,670 Vote 3 - Corporate serv ices 16,841 17,298 19,856 64,766 65,539 65,539 78,085 82,742 87,748 Vote 4 - Electricity 53,310 64,006 69,079 73,346 72,791 72,791 77,609 83,496 89,843 Vote 5 - Env ironmental protection Vote 6 - Ex ecutiv e and council 56,323 59,226 61,115 41,353 40,784 40,784 38,184 41,136 44,319 Vote 7 - Housing 33,712 48,557 12,781 41,753 46,814 46,814 43,588 46,318 49,222 Vote 8 - Planning and dev elopment 11,512 12,907 12,425 12,263 13,160 13,160 13,116 14,095 15,150 Vote 9 - Public safety 31,451 40,843 47,867 46,486 46,633 46,633 55,854 60,102 64,678 Vote 10 - Road transport 28,700 28,777 30,353 31,167 33,238 33,238 30,374 32,403 34,583 Vote 11 - Sport and recreation 7,109 7,667 7,822 9,647 9,552 9,552 10,772 11,536 12,356 Vote 12 - Waste management 26,722 44,050 44,195 45,956 45,810 45,810 53,119 55,891 58,868 Vote 13 - Waste water management 25,833 28,515 31,127 32,119 32,013 32,013 39,150 41,261 43,529 Vote 14 - Water 37,927 42,023 47,714 49,670 49,687 49,687 54,996 58,520 62,312 Vote 15 - [NAME OF VOTE 15] Total Expenditure by Vote 368, , , , , , , , ,517 Surplus/(Deficit) for the year 74,029 44,377 49,292 42,355 60,053 60,053 28,840 46,659 36,434 5
10 4. Capital Expenditure Vote Description 2014/ / /17 Current Year 2017/ /19 Medium Term Revenue & Expenditure Framework R thousand Audited Outcome Audited Outcome Audited Outcome Original Budget Adjusted Budget Full Year Forecast Pre-audit outcome 2018/ / /21 Capital expenditure - Vote Multi-year expenditure to be appropriated Vote 1 - Budget and treasury office Vote 2 - Community and social serv ices Vote 3 - Corporate serv ices Vote 4 - Electricity 2,342 3,450 3,840 3,840 3, Vote 5 - Env ironmental protection Vote 6 - Ex ecutiv e and council Vote 7 - Housing 29,555 7,069 11,395 Vote 8 - Planning and dev elopment Vote 9 - Public safety Vote 10 - Road transport 195 9,194 9,951 9,951 9, ,632 Vote 11 - Sport and recreation 10,303 Vote 12 - Waste management 1,030 Vote 13 - Waste water management 4,366 17,032 17,032 17,032 17,032 18,686 16,440 19,583 Vote 14 - Water 219 3,326 4,042 4,042 4,042 3,836 1,296 Vote 15 - [NAME OF VOTE 15] Capital multi-year expenditure sub-total 42,214 7,069 17,709 33,002 34,865 34,865 34,865 23,565 21,018 20,383 Single-year expenditure to be appropriated Vote 1 - Budget and treasury office Vote 2 - Community and social services Vote 3 - Corporate serv ices 477 1,657 5,006 5,894 5,894 5,894 2,403 Vote 4 - Electricity 5,264 13,081 11,520 10,559 11,317 11,317 11,317 3,350 7,698 7,150 Vote 5 - Env ironmental protection Vote 6 - Executiv e and council 2,095 6,720 2,939 1,813 2,000 2,000 2,000 3, Vote 7 - Housing 36,381 37,760 37,760 37,760 24,100 Vote 8 - Planning and dev elopment Vote 9 - Public safety ,084 1,694 1,694 1,694 6,300 Vote 10 - Road transport 3,303 3, ,097 5,097 5, Vote 11 - Sport and recreation 166 3,199 1,346 1,600 1,103 1,103 1,103 1, Vote 12 - Waste management 3,000 1,870 4,518 2,660 2,660 2,660 10,734 11,619 7,272 Vote 13 - Waste water management 16,039 18,857 16,870 2,273 2,273 2,273 3,509 Vote 14 - Water 2,526 6,581 9,163 13,904 24,867 24,867 24,867 2,500 5,351 6,579 Vote 15 - [NAME OF VOTE 15] Capital single-year expenditure sub-total 31,158 57,605 45,302 75,934 95,420 95,420 95,420 55,191 26,092 25,310 Total Capital Expenditure - Vote 73,372 64,675 63, , , , ,284 78,756 47,110 45,693 Capital Expenditure - Functional Governance and administration 3,331 8,703 3,796 6,862 7,936 7,936 7,936 6, Ex ecutiv e and council 1,762 1,377 1,524 Finance and administration 1,570 7,327 2,271 6,862 7,936 7,936 7,936 6, Internal audit Community and public safety 40,409 10,935 13,481 38,382 39,540 39,540 39,540 26, Community and social serv ices Sport and recreation 10,469 3,199 1,346 1,600 1,103 1,103 1,103 1, Public safety Housing 29,555 7,069 11,395 36,381 37,760 37,760 37,760 24,100 Health Economic and environmental services 3,461 3, ,904 16,777 16,777 16,777 7,277 2,632 Planning and development Road transport 3,303 3, ,904 16,742 16,742 16,742 7,277 2,632 Env ironmental protection Trading services 26,171 41,519 45,038 52,789 66,031 66,031 66,031 39,272 43,054 44,893 Energy sources 7,606 13,081 11,520 14,009 15,157 15,157 15,157 3,515 8,348 7,950 Water management 2,526 6,581 9,382 17,230 28,909 28,909 28,909 6,336 6,647 6,579 Waste w ater management 16,039 18,857 21,236 17,032 19,305 19,305 19,305 18,686 16,440 23,091 Waste management 3,000 2,899 4,518 2,660 2,660 2,660 10,734 11,619 7,272 Other Total Capital Expenditure - Functional 73,372 64,675 63, , , , ,284 78,756 47,110 45,693 Funded by: National Government 29,598 29,331 25,982 25,424 34,341 34,341 34,341 22,489 31,579 31,017 Prov incial Gov ernment 30,240 7,379 11,405 36,381 40,495 40,495 40,495 24,859 District Municipality Other transfers and grants 1,442 Transfers recognised - capital 59,838 36,710 38,828 61,805 74,836 74,836 74,836 47,348 31,579 31,017 Public contributions & donations 4,470 4,470 4,470 Borrowing 6,687 7,456 11,905 32,244 32,032 32,032 32,032 10,420 Internally generated funds 6,847 20,509 12,278 14,887 18,946 18,946 18,946 20,988 15,532 14,676 Total Capital Funding 73,372 64,675 63, , , , ,284 78,756 47,110 45,693 6
11 5. Annual budget tables The following ten tables set out the municipality s 2018/2019 budget and MTREF to be approved by resolution of Council: Budget Summary (Table A1) Description 2014/ / /17 R thousands Audited Audited Audited Original Adjusted Full Year Pre-audit Outcome Outcome Outcome Budget Budget Forecast outcome 2018/ / /21 Financial Performance Property rates 68,637 75,778 85,873 94,233 94,233 94,233 94, , , ,345 Service charges 153, , , , , , , , , ,473 Inv estment rev enue 5,134 7,323 7,323 5,500 5,810 5,810 5,810 6,159 6,159 6,159 Transfers recognised - operational 109, ,982 94, , , , , , , ,270 Other own revenue 45,263 64,125 61,786 52,344 52,458 52,458 52,458 54,840 59,098 63,688 Total Revenue (excluding capital transfers 382, , , , , , , , , ,934 and contributions) Employ ee costs 138, , , , , , , , , ,610 Remuneration of councillors 8,573 8,939 9,987 11,650 11,628 11,628 11,628 12,179 13,153 14,206 Depreciation & asset impairment 10,941 24,695 23,097 28,302 28,302 28,302 28,302 31,305 31,305 31,305 Finance charges 13,237 19,081 18,798 20,105 20,105 20,105 20,105 22,362 22,362 22,362 Materials and bulk purchases 54,670 62,105 67, , , , , , , ,410 Transfers and grants 1,351 1,214 2, Other ex penditure 140, , , , , , , , , ,393 Total Expenditure 368, , , , , , , , , ,517 Surplus/(Deficit) 14,358 11,024 10,729 (19,450) (19,253) (19,253) (19,253) (18,508) 15,080 5,417 Transfers and subsidies - capital (monetary alloc 59,671 33,353 38,416 61,805 74,836 74,836 74,836 47,348 31,579 31,017 Contributions recognised - capital & contributed as 147 4,470 4,470 4,470 Surplus/(Deficit) after capital transfers & contributions Current Year 2017/ /19 Medium Term Revenue & Expenditure Framework 74,029 44,377 49,292 42,355 60,053 60,053 60,053 28,840 46,659 36,434 Share of surplus/ (deficit) of associate Surplus/(Deficit) for the year 74,029 44,377 49,292 42,355 60,053 60,053 60,053 28,840 46,659 36,434 Capital expenditure & funds sources Capital expenditure 73,372 64,675 63, , , , ,284 78,756 47,110 45,693 Transfers recognised - capital 59,838 36,710 38,828 61,805 74,836 74,836 74,836 47,348 31,579 31,017 Public contributions & donations 4,470 4,470 4,470 Borrow ing 6,687 7,456 11,905 32,244 32,032 32,032 32,032 10,420 Internally generated funds 6,847 20,509 12,278 14,887 18,946 18,946 18,946 20,988 15,532 14,676 Total sources of capital funds 73,372 64,675 63, , , , ,284 78,756 47,110 45,693 Financial position Total current assets 113, , , , , , ,665 98, , ,049 Total non current assets 722, , , , , , , , , ,827 Total current liabilities 89, ,556 81, ,483 87,757 87,757 87,757 88,759 90,071 94,107 Total non current liabilities 210, , , , , , , , , ,065 Community wealth/equity 536, , , , , , , , , ,704 Cash flows Net cash from (used) operating 114,641 60,819 76,981 79,736 82,560 82,560 82,560 53,731 72,045 63,760 Net cash from (used) investing (77,467) (65,569) (62,021) (108,435) (129,783) (129,783) (129,783) (78,754) (47,109) (45,693) Net cash from (used) financing (6,740) (7,270) (7,079) 24,416 24,510 24,510 24,510 2,247 (8,214) (8,165) Cash/cash equivalents at the year end 68,463 56,442 64,323 42,207 41,611 41,611 41,611 18,835 35,556 45,459 Cash backing/surplus reconciliation Cash and inv estments av ailable 78,295 67,169 75,969 52,933 53,256 53,256 53,256 30,480 47,202 57,104 Application of cash and inv estments 45,609 23,463 25,841 18,015 16,743 16,743 16,743 4,977 (6,619) (16,550) Balance - surplus (shortfall) 32,686 43,706 50,128 34,918 36,513 36,513 36,513 25,503 53,820 73,654 Asset management Asset register summary (WDV) 712, , , , , , , , ,182 Depreciation 10,941 24,695 23,097 28,302 28,302 28,302 31,305 31,305 31,305 Renew al of Ex isting Assets 26,086 23,310 23,729 7,109 8,645 8,645 2,000 Repairs and Maintenance 22,368 23,837 27,370 92,854 98,354 98, , , ,610 Free services Cost of Free Basic Serv ices prov ided 12,726 15,350 18,096 17,296 20,696 20,696 26,039 26,039 28,122 30,372 Revenue cost of free services provided 1,434 1,511 1,371 1,415 1,415 1,415 1,391 1,391 1,501 1,620 Households below minimum service level Water: Sanitation/sew erage: Energy : Refuse:
12 Explanatory notes Table A1 - Budget Summary 1. Table A1 is a budget summary and provides a concise overview of the Municipality s budget from all of the major financial perspectives (operating, capital expenditure, financial position, cash flow, and MFMA funding compliance). 2. The table provides an overview of the amounts approved by Council for operating performance, resources deployed to capital expenditure, financial position, cash and funding compliance. 3. Financial management reforms emphasises the importance of the municipal budget being funded. This requires the simultaneous assessment of the Financial Performance, Financial Position and Cash Flow Budgets, along with the Capital Budget. The Budget Summary provides the key information in this regard: a. The operating surplus/deficit (after Total Expenditure) is negative over the MTREF b. Capital expenditure is balanced by capital funding sources, of which i. Transfers recognised is reflected on the Financial Performance Budget; ii. Borrowing is incorporated in the net cash from financing on the Cash Flow Budget and indicates that the repayment of loans exceed the envisaged new borrowing; iii. Internally generated funds are financed from a combination of the current operating surplus and input VAT reclaimed on conditional grants. The amount is incorporated in the Net cash from investing on the Cash Flow Budget. The fact that the municipality s cash flow remains positive, and is improving indicates that the necessary cash resources are available to fund the Capital Budget. 4. The section on Free Services shows that the amount spent on Free Basic Services and the revenue cost of free services provided by the municipality continues to increase. In addition, the municipality continues to make progress in addressing service delivery backlogs. 8
13 Budgeted Financial Performance (Revenue and Expenditure by standard classification) (Table A2) Functional Classification Description 2014/ / /17 Current Year 2017/ /19 Medium Term Revenue & Expenditure Framework R thousand Audited Audited Audited Original Adjusted Full Year Outcome Outcome Outcome Budget Budget Forecast 2018/ / /21 Revenue - Functional Governance and administration 172, , , , , , , , ,786 Executiv e and council 5,501 7,763 7,166 1,150 1,294 1,294 1,130 1,190 1,254 Finance and administration 166, , , , , , , , ,532 Internal audit Community and public safety 64,606 57,321 26,617 79,985 86,806 86,806 71,641 87,405 75,614 Community and social serv ices 6,277 7,171 8,331 7,323 7,323 7,323 9,942 10,489 11,063 Sport and recreation (780) (673) (949) Public safety 11 Housing 59,099 50,823 19,235 72,621 79,441 79,441 61,255 76,869 64,500 Health Economic and environmental services 32,412 41,937 40,751 38,973 44,223 44,223 41,082 44,296 47,669 Planning and development 2,004 5,239 5,086 2,625 3,404 3,404 2,558 2,817 2,874 Road transport 30,408 36,699 35,665 36,348 40,819 40,819 38,524 41,478 44,795 Env ironmental protection Trading services 172, , , , , , , , ,883 Energy sources 75,898 82,783 85,212 87,442 91,942 91,942 88, , ,223 Water management 45,347 51,760 69,465 58,460 67,993 67,993 79,970 86,442 93,407 Waste water management 25,586 30,289 31,703 35,599 34,899 34,899 40,341 43,648 47,192 Waste management 26,111 31,226 34,496 36,439 35,439 35,439 42,785 46,297 50,061 Other Total Revenue - Functional 442, , , , , , , , ,951 Expenditure - Functional Governance and administration 110, , , , , , , , ,407 Executiv e and council 25,448 28,070 29,788 25,328 24,658 24,658 20,851 22,460 24,195 Finance and administration 84,667 91,196 92, , , , , , ,530 Internal audit 1,759 2,197 2,197 2,197 2,312 2,490 2,682 Community and public safety 47,281 63,632 34,200 61,589 66,471 66,471 68,377 72,776 77,468 Community and social serv ices 5,691 6,283 7,732 7,221 7,136 7,136 10,778 11,489 12,250 Sport and recreation 7,114 7,667 7,822 9,647 9,552 9,552 10,772 11,536 12,356 Public safety 764 1,125 5,865 2,968 2,968 2,968 3,239 3,433 3,639 Housing 33,711 48,557 12,781 41,753 46,814 46,814 43,588 46,318 49,222 Health Economic and environmental services 67,258 78,034 82,380 85,249 88,288 88,288 94, , ,509 Planning and development 7,857 9,537 10,025 10,258 11,095 11,095 10,855 11,671 12,552 Road transport 59,395 68,495 72,355 74,686 76,903 76,903 82,989 89,072 95,622 Environmental protection Trading services 143, , , , , , , , ,551 Energy sources 53,175 64,006 69,079 73,346 72,791 72,791 77,609 83,496 89,843 Water management 37,927 42,023 47,714 49,670 49,687 49,687 54,996 58,520 62,312 Waste water management 25,834 28,515 31,127 32,119 32,013 32,013 39,150 41,261 43,529 Waste management 26,708 44,050 44,195 45,956 45,810 45,810 53,119 55,891 58,868 Other Total Expenditure - Functional 368, , , , , , , , ,517 Surplus/(Deficit) for the year 74,029 44,377 49,292 42,355 60,053 60,053 28,840 46,659 36,434 9
14 Explanatory notes to Table A2 - Budgeted Financial Performance (revenue and expenditure by standard classification) 1. Table A2 is an illustration of the budgeted financial performance in relation to revenue and expenditure per standard classification. The modified GFS standard classification divides the municipal services into 15 functional areas. Municipal revenue, operating expenditure and capital expenditure are then classified in terms of each of these functional areas which enable the National Treasury to compile standardised reports. 2. Note the Total Revenue on this table includes capital revenues (Transfers recognised capital) and so does not balance to the operating revenue shown on Table A4. 3. Note that as a general principle the revenues for the Trading Services should exceed their expenditures. The table highlights that this is the case for Electricity, Water and Waste management function. 4. Other functions that show a deficit between revenue and expenditure are being financed from rates revenues and other revenue sources reflected under the Budget and treasury office. 10
15 Budgeted Financial Performance (Revenue and Expenditure by municipal vote) (Table A3) WC031 Theewaterskloof - Table A3 Budgeted Financial Performance (revenue and expenditure by municipal vote) Vote Description 2014/ / /17 R thousand Audited Audited Audited Original Adjusted Full Year Outcome Outcome Outcome Budget Budget Forecast 2018/ / /21 Revenue by Vote Vote 1 - Budget and treasury office 134, , , , , , , , ,093 Vote 2 - Community and social serv ices 6,156 7,171 8,331 7,323 7,323 7,323 9,942 10,489 11,063 Vote 3 - Corporate serv ices 30,089 25,952 21,537 27,628 28,873 28,873 26,688 28,229 28,439 Vote 4 - Electricity 75,847 82,783 85,212 87,442 91,942 91,942 88, , ,223 Vote 5 - Env ironmental protection Vote 6 - Executiv e and council 7,372 9,851 8,074 1,150 1,294 1,294 1,130 1,190 1,254 Vote 7 - Housing 59,099 50,823 19,235 72,621 79,441 79,441 61,255 76,869 64,500 Vote 8 - Planning and dev elopment 2,004 5,239 5,086 2,625 3,404 3,404 2,558 2,817 2,874 Vote 9 - Public safety 25,340 31,275 31,111 30,435 30,435 30,435 32,261 34,840 37,626 Vote 10 - Road transport 5,078 5,423 4,554 5,913 10,384 10,384 6,263 6,638 7,169 Vote 11 - Sport and recreation (780) (673) (949) Vote 12 - Waste management 26,226 31,226 34,496 36,439 35,439 35,439 42,785 46,297 50,061 Vote 13 - Waste water management 25,581 30,289 31,703 35,599 34,899 34,899 40,341 43,648 47,192 Vote 14 - Water 45,445 51,760 69,465 58,460 67,993 67,993 79,970 86,442 93,407 Vote 15 - [NAME OF VOTE 15] Total Revenue by Vote 442, , , , , , , , ,951 Expenditure by Vote to be appropriated Vote 1 - Budget and treasury office 33,168 39,372 40,659 42,933 45,268 45,268 46,719 50,181 53,903 Vote 2 - Community and social serv ices 5,685 6,283 7,732 7,066 6,981 6,981 9,317 9,970 10,670 Vote 3 - Corporate serv ices 16,841 17,298 19,856 64,766 65,539 65,539 78,085 82,742 87,748 Vote 4 - Electricity 53,310 64,006 69,079 73,346 72,791 72,791 77,609 83,496 89,843 Vote 5 - Env ironmental protection Vote 6 - Executiv e and council 56,323 59,226 61,115 41,353 40,784 40,784 38,184 41,136 44,319 Vote 7 - Housing 33,712 48,557 12,781 41,753 46,814 46,814 43,588 46,318 49,222 Vote 8 - Planning and dev elopment 11,512 12,907 12,425 12,263 13,160 13,160 13,116 14,095 15,150 Vote 9 - Public safety 31,451 40,843 47,867 46,486 46,633 46,633 55,854 60,102 64,678 Vote 10 - Road transport 28,700 28,777 30,353 31,167 33,238 33,238 30,374 32,403 34,583 Vote 11 - Sport and recreation 7,109 7,667 7,822 9,647 9,552 9,552 10,772 11,536 12,356 Vote 12 - Waste management 26,722 44,050 44,195 45,956 45,810 45,810 53,119 55,891 58,868 Vote 13 - Waste water management 25,833 28,515 31,127 32,119 32,013 32,013 39,150 41,261 43,529 Vote 14 - Water 37,927 42,023 47,714 49,670 49,687 49,687 54,996 58,520 62,312 Vote 15 - [NAME OF VOTE 15] Total Expenditure by Vote 368, , , , , , , , ,517 Surplus/(Deficit) for the year 74,029 44,377 49,292 42,355 60,053 60,053 28,840 46,659 36,434 Explanatory notes to Table A3 - Budgeted Financial Performance (revenue and expenditure by municipal vote) Function Income R'000 Expenditure R'000 Current Year 2017/18 Admin Charges R' /19 Medium Term Revenue & Expenditure Framework Surplus/(Deficit) R'000 Water 79,970 54,996 10,573 14,401 Electricity 88,413 77,609 4,727 6,076 Waste Water Management 40,341 39,150 4,296 (3,106) Refuse Removal 42,785 53,119 5,162 (15,496) 1. Table A3 illustrates the budgeted financial performance in relation to the revenue and expenditure per municipal vote. This table facilitates the view of the budgeted operating performance in relation to the GFS classification and not necessarily the organisational structure of the Municipality. 11
16 Budgeted Financial Performance (Revenue and Expenditure) (Table A4) R thousand Revenue By Source Description 2014/ / /17 Audited Outcome Audited Outcome Audited Outcome Original Budget Adjusted Budget Full Year Forecast Pre-audit outcome 2018/ / /21 Property rates 68,637 75,778 85,873 94,233 94,233 94,233 94, , , ,345 Serv ice charges - electricity revenue 67,147 73,608 80,098 82,544 82,544 82,544 82,544 85,712 92,569 99,974 Serv ice charges - w ater rev enue 43,869 49,994 59,575 55,916 59,616 59,616 59,616 72,708 78,525 84,807 Serv ice charges - sanitation rev enue 21,395 24,978 25,607 29,771 29,071 29,071 29,071 32,562 35,167 37,980 Serv ice charges - refuse revenue 21,199 25,222 27,527 29,776 28,776 28,776 28,776 34,047 36,770 39,712 Serv ice charges - other 206 2,540 1,120 Rental of facilities and equipment 1,467 1,551 1,658 1,920 1,920 1,920 1,920 2,035 2,198 2,374 Interest earned - external investments 5,134 7,323 7,323 5,500 5,810 5,810 5,810 6,159 6,159 6,159 Interest earned - outstanding debtors 6,430 7,721 9,868 8,000 6,300 6,300 6,300 8,000 8,640 9,331 Div idends receiv ed Fines, penalties and forfeits 25,247 30,983 30,621 30,301 30,301 30,301 30,301 32,119 34,689 37,464 Licences and permits 2,561 2,274 2, Agency services 2,435 2,667 2,865 5,798 5,798 5,798 5,798 6,146 6,638 7,169 Transfers and subsidies 109, ,982 94, , , , , , , ,270 Other rev enue 5,256 18,929 14,441 5,770 7,584 7,584 7,584 6,481 6,870 7,282 Gains on disposal of PPE 1, Total Revenue (excluding capital transfers and contributions) 382, , , , , , , , , ,934 Expenditure By Type Employ ee related costs 138, , , , , , , , , ,610 Remuneration of councillors 8,573 8,939 9,987 11,650 11,628 11,628 11,628 12,179 13,153 14,206 Debt impairment 36,926 48,811 60,300 50,265 50,265 50,265 50,265 57,890 62,522 67,523 Depreciation & asset impairment 10,941 24,695 23,097 28,302 28,302 28,302 28,302 31,305 31,305 31,305 Finance charges 13,237 19,081 18,798 20,105 20,105 20,105 20,105 22,362 22,362 22,362 Bulk purchases 54,670 62,105 67,126 68,206 68,206 68,206 68,206 75,374 81,404 87,916 Other materials 54,532 50,591 50,591 50,591 61,849 65,560 69,494 Contracted serv ices 18,527 20,941 21,083 37,130 48,746 48,746 48,746 44,695 47,377 50,220 Transfers and subsidies 1,351 1,214 2, Other ex penditure 80,572 97,659 67,711 41,569 48,082 48,082 48,082 43,298 45,896 48,650 Loss on disposal of PPE 4,778 5,798 Total Expenditure 368, , , , , , , , , ,517 Surplus/(Deficit) 14,358 11,024 10,729 (19,450) (19,253) (19,253) (19,253) (18,508) 15,080 5,417 Transfers and subsidies - capital (monetary allocations) (National / Provincial and District) 59,671 33,353 38,416 61,805 74,836 74,836 74,836 47,348 31,579 31,017 Transfers and subsidies - capital (monetary allocations) (National / Prov incial Departmental Agencies, Households, Non-profit Institutions, Priv ate Enterprises, Public Corporatons, Higher 147 Transfers and subsidies - capital (in-kind - all) 4,470 4,470 4,470 Surplus/(Deficit) after capital transfers & Current Year 2017/ /19 Medium Term Revenue & Expenditure Framework 74,029 44,377 49,292 42,355 60,053 60,053 60,053 28,840 46,659 36,434 contributions Tax ation Surplus/(Deficit) after taxation 74,029 44,377 49,292 42,355 60,053 60,053 60,053 28,840 46,659 36,434 Attributable to minorities Surplus/(Deficit) attributable to municipality 74,029 44,377 49,292 42,355 60,053 60,053 60,053 28,840 46,659 36,434 Share of surplus/ (deficit) of associate Surplus/(Deficit) for the year 74,029 44,377 49,292 42,355 60,053 60,053 60,053 28,840 46,659 36,434 12
17 Explanatory notes to Table A4 - Budgeted Financial Performance (revenue and expenditure) excluding capital transfers and contributions. 1. Total operating revenue is R 580,022 million in 2018/19 and increases to R 663,951 million by 2020/2021. This represents an increase of 9.4 per cent for the 2019/20 and 4.6 per cent for the 2020/2021 financial year. 2. Revenue to be generated from property rates is R 100,604 million in the 2018/19 financial year and increases to R 108,652 million by 2019/20 which represents 17 per cent of the operating revenue base of the Municipality and therefore remains a significant funding source for the municipality. 3. Services charges relating to electricity, water, sanitation and refuse removal constitutes the biggest component of the revenue basket of the Municipality totaling R 225,028 million for the 2018/19 financial year and increasing to R 243,031 million by 2020/2021. For the 2018/19 financial year services charges amount to 39 per cent of the total revenue base. 4. Transfers recognised operating includes the local government equitable share and other operating grants from national and provincial government. 5. Employee related costs and bulk purchases are the main cost drivers within the municipality. 13
18 Budgeted Capital Expenditure by vote, standard classification and funding (Table A5) WC031 Theewaterskloof - Table A5 Budgeted Capital Expenditure by vote, functional classification and funding R thousand Vote Description 2014/ / /17 Audited Outcome Audited Outcome Audited Outcome Original Budget Current Year 2017/18 Adjusted Budget Full Year Forecast Pre-audit outcome 2018/19 Medium Term Revenue & Expenditure 2018/19 Framework / /21 Capital expenditure - Vote Multi-year expenditure to be appropriated Vote 1 - Budget and treasury office Vote 2 - Community and social serv ices Vote 3 - Corporate serv ices Vote 4 - Electricity 2,342 3,450 3,840 3,840 3, Vote 5 - Env ironmental protection Vote 6 - Ex ecutiv e and council Vote 7 - Housing 29,555 7,069 11,395 Vote 8 - Planning and dev elopment Vote 9 - Public safety Vote 10 - Road transport 195 9,194 9,951 9,951 9, ,632 Vote 11 - Sport and recreation 10,303 Vote 12 - Waste management 1,030 Vote 13 - Waste w ater management 4,366 17,032 17,032 17,032 17,032 18,686 16,440 19,583 Vote 14 - Water 219 3,326 4,042 4,042 4,042 3,836 1,296 Vote 15 - [NAME OF VOTE 15] Capital multi-year expenditure sub-total 42,214 7,069 17,709 33,002 34,865 34,865 34,865 23,565 21,018 20,383 Single-year expenditure to be appropriated Vote 1 - Budget and treasury office Vote 2 - Community and social serv ices Vote 3 - Corporate serv ices 477 1,657 5,006 5,894 5,894 5,894 2,403 Vote 4 - Electricity 5,264 13,081 11,520 10,559 11,317 11,317 11,317 3,350 7,698 7,150 Vote 5 - Env ironmental protection Vote 6 - Ex ecutiv e and council 2,095 6,720 2,939 1,813 2,000 2,000 2,000 3, Vote 7 - Housing 36,381 37,760 37,760 37,760 24,100 Vote 8 - Planning and dev elopment Vote 9 - Public safety ,084 1,694 1,694 1,694 6,300 Vote 10 - Road transport 3,303 3, ,097 5,097 5, Vote 11 - Sport and recreation 166 3,199 1,346 1,600 1,103 1,103 1,103 1, Vote 12 - Waste management 3,000 1,870 4,518 2,660 2,660 2,660 10,734 11,619 7,272 Vote 13 - Waste w ater management 16,039 18,857 16,870 2,273 2,273 2,273 3,509 Vote 14 - Water 2,526 6,581 9,163 13,904 24,867 24,867 24,867 2,500 5,351 6,579 Vote 15 - [NAME OF VOTE 15] Capital single-year expenditure sub-total 31,158 57,605 45,302 75,934 95,420 95,420 95,420 55,191 26,092 25,310 Total Capital Expenditure - Vote 73,372 64,675 63, , , , ,284 78,756 47,110 45,693 Capital Expenditure - Functional Governance and administration 3,331 8,703 3,796 6,862 7,936 7,936 7,936 6, Ex ecutiv e and council 1,762 1,377 1,524 Finance and administration 1,570 7,327 2,271 6,862 7,936 7,936 7,936 6, Internal audit Community and public safety 40,409 10,935 13,481 38,382 39,540 39,540 39,540 26, Community and social serv ices Sport and recreation 10,469 3,199 1,346 1,600 1,103 1,103 1,103 1, Public safety Housing 29,555 7,069 11,395 36,381 37,760 37,760 37,760 24,100 Health Economic and environmental services 3,461 3, ,904 16,777 16,777 16,777 7,277 2,632 Planning and dev elopment Road transport 3,303 3, ,904 16,742 16,742 16,742 7,277 2,632 Env ironmental protection Trading services 26,171 41,519 45,038 52,789 66,031 66,031 66,031 39,272 43,054 44,893 Energy sources 7,606 13,081 11,520 14,009 15,157 15,157 15,157 3,515 8,348 7,950 Water management 2,526 6,581 9,382 17,230 28,909 28,909 28,909 6,336 6,647 6,579 Waste w ater management 16,039 18,857 21,236 17,032 19,305 19,305 19,305 18,686 16,440 23,091 Waste management 3,000 2,899 4,518 2,660 2,660 2,660 10,734 11,619 7,272 Other Total Capital Expenditure - Functional 73,372 64,675 63, , , , ,284 78,756 47,110 45,693 Funded by: National Gov ernment 29,598 29,331 25,982 25,424 34,341 34,341 34,341 22,489 31,579 31,017 Provincial Government 30,240 7,379 11,405 36,381 40,495 40,495 40,495 24,859 District Municipality Other transfers and grants 1,442 Transfers recognised - capital 59,838 36,710 38,828 61,805 74,836 74,836 74,836 47,348 31,579 31,017 Public contributions & donations 4,470 4,470 4,470 Borrowing 6,687 7,456 11,905 32,244 32,032 32,032 32,032 10,420 Internally generated funds 6,847 20,509 12,278 14,887 18,946 18,946 18,946 20,988 15,532 14,676 Total Capital Funding 73,372 64,675 63, , , , ,284 78,756 47,110 45,693 14
19 Explanatory notes to Table A5 - Budgeted Capital Expenditure by vote, standard classification and funding source 1. Table A5 is a breakdown of the capital programme in relation to capital expenditure by municipal vote (multi-year and single-year appropriations); capital expenditure by standard classification; and the funding sources necessary to fund the capital budget, including information on capital transfers from national and provincial departments. 2. The MFMA provides that a municipality may approve multi-year or single-year capital budget appropriations. The capital budget of 2018/19 makes provision for an amount of R 78,756 million. This allocation decrease to R 47,110 million in 2019/20 and R 45,693 million in 2020/ The capital programme is funded from National and Provincial grants, which includes Municipal Infrastructure Grant, National Electrification Grant and Housing, borrowing and internally generated funds from current year surpluses. For 2018/19, capital transfers (excluding VAT) totals R 47,348 million (36.7 per cent) and decrease to R 31,017 million by 2020/21. Borrowing has been provided at R 10,420 million for the 2018/19 financial year. Internally generated funding totaling R 20,988 million for 2018/2019 and R 14,676 million for 2020/2021. These funding sources are further discussed in detail in section 11 (Overview of Budget Funding). 15
20 Budgeted Financial Position (Table A6) Description 2014/ / /17 Current Year 2017/ /19 Medium Term Revenue & Expenditure Framework R thousand Audited Audited Audited Original Adjusted Full Year Pre-audit Outcome Outcome Outcome Budget Budget Forecast outcome 2018/ / /21 ASSETS Current assets Cash 17,754 5,912 26,290 2,207 9,578 9,578 9,578 6,802 23,523 33,425 Call inv estment deposits 50,709 50,530 38,033 40,000 32,033 32,033 32,033 12,033 12,033 12,033 Consumer debtors 35,441 24,727 29,697 50,737 43,094 43,094 43,094 54,705 67,245 80,788 Other debtors 4,508 22,232 15,616 3,191 17,896 17,896 17,896 20,312 22,922 25,740 Current portion of long-term receiv ables Inv entory 4,848 5,739 5,063 5,739 5,063 5,063 5,063 5,063 5,063 5,063 Total current assets 113, , , , , , ,665 98, , ,049 Non current assets Long-term receivables Inv estments 9,832 10,726 11,645 10,726 11,645 11,645 11,645 11,645 11,645 11,645 Inv estment property 67,596 67,514 66,767 59,040 66,206 66,206 66,206 65,755 65,253 64,752 Inv estment in Associate Property, plant and equipment 644, , , , , , , , , ,623 Agricultural Biological Intangible 292 1,631 1,406 1,473 1,325 1,325 1,325 1, Other non-current assets Total non current assets 722, , , , , , , , , ,827 TOTAL ASSETS 835, , , ,699 1,004,849 1,004,849 1,004,849 1,043,550 1,091,225 1,131,876 LIABILITIES Current liabilities Bank ov erdraft Borrow ing 7,626 7,486 8,189 9,813 10,282 10,282 10,282 10,450 9,719 8,990 Consumer deposits 3,893 4,297 4,705 4,829 4,829 4,829 4,829 5,118 5,425 5,751 Trade and other pay ables 62,382 51,705 49,239 57,538 51,770 51,770 51,770 51,062 51,471 54,503 Prov isions 15,799 43,067 19,695 49,303 20,876 20,876 20,876 22,129 23,456 24,864 Total current liabilities 89, ,556 81, ,483 87,757 87,757 87,757 88,759 90,071 94,107 Non current liabilities Borrow ing 102,924 95,389 87, , , , , , ,493 95,731 Prov isions 107,287 82, ,158 99, , , , , , ,334 Total non current liabilities 210, , , , , , , , , ,065 TOTAL LIABILITIES 299, , , , , , , , , ,172 NET ASSETS 536, , , , , , , , , ,704 COMMUNITY WEALTH/EQUITY Accumulated Surplus/(Deficit) 520, , , , , , , , , ,318 Reserv es 15,721 8,599 13,386 4,868 13,386 13,386 13,386 13,386 13,386 13,386 TOTAL COMMUNITY WEALTH/EQUITY 536, , , , , , , , , ,704 Explanatory notes to Table A6 - Budgeted Financial Position 1. Table A6 is consistent with the standards of Generally Recognized Accounting Practice (GRAP), as with the financial Statements, and improves understandability of the impact of the budget on the statement of financial position (balance sheet). 2. This format of presenting the statement of financial position is aligned to GRAP1, which is generally aligned to the international version which presents Assets less Liabilities as accounting Community Wealth. The order of items within each group illustrates items in order of liquidity; i.e. assets readily convertible into cash, or liabilities immediately required to be met from cash, appear first. 16
21 3. Table A6 is supported by an extensive table of notes (SA3 which can be found on page 124) providing a detailed analysis of the major components of a number of items, including: Call investments deposits; Consumer debtors; Property, plant and equipment; Trade and other payables; Provisions non-current; Changes in net assets; and Reserves 4. The municipal equivalent of equity is Community Wealth/Equity. The justification is that ownership and the net assets of the municipality belong to the community. 5. Any movement on the Budgeted Financial Performance or the Capital Budget will inevitably impact on the Budgeted Financial Position. As an example, the collection rate assumption will impact on the cash position of the municipality and subsequently inform the level of cash and cash equivalents at year end. Similarly, the collection rate assumption should inform the budget appropriation for debt impairment which in turn would impact on the provision for bad debt. These budget and planning assumptions form a critical link in determining the applicability and relevance of the budget as well as the determination of ratios and financial indicators. In addition the funding compliance assessment is informed directly by forecasting the statement of financial position. 17
22 Budgeted Cash Flows (Table A7) Description 2014/ / /17 Current Year 2017/ /19 Medium Term Revenue & Expenditure Framework R thousand Audited Audited Audited Original Adjusted Full Year Pre-audit Outcome Outcome Outcome Budget Budget Forecast outcome 2018/ / /21 CASH FLOW FROM OPERATING ACTIVITIES Receipts Property rates 64,247 73,631 79,640 84,809 81,595 81,595 81,595 87,112 94, ,608 Service charges 129, , , , , , , , , ,274 Other rev enue 22,117 14,447 26,852 20,210 20,022 20,022 20,022 19,665 21,108 22,660 Gov ernment - operating 74,026 78,618 98, , , , , , , ,270 Gov ernment - capital 109,995 76,425 38,416 61,805 78,323 78,323 78,323 47,348 31,579 31,017 Interest 11,607 7,323 7,323 9,500 11,265 11,265 11,265 13,086 13,640 14,238 Div idends Payments Suppliers and employ ees (284,008) (337,220) (332,146) (393,454) (400,098) (400,098) (400,098) (441,358) (471,896) (503,291) Finance charges (11,877) (11,206) (10,336) (10,527) (10,527) (10,527) (10,527) (12,783) (12,783) (12,783) Transfers and Grants (1,351) (1,214) (2,285) (110) (140) (140) (140) (232) (232) (232) NET CASH FROM/(USED) OPERATING ACTIVITIES 114,641 60,819 76,981 79,736 82,560 82,560 82,560 53,731 72,045 63,760 CASH FLOWS FROM INVESTING ACTIVITIES Receipts Proceeds on disposal of PPE 5,755 1, Decrease (Increase) in non-current debtors Decrease (increase) other non-current receivables (453) Decrease (increase) in non-current investments (9,642) (894) (919) Payments Capital assets (73,127) (64,675) (63,010) (108,936) (130,284) (130,284) (130,284) (78,756) (47,110) (45,693) NET CASH FROM/(USED) INVESTING ACTIVITIES (77,467) (65,569) (62,021) (108,435) (129,783) (129,783) (129,783) (78,754) (47,109) (45,693) CASH FLOWS FROM FINANCING ACTIVITIES Receipts Short term loans Borrowing long term/refinancing 32,244 32,032 32,032 32,032 10,420 Increase (decrease) in consumer deposits Payments Repay ment of borrow ing (6,973) (7,675) (7,486) (8,102) (7,645) (7,645) (7,645) (8,463) (8,521) (8,491) NET CASH FROM/(USED) FINANCING ACTIVITIES (6,740) (7,270) (7,079) 24,416 24,510 24,510 24,510 2,247 (8,214) (8,165) NET INCREASE/ (DECREASE) IN CASH HELD 30,435 (12,020) 7,881 (4,283) (22,713) (22,713) (22,713) (22,776) 16,721 9,902 Cash/cash equivalents at the year begin: 38,028 68,463 56,442 46,489 64,323 64,323 64,323 41,611 18,835 35,556 Cash/cash equivalents at the year end: 68,463 56,442 64,323 42,207 41,611 41,611 41,611 18,835 35,556 45,459 Explanatory notes to Table A7 - Budgeted Cash Flow Statement 1. The budgeted cash flow statement is the first measurement in determining if the budget is funded. 2. It shows the expected level of cash in-flow versus cash out-flow that is likely to result from the implementation of the budget. 3. Cash and cash equivalents totals R 18,835 million for 2018/19 financial year and increase to R 45,459 million by the end of 2020/21. 18
23 Cash Backed reserves/accumulated surplus reconciliation (Table A8) R thousand Description 2014/ / /17 Audited Outcome Audited Outcome Audited Outcome Original Budget Current Year 2017/18 Adjusted Budget Full Year Forecast Pre-audit outcome 2018/19 Medium Term Revenue & 2018/19 Expenditure Framework / /21 Cash and investments available Cash/cash equivalents at the year end 68,463 56,442 64,323 42,207 41,611 41,611 41,611 18,835 35,556 45,459 Other current inv estments > 90 day s 0 (0) (0) Non current assets - Investments 9,832 10,726 11,645 10,726 11,645 11,645 11,645 11,645 11,645 11,645 Cash and investments available: 78,295 67,169 75,969 52,933 53,256 53,256 53,256 30,480 47,202 57,104 Application of cash and investments Unspent conditional transfers 10,497 5,259 9,825 2, Unspent borrow ing Statutory requirements Other working capital requirements 19,390 9,604 2,631 10,201 2,380 2,380 2,380 (9,386) (20,981) (30,912) Other prov isions Long term inv estments committed Reserves to be backed by cash/inv estments 15,721 8,599 13,386 4,868 13,386 13,386 13,386 13,386 13,386 13,386 Total Application of cash and investments: 45,609 23,463 25,841 18,015 16,743 16,743 16,743 4,977 (6,619) (16,550) Surplus(shortfall) 32,686 43,706 50,128 34,918 36,513 36,513 36,513 25,503 53,820 73,654 Explanatory notes to Table A8 - Cash Backed Reserves/Accumulated Surplus Reconciliation 1. The cash backed reserves/accumulated surplus reconciliation is aligned to the requirements of MFMA Circular 42 Funding a Municipal Budget. 2. In essence the table evaluates the funding levels of the budget by firstly forecasting the cash and investments at year end and secondly reconciling the available funding to the liabilities/commitments that exist. 3. The outcome of this exercise would either be a surplus or deficit. A deficit would indicate that the applications exceed the cash and investments available and would be indicative of noncompliance with the MFMA requirements that the municipality s budget must be funded. 4. Non-compliance with section 18 of the MFMA is assumed because a shortfall would indirectly indicate that the annual budget is not appropriately funded. 5. From the table it can be seen that the situation improve from R 25,503 million surplus to R 73,654 million surplus. 19
24 Asset Management (Table A9) Description 2014/ / /17 Current Year 2017/ /19 Medium Term Revenue & Expenditure Framework R thousand Audited Outcome Audited Outcome Audited Outcome Original Budget Adjusted Budget Full Year Forecast 2018/ / /21 CAPITAL EXPENDITURE Total New Assets 47,286 41,364 39,281 65,934 82,831 82,831 53,338 18,759 18,160 Roads Infrastructure ,052 22,825 22,825 7,002 Storm water Infrastructure 7,069 11,598 10,000 11,922 11,922 6,025 2,632 Electrical Infrastructure 3,764 10,386 6,534 1,000 1,300 1, Water Supply Infrastructure 3,816 13,596 23,173 29,282 29,282 9,861 3,051 6,579 Sanitation Infrastructure 8,514 10,344 10,816 10,816 8,959 3,509 Solid Waste Infrastructure 29,555 1,030 4,518 2,660 2,660 10,734 11,619 7,272 Rail Infrastructure Coastal Infrastructure Information and Communication Infrastructure Infrastructure 33,320 30,557 33,454 63,087 78,806 78,806 42,581 17,959 17,360 Community Facilities 171 1, Sport and Recreation Facilities 10,303 1, Community Assets 10,475 1,112 1, Heritage Assets Rev enue Generating Non-rev enue Generating Investment properties Operational Buildings ,300 Housing Other Assets ,300 Biological or Cultivated Assets Serv itudes Licences and Rights Intangible Assets Computer Equipment Furniture and Office Equipment 3,218 4,775 2,734 1, Machinery and Equipment 1,365 1,754 1,754 3, Transport Assets 96 4,610 1, Libraries Zoo's, Marine and Non-biological Animals Total Renewal of Existing Assets 26,086 23,310 23,729 7,109 8,645 8,645 2,000 Roads Infrastructure 3,303 2,746 Storm water Infrastructure Electrical Infrastructure 3,522 2,370 3,433 2,947 3,485 3,485 Water Supply Infrastructure 2,526 2,765 18,297 Sanitation Infrastructure 16,039 10, Solid Waste Infrastructure 3,000 1,870 Rail Infrastructure Coastal Infrastructure Information and Communication Infrastructure Infrastructure 25,390 21,223 23,729 2,947 3,485 3,485 Community Facilities Sport and Recreation Facilities 2,087 Community Assets 2, Heritage Assets Rev enue Generating Non-rev enue Generating Investment properties Operational Buildings 696 Housing Other Assets 696 Biological or Cultivated Assets Serv itudes Licences and Rights Intangible Assets Computer Equipment Furniture and Office Equipment Machinery and Equipment Transport Assets 3,727 4,447 4,447 2,000 Libraries Zoo's, Marine and Non-biological Animals 20
25 Description 2014/ / /17 Current Year 2017/ /19 Medium Term Revenue & Expenditure Framework R thousand CAPITAL EXPENDITURE Audited Outcome Audited Outcome Audited Outcome Original Budget Adjusted Budget Full Year Forecast 2018/ / /21 Total Upgrading of Existing Assets 35,894 38,808 38,808 23,418 28,352 27,533 Roads Infrastructure Storm water Infrastructure 4,035 Electrical Infrastructure 10,062 10,372 10,372 3,515 7,690 7,950 Water Supply Infrastructure 2,851 8,259 8,259 2,500 3,596 Sanitation Infrastructure 15,481 17,391 17,391 15,753 16,440 19,583 Solid Waste Infrastructure Rail Infrastructure Coastal Infrastructure Information and Communication Infrastructure Infrastructure 32,956 36,548 36,548 21,768 27,727 27,533 Community Facilities Sport and Recreation Facilities 1, , Community Assets 1,951 1,313 1,313 1, Heritage Assets Rev enue Generating 50 Non-rev enue Generating Investment properties 50 Operational Buildings Housing Other Assets Biological or Cultivated Assets Serv itudes Licences and Rights Intangible Assets Computer Equipment Furniture and Office Equipment Machinery and Equipment Transport Assets Libraries Zoo's, Marine and Non-biological Animals Total Capital Expenditure Roads Infrastructure 3,303 3, ,579 23,351 23,351 7,002 Storm water Infrastructure 7,069 11,598 14,035 11,922 11,922 6,025 2,632 Electrical Infrastructure 7,287 12,756 9,967 14,009 15,157 15,157 3,515 8,348 7,950 Water Supply Infrastructure 2,526 6,581 31,893 26,023 37,542 37,542 12,361 6,647 6,579 Sanitation Infrastructure 16,039 18, ,826 28,207 28,207 24,711 16,440 23,091 Solid Waste Infrastructure 29,555 3,000 2,899 4,518 2,660 2,660 10,734 11,619 7,272 Rail Infrastructure Coastal Infrastructure Information and Communication Infrastructure Infrastructure 58,710 51,780 57,183 98, , ,839 64,349 45,685 44,893 Community Facilities 171 1, Sport and Recreation Facilities 10,303 3,199 1,600 1,103 1,103 1, Community Assets 10,475 3,199 1,850 2,001 1,960 1,960 1, Heritage Assets Rev enue Generating 50 Non-rev enue Generating Investment properties 50 Operational Buildings ,300 Housing Other Assets ,300 Biological or Cultivated Assets Serv itudes Licences and Rights Intangible Assets Computer Equipment Furniture and Office Equipment 3,218 4,775 2,734 1,481 1,290 1, Machinery and Equipment 1,681 2,168 2,168 3, Transport Assets 96 4,610 1,243 3,727 4,447 4,447 2,503 Libraries Zoo's, Marine and Non-biological Animals TOTAL CAPITAL EXPENDITURE - Asset class 73,372 64,675 63, , , ,284 78,756 47,110 45,693 21
26 Description 2014/ / /17 Current Year 2017/ /19 Medium Term Revenue & Expenditure Framework R thousand CAPITAL EXPENDITURE Audited Outcome Audited Outcome Audited Outcome Original Budget Adjusted Budget Full Year Forecast 2018/ ASSET REGISTER SUMMARY - PPE (WDV) Roads Infrastructure 67,408 68, ,815 88, , , , , ,106 Storm w ater Infrastructure 16,852 17,050 18,870 25,109 30,564 30,564 36,251 38,545 38,207 Electrical Infrastructure 46,668 58,309 94,435 81, , , , , ,590 Water Supply Infrastructure 110, , , , , , , , ,422 Sanitation Infrastructure 129, , , , , , , , ,040 Solid Waste Infrastructure 147, ,064 20, ,526 13,591 13,591 14,253 15,800 13,000 Rail Infrastructure Coastal Infrastructure Information and Communication Infrastructure Infrastructure 518, , , , , , , , ,366 Community Facilities ,830 1,077 1, Sport and Recreation Facilities 1,600 1,103 1,103 2,703 3,328 3,318 Community Assets ,430 2,180 2,180 3,419 3,684 3,323 Heritage Assets Revenue Generating 67,596 67,514 66,767 59,040 66,206 66,206 65,755 65,253 64,752 Non-rev enue Generating Investment properties 67,596 67,514 66,767 59,040 66,206 66,206 65,755 65,253 64,752 Operational Buildings 95,967 97,807 92,524 83,671 87,318 87,318 86,704 79,790 72,876 Housing Other Assets 95,967 97,807 92,524 83,671 87,318 87,318 86,704 79,790 72,876 Biological or Cultivated Assets Serv itudes Licences and Rights 292 1,631 1,406 1,473 1,325 1,325 1, Intangible Assets 292 1,631 1,406 1,473 1,325 1,325 1, Computer Equipment 2,496 2,992 3,350 3,056 3,981 3, ,160 Furniture and Office Equipment 3,271 3,836 3,982 4,888 4,825 4,825 5,233 5,233 5,233 Machinery and Equipment 4,852 5,609 5,133 5,797 6,954 6,954 10,500 11,300 12,100 Transport Assets 18,836 18,421 22,367 23,510 26,062 26,062 28,565 24,565 20,565 Libraries Zoo's, Marine and Non-biological Animals TOTAL ASSET REGISTER SUMMARY - PPE (WDV) 712, , , , , , , , ,182 EXPENDITURE OTHER ITEMS Depreciation 10,941 24,695 23,097 28,302 28,302 28,302 31,305 31,305 31,305 Repairs and Maintenance by Asset Class 22,368 23,837 27,370 92,854 98,354 98, , , ,610 Roads Infrastructure 5,946 5,122 5,617 20,142 22,092 22,092 22,348 24,003 25,783 Storm w ater Infrastructure Electrical Infrastructure 976 1,360 1,057 10,730 9,768 9,768 8,908 9,527 10,191 Water Supply Infrastructure 1,928 1,956 2,058 17,432 17,579 17,579 17,491 18,762 20,126 Sanitation Infrastructure 2,198 2,226 2,089 15,082 15,138 15,138 17,806 19,096 20,481 Solid Waste Infrastructure ,005 1,800 1,800 2,246 2,381 2,524 Rail Infrastructure Coastal Infrastructure Information and Communication Infrastructure Infrastructure 11,152 10,772 10,885 65,392 66,377 66,377 68,799 73,769 79,104 Community Facilities 1,006 1, ,177 9,006 9,006 11,722 12,558 13,455 Sport and Recreation Facilities ,147 1,215 1,288 Community Assets 1,006 1, ,998 9,797 9,797 12,869 13,774 14,743 Heritage Assets Rev enue Generating Non-rev enue Generating Investment properties Operational Buildings 6,267 7,423 10,154 7,157 6,961 6,961 10,464 11,143 11,867 Housing Other Assets 6,267 7,423 10,154 7,157 6,961 6,961 10,464 11,143 11,867 Biological or Cultivated Assets Serv itudes Licences and Rights 3,800 6,800 6,800 4,242 4,497 4,766 Intangible Assets 3,800 6,800 6,800 4,242 4,497 4,766 Computer Equipment Furniture and Office Equipment Machinery and Equipment 1,134 1,103 1,103 1,332 1,412 1,496 Transport Assets 3,812 4,528 5,374 5,071 6,717 6,717 6,497 6,886 7,300 Libraries Zoo's, Marine and Non-biological Animals TOTAL EXPENDITURE OTHER ITEMS 33,309 48,532 50, , , , , , , / /21 Renewal and upgrading of Existing Assets as % of total capex 35.6% 36.0% 37.7% 39.5% 36.4% 36.4% 32.3% 60.2% 60.3% Renewal and upgrading of Existing Assets as % of deprecn 238.4% 94.4% 102.7% 151.9% 167.7% 167.7% 81.2% 90.6% 87.9% R&M as a % of PPE 3.5% 3.5% 3.8% 11.4% 12.0% 12.0% 12.1% 12.7% 13.3% Renewal and upgrading and R&M as a % of PPE 7.0% 6.0% 7.0% 16.0% 16.0% 16.0% 14.0% 15.0% 15.0% 22
27 Explanatory notes to Table A9 - Asset Management 1. Table A9 provides an overview of municipal capital allocations to building new assets and the renewal of existing assets, as well as spending on repairs and maintenance by asset class. 2. National Treasury has recommended that municipalities should allocate at least 40 per cent of their capital budget to the renewal of existing assets, and allocations to repairs and maintenance should be 8 per cent of PPE. The 2018/19 final capital budget allocation for renewal of existing assets amounts to 32.3% which is marginally below the National treasury requirement. The recommendation on repairs and maintenance are met as the repairs and maintenance spends as a percentage of written down value of assets is 12.1%. The reasons for the compliance to this National Treasury guideline are due to the implementation of mscoa where the repairs and maintenance is allocated to projects which include all components related to repairs and maintenance. Repairs and maintenance expenditure will also gradually increase to above the guideline levels of 8%. The spending should also be aligned with the municipality s maintenance plans with regard to affordability and other priorities. 23
28 Basic Service Delivery measurement (Table A10) Household service targets Description 2014/ / /17 Outcome Outcome Outcome Original Budget Adjusted Budget Full Year Forecast 2018/ /20 Water: Piped water inside dwelling 26,383 26,383 26,383 26,383 26,383 26,383 27,175 27,990 28,807 Piped water inside yard (but not in dwelling) 5,283 5,283 5,283 5,283 5,283 5,283 5,441 5,604 5,772 Using public tap (at least min.service level) 5,432 5,432 5,432 5,432 5,432 5,432 6,865 7,071 7,258 Other w ater supply (at least min.serv ice lev el) Minimum Service Level and Above sub-total 37,098 37,098 37,098 37,098 37,098 37,098 39,481 40,665 41,837 Using public tap (< min.serv ice lev el) Other w ater supply (< min.serv ice lev el) No w ater supply Below Minimum Serv ice Level sub-total Total number of households 37,227 37,227 37,227 37,227 37,227 37,227 39,481 40,665 41,837 Sanitation/sewerage: Flush toilet (connected to sewerage) 14,941 14,941 14,941 14,941 14,941 14,941 15,390 15,851 16,168 Flush toilet (with septic tank) 11,994 11,994 11,994 11,994 11,994 11,994 12,354 12,725 12,725 Chemical toilet Pit toilet (v entilated) Other toilet provisions (> min.service level) 4,388 4,388 4,388 4,388 4,388 4,388 Minimum Service Level and Above sub-total 31,538 31,538 31,538 31,538 31,538 31,538 27,744 28,576 28,893 Bucket toilet Other toilet provisions (< min.service level) No toilet prov isions Below Minimum Serv ice Level sub-total Total number of households 31,767 31,767 31,767 31,767 31,767 31,767 27,744 28,576 28,893 Energy: Electricity (at least min.serv ice lev el) Electricity - prepaid (min.serv ice level) 6,901 6,901 6,901 6,901 6,901 6,901 Minimum Service Level and Above sub-total ,721 7,721 7,721 7,721 7,721 7,721 Electricity (< min.serv ice lev el) Electricity - prepaid (< min. serv ice lev el) Other energy sources Below Minimum Serv ice Lev el sub-total Total number of households ,721 7,721 7,721 7,721 7,721 7,721 Refuse: Removed at least once a week 33,980 33,980 33,980 39,800 40,000 41,110 Minimum Service Level and Above sub-total 33,980 33,980 33,980 39,800 40,000 41,110 Removed less frequently than once a week Using communal refuse dump Using ow n refuse dump Other rubbish disposal No rubbish disposal Below Minimum Serv ice Level sub-total Total number of households ,980 33,980 33,980 39,800 40,000 41,110 Households receiving Free Basic Service Water (6 kilolitres per household per month) Sanitation (free minimum lev el serv ice) Electricity /other energy (50kw h per household per month) Refuse (remov ed at least once a w eek) Cost of Free Basic Services provided - Formal Settlements (R'000) Water (6 kilolitres per indigent household per month) 1,474 1,769 2,604 2,544 4,244 4,244 7,262 7,843 8,470 Sanitation (free sanitation serv ice to indigent households) 4,386 5,320 6,096 5,823 6,523 6,523 7,773 8,395 9,067 Electricity /other energy (50kw h per indigent household per month) 2,071 2,285 2,449 2,266 2,266 2,266 2,266 2,447 2,643 Refuse (removed once a week for indigent households) 4,794 5,975 6,947 6,663 7,663 7,663 8,738 9,437 10,192 Cost of Free Basic Services provided - Informal Formal Settlements (R'000) Total cost of FBS provided 12,726 15,350 18,096 17,296 20,696 20,696 26,039 28,122 30,372 Highest level of free service provided per household Property rates (R value threshold) 100, , , , , , , , ,000 Water (kilolitres per household per month) Sanitation (kilolitres per household per month) Sanitation (Rand per household per month) Electricity (kwh per household per month) Refuse (av erage litres per w eek) Revenue cost of subsidised services provided (R'000) Current Year 2017/ /19 Medium Term Revenue & Expenditure Framework Property rates (tariff adjustment) ( impermissable values per section 17 of MPRA) Property rates ex emptions, reductions and rebates and impermissable values in excess of section 17 of MPRA) 1,419 1,496 1,356 1,400 1,400 1,400 1,376 1,486 1,605 Water (in excess of 6 kilolitres per indigent household per month) Sanitation (in excess of free sanitation service to indigent households) Electricity /other energy (in excess of 50 kwh per indigent household per month) Refuse (in excess of one removal a week for indigent households) Municipal Housing - rental rebates Housing - top structure subsidies Other Total revenue cost of subsidised services provided 1,434 1,511 1,371 1,415 1,415 1,415 1,391 1,501 1, /21 24
29 Explanatory notes to Table A10 - Basic Service Delivery Measurement 1. Table A10 provides an overview of service delivery levels, including backlogs (below minimum service level), for each of the main services. 2. The Municipality continues to make good progress with the eradication of backlogs: a. Water services b. Sanitation services c. Electricity services d. Refuse services 3. It is anticipated that these Free Basic Services will cost the municipality R 26,039 million in 2018/19, increasing to R 30,372 million in 2020/21. This is covered by the municipality s equitable share allocation from national government. The budgeted amount does not include the cost of R 4,960 million for the ±5046 informal settlements. 4. The Threshold to receive FBE in Theewaterskloof is two times the state old age pension. This threshold was decided on after taking into account the socio-economic and other conditions presently prevalent in the Theewaterskloof Municipal area. The methodology behind this threshold is viewed to be one that is practical, fair, equitable, and justifiable and it does not alienate any group of households. The old age pension is viewed as a relatively accurate measurement of poverty and affordability of municipal services. Decreasing the threshold will in any event result in an escalation of bad debt. 25
30 6. Overview of Annual Budget Process Political oversight of the budget process Section 53 (1) of the MFMA stipulates that the mayor of a municipality must provide general political guidance over the budget process and the priorities that guide the preparation of the budget. In addition Chapter 2 of the Municipal Budget and Reporting Regulations, gazetted on 17 April 2009, states that the Mayor of a municipality must establish a Budget Steering Committee to provide technical assistance to the Mayor in discharging the responsibilities set out in section 53 of the Act. The Budget Steering Committee consists of the Executive Mayor (chairperson), councillors and the Municipal Manager and senior officials of the Municipality advising the committee members. The primary aims of the Budget Steering Committee are to ensure: That the process followed to compile the budget complies with legislation That there is proper alignment between the policy and service delivery priorities set out in the Theewaterskloof Municipality s IDP and the budget, taking into account the need to protect the financial sustainability of the municipality That the municipality s revenue and tariff setting strategies ensure that the cash resources needed to deliver services are available; and That the various spending priorities of the different municipal departments are properly evaluated and prioritised in the allocation of resources. Budget guidelines were developed by the Budget and Treasury Office and submitted and approved by the Budget Steering Committee. Various Budget Steering Committee meetings where held where the draft budget was discussed. These meetings were held as follows: o 07 December 2017 o 31 January 2018 o 1,5,6 & 12 March 2018 o 11 May 2018 Section 21(1) of the MFMA states that the Mayor of a municipality must co-ordinate the processes for preparing the annual budget and for reviewing the municipality s Integrated Development Plan and budget related policies to ensure that the tabled budget and any revisions of the Integrated Development Plan and budget-related policies are mutually consistent and credible. Furthermore, this section also states that the Mayor must at least 10 months before the start of the budget year, table in municipal council, a time schedule outlining key deadlines for the preparation, tabling and approval of the annual budget. Schedule of Key Deadlines relating to budget process [MFMA s21 (1) (b)] The IDP and Budget time schedule of the 2018/2019 budget cycle was approved by Council in 23 August 2017, ten months before the start of the budget year in compliance with legislative directives. Process used to integrate the review of the IDP and preparation of the Budget Updating the IDP and Budget is an evolving and re-iterative process over a 10 month period. The initial parallel process commenced with the consultative process of the IDP in 2017 and the update of the MTREF to determine the affordability and sustainability framework at the same time. The compilation of the new five year IDP process was undertaken in 2016 and the review was tabled for approval in March
31 Process for consultation with each group of stakeholders and outcomes Following the tabling of the draft budget in March 2018, local input was solicited via notices published in all newspapers and notices at all town offices as well as the website. Comments on the IDP and Budget was made by the public via verbal presentations, facsimiles, s and in the form of correspondence to the municipality and will be considered for incorporation as part of the final budget approval process. Stakeholders involved in consultations The draft budget was provided to National Treasury and Provincial Treasury in April 2018 for their consideration in line with S23 of the MFMA. Process and media used to provide information on the Budget to the community The Municipality s consultation process on its draft IDP and budget was held during April 2018, where various community organisations and representatives come forward to give input. Community representatives and organisations had to review the priorities given previously to ascertain whether it has been captured as priorities during the 2018/19 IDP process. Methods employed to make the Budget document available (including websites) In compliance with the Municipal Finance Management Act and the Municipal Systems Act with regards to the advertising of Budget Documents (including the Tariffs, Fees and Charges for 2018/19), advertisements was placed in The Local newspapers. The information relating to resolutions and budget documentation will be displayed on the notice boards in the municipal offices as well as libraries. In compliance with S22 of the MFMA, the Budget documentation was published on the municipality s website following the tabling thereof at Council in 28 March 2018 and the approval thereof in May IDP and Service Delivery and Budget Implementation Plan The Municipality s IDP is its principal strategic planning instrument, which directly guides and informs its planning, budget, management and development actions. This framework is rolled out into objectives, key performance indicators and targets for implementation which directly inform the Service Delivery and Budget Implementation Plan. The Strategic Plan included the following key IDP goals: Financial Sustainability Good Governance and Clean Audit Institutional Capacity Development Basic Service Delivery and Infrastructure Local Economic Development and Social Upliftment Sustainable Housing Programme Environmental Sustainability The IDP has been taken into a business and financial planning process leading up to the 2018/19 MTREF, based on the approved 2017/18 MTREF, Mid-year Review and adjustments budget. The business planning process has subsequently been refined in the light of current economic circumstances and the resulting revenue projections. Business planning links back to priority 27
32 needs and master planning, and essentially informed the detail operating budget appropriations and three-year capital programme. 28
33 7. Overview of Alignment of Annual Budget with IDP An IDP should be utilised as a method to plan for future developments in the areas and to find the best solutions to achieve long-term development goals. A municipal IDP provides a five year strategic programme of action aimed at setting short, medium and long term strategic and budget priorities to create a development platform, which correlates with the term of office of the political incumbents. The plan aligns the resources and the capacity of a municipality to its overall development aims and guides the municipal budget. An IDP is therefore a key instrument which municipalities use to provide vision, leadership and direction to all those that have a role to play in the development of a municipal area. The IDP enables municipalities to make the best use of scarce resources and speed up service delivery. It is important that the IDP developed by municipalities correlate with National and Provincial intent. The aim of this revision cycle was to develop and coordinate a coherent plan to improve the quality of life for all the people living in the area, also reflecting issues of national and provincial importance. One of the key objectives is therefore to ensure that there exists alignment between national and provincial priorities, policies and strategies It is considered that a well-run budget process that incorporates the IDP will facilitate community input, encourage discussion, promote a better understanding of community needs, provide an opportunity for feedback, and improve accountability, transparency, and responsiveness to the needs of the local communities. Vision of Theewaterskloof Municipality A Theewaterskloof where all of its people and key stakeholders are working together in establishing and developing a sustainable environment within which all of its people can live in peace, harmony and dignity and an economy able to create working and wealth opportunities for all. Mission of Theewaterskloof Municipality To create and sustain an environment which shall enhance the socio-economic development capacity and impact of the Theewaterskloof Municipality in accordance with the Vision as stated above. STRATEGIC FOCUS AREAS (SFA) The Constitution requires local government to relate its management, budgeting and planning functions to its objectives. This gives a clear indication of the intended purposes of municipal integrated development planning. The municipality opted to focus on five strategic areas which would result in it overcoming its challenges and achieving its vision. 29
34 SFA 1: FINANCIAL VIABILITY Strategic Goal Improved Financial Sustainability of the Municipality Municipal Strategic Focus areas: SFA1: Financial Viability Strategic Objective SO1:Work towards a sustainable future through sound financial management and continuous revenue growth Challenges - Low recovery rate Outcome / Impact - Reliant on grants (due to high unemployment rate and large indigent population) - Converting to Municipal Standard Chart of Accounts: staffing, financial resources, time constraints, constantly changing legislation formats or directives, national treasury inability to give clear and precise direction - Broadening of the rates base through initiatives aimed at encouraging and stimulating local economy - Cost of compliance - Influx of indigents Financial Sustainability and improved audit opinion Strategic Risks - Implementation of MSCOA Directorate - Slow recovery of potential revenue Financial Services Departmental Interventions - Work towards obtaining a clean audit - Vigorous driving and management of projects of the financial sustainability steering committee Objectives - Review Tariff structure - Improved functioning and results of the Revenue Section/improve the collection rate - Improved Financial Management Improved Financial Management Alignment with National and Provincial Strategies Sphere Description National KPA National Outcome Municipal Financial Viability and Management A responsive and accountable, effective and efficient local government system 30
35 National Development Plan (2030) Provincial Strategic Objective District Strategic Objective Developing a capable and Development State Mainstreaming sustainability and optimising resource-use efficiency To attain and maintain financial viability and sustainability by executing accounting services in accordance with National Policy and guidelines Main Functions and Sector Plans associated with this SO Municipal Functions Other spheres Specific Plans Good systems, compliance, revenue optimisation, financial sustainability planning National Treasury and Provincial Treasury; ensuring clean audit Budgets and 3 yr. plans; SDBIP SFA 2: GOOD GOVERNANCE Strategic Goal Good Governance and Clean Audit Municipal Strategic Focus Area Good Governance Strategic Objective SO 2:To provide democratic, responsive and accountable government for the local communities Challenges The cost of compliance with increased legislation, regulations and accounting standards is not only costing more without any significant tangible benefits to the communities, it is also time-consuming and counter-productive. Outcome / Impact - Clean audit - Improved stakeholder relations - Improved communication - Improved community engagements - Functional and effective ward committees Strategic Risks Excessive expectations in relation to institutional capacity Municipal Directorate Corporate Services Departmental Objectives Improve the functioning of the ward committee system Municipal Directorate Corporate Services Departmental Interventions Know your ward campaign Host a Ward Committee Submit 31
36 Municipal Directorate Ward Councillor Report back Meetings Office of the MM Departmental Interventions - Work towards obtaining a clean audit National KPA National Outcome Sphere National Development Plan (2030) Provincial Strategic Objective District Strategic Objective - Improved relationships - Improved Communication and community involvement Good Governance and Public Participation Alignment with National and Provincial Strategies Description A responsive and accountable, effective and efficient local government system Developing a capable and Development State Embed good governance and integrated service delivery through partnerships and spatial planning To ensure Good Governance practice by providing a democratic and proactive accountable government and ensuring community participation through existing IGR structures Main Functions and Sector Plans associated with this SO Municipal Functions Other spheres Specific Plans Council, public and stakeholder participation, ward Committees, policies, bylaws legislative framework and support SFA 3: INSTITUTIONAL DEVELOPMENT Strategic Goal Optimisation of Capacity Municipal Strategic Focus Area Strategic Objectives Institutional Development Challenges - Inadequate systems and SOP s - Lack of office space SO3:To ensure a healthy and productive workforce by creating a conducive working environment - Shortage of Fleet (Traffic, refuse removal etc.) Outcome / Impact - Improved safety in working environment - Clean audit - Improved processes and productivity - Improved legal compliance 32
37 Strategic Risks Municipal Directorate Excessive expectations in relation to institutional capacity Corporate Services Departmental Interventions - Implement outcome based training strategies and programmes - Continuous review of policies and delegations and by-laws Municipal Directorate Departmental Interventions National KPA National Outcome Sphere National Development Plan (2030) Provincial Strategic Objective District Strategic Objective - Establishment of a Municipal Court - Implementation of MCGICT Policies Office of the MM Optimum optimizing of PMS to ensure continuous performance improvement working towards a clean performance audit Alignment with National and Provincial Strategies Municipal Transformation and Institutional Development Description A responsive and accountable, effective and efficient local government system Developing a capable and Development State Mainstreaming sustainability and optimizing resource-use efficiency To ensure municipal transformation and institutional development by creating a staff structure that would adhere to the principles of employment equity and promote skills development. Main Functions and Sector Plans associated with this SO Municipal Functions Other spheres Specific Plans Organisational Development, Systems Operational plan, Performance Management System Strategic Goal Optimisation of Capacity Municipal Strategic Focus Area Institutional Development Strategic Objectives SO4: Refine and improve the institutional capacity of the municipality Challenges - Lack of succession planning - Trained workforce (water, sanitation, road works etc) - Lack/shortage of Man power - Constant changes to systems & service providers creates security risk areas, strain on ICT resources 33
38 Outcome / Impact - Clean audit Strategic Risks Municipal Directorate - Improved processes and productivity - Improved ICT systems - Improved municipal capacity - Improved legal compliance Excessive expectations in relation to institutional capacity Corporate Services Departmental Interventions - Full organisational design investigation - Improve ICT service and infrastructure Municipal Directorate Departmental Interventions National KPA National Outcome Sphere National Development Plan (2030) Provincial Strategic Objective District Strategic Objective - Implement outcome based training strategies and programmes - Continuous review of policies and delegations and by-laws - Establishment of a Municipal Court - Implementation of MCGICT Policies Office of the MM Optimum optimizing of PMS to ensure continuous performance improvement working towards a clean performance audit Alignment with National and Provincial Strategies Municipal Transformation and Institutional Development Description A responsive and accountable, effective and efficient local government system Developing a capable and Development State Mainstreaming sustainability and optimizing resource-use efficiency To ensure municipal transformation and institutional development by creating a staff structure that would adhere to the principles of employment equity and promote skills development. Main Functions and Sector Plans associated with this SO Municipal Functions Other spheres Specific Plans Organisational Development, Systems Operational plan, Performance Management System 34
39 SFA 4: BASIC SERVICE DELIVERY Strategic Goal Municipal Strategic Focus Area Strategic Objective Improve Service Delivery Levels Basic Service Delivery Challenges - Budget (poor payment rate) SO 5: To ensure a continuous and sustainable maintenance, replacement and upgrades of municipal infrastructure - Shortage of Fleet (Traffic, refuse removal etc.) - Lack/shortage of Man power Outcome / Impact - Provide residents with adequate basic services - Sustainable water provision - Backlog reduction - Maintained fleet - Improved electricity provision - Rehabilitation and maintenance of urban streets Strategic Risks - Bulk water provision - Backlog in infrastructure Municipal Directorate Technical Services - Improved sewerage provision - Improved and sustainable solid waste management - Increased capacity for sustainable sewerage network - Improved storm water network - Increased revenue collection Departmental Interventions - Implementation of three year infrastructure and basic services upgrade, expansion and replacement program linked to the MIG Program, Capital Reserve Development Program and development contribution program Municipal Directorate Operational Services Departmental Interventions - Day to Day Service Delivery - Infrastructure and bulk upgrades National KPA Sphere Basic Service Delivery Alignment with National and Provincial Strategies Description National Outcome - An effective, competitive and responsive economic infrastructure network - Protection and enhancement of environmental assets and natural resources National Development Plan (2030) - Nation building and social cohesion - Economy and Development Provincial Strategic Objective District Strategic Objective Mainstreaming sustainability and optimising resource-use efficiency To ensure the Health and safety of all in the Overberg through the provision of efficient basic services and infrastructure Main Functions and Sector Plans associated with this SO 35
40 Municipal Functions Other spheres Specific Plans Water, sanitation, roads, transport infrastructure, storm water, waste removal, parks, recreation. Forward Planning and integration with Human Settlements MIG funds and other external funding, DWA initiatives Master plans; MIG project plans, Water Services Plans, Strategic Goal Improve Service Delivery Levels Municipal Strategic Focus areas Strategic Objective Basic Service Delivery SO6:To maintain and improve basic service delivery and social amenities for the TWK community Challenges - Lack of adequate sport facilities to cater for all sporting codes - Lack of sport and recreational facilities in rural areas (farms) - Limited budget for implementation of sport programmes - Vandalism of municipal property Outcome / Impact - Maintained community facilities Strategic Risks Municipal Directorate Operational Services Departmental Interventions - Functioning and effective sport forums in all towns - Perform an audit on all sport facilities - Draft and implement a Sport National KPA National Outcome Sphere National Development Plan (2030) Provincial Strategic Objective District Strategic Objective Basic Service Delivery All people in south Africa protected and feel safe Building Safer Communities Increasing wellness, safety and tackle social ills Alignment with National and Provincial Strategies Description To ensure the Health and safety of all in the Overberg through the provision of efficient basic services and infrastructure Main Functions and Sector Plans associated with this SO Municipal Functions Other spheres Specific Plans Coordinating.facilitating sport, maintenance MIG funds and other external funding, DCAS 36
41 Strategic Goal Improve Service Delivery Levels Municipal Strategic Focus Area Strategic Objective Challenges Outcome / Impact Strategic Risks Municipal Directorate Basic Service Delivery SO7: Improved Environmental Management - Lack of updated by-laws - Capacity to develop policies Sustainable environmental management Technical Services Departmental Interventions - Conserve and rehabilitate the natural environment - Mitigate the risk of potential disasters National KPA National Outcome Sphere National Development Plan (2030) Provincial Strategic Objective District Strategic Objective - Increased cemetery capacity - Mitigate the risk of potential disasters - Manage the municipality's natural resources (Reserves, public open spaces, waterways) Basic Service Delivery Environmental Sustainability and Resilience Building Safer Communities Increasing safety Alignment with National and Provincial Strategies Description To ensure the Health and safety of all in the Overberg through the provision of efficient basic services and infrastructure Main Functions and Sector Plans associated with this SO Municipal Functions Other spheres Specific Plans Planning and Functioning of Settlements and Conservation, Planning support (DEADP) and Compliance e.g. NEMA Law Enforcement Strategy, SDF 37
42 Strategic Goal Municipal Strategic Focus Area Strategic Objective Improve Service Delivery Levels Basic Service Delivery Challenges - Shortage of Fleet (Traffic) SO8: Increase community safety through traffic policing, bylaw enforcement - Lack/shortage of Man power - Lack of updated by-laws - Theft and vandalism of municipal property, goods and assets - Uncontrolled expanding of informal settlements - Illegal land grabs Outcome / Impact - Increased community safety - Reduced crime within TWK municipal area Strategic Risks Municipal Directorate Immigration leading to land invasion and the increase in informal settlements Operational Services Departmental Interventions - Establishment of Land Invasion Special Task Team National KPA National Outcome Sphere National Development Plan (2030) Provincial Strategic Objective District Strategic Objective - Effective management of informal settlements - Traffic and Law Enforcement turnaround strategy - Road safety and by-law awareness and building strong community partnerships Be part of the solution Basic Service Delivery All people in south Africa protected and feel safe Building Safer Communities Increasing safety - Implementation of Community Safety Programmes - Establish municipal court - Implement District Safety Plan to address road safety - Training of personnel for effective Law Enforcement Alignment with National and Provincial Strategies Description To ensure the Health and safety of all in the Overberg through the provision of efficient basic services and infrastructure Main Functions and Sector Plans associated with this SO 38
43 Municipal Functions Other spheres Specific Plans Traffic, Law Enforcement DoCS Law Enforcement Strategy, SDF Strategic Goal Municipal Strategic Focus Area Strategic Objective Improve Service Delivery Levels Basic Service Delivery Challenges - Influx of indigent people Outcome / Impact Strategic Risks Municipal Directorate SO9:Ensure the provision of sustainable and integrated Human Settlements through accelerating affordable housing projects S010: Upgrading of informal settlements and prioritising the most needy in housing allocation - Uncontrolled influx of seasonal workers - Insufficient municipal land for housing development - Increased demand or housing - Insufficient Funding Sustainable integrated human settlements - Security of tenure - Slow delivery of rental opportunities and affordable housing - Land invasion Immigration leading to land invasion and the increase in informal settlements Development Services Departmental Interventions - Strengthen the policy instruments and encourage compliance with legislation National KPA National Outcome Sphere National Development Plan (2030) Provincial Strategic Objective - Strengthen policies to manage/control migration - Provision of GAP housing - Provision of economic and social facilities - Ensure unbiased allocation of housing opportunities Basic Service Delivery - Weak development control measures - Compliance with national housing policies - Acquire well located land for planned integrated Human Settlements - Implementation of the Human Settlements Program which includes programs such as IRDP, EHP & EPHP) Alignment with National and Provincial Strategies Sustainable human settlements and improved quality of household life Transforming Human Settlements Developing integrated and sustainable human settlements - Provision and Implementation of serviced sites - Speed up land release to transfer properties Description 39
44 District Strategic Objective To ensure the Health and safety of all in the Overberg District through the provision of efficient basic services and infrastructure Main Functions and Sector Plans associated with this SO Municipal Functions Other spheres Specific Plans Planning and implementing housing projects with govt funds, GAP housing, managing emerging settlements DHS, Human Settlement Projects Human Settlement Plan & Housing Pipeline SFA 5: LOCAL ECONOMIC DEVELOPMENT Strategic Goal To make Theewaterskloof a desirable place to live and work in Municipal Strategic Focus Area Strategic Objective Local Economic Development SO11:Create an enabling environment in order to maintain existing business and attract new investment into the TWK area Challenges - High level of unemployment - Lack of interest of local labour in working in the Agricultural sector Outcome / Impact - Poor quality of education - Not enough housing stock in the area to attract paying residents - High level of imports into the municipal area increasing costs. - High level of substance abuse among youth Improved economic growth Improved social conditions Strategic Risks Job creation via LED initiatives Municipal Directorate Development Services Departmental Interventions - Implement the Youth Development Strategy in line with National programs such as EPWP, CWP and the youth entrepreneurial project - Encourage investors to invest in TWK (Labour intensive work opportunities in textile industry and agri-processing) Sphere - Roll out of Land Disposal Strategy - Expand the Biggest Deal Challenge to develop entrepreneurs - Review of Tourism Structure - SMME/ Contractor development linked to Capital Projects i.e. Housing and Infrastructure Alignment with National and Provincial Strategies Description 40
45 National KPA Local Economic Development National Outcome Decent employment through inclusive economic growth National Development Plan (2030) Economy and Development Provincial Strategic Objective Creating opportunities for growth and jobs District Strategic objective To promote local economic development by supporting initiatives in the District for the Development of a sustainable district economy Main Functions and Sector Plans associated with this SO Municipal Functions Other spheres Specific Plans Creating Framework for Growth, Job Creation, Tourism, Specific Projects, PPPs, Town Planning Health and Safety,, everything to do with soft services and recreation, human development, education and training DEADP, DoEDT Thusong initiative, CDWs, DECAS, DoE, DoSD, Rural Development SDF, LED strategy Youth Development Strategy. EPWP Strategy, 2030 Strategy, 2030 Projections, Green Economy, Tourism sector plan, Destination Marketing Plan Strategic Goal Municipal Strategic Focus Area Strategic Objective To make Theewaterskloof a desirable place to live and work in Local Economic Development SO11:Create an enabling environment in order to maintain existing business and attract new investment into the TWK area Challenges - High level of unemployment - Lack of interest of local labour in working in the Agricultural sector Outcome / Impact - Poor quality of education - Not enough housing stock in the area to attract paying residents - High level of imports into the municipal area increasing costs. - High level of substance abuse among youth Improved economic growth Improved social conditions Strategic Risks Municipal Directorate Job creation via LED initiatives Development Services 41
46 Departmental Interventions - Implement the Youth Development Strategy in line with National programs such as EPWP, CWP and the youth entrepreneurial project - Encourage investors to invest in TWK (Labour intensive work opportunities in textile industry and agri-processing) Sphere - Roll out of Land Disposal Strategy - Expand the Biggest Deal Challenge to develop entrepreneurs - Review of Tourism Structure - SMME/ Contractor development linked to Capital Projects i.e. Housing and Infrastructure Alignment with National and Provincial Strategies Description National KPA National Outcome National Development Plan (2030) Provincial Strategic Objective District Strategic objective Municipal Functions Creating Framework for Growth, Job Creation, Tourism, Specific Projects, PPPs, Town Planning Health and Safety,, everything to do with soft services and recreation, human development, education and training Local Economic Development Decent employment through inclusive economic growth Economy and Development Creating opportunities for growth and jobs To promote local economic development by supporting initiatives in the District for the Development of a sustainable district economy Main Functions and Sector Plans associated with this SO Other Specific Plans spheres DEADP, SDF, LED strategy DoEDT Youth Development Strategy. EPWP Strategy, 2030 Strategy, 2030 Projections, Green Economy, Tourism sector plan, Destination Thusong Marketing Plan initiative, CDWs, DECAS, DoE, DoSD, Rural Development Strategic Goal Municipal Strategic Focus Area Strategic Objective Creating and enabling environmental favourable for economic and human development in a sustainable manner Local Economic Development SO 13: Improve the social fabric of the TWK Community 42
47 Challenges Divided communities Isolation and limited access to opportunities Patterns of inequality Exclusion of marginalised groups (women, disabled & elderly) Challenge with availability of land for emerging farmers Limited funding for community development programmes Outcome / Impact Improved social conditions: - Sustainable emerging agricultural sector that contribute to food security - Quality Early Childhood Development facilities and programs - Sustainable SMME s - Decrease in social ills - Increase in social cohesion - Increase in opportunities for the youth - Increase support to the elderly and individuals with disabilities Strategic Risks None identified Municipal Directorate Development Services Departmental Interventions - Facilitation of NGO stakeholder - Youth Entrepreneurship and capacity building - Emerging Farmer Support - ECD Sector Facilitation - SMME Support - Facilitate the Comprehensive Rural Development Program (CRDP) - Facilitate Thusong Program - Facilitate Thusong Program Alignment with National and Provincial Strategies Sphere Description National KPA Local Economic Development National Outcome Decent employment through inclusive economic growth National Development Plan (2030) Economy and Development 43
48 Provincial Strategic Objective Creating opportunities for growth and jobs District Strategic objective To promote local economic development by supporting initiatives in the District for the Development of a sustainable district economy Main Functions and Sector Plans associated with this SO Municipal Functions Other spheres Specific Plans Creating Framework for Growth, Job Creation, Tourism, Specific Projects, PPPs, Town Planning Health and Safety,, everything to do with soft services and recreation, human development, education and training DEADP, DoEDT Thusong initiative, CDWs, DECAS, DoE, DoSD, Rural Development SDF, LED strategy Youth Development Strategy. EPWP Strategy, 2030 Strategy, 2030 Projections, Green Economy, Tourism sector plan, Destination Marketing Plan In line with the MSA, the IDP constitutes a single, inclusive strategic plan for the municipality. The five-year programme responds to the development challenges and opportunities faced by the municipality by identifying the key performance areas to achieve the five strategic objectives mentioned above. The 2018/19 MTREF has therefore been directly informed by the IDP revision process and the following tables provide a reconciliation between the IDP strategic objectives and operating revenue, operating expenditure and capital expenditure. 44
49 Reconciliation between the IDP strategic objectives and budgeted revenue (Table SA4) Strategic Objective Goal Goal 2018/19 Medium Term Revenue & Current Year 2017/18 Code Expenditure Framework R thousand Original Budget Adjusted Budget Full Year Forecast 2018/ / /21 Financial Viability Work tow ards a sustainable SO1 175, , , , , ,093 future through sound financial management and continuous rev enue growth Good Gov ernance To prov ide democratic, SO2 2,761 2,940 2,940 2,838 3,000 3,172 responsiv e and accountable gov ernment for the local communities Institutional Dev elopment To ensure a healthy and SO productiv e w orkforce by creating a conduciv e w orking env ironment Institutional Dev elopment Refine and Improv e the SO4 institutional Capacity of the Municipality Basic Serv ice Deliv ery To ensure continuous and SO5 25,264 26,249 26,249 24,106 25,453 25,453 sustainable maintenance, replacements and upgrades of municipal infrastructure Basic Serv ice Deliv ery To maintain and improv e SO6 227, , , , , ,417 basic serv ice deliv ery and social amenities for the TWK community. Basic Serv ice Deliv ery Improv ed Env ironmental SO7 Management Basic Serv ice Deliv ery Increase Community Safety SO8 36,233 36,233 36,233 38,407 41,478 44,795 through traffic policing, by law enforcement Basic Serv ice Deliv ery Ensure the prov ision of SO9 72,621 79,441 79,441 61,255 76,869 64,500 Sustainable and integrated Human Settlements through Accelerating Affordable Housing Projects, Basic Serv ice Deliv ery Upgrading of informal Settlements and Prioritising the most needy in housing allocation SO10 Local Economic Dev elopment Create an enabling SO ,198 1, env ironment in order to maintain ex isting business and attract new inv estments into the TWK area. Local Economic Dev elopment Promote the second and SO12 Tow nship economy (SMME Dev elopment) Allocations to other priorities Total Revenue (excluding capital transfers and contributions) 541, , , , , ,951 45
50 Reconciliation between the IDP strategic objectives and budgeted operating expenditure (Table SA5) Strategic Objective Goal Goal 2018/19 Medium Term Revenue & Current Year 2017/18 Code Expenditure Framework R thousand Original Budget Adjusted Budget Full Year Forecast 2018/ / /21 Financial Viability Work tow ards a sustainable SO1 36,948 39,284 39,284 42,839 46,005 49,410 future through sound financial management and continuous rev enue growth Good Gov ernance To prov ide democratic, SO2 33,784 33,696 33,696 26,648 28,706 30,925 responsiv e and accountable gov ernment for the local communities Institutional Dev elopment To ensure a healthy and SO3 31,245 29,672 29,672 41,837 44,294 46,936 productiv e w orkforce by creating a conduciv e w orking env ironment Institutional Dev elopment Refine and Improv e the institutional Capacity of the Municipality SO4 9,036 12,376 12,376 9,264 9,890 10,560 Basic Serv ice Deliv ery Basic Serv ice Deliv ery Basic Serv ice Deliv ery To ensure continuous and sustainable maintenance, replacements and upgrades of municipal infrastructure To maintain and improv e basic serv ice deliv ery and social amenities for the TWK Improv ed Env ironmental Management SO5 16,205 15,090 15,090 16,029 17,295 18,661 SO6 272, , , , , ,126 SO7 2,832 2,817 2,817 3,064 3,248 3,443 Basic Serv ice Deliv ery Basic Serv ice Deliv ery Basic Serv ice Deliv ery Increase Community Safety through traffic policing, by law enforcement Ensure the prov ision of Sustainable and integrated Human Settlements through Accelerating Affordable Housing Projects, Upgrading of informal Settlements and Prioritising the most needy in housing SO8 48,508 48,598 48,598 56,172 60,492 65,149 SO9 40,021 39,927 39,927 43,092 45,793 48,665 SO10 1,732 6,887 6, Local Economic Dev elopment Create an enabling env ironment in order to maintain ex isting business SO11 6,201 6,573 6,573 7,856 8,426 9,041 Local Economic Dev elopment Promote the second and SO Tow nship economy (SMME Dev elopment) Allocations to other priorities Total Expenditure 498, , , , , ,517 46
51 Reconciliation between the IDP strategic objectives and budgeted capital expenditure (Table SA6) Strategic Objective R thousand Financial Viability Good Gov ernance Institutional Dev elopment Institutional Dev elopment Goal Work tow ards a sustainable future through sound financial management and continuous rev enue growth To prov ide democratic, responsiv e and accountable gov ernment for the local communities To ensure a healthy and productiv e w orkforce by creating a conduciv e w orking env ironment Refine and Improv e the institutional Capacity of the Municipality Goal Code Original Budget Current Year 2017/18 Adjusted Budget Full Year Forecast 2018/19 Medium Term Revenue & 2018/19 Expenditure Framework / /21 SO SO SO SO Basic Serv ice Deliv ery Basic Serv ice Deliv ery Basic Serv ice Deliv ery To ensure continuous and sustainable maintenance, replacements and upgrades of municipal infrastructure To maintain and improv e basic serv ice deliv ery and social amenities for the TWK community. Improv ed Env ironmental Management SO5 3,917 4,840 4,840 2,403 SO6 66,423 84,859 84,859 45,953 47,110 45,693 SO7 Basic Serv ice Deliv ery Basic Serv ice Deliv ery Basic Serv ice Deliv ery Local Economic Dev elopment Local Economic Dev elopment Increase Community Safety through traffic policing, by law enforcement Ensure the prov ision of Sustainable and integrated Human Settlements through Accelerating Affordable Housing Projects, Upgrading of informal Settlements and Prioritising the most needy in housing allocation Create an enabling env ironment in order to maintain ex isting business and attract new inv estments into the TWK area. Promote the second and Tow nship economy (SMME Dev elopment) SO8 1,084 1,694 1,694 6,300 SO9 36,381 37,760 37,760 24,100 SO10 SO11 SO12 Allocations to other priorities Total Capital Expenditure 108, , ,284 78,756 47,110 45,693 47
52 8. Measurable performance objectives and Indicators Performance Management is a system intended to manage and monitor service delivery progress against the identified strategic objectives and priorities. The Municipality target, monitors, assesses and reviews organisational performance which in turn is directly linked to individual employee s performance. Performance information needs to be structured to demonstrate clearly how the municipality uses available resources to deliver on its strategic objectives. In managing for results, budgets are developed in relation to inputs, activities and outputs, while the aim is to manage towards achieving the outcomes and impacts. The image below illustrates the relationship between these core performance information concepts. Impacts Equity Outcomes Effectiveness Outputs Efficiency Activities Inputs Economy Economy indicators: explore whether specific inputs are acquired at the lowest cost and at the right time. Efficiency indicators: explore how productively inputs are translated into outputs. An efficient operation maximises the level of output for a given set of inputs, or it minimises the inputs required to produce a given level of output. Effectiveness indicators: explore the extent to which the outputs of an institution achieve the desired outcomes. An effectiveness indicator assumes a model of how inputs and outputs relate to the achievement of an institution's strategic objectives and goals. Equity indicators: explore whether services are being provided impartially, fairly and equitably. Equity indicators reflect the extent to which an institution has achieved and been able to maintain an equitable supply of comparable outputs across demographic groups, regions, urban and rural areas, and so on. 48
53 The following table sets out the municipalities main performance objectives and benchmarks for the 2018/19 MTREF. Key financial indicators and ratios (table SA8) 2014/ / /17 Current Year 2017/ /19 Medium Term Revenue & Expenditure Framework Description of financial indicator Basis of calculation Audited Audited Audited Original Adjusted Full Year Pre-audit Outcome Outcome Outcome Budget Budget Forecast outcome 2018/ / /21 Borrowing Management Credit Rating Capital Charges to Operating Ex penditure Interest & Principal Paid /Operating 5.5% 6.1% 6.1% 5.7% 5.5% 5.5% 5.5% 5.6% 5.3% 4.9% Ex penditure Capital Charges to Ow n Rev enue Finance charges & Repay ment of borrowing /Own Rev enue 7.4% 8.3% 7.5% 8.1% 7.9% 7.9% 7.9% 8.0% 7.4% 6.9% Borrow ed funding of 'ow n' capital ex penditure Borrow ing/capital ex penditure ex cl. 0.0% 0.0% 0.0% 68.4% 62.8% 62.8% 62.8% 33.2% 0.0% 0.0% transfers and grants and contributions Safety of Capital Gearing Long Term Borrow ing/ Funds & 654.7% % 651.5% % 818.0% 818.0% 818.0% 831.4% 773.2% 715.2% Reserv es Liquidity Current Ratio Current assets/current liabilities Current Ratio adjusted for aged debtors Current assets less debtors > (1.4) day s/current liabilities Liquidity Ratio Monetary Assets/Current Liabilities Revenue Management Annual Debtors Collection Rate (Pay ment Last 12 Mths Receipts/Last 12 Mths 87.1% 92.7% 89.4% 90.0% 86.6% 86.6% 86.6% 86.6% 86.6% Lev el %) Billing Current Debtors Collection Rate (Cash 87.3% 92.7% 89.4% 90.0% 86.6% 86.6% 86.6% 86.6% 86.6% 86.6% receipts % of Ratepay er & Other rev enue) Outstanding Debtors to Rev enue Total Outstanding Debtors to Annual 10.4% 10.4% 10.2% 11.3% 12.5% 12.5% 12.5% 14.1% 15.0% 16.8% Rev enue Longstanding Debtors Recov ered Debtors > 12 Mths Recov ered/total 0.0% 0.0% 0.0% 0.0% 0.0% 0.0% 0.0% Debtors > 12 Months Old Creditors Management Creditors Sy stem Efficiency % of Creditors Paid Within Terms 100.0% 100.0% 100.0% 100.0% 100.0% 100.0% 100.0% (within`mfma' s 65(e)) Creditors to Cash and Inv estments 75.8% 82.3% 61.3% 129.3% 122.1% 122.1% 122.1% 265.9% 142.0% 117.7% Other Indicators Electricity Distribution Losses (2) Total Volume Losses (kw) Total Cost of Losses (Rand '000) % Volume (units purchased and generated less units sold)/units ,072 3,072 3,072 3,072 2,967 2,967 2,967 purchased and generated 5% 5% 5% 5% 5% 5% 5% Water Distribution Losses (2) Total Volume Losses (kl) Total Cost of Losses (Rand '000) % Volume (units purchased and generated less units sold)/units ,234 7,234 7,234 7,234 7,234 7,234 7,234 purchased and generated 19% 19% 19% 19% 19% 19% 19% Employ ee costs Employ ee costs/(total Rev enue - capital 36.3% 33.4% 36.6% 39.0% 37.3% 37.3% 37.3% 37.9% 36.2% 37.2% rev enue) Remuneration Total remuneration/(total Rev enue % 35.3% 36.6% 41.4% 39.7% 39.7% 39.7% 40.2% 38.4% 39.5% capital revenue) Repairs & Maintenance R&M/(Total Rev enue ex cluding capital 5.8% 5.3% 6.2% 19.4% 20.1% 20.1% 20.1% 19.6% 18.5% 18.9% rev enue) Finance charges & Depreciation FC&D/(Total Rev enue - capital rev enue) 6.3% 9.7% 9.4% 10.1% 9.9% 9.9% 9.9% 10.1% 8.9% 8.5% IDP regulation financial viability indicators i. Debt cov erage (Total Operating Rev enue - Operating Grants)/Debt serv ice pay ments due w ithin financial y ear) ii.o/s Serv ice Debtors to Rev enue Total outstanding serv ice debtors/annual rev enue receiv ed for serv ices % 18.5% 16.1% 18.3% 20.6% 20.6% 20.6% 22.9% 25.5% 27.9% iii. Cost cov erage (Av ailable cash + Inv estments)/monthly fix ed operational ex penditure
54 Performance indicators and benchmarks Borrowing Management Capital expenditure in local government can be funded by capital grants, own-source revenue and long term borrowing. The ability of a municipality to raise long term borrowing is largely dependent on its creditworthiness and financial position. As with all other municipalities, Theewaterskloof Municipality s borrowing strategy is primarily informed by the affordability of debt repayments. The municipality s debt portfolio is consisting out of annuity loans. The following financial performance indicators have formed part of the compilation of the 2018/19 MTREF: Borrowing to asset ratio is a measure of the long-term borrowing as a percentage of the total asset base of the municipality. Capital charges to operating expenditure are a measure of the cost of borrowing in relation to the operating expenditure. It can be seen that the cost of borrowing is 5.6 per cent in 2018/2019 and decrease to 4.9 per cent in 2020/21 This decrease can be attributed to fewer loans taken up to fund portions of the capital programme. While borrowing is considered a prudent financial instrument in financing capital infrastructure development, this indicator will have to be carefully monitored going forward as the municipality has reached its prudential borrowing limits. Borrowing funding of own capital expenditure measures the degree to which own capital expenditure (excluding grants and contributions) has been funded by way of borrowing. In summary, various financial risks could have a negative impact on the future borrowing capacity of the municipality. In particular, the continued ability of the municipality to meet its revenue targets and ensure its forecasted cash flow targets are achieved will be critical in meeting the repayments of the debt service costs. Safety of Capital The gearing ratio is a measure of the total long term borrowings over funds and reserves. Lower figures are more acceptable, showing that the company is predominantly financed by equity whilst high gearing shows an over reliance on borrowings for a significant proportion of the municipality's capital requirements. Liquidity Current ratio is a measure of the current assets divided by the current liabilities and the benchmark would normally be set at a limit of 1, hence at no point in time should this ratio be less than 1. In the 2018/19 financial year the current ratio is 1.1, it shows an increase to 1.5 in the 2019/20 financial year and thereafter the forecasted is 1.7 in 2020/21. Going forward it will be necessary to increase these levels to allow the municipality to be able to pay its liabilities when it falls due. The liquidity ratio is a measure of the ability of the municipality to utilize cash and cash equivalents to extinguish or retire its current liabilities immediately. Ideally the municipality should have the equivalent cash and cash equivalents on hand to meet at least the current liabilities, which should translate into a liquidity ratio of 1. Anything below 1 indicates a shortage in cash to meet creditor obligations. The ratio is forecast at 0.2, 0.4 and 0.5 over the MTREF. 50
55 Revenue Management As part of the financial sustainability strategy, initiatives have been implemented to increase cash inflow such as prepaid water and electricity meters for all. The intention of the strategy is to streamline the revenue value chain by ensuring accurate billing, customer service, and credit control and debt collection. Various other interventions are currently in process such as the Grabouw and Tesselaarsdal data cleansing, the restructuring of the revenue function and the task team for revenue management investigating the critical causes of a low collection rate which include systems, processes and data management. Creditors Management The municipality has managed to ensure that creditors are settled within the legislated 30 days of invoice. The municipality has managed to ensure a 100 per cent compliance rate to this legislative obligation. This has had a favourable impact on suppliers perceptions of risk of doing business with the municipality, which is expected to benefit the municipality in the form of more competitive pricing of tenders, as suppliers compete for the municipality s business. Other Indicators The electricity distribution losses have been set at 3,049,766 kw for 2018/19. The initiatives to ensure these targets are achieved include managing illegal connections and theft of electricity, including prepaid meters. The water distribution losses target is set at 1,132,123 kl. Initiatives such as free water leakage repair for indigent and prepaid water meters will assist in this regards. Employee costs as a percentage of operating revenue is 37.9% in the 2018/19 and decrease to 36.2% in 2019/20 and further increasing in the 2020/21 year to 37.2%. Free Basic Services: basic social services package for indigent households The social package assists residents that have difficulty paying for services and are registered as indigent households in terms of the Indigent Policy of the municipality. For the 2018/19 financial year R 26,039 provision have been made for indigent s household in the budget but do not include the cost of services of ±5046 informal settlements. In terms of the Municipality s indigent policy registered households are entitled to 6kl free water and sanitation, 70 kwh of electricity and free waste removal, as well as a discount on their property rates. Further detail relating to the number of households receiving free basic services, the cost of free basic services, highest level of free basic services as well as the revenue cost associated with the free basic services is contained in Table A10 (Basic Service Delivery Measurement) on page
.")
56 Drinking Water Quality and Waste Water Management in TWK Municipality. There are eight towns each with its own water and waste water treatment facility that falls under the management of the Theewaterskloof Municipality Authority except, for Caledon (water treatment). The latter receives water from a service provider, Overberg Water and Ikusasa Water. 1. Blue Drop Assessment The Blue Drop Assessment strives to get municipalities to implement incident management protocols and by so doing thereby become more risk averse in their commitment to safe-guard public health in a precautionary manner. The latest report released by the DWS was in Nationally there was a decrease in the performance of all municipalities. Theewaterskloof Municipality ranked as the 15 th best on the Provincial Blue Drop log, with improvements at Botriver, Caledon and RSE. With this audit Risk management had more weighting then previous year. In 2013 TWK drafted their first Water Safety Plan. Implementation of risk mitigation identified in the Water Safety plan has been implemented gradually. The rate of drinking water quality compliance not being according to expectation also contributed to the decline. Each water system was assessed against a set of criteria in a Performance Area. The overall score generated in the specific performance area is displayed in table below. 52

57 1.1 Water Safety Plan Caledon only system scoring well. Lessons to be learnt from Caledon and implemented at other supply systems. DWS assisted us to draw up these plans for at least one of our town. All role players were involved in this project and complete the plans for the remaining systems. Implementation of Water Safety Plans was gradually implemented. The water Safety plans to be updated to incorporate implementations. 1.2 Treatment Process Management All process controllers and treatment works are registered and uploaded on the Blue and Green drop regulatory systems but, we do not fully comply with regulation 2834 that states, that the registered process controllers comply with the legislative requirements in terms of Number of Process Controller per shift Complying with the required classification level of the treatment works and that the supervisor preferably on a higher classification level as that of the process controller on shift. Record keeping of all water related incidents that may have an impact on the immediate or greater community. It is a Blue and Green Drop necessity to have a qualified process controller on a Water and Wastewater Treatment System. The lack of skilled process controller and supervisors is just one of the many criteria that are needed for Blue & Green Drop Status achievements. At this stage our senior process controllers are in process with NQF 4 training in water & wastewater treatment. This type of training will allow these process controllers to be fully qualified and skilled in their current position. All process controllers and treatment works are registered and uploaded on the 53
58 Blue and Green drop regulatory systems but, we do not fully comply with regulation 2834 that states, that the registered process controllers comply with the legislative requirements in terms of Number of Process Controller per shift Complying with the required classification level of the treatment works and that the supervisor preferably on a higher classification level as that of the process controller on shift. Record keeping of all water related incidents that may have an impact on the immediate or greater community. It is a Blue and Green Drop necessity to have a qualified process controller on a Water and Wastewater Treatment System. The lack of skilled process controller and supervisors is just one of the many criteria that are needed for Blue & Green Drop Status achievements. At this stage our senior process controllers have completed NQF 4 training in water & wastewater treatment. This was uploaded on DWS system and PC s classifications improved. The next group of PC s are obtaining training. This type of training will allow these process controllers to be fully qualified and skilled in their current position. 1.3 Drinking Water Quality Compliances Drinking water quality compliance was poor particularly in Genadendal, Greyton, Tesselaarsdal and Villiersdorp. Failure to achieve 100% compliance can be linked to numerous factors including: Having no permanent Process Controller at plants to manage changes in water quality. Incompetency of the process controller so therefore training needed or The process controller doesn t do daily operational monitoring to detect failures earlier before its reach the consumers Proper equipment s need to be place in order to do sampling Improper implementation of incident reporting regarding failure therefor trigger late response management Treatment Works operate above its design capacity or treatment works not design to remove certain parameters. Process audit need to be conducted to see how the treatment can optimize. 1.4 Management, Accountability Management accountability weight 10% of the total allocated blue drop score. Management commitment is measured by approval of the Water Management Plans, as the municipality has a responsibility towards the direct consumer and broader public that we serve. We therefore need to inform them about the status of the drinking water delivered. Communication is now being done via SLA s; notice boards and data submission to DWS and the DoH. 1.5 Asset Management The limited implementation of the Operational & Maintenance manuals on site, calibration certificates of water meters and availability of maintenance team competency from service providers influence the overall marked scored in this performance area. Some of the old treatment system lack proper or full O&M manual but with the assistance of Wamtechnology the Operational and Maintenance manuals were compiled. 1.6 Water Use Efficiency Water use efficiency was good, with good scores in the Tesselaarsdal, Villiersdorp, Genadendal and Grabouw systems. 54

59 Green drop Assessment (Waste water treatment plants) No Green drop assessment was done in 2014, only Critical Risk Ratings were released. Riskbased regulation allows the municipality to identify and prioritize the critical risk areas within its wastewater treatment process and to take corrective measure to abate these. Risk analysis is used to identify, quantify and manage the corresponding risk according to their potential impact on the water source. High/critical risk can be prioritized. A Cumulative Risk Rating value is calculated for each of the Waste Water Treatment Plants taking into account the plants Design Capacity, Operational Flow, Compliance or non compliance (PC Classification) and Number of noncompliance trends i.r.t quality of effluent. Theewaterskloof Municipality ranked 11 th on the overall Provincial risk profile in 2013 with a low risk of 49%. According to the 2014 Green drop report Botrivier, Caledon, Grabouw and Villiersdorp Waste Water Treatment Plants performance digressed. Caledon, Grabouw and Villiersdorp is due to hydraulic overload of which the latter two s upgraded, Grabouw complete and Villiersdorp is in 55
60 the finishing stages and should be commissioned soon. Caledon s upgrade is in the implementation stage (2017/18). Genadendal, Greyton and RSE Waste Water Treatment Plants performance improved although Greyton WWTW is still above 60% and is expected to increase. Current upgrades at Grabouw, Villiersdorp Waste Water Treatment plants will decrease the Critical Risk Rating. Caledon Waste Water Treatment plant has become a high risk. The upgrade as planned for 2017/18 will also decrease the Critical Risk Rating for Theewaterskloof Municipality. See table below for each town s individual risk rating for the year 2014 The overall Critical Risk Rating % for 2014 is 47.05% which is a low risk as it is less than 50%. This is lower than the 49.6% of With the completion of the upgrades it should decrease even more. This will leave only Greyton WWTW as a concern as the risk rating is increasing Theewaterskloof Municipality % CRR/CRR max Town Botrivier Caledon Genadendal Grabouw Greyton RSE Villiers dorp Rating
61 9. Overview of Budget Related Policies The following Budget-Related Policies have been approved by Council or have been reviewed and amended in line with National Guidelines and Legislation Tariff Policy The municipality wishes to achieve the following by adopting this policy: 1. To comply with the provisions of Section 74 of the Local Government: Municipal Systems Act, 2000 (MSA): the municipality must adopt and implement a Tariff Policy on the levying of fees for municipal services provided by municipality 2. To comply with Section 62(1) (f) of the MFMA wish states that the Accounting Officer must ensure that a municipality has and implement a Tariff Policy 3. To prescribe Procedures and Principles (as defined in Section 74 (2) of the MSA for calculating tariffs were the municipality wishes to implement service providers in terms of Section 76(b) of the Act. 4. To give guidance regarding tariff proposals and calculations to provide a framework to determine fair, transparent and affordable charges that also promote sustainable service delivery. The policy ensures a holistic and comprehensive overview on all the revenues / charges levied Credit Control and Debt Collection Policy This policy has been formulated and developed in order to comply with Section of the Local Government: Municipal Systems Act, 2000 which states: In terms of Section 96 of the MSA a municipality- (a) must collect all money that is due and payable to it, subject to this Act and any other applicable legislation; and (b)for this purpose, must adopt, maintain and implement a Credit Control and Debt Collection Policy which is consistent with its rates and tariff policies and complies with the provisions of the MSA. This policy is also aimed at guiding officials in the legislative implementation of processes necessary to ensure optimal revenue generation and collection. Increased revenue forms the basis for effective service delivery, infrastructure development, and economic growth. In line with the objective of creating a vibrant and growing municipality, the Credit Control, and Debt Collection Policy is also aligned to the Batho-Pele Principles Cash Management and Investment Policy In terms Section 13 (2) of the Municipal Finance Management Act, 2003 the municipality must establish an appropriate and effective Cash Management and Investment Policy. The objectives of the policy are to ensure optimal performance with the least possible risk, in managing and investing the cash resources of the municipality and to ensure transparency, accountability, and appropriate lines of responsibility. 57
62 7.5. Grant in Aid Policy A Grant in Aid Policy was develop and approved by council in 28 October 2010 in terms of Section 67 of the MFMA. It deals with processes and procedure to be followed when the municipality allocates grants to other institutions in an equitable and transparent manner and in line with IDP Objectives. Provisions and disclosure must be made for Allocations under consideration in the draft budget and other prescribed budget related documents for public comments. Applications are made in line with Section 67 of the MFMA and the policy on a prescribed application form. The name of the institution, grant amount and description should be disclosed on the Grant Statement Asset Management Policy This policy has been designed to assist management and officials of the Theewaterskloof Municipality with the description and management procedures for Property, Plant and Equipment, Intangible Assets, and Investment Property. It further aims to ensure that the assets of the municipality are properly accounted for, marked and to ensure that assets are utilized and maintained in an economic, effective, and efficient manner to ensure optimal utilization, value for money and sustainable service delivery Risk Management Policy Section 62 (1) of the MFMA requires that the Accounting Officer takes all reasonable steps to ensure that the municipality has and maintains effective, efficient, and transparent systems of Financial and Risk Management, of internal control and of internal audit as well as the effective, efficient, and economical use of the resources of the municipality. The purpose of the Risk Management Policy is to enable the municipality not only to comply with legislation but also to manage risks by reducing/eliminating the likelihood and impact of risks in a pro-active, responsible and structured manner Virement Policy Virement is process of transferring funds from one line item to another within one vote with the approval of the relevant Senior Manager and CFO, to enable Budget Manager to transfer funds from one vote line-item with anticipated savings to another. The aim is to improve financial controls over the processes and procedures of transferring funds and to ensure accountability and improved Budgetary Control Anti-Corruption Policy To ensure that the Municipality is in compliance with the Municipal Systems Act, Act No 32 of 2000 which requires the Municipality, amongst other things to develop and adopt appropriate systems and procedures that contribute to effective and efficient management of the municipality and its resources Funds and Reserves Policy In terms of Sections 18 and 19 of the Municipal Finance Management Act (Act No 56 of 2003) (MFMA), an annual budget may only be funded from: Realistically anticipated revenues to be collected; Cash backed accumulated funds from previous years surpluses not committed for other purposes. and Borrowed funds, but only for capital projects. 58
63 Furthermore, spending on a capital project may only be commenced with if the funding sources have been considered, are available and have not been committed for other purposes. The Council sets as objective a long term financially sustainable municipality with acceptable levels of service delivery to the community. This policy aims to set standards and guidelines in ensuring financial viability over both the short- and long term and includes funding- as well as reserves requirements Short Term Insurance Policy The MFMA was introduced with the following objective: The object of this Act is to secure sound and sustainable management of the fiscal and financial affairs of municipalities and municipal entities by establishing norms and standards and other requirements for a. ensuring transparency, accountability and appropriate lines of responsibility in the fiscal and financial affairs of municipalities and municipal entities; b. the management of their revenues, expenditures, assets and liabilities and the handling of their financial dealings; The objective of this Short Term Insurance Management Policy is to ensure that the; municipality has transparent Insurance claim processes and procedures; general public are informed about the correct processes & procedures when filing a claim with the municipality; general public are aware of the required documentation when filing a claim with the municipality; managers and staff are aware of their responsibilities with regards to insurance management; managers and staff are informed about the correct processes & procedures when reporting; managers and staff are aware of the required documentation when filing a claim with the municipality; unions are informed about the correct processes & procedures; unions are aware of the required documentation; All the above-mentioned Policies were approved by Council and are reviewed at least annually. The policies are available on the municipality s website. a) Policy on the Writing-Off of Irrecoverable Debt The purpose of this policy is to ensure that the principles and procedures for the writing-off of irrecoverable debt are formalised to ensure that consumers (especially households) are relieved of their spiral of debt. 59
64 10. Overview of Budget Assumptions The Challenge of the International, National and Local Economy is limited Resources versus unlimited needs. Theewaterskloof Municipality is no exception as the unlimited needs of the community as outlined in the IDP are far more than the limited revenue and resource capacity of the municipality. This is largely the reason for adopting Financial Viability as one of our long-term themes defined as improved sustainable revenue capacity versus sound financial resource management. The Ministerial Advisory Committee defines Financial Viability as the ability of a local authority to fulfil its constitutional and legislative responsibilities. Resources to fulfil these obligations are derived from both the Equitable Share received and distributed nationally, as well as the revenue a municipality can raise locally. It is important to highlight the following assumptions: Expenditure: Salaries: Proposed salary increase based on inflation plus 1% (6,5%) plus a notch increase of 2,5% has been provided for in final budget. Salary and Wage Collective agreement comes to and end on 30 June 2018 and negotiations for a new wage curve has begun during December Councillors Remuneration: 6% increase is budgeted for. The cost associated with the remuneration of councillors is determined by the Minister of Cooperative Governance and Traditional Affairs in accordance with the Remuneration of Public Office Bearers Act, 1998 (Act 20 of 1998). Eskom Bulk Electricity Tariff Bulk purchases will increase with 7.23% (With the final approval of NERSA) Bulk Water Tariff: Overberg Water has announced a 24% increase in the bulk water price Revenue Tariffs& Revenue Projections: Tariffs must be cost-reflective as far as possible because any subsidisation places a burden on another group of consumers. National Treasury continues to encourage municipalities to keep increases in rates, tariffs and other charges as low as possible. Increases are as follows: Particulars 2018/19 Property Rates 10.00% Water 25.10% Sewerage 16.30% Electricty ( Subject to NERSA approval) 6.84% Refuse removal 18.25% 60
65 Households It is assumed that the total number of households in the municipal area (the tax base) will stay stable during the financial year. Collection rate for municipal services It is assumed that the collection rate (percentage of service charges recovered) for the financial year will be the same as the previous payment rate. In accordance with relevant legislation and national directives, the estimated revenue recovery rates are based on realistic and sustainable trends. The Municipality s collection rate is set at 86.6%. Adequate provision is made for nonrecovery Grants It is assumed that the National and Provincial grants as per the Division of Revenue Bill (DORA Bill) which has been included in the budget will be received during the 2018/19 financial year. Indigents We provided for +/- 7,590 Households. This figure seems to be realistic as there are many occupants of RDP Houses whether the beneficiaries or not who would qualify for Indigents Subsidy. Revenue Cost = R 26,039 million. The following problem areas are key factors to be addresses to ensure that the municipality is financial viable: Subsidisation of rates funded services from trading services No contribution to a capital replacement reserve fund Productivity and Cost Cutting Measures Ageing Infrastructure and inadequate provision for repairs and maintenance Out-dated fiscal model and limited grant funding for the benefit of indigent communities only Institutional capacity and development sustainability Uncontrolled Influx of Indigent People Narrow Revenue Base of the municipality Lack of Accurate Data Required for Longer Term Financial Planning Unfunded/Underfunded Mandates Mind the Gap has been identified in a previous financial year. It remains relevant as it is crucial to narrow the gap between the expectations of the departments, the wider community of TWK and the financial and other resource capacity of the municipality. This includes managing and reducing high stakeholders/ community expectations and increasing capacity/ resources/ efficiency and effectiveness. First, it is important to determine/ assess the financial health and potential (where we are). Then match available resources and potential resources (including financial) against Service Delivery, Infrastructure and Capital Needs for the next years. Local Economic Development (LED) is a very important focus area as we need to broaden our Revenue Capacity by developing in the area. The Successful implementation of the Local Economic Development Strategy is a very important to enhance the Financial Viability of the municipality as LED have a definite impact on job creation, development, etc. The Primary Focus of LED is: Social and Economic Development and Tourism. Tourism promotion and destination marketing SMME Development and Support 61
66 Financial Modelling and Key Planning Drivers As part of the compilation of the 2018/19 MTREF, extensive financial modelling was undertaken to ensure affordability and long-term financial sustainability. The following key factors, such as Demographics, Socio-Economic and Financial Factors and Principles and planning strategies have informed the compilation of the 2018/19 MTREF: CPI Interest Rates Fuel Price Economic Growth Economic Recession/ Job Losses Councillor s and Officials Remuneration Debt Collection Rate Tariff Adjustment Indigent Increase Informal Settlement Control Migration/ Population Increase Equitable Share Bulk Purchase Tariff Increase In addition to the above, the strategic guidance given in National Treasury s MFMA Circulars have been taken into consideration in the planning and prioritisation process. Economic Growth This 2018/2019 budget has to be prepared at the back of what is happening in the local, national and international economy South African Economy Economic growth estimate for 2017 has been revised downwards to 0.7% and is expected to increase slowly to reach 1.9% in National Treasury forecasts a moderate recovery over the next three years. Aim is to reach 2.3% in Inflation forecast has been revised down to 5.3% for Inflation for 2018 and 2019 is expected to remain within the Reserve Bank s target range at 4.9% and 5.2% respectively. A shortfall in tax revenue collection will widen the budget deficit and puts pressure on spending programmes. (increasing debt service costs) South Africa s main challenge remains low economic growth, with further credit rating downgrades and policy uncertainty. Slower growth in the region and global trade weakness limit export potential. This 2018/2019 budget has to be prepared at the back of what is happening in the local, national and international economy. 62
67 Economic outlook and forecast Theewaterskloof comprised R5.401 billion (or per cent) of the Districts total R13.33 billion GDPR at the end of GDP growth averaged 4.46 per cent per annum over the period The municipality s average annual growth of 3.33 per cent in the post-recessionary period still outperforms the District average of 2.97 per cent for this period. Employment growth has nevertheless picked up significantly in the post recessionary period ( ) averaging 3.3 per cent per annum (which is now above the district s rate of 3.0 per cent over the period ). It should further be emphasised as result of the local economy being so dependent on agricultural sector, the effect of the current drought should be considered when compiling our budgets as the consequences or the continuation thereof be felt for a large part in the 2018/19 budget. The Local Economy The local economy of Theewaterskloof is not immune to the global and national economic conditions, in-fact as a rural municipality the effect of the worsening economic conditions will have a more detrimental impact on us which may be compounded by the drought. Guideline from National Treasury to Strengthen Municipalities Government continues to invest in improving the financial capability of municipalities. In the period ahead, National Treasury and provincial treasuries have agreed to focus their efforts on four game changers : The new Municipal Standard Chart of Accounts, which was implemented from 1 July 2017, contributing to greater transparency and consistency of municipal finances. Targeted supply chain management interventions to achieve cost savings and combat fraud. Enhanced revenue management, including appropriate tariff-setting, regular billing and effective collection systems. Improved asset management, including adherence to 8 per cent of the value of assets being spent on their maintenance. If we make progress in local financial management, we will transform the lives of millions of people. Tariff Adjustment A zero-base approach to improve on tariff setting, ensuring that the principles of benefit received, cost of service and cost-recovery, affordability and sustainability is taken into consideration. A Briefing- Session was conducted and one-on-one Sessions was held with Directorates Operations, Development and Technical Services and Town Managers on 9 & 10 January
68 These engagements were dedicated to tariffs and the process of rationalization of services, identification of various categories of consumers, the level of services rendered/demanded and the levying of appropriate cost-recovery tariffs. Factors impacting on Tariff Increases The following factors were taken into consideration when calculating proposed tariff increases: Affordability Economic Recession, Job Losses Councillors Remuneration Personnel Cost Escalating Fuel Prices Economic Indicators (CPI, Interest Rates) Escalating Bulk Purchases Prices (Water and Electricity) Increasing Indigents Electricity Bulk Price Increases (Eskom) Repairs and Maintenance Willingness and Ability to Pay The Level/Standard of Service: the higher the level and standard, the higher the tariffs. Benefit Received Affordability Reputation: Good Governance Good Service Delivery also ensures improved willingness to pay Recover of Capital and Usage Costs Deliverables The possibilities of Rationalisation of Tariffs (number reduced) Tariffs and Tariff Policy simplified for easy understanding and enhanced transparency. Service Delivery Cost fully calculated and tariffs should reflect full cost. Tariff Setting ensures the Sustainability of Services. Tariff Policy must reflect the Financial Strategies. Tariff Goals Revenue Sufficiency Affordability of services Promoting local economic development Wasteful use of service discourage Rate of return on assets (in order to ensure allowance is made for the future expansion of infrastructure) Equitable Share The Equitable Share increased from R 77,911 m in 2017/18 to R 87,385 m 2018/19. Years Equitable Share '000 Indigent Subsidy '000 Subsidy as a % of Equitable Share 2012/ ,343 20,492 38% 2013/ ,262 22,914 40% 2014/ ,481 27,500 44% 2015/ ,908 32,922 52% 2016/ ,861 22,896 33% 2017/ ,911 17,296 22% 2018/ ,385 26,039 30% It is anticipated that Free Basic Services will cost the municipality R 26,039 million in 2018/19. The budgeted amount does not include the cost of R 4,960 million for the ±5046 informal settlements. 64
69 Indigents Subsidy The number of indigent Households is projected to increase. This anticipated increase is mainly caused by high levels of unemployment in the Theewaterskloof region, Agricultural Seasonal Employment and Influx of Indigent people seeking greener pastures. This trend will have a significant impact on the Equitable Share Grant Allocation. Informal Settlement Control It is evident that squatter control is becoming an unavoidable issue which needs to be managed more pro-effectively. The municipality is actively pursuing ideas to establish a squatter control unit to address this issue. Migration/ Population Increase According to the census 2001 Theewaterskoof had a population of 93,276, and the results of the 2011 census the population is 108,790 which shows an estimated increase of 14%. The population growth is especially in the Grabouw and Villiersdorp. Farms is due to the agriculture sector being one of the major economic activities in TWK. The agriculture sector, more intensively in the Fruit production is labour-intensive and seasonal. These farm workers are only economically active for a certain period of the year and can contribute to revenue (municipal service) only during that period. The result of the increase in the population is that there is an increase pressure on our public services such as Clinics, Law Enforcement, and our infrastructure and land availability for houses. Community Consultation The draft 2018/19 MTREF was tabled before Council on 28 March 2018 for community consultation and was published on the municipality s website, and hard copies made available at customer care offices, municipal notice boards and various libraries. All documents in the appropriate format (electronic and printed) was provided to National Treasury, and other national and provincial departments in accordance with section 23 of the MFMA, to provide an opportunity for them to make inputs. Ward Committees and Town Advisory Forum, which serve as the representative forums of stakeholders and form the link between the Municipality and the community, was utilised to facilitate the community consultation process during April 2018, and included nine public briefing sessions. The applicable dates and venues was published in all the local newspapers. 65
70 11. Overview of Budget and Funding In terms of Section 18 of the Municipal Finance Management Act, an Annual Budget may only be funded from: Realistically anticipated revenues to be collected Cash backed accumulated funds from previous years surpluses not committed for other purposes Borrowed funds, but only for the Capital Budget (Fixed assets, Infrastructure, Property, Plant and Equipment) The budget recognizes compliance to the following: Credible, consistent and responsive to the municipality s IDP Funded and achievable in terms of service delivery Institutional Needs Analyses and takes into consideration Risk Analyses, Internal, and External Factors impacting on service delivery. Contains Revenue and Expenditure Projections that are consistent with current and past year performances. The municipality has overcome all the major obstacles which had an impact on its capacity to spend its budget and render services. These include blockages in the form of staff, policies, procedures, and processes. Does not jeopardize the Financial Viability of the municipality. Tariff setting plays a major role in ensuring desired levels of revenue. Getting tariffs right assists in the compilation of a credible and funded budget. The Municipality derives most of its operational revenue from the provision of goods and services such as water, electricity, sanitation and solid waste removal and property rates. Revenue was based on: Growth in the municipality and economic development Revenue management and enhancement Achievement of 86,6 per cent annual collection rate for consumer revenue Electricity tariff increase within the National Electricity Regulator of South Africa (NERSA) approval Achievement of full cost recovery of specific user charges Determining tariff excalation rate by establishing/calculating revenue requirements The Property Rates Policy in terms of the Municipal Property Rates Act, 2004 (Act 6 of 2004) (MPRA), and And the ability to extend new services and obtain cost recovery levels. The above principles guide the annual increase in the tariffs charged to the consumers and the ratepayers aligned to the economic forecasts. 66
71 Services charges relating to electricity, water, sanitation and refuse removal constitutes the biggest component of the revenue basket of the municipality totalling R 225,028 million for the 2018/19 financial year and increasing to R 243,031 million for the 2019/20 financial year Operational grants and subsidies amount to R 146,043 million, R 186,109 million and R 183,270 million for each of the respective financial years of the MTREF Investment revenue actual performance will be carefully monitored. Any variances in this regard will be addressed as part of the mid-year review and adjustments budget. The tables below provide detail investment information and investment particulars by maturity. Monetary investments by type (Table SA15) R thousand Investment type 2014/ / /17 Audited Outcome Audited Outcome Audited Outcome Original Budget Current Year 2017/18 Adjusted Budget Full Year Forecast 2018/19 Medium Term Revenue & 2018/19 Expenditure Framework / /21 Parent municipality Securities - National Gov ernment Listed Corporate Bonds Deposits - Bank 60,541 61,257 49,678 50,726 43,678 43,678 23,678 23,678 23,678 Deposits - Public Inv estment Commissioners Deposits - Corporation for Public Deposits Bankers Acceptance Certificates Negotiable Certificates of Deposit - Banks Guaranteed Endow ment Policies (sinking) Repurchase Agreements - Banks Municipal Bonds Municipality sub-total 60,541 61,257 49,678 50,726 43,678 43,678 23,678 23,678 23,678 Consolidated total: 60,541 61,257 49,678 50,726 43,678 43,678 23,678 23,678 23,678 67
72 The following table is a detailed analysis of the municipality s borrowing liability. Detail of borrowings (Table SA17) Borrowing - Categorised by type 2014/ / /17 Current Year 2017/18 Audited Audited Audited Original Adjusted Full Year R thousand Outcome Outcome Outcome Budget Budget Forecast Parent municipality 2018/19 Medium Term Revenue & Expenditure Framework 2018/ / /21 Annuity and Bullet Loans 102,599 95,389 87, , , , , ,493 95,731 Long-Term Loans (non-annuity ) Local registered stock Instalment Credit Financial Leases 325 PPP liabilities Finance Granted By Cap Equipment Supplier Marketable Bonds Non-Marketable Bonds Bankers Acceptances Financial deriv ativ es Other Securities Municipality sub-total 102,924 95,389 87, , , , , ,493 95,731 Total Borrowing 102,924 95,389 87, , , , , ,493 95, Cash flow Management Cash flow management and forecasting is a critical step in determining if the budget is funded over the medium-term. The table below is consistent with international standards of good financial management practice and also improves the ability for councillors and management to understand. Some specific features include: Clear separation of receipts and payments within each cash flow category; Clear separation of capital and operating receipts from government, which also enables cash from Ratepayers and other to be provide for as cash inflow based on actual performance. In other words the actual collection rate of billed revenue, and Separation of borrowing and loan repayments (no set-off), to assist with MFMA compliance assessment regarding the use of long term borrowing (debt). 68
73 Budget cash flow statement (Table A7) Description 2014/ / /17 Current Year 2017/ /19 Medium Term Revenue & Expenditure Framework R thousand Audited Audited Audited Original Adjusted Full Year Pre-audit Outcome Outcome Outcome Budget Budget Forecast outcome 2018/ / /21 CASH FLOW FROM OPERATING ACTIVITIES Receipts Property rates 64,247 73,631 79,640 84,809 81,595 81,595 81,595 87,112 94, ,608 Service charges 129, , , , , , , , , ,274 Other rev enue 22,117 14,447 26,852 20,210 20,022 20,022 20,022 19,665 21,108 22,660 Gov ernment - operating 74,026 78,618 98, , , , , , , ,270 Gov ernment - capital 109,995 76,425 38,416 61,805 78,323 78,323 78,323 47,348 31,579 31,017 Interest 11,607 7,323 7,323 9,500 11,265 11,265 11,265 13,086 13,640 14,238 Div idends Payments Suppliers and employ ees (284,008) (337,220) (332,146) (393,454) (400,098) (400,098) (400,098) (441,358) (471,896) (503,291) Finance charges (11,877) (11,206) (10,336) (10,527) (10,527) (10,527) (10,527) (12,783) (12,783) (12,783) Transfers and Grants (1,351) (1,214) (2,285) (110) (140) (140) (140) (232) (232) (232) NET CASH FROM/(USED) OPERATING ACTIVITIES 114,641 60,819 76,981 79,736 82,560 82,560 82,560 53,731 72,045 63,760 CASH FLOWS FROM INVESTING ACTIVITIES Receipts Proceeds on disposal of PPE 5,755 1, Decrease (Increase) in non-current debtors Decrease (increase) other non-current receiv ables (453) Decrease (increase) in non-current inv estments (9,642) (894) (919) Payments Capital assets (73,127) (64,675) (63,010) (108,936) (130,284) (130,284) (130,284) (78,756) (47,110) (45,693) NET CASH FROM/(USED) INVESTING ACTIVITIES (77,467) (65,569) (62,021) (108,435) (129,783) (129,783) (129,783) (78,754) (47,109) (45,693) CASH FLOWS FROM FINANCING ACTIVITIES Receipts Short term loans Borrow ing long term/refinancing 32,244 32,032 32,032 32,032 10,420 Increase (decrease) in consumer deposits Payments Repay ment of borrow ing (6,973) (7,675) (7,486) (8,102) (7,645) (7,645) (7,645) (8,463) (8,521) (8,491) NET CASH FROM/(USED) FINANCING ACTIVITIES (6,740) (7,270) (7,079) 24,416 24,510 24,510 24,510 2,247 (8,214) (8,165) NET INCREASE/ (DECREASE) IN CASH HELD 30,435 (12,020) 7,881 (4,283) (22,713) (22,713) (22,713) (22,776) 16,721 9,902 Cash/cash equivalents at the year begin: 38,028 68,463 56,442 46,489 64,323 64,323 64,323 41,611 18,835 35,556 Cash/cash equivalents at the year end: 68,463 56,442 64,323 42,207 41,611 41,611 41,611 18,835 35,556 45, Cash Backed Reserves/Accumulated Surplus Reconciliation This following table meets the requirements of MFMA Circular 42 which deals with the funding of a municipal budget in accordance with sections 18 and 19 of the MFMA. A surplus would indicate the cash-backed accumulated surplus that was/is available. A shortfall (applications > cash and investments) is indicative of non-compliance with section 18 of the MFMA requirement that the municipality s budget must be funded. Non-compliance with section 18 is assumed because a shortfall would indirectly indicate that the annual budget is not appropriately funded (budgeted spending is greater than funds available or to be collected). It is also important to analyse trends to understand the consequences, e.g. the budget year might indicate a small surplus situation, which in itself is an appropriate outcome, but if in prior years there were much larger surpluses then this negative trend may be a concern that requires closer examination. 69
74 Cash backed reserves/accumulated surplus reconciliation (Table A8) R thousand Description 2014/ / /17 Audited Outcome Audited Outcome Audited Outcome Original Budget Current Year 2017/18 Adjusted Budget Full Year Forecast Pre-audit outcome 2018/19 Medium Term Revenue & 2018/19 Expenditure Framework / /21 Cash and investments available Cash/cash equivalents at the year end 68,463 56,442 64,323 42,207 41,611 41,611 41,611 18,835 35,556 45,459 Other current inv estments > 90 day s 0 (0) (0) Non current assets - Investments 9,832 10,726 11,645 10,726 11,645 11,645 11,645 11,645 11,645 11,645 Cash and investments available: 78,295 67,169 75,969 52,933 53,256 53,256 53,256 30,480 47,202 57,104 Application of cash and investments Unspent conditional transfers 10,497 5,259 9,825 2, Unspent borrow ing Statutory requirements Other w orking capital requirements 19,390 9,604 2,631 10,201 2,380 2,380 2,380 (9,386) (20,981) (30,912) Other prov isions Long term inv estments committed Reserves to be backed by cash/inv estments 15,721 8,599 13,386 4,868 13,386 13,386 13,386 13,386 13,386 13,386 Total Application of cash and investments: 45,609 23,463 25,841 18,015 16,743 16,743 16,743 4,977 (6,619) (16,550) Surplus(shortfall) 32,686 43,706 50,128 34,918 36,513 36,513 36,513 25,503 53,820 73,654 From the above table it can be seen that the cash and investments available total R 4,977 million in the 2018/19 financial year and decrease to R 16,550 million by 2020/21, including the projected cash and cash equivalents as determined in the cash flow forecast. The following is a breakdown of the application of this funding: Unspent conditional transfers (grants) are automatically assumed to be an obligation as the municipality has received government transfers in advance of meeting the conditions. Ordinarily, unless there are special circumstances, the municipality is obligated to return unspent conditional grant funds to the national revenue fund at the end of the financial year. In the past these have been allowed to roll-over and be spent in the ordinary course of business, but this practice has been discontinued. There is no unspent borrowing from the previous financial years. Unspent borrowing is ring-fenced and reconciled on a monthly basis to ensure no unnecessary liabilities are incurred. Provisions for statutory requirements include VAT owing to timing differences resulting from year- end obligations. The main purpose of other working capital is to ensure that sufficient funds are available to meet obligations as they fall due. A key challenge is often the mismatch between the timing of receipts of funds from debtors and payments due to employees and creditors. It needs to be noted that, the desired cash levels should be 60 days to ensure continued liquidity of the municipality. Any underperformance in relation to collections could place upward pressure on the ability of the municipality to meet its creditor obligations. Other provision liability is informed by, amongst others, the supplementary pension liability. Long term investments consist primarily of the sinking funds for the repayment of future borrowings. The sinking fund value is held within long term investments and must be held to maturity and is not available for spending. Most reserve fund cash-backing is discretionary in nature, but the reserve funds are not available to support a budget unless they are cash-backed. The reserve funds are not fully cash-backed. The level of cash-backing is directly informed by the municipality s cash backing policy. These include the rehabilitation of landfill sites and quarries. The challenge for the Municipality will be to ensure that the underlying planning and cash flow assumptions are meticulously managed, especially the performance against the collection rate. 70
75 1.5 Funding compliance measurement National Treasury requires that the municipality assess its financial sustainability against fourteen different measures that look at various aspects of the financial health of the municipality. These measures are contained in the following table. All the information comes directly from the annual budgeted statements of financial performance, financial position and cash flows. The funding compliance measurement table essentially measures the degree to which the proposed budget complies with the funding requirements of the MFMA. Each of the measures is discussed below. Funding compliance measurement (Table SA10) Funding measures Description 2014/ / /17 Audited Outcome Audited Outcome Audited Outcome Original Budget Current Year 2017/18 Adjusted Budget Full Year Forecast Pre-audit outcome 2018/19 Medium Term Revenue & 2018/19 Expenditure Framework / /21 Cash/cash equivalents at the year end - R'000 68,463 56,442 64,323 42,207 41,611 41,611 41,611 18,835 35,556 45,459 Cash + inv estments at the y r end less applications - R'000 32,686 43,706 50,128 34,918 36,513 36,513 36,513 25,503 53,820 73,654 Cash year end/monthly employee/supplier payments Surplus/(Deficit) excluding depreciation offsets: R'000 74,029 44,377 49,292 42,355 60,053 60,053 60,053 28,840 46,659 36,434 Serv ice charge rev % change - macro CPIX target ex clusiv e N.A. 7.3% 5.0% (1.6%) (5.3%) (6.0%) (6.0%) 4.7% 2.0% 2.0% Cash receipts % of Ratepay er & Other rev enue 81.3% 78.4% 81.2% 82.3% 79.4% 79.4% 79.4% 79.3% 79.3% 79.3% Debt impairment ex pense as a % of total billable rev enue 16.6% 19.4% 21.6% 17.2% 17.1% 17.1% 17.1% 17.8% 17.8% 17.8% Capital pay ments % of capital ex penditure 99.7% 100.0% 100.0% 100.0% 100.0% 100.0% 100.0% 100.0% 100.0% 100.0% Borrowing receipts % of capital expenditure (excl. transfers) 0.0% 0.0% 0.0% 68.4% 57.8% 57.8% 57.8% 33.2% 0.0% 0.0% Grants % of Govt. legislated/gazetted allocations % 100.0% 100.0% Current consumer debtors % change - incr(decr) N.A. 17.5% (3.5%) 19.0% 13.1% 0.0% 0.0% 23.0% 20.2% 18.1% Long term receivables % change - incr(decr) N.A. 0.0% (32.3%) (24.9%) (30.5%) 0.0% 0.0% (91.6%) (100.0%) 0.0% R&M % of Property Plant & Equipment 3.5% 3.5% 3.8% 11.4% 12.0% 12.0% 12.8% 12.1% 12.7% 13.3% Asset renewal % of capital budget 35.6% 36.0% 37.7% 6.5% 6.6% 6.6% 0.0% 2.5% 0.0% 0.0% Cash/cash equivalent position The municipality s forecast cash position was discussed as part of the budgeted cash flow statement. A positive cash position, for each year of the MTREF would generally be a minimum requirement, subject to the planned application of these funds such as cash-backing of reserves and working capital requirements. If the municipality s forecast cash position is negative, for any year of the medium term budget, the budget is very unlikely to meet MFMA requirements or be sustainable and could indicate a risk of non-compliance with section 45 of the MFMA which deals with the repayment of short term debt at the end of the financial year. The forecasted cash and cash equivalents for the 2018/19 MTREF shows R 18,835 million, R 35,556 million and R 45,459 million for each respective financial year Cash plus investments less application of funds The purpose of this measure is to understand how the municipality has applied the available cash and investments as identified in the budgeted cash flow statement. The detail reconciliation of the cash backed reserves/surpluses is contained in Table A8, on page 19. The reconciliation is intended to be a relatively simple methodology for understanding the budgeted amount of cash and investments available with any planned or required applications to be made. This has been extensively discussed above Monthly average payments covered by cash or cash equivalents The purpose of this measure is to understand the level of financial risk should the municipality be under stress from a collection and cash in-flow perspective. Regardless of the annual cash position an evaluation should be made of the ability of the municipality to meet monthly payments as and when they fall due. It is especially important to consider the position should the municipality be faced with an unexpected disaster that threatens revenue collection such as rate boycotts. 71
76 The ratio for the period 2018/19 is 0.5 to 2019/20 is 0.9. Currently it is estimated that the municipality will have 0.5 months cash available (2018/19), although the municipality s aim is to improve this ratio to at least two months. This measure will have to be carefully monitored going forward Surplus/deficit excluding depreciation offsets The main purpose of this measure is to understand if the revenue levels are sufficient to conclude that the community is making a sufficient contribution for the municipal resources consumed each year. An adjusted surplus/deficit is achieved by offsetting the amount of depreciation related to externally funded assets. Municipalities need to assess the result of this calculation taking into consideration its own circumstances and levels of backlogs. If the outcome is a deficit, it may indicate that rates and service charges are insufficient to ensure that the community is making a sufficient contribution toward the economic benefits they are consuming over the medium term. For the 2018/19 MTREF the indicative outcome is a surplus excluding depreciation off sets of R 28,840 million, R 46,659 million and R 36,434 million. It needs to be noted that a surplus does not necessarily mean that the budget is funded from a cash flow perspective and the first two measures in the table are therefore critical Property Rates/service charge revenue as a percentage increase less macro inflation target The purpose of this measure is to understand whether the municipality is contributing appropriately to the achievement of national inflation targets. This measure is based on the increase in revenue, which will include both the change in the tariff as well as any assumption about real growth such as new property development, services consumption growth etc. The factor is calculated by deducting the maximum macro-economic inflation target increase (which is currently 3-6 per cent). The result is intended to be an approximation of the real increase in revenue. From the table above the percentage for the 2018/19 MTREF is 4.7% and 2% for the outer years. The outcome is lower than it should be due to the slowdown in the economy and a reduction in consumption patterns. This trend will have to be carefully monitored and managed with the implementation of the budget Cash receipts as a percentage of ratepayer and other revenue This factor is a macro measure of the rate at which funds are collected. This measure is intended to analyse the underlying assumed collection rate for the MTREF to determine the relevance and credibility of the budget assumptions contained in the budget. It can be seen that the outcome is at 79.3 per cent each of the respective financial years. Given that the assumed collection rate for rates and service charges was based on an 86.6 per cent performance target, the cash flow statement has been conservatively determined Debt impairment expense as a percentage of billable revenue This factor measures whether the provision for debt impairment is being adequately funded and is based on the underlying assumption that the provision for debt impairment (doubtful and bad debts) has to be increased to offset under-collection of billed revenues. The provision has been appropriated at 17.8 per cent over the MTREF. 72
77 Capital payments percentage of capital expenditure The purpose of this measure is to determine whether the timing of payments has been taken into consideration when forecasting the cash position Borrowing as a percentage of capital expenditure (excluding transfers, grants and contributions) The purpose of this measurement is to determine the proportion of a municipality s own-funded capital expenditure budget that is being funded from borrowed funds to confirm MFMA compliance. Externally funded expenditure (by transfers/grants and contributions) has been be excluded. It can be seen that borrowing equates to 33.2 per cent of own funded capital Transfers/grants revenue as a percentage of Government transfers/grants available The purpose of this measurement is mainly to ensure that all available transfers from national and provincial government have been budgeted for. A percentage less than 100 per cent could indicate that not all grants as contained in the Division of Revenue Act (DoRA) have been budgeted for. The municipality has budgeted for all transfers Consumer debtors change (Current and Non-current) The purpose of these measures is to ascertain whether budgeted reductions in outstanding debtors are realistic. There are 2 measures shown for this factor; the change in current debtors and the change in long term receivables, both from the Budgeted Financial Position. The ratio reflected in 2018/19 financial year for current consumer debtors is 23% and long term receivables percentage change are -91.6% Repairs and maintenance expenditure level This measure must be considered important within the context of the funding measures criteria because a trend that indicates insufficient funds are being committed to asset repair could also indicate that the overall budget is not credible and/or sustainable in the medium to long term because the revenue budget is not being protected. Details of the municipality s strategy pertaining to asset management and repairs and maintenance are contained in Table SA34C on page 89. As previously illustrated the municipality has a relatively low expenditure percentage on Repairs and Maintenance Asset renewal/rehabilitation expenditure level This measure has a similar objective to aforementioned objective relating to repairs and maintenance. A requirement of the detailed capital budget (since MFMA Circular 28 which was issued in December 2005) is to categorise each capital project as a new asset or a renewal/rehabilitation project. The objective is to summarise and understand the proportion of budgets being provided for new assets and also asset sustainability. A declining or low level of renewal funding may indicate that a budget is not credible and/or sustainable and future revenue is not being protected, similar to the justification for repairs and maintenance budgets. Further details in this regard are contained in Table SA34b on page
78 12. Expenditure on allocations and grant programmes Expenditure on allocations and grant programmes (Table SA19) Description 2014/ / /17 Current Year 2017/18 Audited Audited Audited Original Adjusted Full Year R thousand Outcome Outcome Outcome Budget Budget Forecast EXPENDITURE: Operating expenditure of Transfers and Grants 2018/19 Medium Term Revenue & Expenditure Framework 2018/ / /21 National Government: 71,474 72,710 77,078 85,641 85,804 85,804 99,009 98, ,298 Local Gov ernment Equitable Share 62,481 63,908 69,861 77,911 77,911 77,911 87,385 95, ,492 Ex panded Public Works Programme [Schedule 5B] 1,097 1,148 1,049 1,621 1,623 1,623 1,451 Public Works Local Gov ernment Financial Management Grant [Schedule 5B] 1,600 1,124 1,625 1,700 1,700 1,700 1,700 1,700 1,700 Municipal Infrastructure Grant [Schedule 5B] 878 3,809 3,745 4,041 4,179 4,179 3, ,271 Integrated National Electrification Programme [Schedule 5B] , Municipal Systems Improvement Grant [Schedule 5B] MUNICIPAL DISASTER RECOVERY VAT ON CAPITAL GRANTS 4, Provincial Government: 36,991 53,946 16,943 43,655 50,561 50,561 47,034 87,244 74,972 Capacity Building Community Development Workers Human Settlement Dev elopment 29,543 45,355 7,881 36,240 41,358 41,358 37,155 76,869 64,500 Library Service 5,873 6,740 7,950 6,718 6,718 6,718 8,942 9,809 10,342 Maintenance of Main Roads Thusong Centre Western Cape Financial Management Support Grant Municipal Capacity Building LG Graduate Internship Grant MUNICIPAL INFRASTRUCTURE SUPPORT 448 VIOLENCE PREVENTION 500 District Municipality: N/A Other grant providers: 1, DBSA Local Economic Development IDC 54 SANRAL 153 HAN 990 National Skills Fund Total operating expenditure of Transfers and Grants: 109, ,982 94, , , , , , ,270 Capital expenditure of Transfers and Grants National Government: 29,598 27,885 25,612 25,424 34,341 34,341 22,489 31,579 31,017 Municipal Infrastructure Grant [Schedule 5B] 21,404 21,812 19,910 22,792 23,775 23,775 22,054 25,452 25,452 Integrated National Electrification Programme (Municipal Grant) 3,421 4,169 5,702 2,632 7,132 7, ,127 5,565 Emergency Disaster Relief Grant 3,134 3,134 Public Works MUNICIPAL SYSTEMS IMPROVEMENT GRANT [SCHEDULE 5 REGIONAL BULK INFRASTRUCTURE 4,773 1,898 Provincial Government: 30,074 5,468 11,354 36,381 40,495 40,495 24,859 Library Service 358 Human Settlements 29,555 5,468 11,354 36,381 37,760 37,760 24,100 Sport and Recreation 401 MUNICIPAL INFRASTRUCTURE SUPPORT 518 Thusong Centre Emergency Disaster Relief Grant 2,700 2,700 District Municipality: N/A Other grant providers: 1,450 4,470 4,470 SANRAL 4,470 4,470 DBSA 1,450 Total capital expenditure of Transfers and Grants 59,671 33,353 38,416 61,805 79,306 79,306 47,348 31,579 31,017 TOTAL EXPENDITURE OF TRANSFERS AND GRANTS 169, , , , , , , , ,287 74
79 Salaries, allowances & benefits (political office bearers, councillors/senior managers) (Table SA23) Disclosure of Salaries, Allowances & Benefits 1. Salary Contributions Allowances Performance Bonuses In-kind benefits Total Package Rand per annum Councillors Speaker Chief Whip Ex ecutiv e May or Deputy Ex ecutiv e May or Ex ecutiv e Committee Total for all other councillors 12,179,060 12,179,060 Total Councillors 12,179,060 12,179,060 Senior Managers of the Municipality Municipal Manager (MM) 1,134,649 45, ,749 97,529 1,389,861 Chief Finance Officer 837, , ,936 85,018 1,213,004 Directorate: Technical Serv ices 837, , ,936 85,018 1,213,004 Directorate: Operations 1,076, , ,894 97,900 1,399,419 Directorate: Dev elopment Directorate: Corporate Serv ices 837, , ,936 85,018 1,213,004 List of each offical with packages >= senior manager Total Senior Managers of the Municipality 4,724, , , ,483 6,428,293 TOTAL COST OF COUNCILLOR, DIRECTOR and EXECUTIVE REMUNERATION 16,903, , , ,483 18,607,353 75
80 Summary councillor and staff benefits (Table SA22) Summary of Employee and Councillor R thousand remuneration 2014/ / /17 Audited Outcome Audited Outcome Audited Outcome Original Budget Current Year 2017/18 Adjusted Budget Full Year Forecast 2018/19 Medium Term Revenue & 2018/19 Expenditure Framework / /21 A B C D E F G H I Councillors (Political Office Bearers plus Other) Basic Salaries and Wages 7,087 7,615 10,808 9,771 9,771 10,211 11,028 11,911 Pension and UIF Contributions Medical Aid Contributions Motor Vehicle Allow ance ,044 1,127 Cellphone Allowance ,041 Housing Allow ances Other benefits and allow ances Sub Total - Councillors 8,573 8,939 11,650 11,628 11,628 12,179 13,153 14,206 % increase 4.3% (100.0%) (0.2%) 4.7% 8.0% 8.0% Senior Managers of the Municipality Basic Salaries and Wages 5,706 6,247 5,938 5,948 4,039 4,039 4,725 5,103 5,511 Pension and UIF Contributions 613 1, Medical Aid Contributions Ov ertime Performance Bonus Motor Vehicle Allow ance Cellphone Allowance Housing Allow ances Other benefits and allow ances Pay ments in lieu of leav e Long serv ice aw ards Post-retirement benefit obligations Sub Total - Senior Managers of Municipality 8,060 8,629 6,363 7,384 5,598 5,598 6,428 6,943 7,498 % increase 7.0% (26.3%) 16.1% (24.2%) 14.8% 8.0% 8.0% Other Municipal Staff Basic Salaries and Wages 81,995 98, , , , , , , ,338 Pension and UIF Contributions 14,588 15,862 18,389 21,038 21,083 21,083 22,818 24,644 26,615 Medical Aid Contributions 4,068 4,699 5,274 5,745 5,825 5,825 6,664 7,197 7,773 Ov ertime 5,232 4,494 5,505 5,228 6,358 6,358 6,333 6,839 7,386 Performance Bonus Motor Vehicle Allow ance 4,975 5,445 6,891 9,429 9,567 9,567 7,822 8,448 9,124 Cellphone Allowance (41) Housing Allow ances 507 1,534 1,474 1,507 2,050 2,050 1,259 1,360 1,469 Other benefits and allow ances 10,302 6,016 7,092 5,000 5,608 5,608 5,210 5,627 6,077 Pay ments in lieu of leav e 1,947 2,003 2,023 1,800 1,800 1,800 2,000 2,160 2,333 Long serv ice aw ards ,793 1,880 1, Post-retirement benefit obligations 6,586 2,946 2,700 3,575 3,575 3,575 9,000 9,720 10,498 Sub Total - Other Municipal Staff 130, , , , , , , , ,112 % increase 8.4% 10.1% 15.1% (1.5%) 10.6% 8.0% 8.0% Total Parent Municipality 147, , , , , , , , , % 2.0% 22.3% (2.3%) 10.3% 8.0% 8.0% TOTAL SALARY, ALLOWANCES & BENEFITS 147, , , , , , , , ,816 % increase 8.1% 2.0% 22.3% (2.3%) 10.3% 8.0% 8.0% TOTAL MANAGERS AND STAFF 138, , , , , , , , ,610 76
81 Summary of personnel numbers (Table SA24) Summary of Personnel Numbers 2016/17 Current Year 2017/ /19 Number Positions Permanent employees Contract employees Positions Permanent employees Contract employees Positions Permanent employees Contract employees Municipal Council and Boards of Municipal Entities Councillors (Political Office Bearers plus Other Councillors) Board Members of municipal entities Municipal employees Municipal Manager and Senior Managers Other Managers Professionals Finance Spatial/town planning Information Technology Roads Electricity Water Sanitation Refuse Other Technicians Finance Spatial/town planning Information Technology Roads Electricity Water Sanitation Refuse Other Clerks (Clerical and administrativ e) Serv ice and sales w orkers Skilled agricultural and fishery w orkers Craft and related trades Plant and Machine Operators Elementary Occupations TOTAL PERSONNEL NUMBERS % increase 4.8% 2.2% (17.4%) 4.8% 7.0% 5.3% Total municipal employees headcount Finance personnel headcount Human Resources personnel headcount
82 13. Annual Budgets and Service delivery and Budget Implementation plans- Internal Departments The Functional performance of the municipality provides comprehensive information on the implementation of the SDBIP and the relevant Functional Area reporting schedule: a. A detailed departmental SDBIP will be available on the website of TWK Municipality. The functional breakdown per Directorate is as follows: Corporate Service: Legal Advisory Both the Director and deputy Director Corporate Services are the Legal Officers for the organisation and provide legal support to all Directorates Administration Give administrative support to the Council and its political structures Corporate support for other Directorates and Town offices Provision of secretariat services to all directorates The management of the municipality s incoming and outgoing mail including the distribution and dispatch of correspondence to and from the public The management of access to records The management of Security and Cleaning Services Human Resources Ensuring a skilled workforce through training and selection Ensuring sound HR administration Ensuring an informed labour force by practicing sound labour relations Ensuring a sound organisational structure Information Technology The Information Technology department serves as support function for the whole of the organization: Maintaining the IT and communication Infrastructure Facilitate the integration of information systems Establishing and maintaining proper backup procedures and systems Ensuring information security Development Services: Integrated Development Planning This department provides a unique support service to all departments, community and council. It is responsible for the coordination and management of the IDP process, Organisational Performance Management, Annual Reporting, Service Delivery and Budget Implementation Plan, and Social Development Local Economic Development (LED) and Tourism Create an enabling environment for economic development Increase economic opportunities for people 78
83 Promote intergovernmental collaboration Build local Capacity Encourage PPP in Local economic Development Monitor and evaluate LED strategy. Capacitate SMME s Housing and Integrated Human Settlement The function of this department is to facilitate, manage and maintain low cost housing development within the Theewaterskloof Municipality Property Management The Property Management section has to ensure that Municipal owned immovable assets are managed efficiently, effectively and economically and are dealt with in a manner which will ensure the maximum benefit to the municipality and the community Financial Services: Expenditure and Supply Chain Management Salaries: Implementation of approved payroll, paying of salaries, allowances and accounting for payroll implementation Creditors: Payment and recording of creditors payments and reconciliations Supply Chain Management: Responsible for the Administration and Management of Procurement of goods and services (i.e. Acquisition Management in particular) Bank Reconciliation Administration and Management of Investments Administration and Management of Loans Maintain Professionalism, Honesty, Integrity and Internal Controls Revenue Management Facilitation and application for Municipal Services Debtors Billing Administration and Management Meter Reading Administration of Clearance Certificates Rendering of Monthly Consumer / Rates Debtors Accounts Debtors Customer Care and Query Administration Receipting and bank revenue management Credit Control, Debt Collection and Indigents Management Maintain Professionalism, Honesty, Integrity and Internal Controls Budget Office Budget In-year Reporting Annual Financial Statements, Budgetary Management and Control Asset Management Insurance Management Costing Services (commenced in September 2009) Financial Viability Co-ordinate Financial Policy Formulation 79
84 Financial Management Workshops under leadership of CFO Maintain Professionalism, Honesty, Integrity and Internal Controls Technical Service: Water Distribution and Treatment (Supply potable water in accordance with (SABS 241) to the residents within its jurisdiction. In terms of Schedule 4B of the Constitution: Water and Sanitation Services limited to potable water supply systems ) Roads The Theewaterskloof Municipality is responsible for the roads and storm water reticulation within the towns of the WC031 established municipal area. The Roads and Storm water Division functions as a division on its own headed by the Assistant manager of each town. This unit has 85 trained technical, artisans and other operational staff Electricity Distribution The electricity purchase and distribution functions of the municipality are administered as follows and include: The effective and efficient distribution and reticulation of energy in the following towns (Caledon, Villiersdorp, Greyton and Riviersonderend. Grabouw, Genadendal, Tesselaarsdal, Botrivier and Middleton reside within Eskom jurisdiction) Distribute electricity subject to the license conditions set by NERSA Electricity/Street lighting Provide adequate street lighting for urban areas Maintain/Repair of faulty street lights Upgrade of existing services as well as new developments These services extend to include Theewaterskloof (Caledon, Greyton, Riviersonderend and Villiersdorp, but do not take account rural areas such as Tesselaarsdal, Botrivier, Grabouw, Genadendal which resides within the jurisdiction of provincial Government Waste Water Management (Sewerage) TheewaterskloofMunicipality provides sewerage collection systems, comprising water borne sewer networks, bucket removal system and vacuum tanker service where necessary, and treats the collected effluent at 7 sewage treatment plants. Further services include the provision and maintenance of communal toilets in informal areas Solid Waste Management Theewaterskloof municipality is responsible for the day to day operations in every town and for the removal and collection of the waste, cleaning of road reserves and most public open places. There are three Transfer-stations in the Municipal jurisdiction, one in Grabouw, Villiersdorp and the other in Botriver. Caledon has a licensed waste site but Genadendal, Greyton and Riviersonderend is not permitted yet. FleetManagement To manage and maintain all fleet of the municipality. To provide sufficient municipal services to all residence within the municipal boundary. OPERATIONS Responsible for the day-to-day to service delivery within all Theewaterskloof Towns. 80
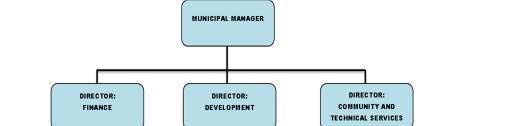
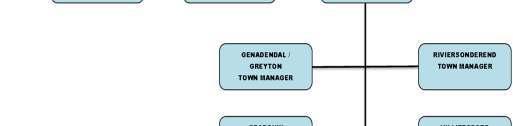
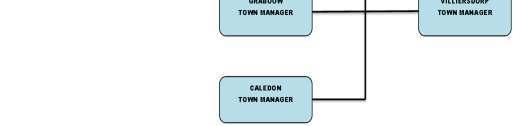
85 Senior Management Capability and Structure 81


86 14. Capital expenditure details In terms of the municipality s Supply Chain Management Policy, no contracts are awarded beyond the medium-term revenue and expenditure framework (three years). In ensuring adherence to this contractual time frame limitation, all reports submitted to either the Bid Evaluation and Adjudication Committees must obtain formal financial comments from the Financial Management Division of the Treasury Department. Capital Budget The capital budget per function, town and per funding source is illustrated below: The Capital Budget amounts to R 78,756 million in 2018/19, R 47,110 million in 2019/20 and R 45,693 million in 2020/21. CAPITAL PER FUNCTION 2018/2019 Assets 200,000 Electricity 3,515,000 Inventory 3,853,815 Property Servces 50,000 Roads 877,193 Sanitation 18,686,269 Solid waste 10,734,180 Sport 1,600,000 Traffic 6,300,000 Water 6,336,287 Fleet 2,402,922 Land & Buildings 100,000 Housing 24,100,000 78,755,666 CAPITAL PER TOWN 2018/2019 Botrivier 4,505,000 Caledon 24,182,244 Caledon and Villiersdorp 171,400 Grabouw 27,806,000 Greyton 152,000 Riviersonderend 6,251,592 TWK 6,740,837 Villiersdorp 8,946,593 78,755,666 CAPITAL FUNDING SOURCES 2018/2019 MIG 22,053,912 Loans 10,420,279 NEP 434,783 Capital Out of Revenue 3,864,000 CRR 10,254,573 Development of Sport & Recreation Facilities 401,000 Housing Grant 24,100,000 OWN Funds 6,869,119 Library 358,000 78,755,666 82

 CAPEX")

OPEX 130,000 130,000 130,000")
87 The table below reflects the 2018 Division of Revenue Act Grant Allocations GRANT ALLOCATIONS 2018/2019 NATIONAL ALLOCATIONS GRANT 2018/ / /2021 BUDGET EXCL VAT VAT BUDGET Budget R'000 R'000 R'000 EQUITABLE SHARE 87,385, ,274, ,492,000 EQUITABLE SHARE FORMULA OPEX 87,385, ,274, ,492,000 SPECIAL SUPPORT FOR COUNCILLOR REMUNERATION OPEX FINANCIAL MANAGEMENT GRANT (FMG) OPEX 1,700,000 1,479, ,000 1,700,000 1,700,000 MUNICIPAL SYSTEMS IMPROVEMENT GRANT (MSIG) OPEX MUNICIPAL INFRASTUCTURE GRANT (MIG) 25,962,000 22,653,913 3,308,087 26,430,000 27,723,000 OPERATING OPEX 600, , CAPITAL CAPEX 25,361,999 22,053,912 3,308,087 26,430,000 27,723,000 INTEGRATED NATIONAL ELECTRIFICATION PROGRAMME GRANT (NEP) CAPEX 5,000,000 4,347, ,421 7,040,000 6,400,000 EXPANDED PUBLIC WORKS PROGRAMME (EPWP) OPEX 1,451,000 REGIONAL BULK INFRASTRUCTURE GRANT (BIG) CAPEX TOTAL NATIONAL GRANTS 121,498,000 51,134,405 7,489, ,444, ,315,000 PROVINCIAL ALLOCATIONS INTEGRATED HOUSING & HUMAN SETTLEMENT DEVELOPMENT GRANT 61,255,000 76,869,000 64,500,000 INTEGRATED HOUSING: OPERATIONAL OPEX 24,100, INTEGRATED HOUSING: CAPITAL CAPEX 37,155, LIBRARY SERVICES 9,300, ,809,000 10,342,000 LIBRARY SERVICES: CONDITIONAL OPEX 3,300,000 3,478,000 3,669,000 LIBRARY SERVICES: REPLACEMENT CAPITAL CAPEX 358,000 LIBRARY SERVICES: REPLACEMENT OPEX 5,642,000 6,331,000 6,673,000 COMMUNITY DEVEOPMENT WORKER OPERATIONAL SUPPORT GRANT (CDW)OPEX 130, , ,000 MAINTENANCE OF PROCLAIMED ROADS OPEX 117,000 ` - - VPUU OPEX FINANCIAL MANAGEMENT SUPPORT GRANT OPEX 330, ,000 - THUSONG CENTRE (OPERATIONAL) OPEX - 106,000 - FINANCIAL MANAGEMENT CAPACITY BUILDING GRANT OPEX 360, DEVELOPMENT OF SPORT AND RECREATION CAPEX 401,000 TOTAL PROVINCIAL GRANTS 71,893, ,244,000 74,972,000 OTHER GRANT PROVIDERS HAN OPEX 1,000, SETA OPEX TOTAL OTHER GRANT PROVIDERS 1,000, GRAND TOTAL 194,391, ,688, ,287,000 NOTE: Allocations for Conditional Grants are only made for one year and the amounts published for the outer years in the schedules of the Division of Revenue Act (DORA) are published for indicative purposes only and are not guarenteed. OPEX 126,115, ,349, ,664,000 CAPEX 68,275,999 33,470,000 34,123,000 TOTAL 194,391, ,819, ,787,000 83
NAMA KHOI LOCAL MUNICIPALITY
 NAMA KHOI LOCAL MUNICIPALITY FINAL BUDGET 2017/18 TO 2019/20 Copies of this document can be viewed: In the foyers of all municipal buildings All public libraries within the municipality At www.namakhoi.gov.za
2012/13 MEDIUM TERM REVENUE AND EXPENDITURE FORECASTS
 ANNUAL BUDGET OF LEJWELEPUTSWA DISTRICT MUNICIPALITY 2012/13 MEDIUM TERM REVENUE AND EXPENDITURE FORECASTS Copies of this document can be viewed: In the foyers of all municipal buildings All public libraries
Monthly Budget Statement January 2015
 SWELLENDAM MUNICIPALITY PAGE 1 SWELLENDAM MUNICIPALITY In-Year Report Prepared in terms of the Local Government: Municipal Finance Management Act (56/2003): Municipal and Reporting Regulations, Government
THE BUDGET OF DR RUTH SEGOMOTSI MOMPATI DISTRICT MUNICIPALITY
 THE BUDGET OF DR RUTH SEGOMOTSI MOMPATI DISTRICT MUNICIPALITY 2017/18 TO 2019/20 MEDIUM TERM REVENUE AND EXPENDITURE FORECASTS SCHEDULE A ANNUAL BUDGET AND SUPPORTING DOCUMENTATION OF A MUNICIPALITY ii
NONGOMA MUNICIPALITY
 ANNUAL BUDGET OF NONGOMA MUNICIPALITY 2018/19 TO 2020/21 MEDIUM TERM REVENUE AND EXPENDITURE FORECASTS Draft budget and Medium Term Revenue Expenditure Framework for 2018/19 year Page 1 of 66 Table of
BERGRIVIER MUNICIPALITY REPORT BY THE STRATEGIC MANAGER
 BERGRIVIER MUNICIPALITY REPORT BY THE STRATEGIC MANAGER TO: MAYORAL COMMITTEE COUNCIL 2015/16 QUARTERLY BUDGET AND PERFORMANCE REPORT FOR QUARTER 4: 1 APRIL 30 JUNE 2016 SUBMITTED IN TERMS O F SECTION
29 March 2012 MBOMBELA LOCAL MUNICIPALITY DRAFT 2012/ /2015 ANNUAL BUDGET AND MEDIUM- TERM REVENUE AND EXPENDITURE FRAMEWORK
 29 March 2012 MBOMBELA LOCAL MUNICIPALITY DRAFT 2012/2013 2014/2015 ANNUAL BUDGET AND MEDIUM- TERM REVENUE AND EXPENDITURE FRAMEWORK MBOMBELA LOCAL MUNICIPALITY 2012/13 TO 2014/15 DRAFT ANNUAL BUDGET AND
THABA CHWEU LOCAL MUNICIPALITY
 Thaba Chweu Municipality 2017/18 Annual Budget and MTREF THABA CHWEU LOCAL MUNICIPALITY MEDUIM TERM REVENUE AND EXPENDITURE FRAMEWORK 2017/18 TO 2019/20 Copies of this document can be viewed: In the foyers
Bergrivier Municipality
 Bergrivier Municipality 1 st ADJUSTMENT BUDGET 2017-2018 27 February 2018 Table of Contents PART 1 ADJUSTMENTS BUDGET * Mayor s report * Resolutions * Executive summary * Adjustments budget tables PART
ADJUSTMENT BUDGET 2017/18
 SOL PLAATJE LOCAL MUNICIPALITY (NC091) ADJUSTMENT BUDGET 2017/18 27 February 2018 Table of Contents PART 1 - ADJUSTMENT BUDGET... 4 1. Executive Mayor s Report... 5 2. Resolutions... 5 3. Executive Summary...
SETSOTO LOCALL MUNICIPALITY
 ANNUAL BUDGET OF SETSOTO LOCALL MUNICIPALITY Page 1 TABLE OF CONTENTS 2013/14 TO 2015/16 MEDIUM TERM REVENUE AND EXPENDITURE FORECASTS PART 1: ANNUAL BUDGET 6 1.1 MAYOR S REPORT 6 (REFER TO THE ATTACHMENT)
Draft Medium-Term Budget 2019/ /22 CITY OF JOHANNESBURG DRAFT MEDIUM-TERM BUDGET 2019/20 TO 2021/22
 CITY OF JOHANNESBURG DRAFT MEDIUM-TERM BUDGET 2019/20 TO 2021/22 MARCH 2019 1 Table of Contents Page No PART1- ANNUAL BUDGET 1.1. EXECUTIVE SUMMARY 9 1.2. OPERATING BUDGET FRAMEWORK 11 1.3. CAPITAL EXPENDITURE
NONGOMA MUNICIPALITY
 ANNUAL BUDGET OF NONGOMA MUNICIPALITY 2018/19 TO 2020/21 MEDIUM TERM REVENUE AND EXPENDITURE FORECASTS Final budget and Medium Term Revenue Expenditure Framework for 2018/19 year Page 1 of 66 Table of
NW371 Moretele - Table A1 Budget Summary
 NW371 Moretele - Table A1 Summary Description 2012/13 2013/14 2014/15 Medium Term Revenue & Expenditure R thousands Pre-audit outcome Year Year +1 2017/18 Year +2 2018/19 Financial Performance Property
CAPE AGULHAS MUNICIPALITY
 CAPE AGULHAS MUNICIPALITY MTREF 2018/2019 2020/2021 - Version 1 23 March 2018 CAPE AGULHAS MUNICIPALITY MEDIUM TERM REVENUE AND EXPENDITURE FRAMEWORK 2018/2019 TO 2020/2021 March 2018 1 ANNUAL BUDGET OF
Draft budget and Medium Term Revenue & Expenditure Framework for 2017/18term
 2017/18term ANNUAL BUDGET OF NONGOMA MUNICIPALITY 2017/18 TO 2019/20 MEDIUM TERM REVENUE AND EXPENDITURE FORECASTS Final budget and Medium Term Revenue Expenditure Framework for 2016/17 year Page 1 of
Medium-Term Budget 2018/ /21 CITY OF JOHANNESBURG MEDIUM-TERM BUDGET 2018/19 TO 2020/21
 CITY OF JOHANNESBURG MEDIUM-TERM BUDGET 2018/19 TO 2020/21 1 Table of Contents Page No PART1- ANNUAL BUDGET 1.1. EXECUTIVE SUMMARY 9 1.2. OPERATING BUDGET FRAMEWORK 9 1.3. CAPITAL EXPENDITURE 16 1.4. ANNUAL
C51/07/2013 FINANCES: ADJUSTMENT BUDGET FOR THE 2012/2013 FINANCIAL YEAR: JULY /1/2 (B)/wm
/wm") Adjustment July 2013 C51/07/2013 FINANCES: ADJUSTMENT BUDGET FOR THE 2012/2013 FINANCIAL YEAR: JULY 2013 5/1/2 (B)/wm RESOLVED BY COUNCIL 1. THAT the unauthorised expenditure of R350 000 on P1100224 due
Adjustment July 2013 C51/07/2013 FINANCES: ADJUSTMENT BUDGET FOR THE 2012/2013 FINANCIAL YEAR: JULY 2013 5/1/2 (B)/wm RESOLVED BY COUNCIL 1. THAT the unauthorised expenditure of R350 000 on P1100224 due
MUNICIPAL FINANCE MANAGEMENT ACT (MFMA): PRELIMINARY MONTHLY FINANCIAL REPORT FOR THE PERIOD ENDED 30 SEPTEMBER 2018 (MONTHLY BUDGET STATEMENT)
: PRELIMINARY MONTHLY FINANCIAL REPORT FOR THE PERIOD ENDED 30 SEPTEMBER 2018 (MONTHLY BUDGET STATEMENT)") 10 October 2018 THE CITY MANAGER THE EXECUTIVE MAYOR MUNICIPAL FINANCE MANAGEMENT ACT (MFMA): PRELIMINARY MONTHLY FINANCIAL REPORT FOR THE PERIOD ENDED 30 SEPTEMBER 2018 (MONTHLY BUDGET STATEMENT) 1. PURPOSE
10 October 2018 THE CITY MANAGER THE EXECUTIVE MAYOR MUNICIPAL FINANCE MANAGEMENT ACT (MFMA): PRELIMINARY MONTHLY FINANCIAL REPORT FOR THE PERIOD ENDED 30 SEPTEMBER 2018 (MONTHLY BUDGET STATEMENT) 1. PURPOSE
MUNICIPAL FINANCE MANAGEMENT ACT (MFMA): BUDGET AND PERFORMANCE ASSESSMENT REPORT IN TERMS OF THE MFMA, SECTION
: BUDGET AND PERFORMANCE ASSESSMENT REPORT IN TERMS OF THE MFMA, SECTION") 16 JANUARY 2018 MUNICIPAL FINANCE MANAGEMENT ACT (MFMA): BUDGET AND PERFORMANCE ASSESSMENT REPORT IN TERMS OF THE MFMA, SECTION 72 (1) (a), FOR THE SIX (6) MONTHS ENDED 31 DECEMBER 2017 INDEX PAGE 1. Purpose
16 JANUARY 2018 MUNICIPAL FINANCE MANAGEMENT ACT (MFMA): BUDGET AND PERFORMANCE ASSESSMENT REPORT IN TERMS OF THE MFMA, SECTION 72 (1) (a), FOR THE SIX (6) MONTHS ENDED 31 DECEMBER 2017 INDEX PAGE 1. Purpose
Adjustments Budget of Kareeberg Municipality
 Adjustments Budget of Kareeberg Municipality 2015/16 VISION A SUSTAINABLE, AFFORDABLE and DEVELOPMENTAL QUALITY SERVICE for ALL MISSION WE WLL ACHIEVE OUR VISION BY ENSURING THAT WE: Provide a continuous
MUNICIPAL FINANCE MANAGEMENT ACT (MFMA): PRELIMINARY MONTHLY FINANCIAL REPORT FOR THE PERIOD ENDED 31 DECEMBER 2017 (MONTHLY BUDGET STATEMENT)
: PRELIMINARY MONTHLY FINANCIAL REPORT FOR THE PERIOD ENDED 31 DECEMBER 2017 (MONTHLY BUDGET STATEMENT)") 12 JANUARY 2018 THE CITY MANAGER THE EXECUTIVE MAYOR MUNICIPAL FINANCE MANAGEMENT ACT (MFMA): PRELIMINARY MONTHLY FINANCIAL REPORT FOR THE PERIOD ENDED 31 DECEMBER 2017 (MONTHLY BUDGET STATEMENT) 1. PURPOSE
12 JANUARY 2018 THE CITY MANAGER THE EXECUTIVE MAYOR MUNICIPAL FINANCE MANAGEMENT ACT (MFMA): PRELIMINARY MONTHLY FINANCIAL REPORT FOR THE PERIOD ENDED 31 DECEMBER 2017 (MONTHLY BUDGET STATEMENT) 1. PURPOSE
UNPACKING INFRASTRUCTURE DEVELOPMENT SPENDING IN LOCAL GOVERNMENT
 UNPACKING INFRASTRUCTURE DEVELOPMENT SPENDING IN LOCAL GOVERNMENT MUNICIPAL INFRASTRUCTURE SUMMIT 25 MAY 2015 OUT LINE Municipal Infrastructure Matrix Access to Basic services backlogs Capital Budget Funding
FINANCIAL REPORT ITEM. The purpose of this report is to inform the Council on the current financial state as at 31 October 2018.
 FINANCIAL REPORT ITEM INTRODUCTION / AIM The purpose of this report is to inform the Council on the current financial state as at 31 October 2018. LEGAL REQUIREMENTS In terms of Section 71 of the Municipal
Verslag Ingxelo Report
 Verslag Ingxelo Report Kantoor van die Direkteur: Finansies 18 Oktober 2018 7/1/2/2-2 WYK: ALLE ITEM 7.1 VAN DIE AGENDA VAN N RAADSVERGADERING WAT GEHOU SAL WORD OP 25 OKTOBER 2018. ONDERWERP: KWARTAALVERSLAG
MUNICIPAL FINANCE MANAGEMENT ACT (MFMA): PRELIMINARY MONTHLY FINANCIAL REPORT FOR THE PERIOD ENDED 31 MARCH 2018 (MONTHLY BUDGET STATEMENT)
: PRELIMINARY MONTHLY FINANCIAL REPORT FOR THE PERIOD ENDED 31 MARCH 2018 (MONTHLY BUDGET STATEMENT)") 16 APRIL 2018 THE CITY MANAGER THE EXECUTIVE MAYOR MUNICIPAL FINANCE MANAGEMENT ACT (MFMA): PRELIMINARY MONTHLY FINANCIAL REPORT FOR THE PERIOD ENDED 31 MARCH 2018 (MONTHLY BUDGET STATEMENT) 1. PURPOSE
16 APRIL 2018 THE CITY MANAGER THE EXECUTIVE MAYOR MUNICIPAL FINANCE MANAGEMENT ACT (MFMA): PRELIMINARY MONTHLY FINANCIAL REPORT FOR THE PERIOD ENDED 31 MARCH 2018 (MONTHLY BUDGET STATEMENT) 1. PURPOSE
Verslag Ingxelo Report
 Verslag Ingxelo Report Kantoor van die Direkteur: Finansies 20 Julie 2017 7/1/2/2-2 WYK: ALLE ITEM 7.4 VAN DIE AGENDA VAN N GEWONE RAADSVERGADERING WAT GEHOU SAL WORD OP 27 JULIE 2017 ONDERWERP: KWARTAALVERSLAG
MUNICIPAL FINANCE MANAGEMENT ACT (MFMA): MONTHLY FINANCIAL REPORT FOR THE PERIOD ENDED 30 APRIL 2016 (MONTHLY BUDGET STATEMENT)
: MONTHLY FINANCIAL REPORT FOR THE PERIOD ENDED 30 APRIL 2016 (MONTHLY BUDGET STATEMENT)") 11 MAY 2016 THE CITY MANAGER THE EXECUTIVE MAYOR MUNICIPAL FINANCE MANAGEMENT ACT (MFMA): MONTHLY FINANCIAL REPORT FOR THE PERIOD ENDED 30 APRIL 2016 (MONTHLY BUDGET STATEMENT) 1. PURPOSE To comply with
11 MAY 2016 THE CITY MANAGER THE EXECUTIVE MAYOR MUNICIPAL FINANCE MANAGEMENT ACT (MFMA): MONTHLY FINANCIAL REPORT FOR THE PERIOD ENDED 30 APRIL 2016 (MONTHLY BUDGET STATEMENT) 1. PURPOSE To comply with
1.1 Executive Mayor s Report Council Resolutions Executive Summary Operating Expenditure Framework Capital Expenditure 22
 TABLE OF CONTENTS 2 PART 1 ANNUAL BUDGET Page 1.1 Executive Mayor s Report 5 1.2 Council Resolutions 7 1.3 Executive Summary 8 1.4 Operating Revenue Framework 10 1.5 Operating 18 1.6 Capital Expenditure
MEDIUM TERM REVENUE AND EXPENDITURE FRAMEWORK 2017/ /20
 MANGAUNG METROPOLITAN MUNICIPALITY MEDIUM TERM REVENUE AND EXPENDITURE FRAMEWORK 2017/18-2019/20 MANGAUNG METROPOLITAN MUNICIPALITY TABLE OF CONTENTS PART 1 - ANNUAL BUDGET 1. Executive Summary 4 2. Summary
Bergrivier Municipality
 Bergrivier Municipality 2 nd ADJUSTMENT BUDGET 2016-2017 9 February 2017 Table of Contents PART 1 ADJUSTMENTS BUDGET * Mayor s report * Resolutions * Executive summary * Adjustments budget tables PART
Click for Instructions!
 mscoa Version 6.1 Click for Instructions! Contact details: Elsabé Rossouw National Treasury Tel: (012) 315-5534 Electronic submissions: lgdocuments@treasury.gov.za 2020 Preparation Instructions Municipality
MEDIUM TERM REVENUE AND EXPENDITURE FRAMEWORK 2014/ /17
 MANGAUNG METROPOLITAN MUNICIPALITY MEDIUM TERM REVENUE AND EXPENDITURE FRAMEWORK 2014/15-2016/17 MANGAUNG METROPOLITAN MUNICIPALITY TABLE OF CONTENTS PART 1 - ANNUAL BUDGET 1. Executive Summary 4 2. Summary
ANNEXURE 23 CAPE TOWN INTERNATIONAL CONVENTION CENTRE (CTICC) (MUNICIPAL ENTITY) SCHEDULE D (ANNUAL BUDGET AND SUPPORTING TABLES)
 (MUNICIPAL ENTITY) SCHEDULE D (ANNUAL BUDGET AND SUPPORTING TABLES)") ANNEXURE 23 CAPE TOWN INTERNATIONAL CONVENTION CENTRE (CTICC) (MUNICIPAL ENTITY) SCHEDULE D (ANNUAL BUDGET AND SUPPORTING TABLES) 2018/19 Budget (March 2018) 2018/2019 CTICC SCHEDULE D ANNUAL BUDGETS AND
ANNEXURE 23 CAPE TOWN INTERNATIONAL CONVENTION CENTRE (CTICC) (MUNICIPAL ENTITY) SCHEDULE D (ANNUAL BUDGET AND SUPPORTING TABLES) 2018/19 Budget (March 2018) 2018/2019 CTICC SCHEDULE D ANNUAL BUDGETS AND
FUNDING & RESERVES POLICY
 FUNDING & RESERVES POLICY UNCHANGED 1 JULY 2016 STEVE TSHWETE LOCAL MUNICIPALITY MP 313 Approved May 2016 C36/05/2016 1. INTRODUCTION The funding and reserves policy is aimed to ensure that the municipality
Bergrivier Municipality
 Bergrivier Municipality 3 rd ADJUSTMENT BUDGET 2015-2016 23 February 2016 Table of Contents PART 1 ADJUSTMENTS BUDGET * Mayor s report * Resolutions * Executive summary * Adjustments budget tables PART
STEVE TSHWETE LOCAL MUNICIPALITY MP
 BUDGET POLICY AMENDED 1 JULY 2016 STEVE TSHWETE LOCAL MUNICIPALITY MP 313 Approved May 2016 C36/05/2016 TABLE OF CONTENTS 1. Definitions 2. Introduction 3. Objective 4. Budgeting principles 5. Budget preparation
BERGRIVIER MUNICIPALITY REPORT BY THE STRATEGIC MANAGER
 BERGRIVIER MUNICIPLITY REPORT BY THE STRTEGIC MNGER REPORT TO: MYORL COMMITTEE COUNCIL 2016/17 MID-YER BUDGET ND PERFORMNCE SSESSMENT COMPILED IN TERMS OF SECTION 72 OF THE MUNICIPL FINNCE MNGEMENT CT,
MEDIUM TERM REVENUE AND EXPENDITURE FRAMEWORK 2015/ /18
 MANGAUNG METROPOLITAN MUNICIPALITY MEDIUM TERM REVENUE AND EXPENDITURE FRAMEWORK - 2017/18 MANGAUNG METROPOLITAN MUNICIPALITY TABLE OF CONTENTS PART 1 - ANNUAL BUDGET 1. Executive Summary 4 2. Summary
MEDIUM TERM REVENUE AND EXPENDITURE FRAMEWORK. (Including NALEDI) 2016/ /19
 2016/ /19") MANGAUNG METROPOLITAN MUNICIPALITY MEDIUM TERM REVENUE AND EXPENDITURE FRAMEWORK (Including NALEDI) 2016/17-2018/19 MANGAUNG METROPOLITAN MUNICIPALITY TABLE OF CONTENTS PART 1 - ANNUAL BUDGET 1. Executive
MANGAUNG METROPOLITAN MUNICIPALITY MEDIUM TERM REVENUE AND EXPENDITURE FRAMEWORK (Including NALEDI) 2016/17-2018/19 MANGAUNG METROPOLITAN MUNICIPALITY TABLE OF CONTENTS PART 1 - ANNUAL BUDGET 1. Executive
MONTHLY BUDGET SUMMARY
 REPORT IN TERMS OF SECTION 71 OF THE MUNICIPAL FINANCE MANAGEMENT ACT NO. 56 OF 2003: IMPLEMENTATION OF THE BUDGET AND FINANCIAL STATE OF AFFAIRS OF THE ELUNDINI MUNICIPALITY FOR THE PERIOD ENDED 31 AUGUST
BERGRIVIER MUNICIPALITY REPORT BY THE STRATEGIC MANAGER
 1 BERGRIVIER MUNICIPALITY REPORT BY THE STRATEGIC MANAGER TO: MAYORAL COMMITTEE COUNCIL 016/17 QUARTERLY BUDGET AND PERFORMANCE REPORT FOR QUARTER 4: 1 APRIL 30 JUNE SUBMITTED IN TERMS OF SECTION 5(d)
uthungulu District Municipality 2016/17 TO 2018/19 DRAFT MEDIUM TERM REVENUE AND EXPENDITURE FORECASTS
 ANNUAL BUDGET OF uthungulu District Municipality 2016/17 TO 2018/19 DRAFT MEDIUM TERM REVENUE AND EXPENDITURE FORECASTS MARCH 2016 Copies of this document can be viewed: In the foyers of all municipal
4.1. To obtain approval for the Adjustment Operating Budget for the 2017/18 financial year.
 4.1 4 ADJUSTMENT OPERATING BUDGET FOR THE 2017/18 FINANCIAL YEAR 1 STRATEGIC THRUST Well Governed and Managed City. 2 OBJECTIVE To obtain approval for the Adjustment Operating for the 2017/18 financial
ASSOCIATED BENEFITS OF mscoa IN THE ASSET LIFE CYCLE
 ASSOCIATED BENEFITS OF mscoa IN THE ASSET LIFE CYCLE Asset life cycle TABLE OF CONTENTS Current challenges in the asset life cycle Associated benefits of mscoa segments in the asset life cycle Other benefits
MANGAUNG METROPOLITAN MUNICIPALITY BUDGET POLICY
 MANGAUNG METROPOLITAN MUNICIPALITY BUDGET POLICY 2 INDEX 1. Statutory Framework... 3 2. Policy Objectives... 8 3. Votes, Categories of Expenditure and Line Items... 8 4. Capital Budget Mythology... 9 5.
MEDIUM TERM REVENUE AND EXPENDITURE FRAMEWORK 2016/ /19
 MANGAUNG METROPOLITAN MUNICIPALITY MEDIUM TERM REVENUE AND EXPENDITURE FRAMEWORK 2016/17-2018/19 MANGAUNG METROPOLITAN MUNICIPALITY TABLE OF CONTENTS PART 1 - ANNUAL BUDGET 1. Executive Summary 4 2. Summary
PLAN AND MANAGE THE BUDGET POLICY & PROCEDURE MANUAL
 PLAN AND MANAGE THE BUDGET POLICY & PROCEDURE MANUAL THABA CHWEU LOCAL MUNICIPALITY Approved 25 June 2012 Resolution no: A50/2012 TABLE OF CONTENTS 1 INTRODUCTION... 1 1.1 Vision and value statement...
The reports and statements set out below comprise the consolidated financial statements presented to the provincial legislature:
 Consolidated Financial Statements for the year ended 30 June 2016 Index The reports and statements set out below comprise the consolidated financial statements presented to the provincial legislature:
LEKWA-TEEMANE LOCAL MUNICIPALITY TERMS OF REFERENCE OVERSIGHT COMMITTEE
 LEKWA-TEEMANE LOCAL MUNICIPALITY TERMS OF REFERENCE OVERSIGHT COMMITTEE To be read in conjunction with National Treasury MFMA Circular 32 The Oversight Report CONTENTS 1. INTRODUCTION 3 2. BACKGROUND 3
6/10/2017 NOTE ORIENTATION. Unit Standard Apply the principles of budgeting within a municipality
 NOTE DIPLOMA IN PUBLIC ACCOUNTABILITY MODULE 13 208 191 / Compliance and control 1 (4 UNIT STANDARDS) US 116345 Dr Len Mortimer Participants are advised to have access to: The respective learner guide,
WALTER SISULU LOCAL MUNICIPALITY
 ANNUAL FINANCIAL STATEMENTS 30 JUNE 2017 INDEX Content General Information Approval of the Financial Statements Statement of Financial Position Statement of Financial Performance Statement of Changes In
BERGRIVIER MUNICIPALITY REPORT BY THE STRATEGIC MANAGER
 BERGRIVIER MUNICIPALITY REPORT BY THE STRATEGIC MANAGER TO: MAYORAL COMMITTEE COUNCIL 2018/19 QUARTERLY BUDGET AND PERFORMANCE REPORT FOR QUARTER 1: 1 JULY 30 SEPTEMBER 2018 SUBMITTED IN TERMS OF SECTION
Provincial Gazette Extraordinary Buitengewone Provinsiale Koerant
 THE PROVINCE OF GAUTENG G A U T E N G PROVINCIAL GOVERNMENT UNITY IN DIVERSITY DIE PROVINSIE GAUTENG Provincial Gazette Extraordinary Buitengewone Provinsiale Koerant Vol 20 PRETORIA, 12 FEBRUARY FEBRUARIE
The groups saw a robust increase in surplus of 80.91% as a result of the increase in revenues coinciding with the ability to contain costs.
 CITY OF JOHANNESBURG METROPOLITAN MUNICIPALITY INSTRUMENT CODE: COJ02, COJ04, COJ05, COJ06, COJ07 ISIN: ZAG000022153, ZAG000030941, ZAG000054339, ZAG000054354, ZAG000085044 GROUP ANNUAL FINANCIAL STATEMENTS
Changes made in mscoa Chart version 5.5 and incorporated into mscoa Chart version 6.0 :
 Changes made in mscoa Chart version 5.5 incorporated into mscoa Chart version 6.0 : 1. General 1.1 The wording of some definitions changed to broaden, clarify or include specific examples to assist in
QUARTERLY PERFORMANCE REPORT FOR QUARTER 3: 1 JANUARY MARCH 2016
 ANNEXURE C QUARTERLY PERFORMANCE REPORT FOR QUARTER 3: 1 JANUARY 2016 31 MARCH 2016 2/9/2 REPORT BY THE MANAGER STRATEGIC SERVICES 1 PURPOSE The purpose of this report is to present the quarterly performance
LEKWA-TEEMANE LOCAL MUNICIPALITY NW 396
 LEKWA-TEEMANE LOCAL MUNICIPALITY NW 396 Mid-Year Budget Performance Assessment Report 2015/ TABLE OF CONTENTS 1. MUNICIPAL MANAGER S FOREWORD... 1 2. INTRODUCTION... 6 3. SECTION A: MID-YEAR BUDGET ASSESSMENT...
Unit Standard : Apply the principles of budgeting within a municipality. Karel van der Molen
 Unit Standard 116345: Apply the principles of budgeting within a municipality Karel van der Molen Group The full programme 1. Strategic Management; Budgeting Implementation & Performance Management 2.
MANGAUNG METROPOLITAN MUNICIPALITY
 MANGAUNG METROPOLITAN MUNICIPALITY CAPITAL INFRASTRUCTURE INVESTMENT POLICY TABLE OF CONTENTS Page Number 1. DEFINITIONS 3 2. INTRODUCTION 4 3. PURPOSE 4 4. GUIDING PRINCIPLES 4 5. NEW CAPITAL INFRASTRUCTURE
NATIONAL ENERGY REGULATOR OF SOUTH AFRICA. Electricity Subcommittee Public Hearing 3 June 2010
 Presentation ti to the NATIONAL ENERGY REGULATOR OF SOUTH AFRICA Electricity Subcommittee Public Hearing 3 June 2010 1 Content of Presentation Motivation and background of Tariff Increases proposed General
Moretele Local Municipality. IDP/Budget Process Plan 2018/ ( IDP: Process Plan)
") Moretele Local Municipality IDP/Budget Process Plan /2019 1 Revision Control Final - August 2017 Strategic Services IDP/PMS Unit Enquiries: 012 716 1321 / 1324 (tel) thabo.makwela@moretele.org.za nyakale.lale@moretele.org.za
Moretele Local Municipality IDP/Budget Process Plan /2019 1 Revision Control Final - August 2017 Strategic Services IDP/PMS Unit Enquiries: 012 716 1321 / 1324 (tel) thabo.makwela@moretele.org.za nyakale.lale@moretele.org.za
Part A of examination paper
 Prof Johan Burger 2017 Managing Institutional Capacity 1 Diploma Programme in Public Accountability Module code 13 206 171; twenty credits Preparation for November examination June examination MEMORANDUM
Government Gazette REPUBLIC OF SOUTH AFRICA. Vol. 478 Cape Town 1 April 2005 No
 Government Gazette REPUBLIC OF SOUTH AFRICA Vol. 478 Cape Town 1 April 2005 No. 27443 THE PRESIDENCY No. 291 1 April 2005 It is hereby notified that the President has assented to the following Act, which
ANNEXURE 28 NATIONAL TREASURY CIRCULAR 89 AND 91 MUNICIPAL BUDGET CIRCULAR FOR THE 2018/19 MTREF
 ANNEXURE 28 NATIONAL TREASURY CIRCULAR 89 AND 91 MUNICIPAL BUDGET CIRCULAR FOR THE 2018/19 MTREF 2018/19 Budget (March 2018) 1 N ATIONAL T REASURY MFMA Circular No. 89 Municipal Finance Management Act
MEDIUM TERM REVENUE AND EXPENDITURE FRAMEWORK FOR THE FINANCIAL YEAR
 Bela-Bela Local Municipality 2017/2018 Draft MTREF MEDIUM TERM REVENUE AND EXPENDITURE FRAMEWORK FOR THE FINANCIAL YEAR 2017/2018 1 Bela-Bela Local Municipality 2017/2018 Annual Budget and MTREF Acronyms
PRESENTATION TO THE PORTFOLIO COMMITTEE ON WATER AND ENVIRONMENTAL AFFAIRS
 PRESENTATION TO THE PORTFOLIO COMMITTEE ON WATER AND ENVIRONMENTAL AFFAIRS 24 MAY 2011 Presenters: Mthobeli Kolisa Executive Director: Municipal Infrastructure Services William Moraka Director: Water Services
ANNEXURE 1. Consultation Paper
 ANNEXURE 1 MUNICIPAL TARIFF GUIDELINE INCREASE, BENCHMARKS AND PROPOSED TIMELINES FOR MUNICIPAL TARIFF APPROVAL PROCESS FOR THE 2017/18 FINANCIAL YEAR Consultation Paper 23 February 2017 TABLE OF CONTENTS
uthungulu District Municipality 2014/2015
 149 uthungulu District 2014/2015 9. Intangible Assets 2015 2014 Accumulated amortisation and accumulated impairment Accumulated amortisation and accumulated impairment Cost Carrying value Cost Carrying
Buffalo City Metropolitan Municipality Presentation to the Select Committee on Finance
 Buffalo City Metropolitan Municipality Presentation to the Select Committee on Finance 11 September 2018 Metros financial position at year-ending June 2017 30 June 2015/16 30 June 2016/17 Municipality
uthungulu District Municipality
 The Municipality Tariff Policy TABLE OF CONTENTS 1. Definitions 2. Preamble 3. General Introduction and Objective 4. Principles 5. Classification and pricing strategies of services 6. Calculation of Tariffs
ANNEXURE 1. Consultation Paper
 ANNEXURE 1 MUNICIPAL TARIFF GUIDELINE INCREASE, BENCHMARKS AND PROPOSED TIMELINES FOR MUNICIPAL TARIFF APPROVAL PROCESS FOR THE 2018/19 FINANCIAL YEAR Consultation Paper Published on 28 February 2018 Table
Toplayer Service Delivery Budget Implementation Plan for 2016/17
 Toplayer Service Delivery Budget Implementation Plan for 206/7 Provincial Strategic Outcome KPI Calculation Type Assist Directorate [R] [R] National KPA [R] IDP Objective [R] KPI Name [R] Unit of Measurement
Summary of Draft Financial Information
 Summary of Draft Financial Information Prospective Statement of Financial Position p.2 Prospective Funding Impact Statement p.3 Prospective Statement of Comprehensive Revenue and Expenses p.4 Prospective
EXPENDITURE /15 STANDING COMMITTEE ON APPROPRIATIONS
 EXPENDITURE - 2014/15 STANDING COMMITTEE ON APPROPRIATIONS Presenter: Dondo Mogajane Deputy Director-General, Public Finance, National Treasury 28 June 2015 Cumulative revenue and expenditure 2014/15 Main
Budget and Reporting Processes and Formats
 Budget and Reporting Processes and Formats Facilitating Improved Decision Making for Service Delivery International Example Pack David Krywanio Contents Government of South Africa, Diagrammatic view of
KING CETSHWAYO DISTRICT MUNICIPALITY
 KING CETSHWAYO DISTRICT MUNICIPALITY The Municipality VIREMENT POLICY TABLE OF CONTENTS 1. Definitions 3 2. Introduction 5 3. Objectives 5 4. Scope of the Policy 6 5. Regulatory Framework 6 6. Delegation
Mayor WT Cloete (resigned 31 August 2012) SW Lubbe (appointed 1 September 2012)
 SW Lubbe (appointed 1 September 2012)") NAMA KHOI LOCAL MUNICIPALITY ANNUAL FINANCIAL STATEMENTS FOR THE YEAR ENDED 30 JUNE 2013 GENERAL INFORMATION NATURE OF BUSINESS AND PRINCIPAL ACTIVITIES Nama Khoi Local Municipality is a local municipality
NAMA KHOI LOCAL MUNICIPALITY ANNUAL FINANCIAL STATEMENTS FOR THE YEAR ENDED 30 JUNE 2013 GENERAL INFORMATION NATURE OF BUSINESS AND PRINCIPAL ACTIVITIES Nama Khoi Local Municipality is a local municipality
Oxford Street East London 5201
 General Information Legal form of Municipality Nature of business and principal activities Grading of local authority City Manager Chief Finance Officer Jurisdiction Business address Municipality Local
FINAL BUDGET 2017/2018 ZULULAND DISTRICT MUNICIPALITY UMKHANDLU WESIFUNDA SASE ZULULAND
 FINAL BUDGET 2017/2018 ZULULAND DISTRICT MUNICIPALITY UMKHANDLU WESIFUNDA SASE ZULULAND TABLE OF CONTENTS SECTION A BUDGET 1 Glossary 2 Mayors Report 3 Resolutions 4 Executive Summary 5 Annual budget tables:
Final Report December 2015
 Final Report December 2015 B Table of Contents Glossary... H Acronyms... M Units of Measurement... N Executive Summary... O PHASE 1 1. Purpose... 1 1.1 Scope and objectives of this report... 1 1.2 Background...
TARIFF POLICY GEORGE MUNICIPALITY. 1 P a g e / D R A F T : 2 6 M A R C H A P P R O V E D : 2 7 M A Y
 TARIFF POLICY GEORGE MUNICIPALITY 1 P a g e 2 0 1 5 / 2 0 1 6 TARIFF POLICY GEORGE MUNICIPALITY INDEX 1. PART 1: PREAMBLE 3 2. PART 2: DEFINITIONS 3 3. PART 3: PURPOSE 8 4. PART 4: ALIGNMENT WITH THE MUNICIPALITY
ACCOUNTING POLICIES 1. PRESENTATION OF ANNUAL FINANCIAL STATEMENTS 1.2 SIGNIFICANT JUDGEMENTS AND SOURCES OF ESTIMATION UNCERTAINTY
 ACCOUNTING POLICIES 1. PRESENTATION OF ANNUAL FINANCIAL STATEMENTS The Annual Financial Statements have been prepared in accordance with the Standards of Generally Recognised Accounting Practice (GRAP),
MEDIUM TERM REVENUE AND EXPENDITURE FRAMEWORK 2018/
 MANGAUNG METROPOLITAN MUNICIPALITY MEDIUM TERM REVENUE AND EXPENDITURE FRAMEWORK 2020-21 i MANGAUNG METROPOLITAN MUNICIPALITY TABLE OF CONTENTS PART 1 - ANNUAL BUDGET 1. Executive Summary 1 2. Summary
CAPRICORN DISTRICT MUNICIPALITY
 2016/17 Notwithstanding the review date as shown, this policy shall remain effective until approved otherwise by Council and may be reviewed on an earlier date as deemed necessary. Date: Printed name:
ACCOUNTING POLICIES OF THE ECONOMIC ENTITY TO ACCOMPANY ITS FINANCIAL STATEMENTS FOR THE YEAR ENDED 30 JUNE 2014
 8 1. BASIS OF PREPARATION and STATEMENT OF COMPLIANCE These Consolidated Financial Statements have been prepared in accordance with Generally Recognised Accounting Practice (GRAP) including any interpretations,
 UACN PROPERTY DEVELOPMENT COMPANY PLC FINANCIAL STATEMENT FOR THE YEAR ENDED 31 DECEMBER 2017 Financial highlights 2017 2016 % 2017 2016 % N'000 N'000 Change N'000 N'000 Change Continuing operations Revenue
Sample Statements. TOTAL RECEIPTS xxx XXX
 Sample Statements Statement of Receipts and Payments (Cash Method) Note 2016-2017 2015-2016 RECEIPTS Tax Receipts 1 xxx xxx Social Security Contributions 2 xxx xxx Proceeds from Domestic and Foreign Grants
PART A: Working Capital Management (US marks)
") Diploma in Public Accountability Managing Institutional Capacity I Examination Time: 3 hours Marks: 100 Surname & names: Student number: Date: 12 June 2017 OPEN BOOK: Answer in spaces provided. You may
Diploma in Public Accountability Managing Institutional Capacity I Examination Time: 3 hours Marks: 100 Surname & names: Student number: Date: 12 June 2017 OPEN BOOK: Answer in spaces provided. You may
1 July Guideline for Municipal Competency Levels: Chief Financial Officers
 1 July 2007 Guideline for Municipal Competency Levels: Chief Financial Officers issued in terms of the Local Government: Municipal Finance Management Act, 2003 Introduction This guideline is one of a series
FFC Public Hearings on the LG Fiscal Framework. Comment by SALGA
 FFC Public Hearings on the LG Fiscal Framework Comment by SALGA Leriba Lodge 4 June 2012 Overview Introduction General Comments Service Delivery Capital Investment Revenue Patterns Expenditure LGFF Proposed
Financial Statements Whole of Council Financial Statements
 Whole of Council Financial Statements Annual Plan Disclosure Statement for the Year Ending 30 June 2017 The purpose of this statement is to disclose the council s planned financial performance in relation
4/7/2015. Group. Governance and Legislation
 Group 3 Governance and Legislation DIPLOMA IN PUBLIC ACCOUNTABILITY MINIMUM MUNICIPAL COMPETENCY PROGRAMME Karel van der Molen Module 2 Intergovernmental Fiscal Relations, Legislation and Policies affecting
National Treasury. Modelling the infrastructure investment needs in South African metros: 2016 to FINAL version
 National Treasury Modelling the infrastructure investment needs in South African metros: 2016 to 2025 FINAL version 6 November 2015 i Contact Details Contact Kim Walsh Postal address PO Box 46830, Glosderry,
MANGAUNG METROPOLITAN MUNICIPALITY SERVICE DELIVERY AND BUDGET IMPLEMENTATION PLAN
 MANGAUNG METROPOLITAN MUNICIPALITY 208 209 DELIVERY IMPLEMENTATION PLAN Foreword by the Executive Mayor Celebrating the year of Nelson Mandela and Albertina Sisulu As we mark the year of Dr Nelson Mandela
2016 Division of Revenue Amendment Bill Select and Standing Committees on Apportions
 2016 Division of Revenue Amendment Bill Select and Standing Committees on Apportions National Treasury 10 November 2016 Overview The 2016 Division of Revenue Act (DoRA) was considered and approved by Legislatures
REPORT ON THE FINANCIAL STATEMENTS
 REPORT OF THE AUDITOR-GENERAL TO THE WESTERN CAPE PROVINCIAL PARLIAMENT AND THE COUNCIL ON THE FINANCIAL STATEMENTS AND PERFORMANCE INFORMATION OF THE SWARTLAND MUNICIPALITY FOR THE YEAR ENDED 30 JUNE
Minimum compliance and Alignment with MFMA Calendar. Presented by National Treasury 16 March 2016
 Minimum compliance and Alignment with MFMA Calendar Presented by National Treasury 16 March 2016 Compliance When: 1 July 2017 Responsible for: Municipal Councils and Boards of Municipal Entities Implementation
RT THE APPOINTMENT OF SERVICE PROVIDERS FOR AN INTEGRATED FINANCIAL MANAGEMENT AND INTERNAL CONTROL SYSTEM FOR LOCAL GOVERNMENT
 RT25 2016 THE APPOINTMENT OF SERVICE PROVIDERS FOR AN INTEGRATED FINANCIAL MANAGEMENT AND INTERNAL CONTROL SYSTEM FOR LOCAL GOVERNMENT PERIOD: 01 JUNE 2016 31 MAY 2019 BID CLOSING DATE: 18 APRIL 2016 VALIDITY
Bela Bela Local Municipality Annual Financial Statements for the year ended 30 June 2016 (LIM 366)
") Annual Financial Statements for the year ended 30 June 2016 (LIM 366) General Information Legal form of entity Local Municipality, governed by the MFMA (No 56 of 2003) Nature of business and principal
Annual Financial Statements for the year ended 30 June 2016 (LIM 366) General Information Legal form of entity Local Municipality, governed by the MFMA (No 56 of 2003) Nature of business and principal