TO: Mayor & Council Budget Advisory Committee FROM: Lyman Howard Dean Rohla DATE: February 12, 2019 SUBJ: ACTUAL 2018 YEAR END FINANCIAL INFORMATION
|
|
|
- Amie Rice
- 5 years ago
- Views:
Transcription

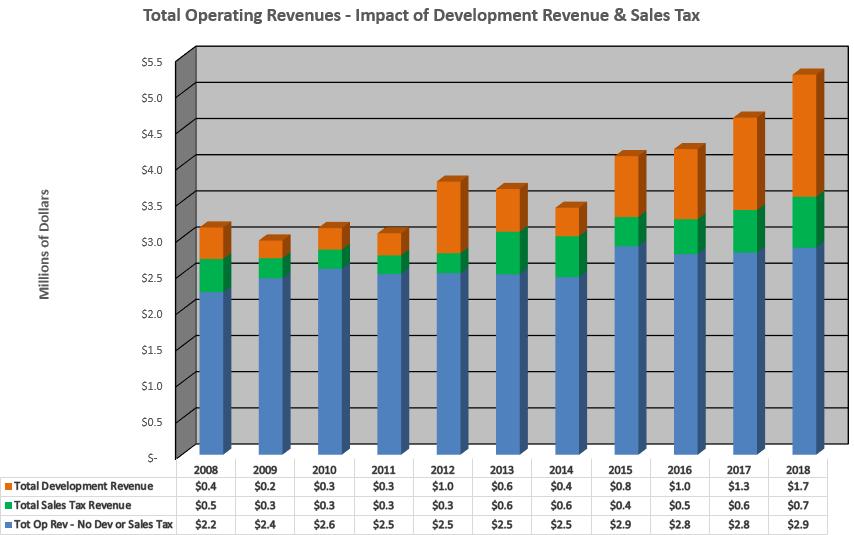
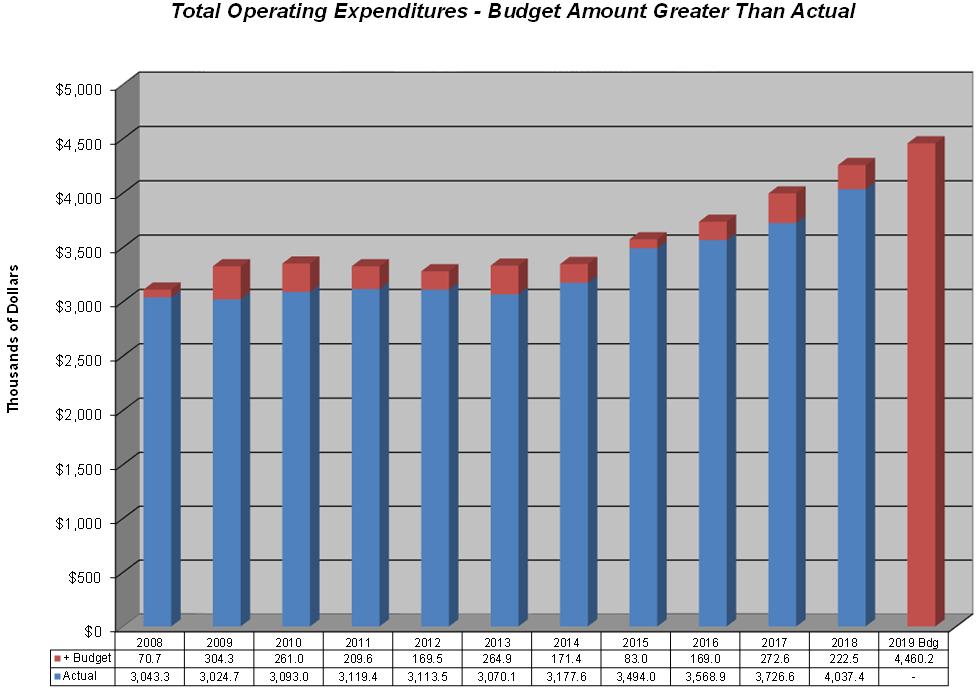
1 9605 NE 24 th Street Clyde Hill, Washington Fax: TO: Mayor & Council Budget Advisory Committee FROM: Lyman Howard Dean Rohla DATE: February 12, 2019 SUBJ: ACTUAL 2018 YEAR END FINANCIAL INFORMATION 2018 YEAR-END INFORMATION: Attached is the following information to help understand what actually happened in 2018: (#1) A spreadsheet that outlines just how close our predictions throughout the year(s) came to the actual numbers they were extremely accurate! (#2) A Year End report showing major differences from the 2018 budget to the actual numbers. Also includes an Overall Financial Plan Update. (#3) Final financial statements, a detailed report with a big picture, specifying the activity in all funds and accounts throughout the year and comparing the year end results with the 2018 and the 2019 Budgets. As predicted, total revenues ended 12.1% higher than the 2018 Budget by $921,767 and total expenditures 17.3% lower than budgeted by $1,320,676. The lower expenditure and higher revenue numbers helped create an increase of the city s ending fund balance of $2,242,463 for the year. On the revenue side, the major themes remained the same with residential development ($409,069) and Sales Tax ($115,448) explaining 94% of the 2018 operating budget variance. and Real Estate Excise Taxes ($441,478) accounting for 48% of the total budget variance all other revenues were within an expected final range and relatively flat. General Fund expenditure variances were minimal and very close to projections. General Fund expenditures showed a positive variance of $222,467 or 5.2% Thanks again to the Mayor, Council and Budget Advisory Committee for their help and support in making 2018 a financially successful year for the City of Clyde Hill.
2
3 Revenues: General Fund 2018 Year-End Actual 2018 Budget: $4,696, Actual: $5,255,811 Revenue Difference: $559,686 More Revenue Than Budgeted % of Budget: 11.9% Revenue Detail Building/Structure Permits ($150.9); Plan Checking Fees ($174.9); Other Permits ($83.3) Development Revenue $409,069 CHES budgeted at $40M. Proj came in at $48M; home values increased Retail Base ($31.7); Res Constr ($114.7); CHES constr ( -$31.0) Sales Tax 115, % of total ST is Construction Related ($458.4); Base ($247.1) Fed increased rates more than anticipated Interest Income 45,929 One time sales of vehicles/property Surplus property 39,727 Primarily Marijuana excise tax State Shared & Interlocal 4,400 Radar speed signs slowing down traffic Fines & Forfeitures (29,921) All trending down except for water/sewer. Cellular & Cable hit the hardest Utility Tax & Franchise Fees (19,826) Timing of receipts & disbursements by King Co Property Tax (5,404) All Other Revenues $264 Note: #'s in () are in thousands $559,686 Development is 86.5% ($484,110) of the Unbudgeted Revenue Expenditures: $75,576 Without Development 2017 Budget: $4,259, Actual: $4,037,383 Expenditure Difference: -$222,467 Less Expenditures Than Budgeted % of Total: 5.2% Expenditure Detail Unspent City Admin payout ($94.3) less unbudgeted CA search fees (-$26.3) General Govt. Services -$71,641 7th officer hired Nov 1 (-$83.9) - Court Fees (-$32.4) - Jail (-$21.8) Police Department -$127,739 No LEOFF payment required Fire Department -$19,999 PW/Building Department -$3,088 Note: #'s in () are in thousands -$222,467 Beginning Fund Balance: $1,117, Budgeted Surplus/Deficit: $436, Y-E Surplus/Deficit: $1,218, Transfer: ($1,017,916) 2018 Ending Fund Balance: $1,318,428 Presentation Overview /12/2019-4:52 PM
4 Overall Financial Plan Update 2019 General Fund Plan Actual 2019 Beginning Fund Balance: $1,318,427 Mostly from higher 2018 development 2019 Special Project Transfers ($1,214,800) For Special Projects in the 2019 Budget Retain per financial policy ($100,000) Per Financial Policy - Maintain $100K balance in General Fund - Included in YE Balan Transfer to Reserve Fund (on ) ($3,627) Transfer to Reserve Fund per 2019 Budget Ordinance General Fund 2019 Budgeted Surplus $552,175 Per 2019 Budget. Delays in BCS construction will eliminate this surplus Projected General Fund Y-E Balance: $652,175 Retain $100,000 per Financial Policy 2019 Reserve Fund Plan Actual 2019 Beginning Fund Balance: $3,910,392 Targeted for LT Financial Flexibility per Financial Policy #5 Transfer from General Fund (on ) $3,627 Per 2019 Budget Ordinance, unappropriated > $100K transfer to Reserve Fund Transfer to Projects Fund (on ) ($691,950) Per 2019 Budget. For Facilities Plan Use Projected Reserve Fund Y-E Balance: $3,222,069 For City Facilities Plan General Fund 2018 YE Budgeted Surplus $1,214,800 Per 2019 Budget. Transfer into Special Projects Department for Facilities Plan Use In Reserve Fund $691,950 Per 2019 Budget. Transfer into Special Projects Department for Facilities Plan Use Special Projects Dept Balance $193,250 Carryover in Special Project Department Projected for Facilities Plan: $2,100,000 Per 2019 Budget
5 Differences In 2018 Year-End Projections August November December Actual Projections Projections Projections 2018 GENERAL FUND Revenue $5,101,825 $5,217,200 $5,265,250 $5,255,811 Expenditures $3,984,350 $4,027,400 $4,050,450 $4,037,383 $1,117,475 $1,189,800 $1,214,800 $1,218,428 Differences In 2017 Year-End Projections August November December Actual Projections Projections Projections 2017 GENERAL FUND Revenue $4,437,300 $4,614,750 $4,602,700 $4,660,758 Expenditures $3,749,875 $3,711,100 $3,715,000 $3,726,565 $687,425 $903,650 $887,700 $934,193 Differences In 2016 Year-End Projections August November December Actual Projections Projections Projections 2016 GENERAL FUND Revenue $4,153,450 $4,171,075 $4,246,950 $4,224,875 Expenditures $3,646,350 $3,599,325 $3,574,150 $3,568,927 $507,100 $571,750 $672,800 $655,948 Differences In 2015 Year-End Projections August November December Actual Projections Projections Projections 2015 GENERAL FUND Revenue $4,021,000 $4,107,200 $4,152,875 $4,128,758 Expenditures $3,503,525 $3,523,625 $3,525,121 $3,494,046 $517,475 $583,575 $627,754 $634,712 Differences In 2014 Year-End Projections August November December Actual Projections Projections Projections 2014 GENERAL FUND Revenue $3,465,000 $3,465,650 $3,484,725 $3,414,485 Expenditures $3,213,075 $3,190,700 $3,159,325 $3,177,625 $251,925 $274,950 $325,400 $236, Year-End Projections August November December Actual Projections Projections Projections 2013 GENERAL FUND Revenue $3,663,050 $3,690,900 $3,678,000 $3,674,425 Expenditures $3,159,875 $3,118,200 $3,085,200 $3,070,065 $503,175 $572,700 $592,800 $604, Year-End Projections August November December Actual Projections Projections Projections 2012 GENERAL FUND Revenue $3,736,025 $3,731,650 $3,738,175 $3,776,143 Expenditures $3,073,650 $3,087,275 $3,106,525 $3,113,476 $662,375 $644,375 $631,650 $662,667 Projection Differences /12/2019-5:41 PM
6 Financial Overview - "The Big Picture" BUDGET General Reserve Projects TOTAL 2018 Fund Fund Fund CITY REVENUE 4,696, ,893,550 7,589,675 EXPENDITURES 4,259, ,681,200 8,941,050 Surplus or (Deficit): 436,275 0 (1,787,650) (1,351,375) Beg. Fund Balance 1,117,916 3,186,476 4,221,173 8,525,564 Total Transfer In 0 723, ,000 1,017,916 Total Transfer Out 1,017, ,017,916 Ending Fund Balance 536,275 3,910,392 2,727,523 7,174, ACTUAL YEAR END General Reserve Projects TOTAL 2018 Fund Fund Fund CITY REVENUE 5,255, ,255,631 8,511,442 EXPENDITURES 4,037, ,582,971 7,620,354 Surplus or (Deficit): 1,218,428 0 (327,340) 891,088 Beg. Fund Balance 1,117,916 3,186,476 4,221,173 8,525,564 Total Transfer In 0 723, ,000 1,017,916 Total Transfer Out 1,017, ,017,916 Ending Fund Balance 1,318,427 3,910,392 4,187,833 9,416, Final BUDGET General Reserve Projects TOTAL 2019 Fund Fund Fund CITY REVENUE 5,012, ,362,250 6,374,650 EXPENDITURES 4,460, ,157,200 8,617,425 Surplus or (Deficit): 552,175 0 (2,794,950) (2,242,775) Beg. Fund Balance 1,318,427 3,910,393 4,187,833 9,416,653 Total Transfer In 0 3,627 1,906,750 1,910,377 Total Transfer Out 1,218, , ,910,377 Ending Fund Balance 652,175 3,222,070 3,299,633 7,173,878
: 552,175 0 (2,794,950) (2,242,775) Beginning Fund Balance 1,318,427 3,910,393 4,187,833 9,416,653 Total Transfer In 0 3,627 1,906,750 1,910,377")

7 2019 FINAL Budget at a Glance City of Clyde Hill, Washington Final BUDGET General Reserve Projects TOTAL 2019 Fund Fund Fund CITY REVENUE 5,012, ,362,250 6,374,650 EXPENDITURES 4,460, ,157,200 8,617,425 Surplus or (Deficit): 552,175 0 (2,794,950) (2,242,775) Beginning Fund Balance 1,318,427 3,910,393 4,187,833 9,416,653 Total Transfer In 0 3,627 1,906,750 1,910,377 Total Transfer Out 1,218, , ,910,377 Ending Fund Balance 652,175 3,222,070 3,299,633 7,173, General Fund Revenue Final Budget Fed & State Shared Rev, 45,400, 1% Property Taxes, 1,014,000, 20% Wireless Comm Fac Leases, 231,300, 5% Sales Tax, 850,000, 17% MVFT, 71,200, 2% Invest Income, 165,500, 3% Misc. Op Rev, 18,500, 0% Interlocal Services Provided, 435,900, 9% Develop Revenues, 1,310,000, 26% Fines and Penalties, 57,500, 1% Utility Tax & Franch Fees, 813,100, 16% 2019 General Fund Expenditures Final Budget Public Works, 924,475, 21% Support Services, 1,173,100, 26% Fire & Medic One Services, 706,650, 16% Police Services, 1,656,000, 37%
8 Fund #001 GENERAL FUND BEGINNING GENERAL FUND BALANCE TAXES REVENUES Real and Personal Property Taxes Ad Valorem Taxes Total General Property Taxes $ 336,860 $ 869,715 $ 899,719 $ 1,117,916 $ 1,117,916 $ 1,318, % $ 200,512 $ 1,013,666 $ 999,740 $ 1,017,694 $ 1,013,000 $ 1,008,678 $ 1,014, % $ 1,000 (795) (1,099) (202) 0 (1,082) 0 n/a 0 1,012, ,641 1,017,492 1,013,000 1,007,596 1,014, % 1,000 Local Retail Sales & Use Taxes 406, , , , , , % 260,000 Electric - Puget Sound Energy Gas - Puget Sound Energy Garbage/Solid Waste - Eastside Disposal Cable TV - Comcast Telephone - Local Access Telephone - Cellular Total Business Taxes Leasehold Excise Tax TOTAL TAXES LICENSES AND PERMITS Business Licenses Franchise Fees - Solid Waste Franchise Fees - Cable TV Franchise Fees - Water Franchise Fees - Sewer Total Business Licenses and Permits Building and Structures Permits Other Non-Business Permits Total Non-Business Licenses and Permits TOTAL LICENSES AND PERMITS 131, , , , , , % 2,000 87,111 80,918 93,478 93,000 87,301 91,000 (2.2%) (2,000) 22,056 23,373 25,292 25,500 24,786 25, % 0 124, , , , , ,600 (4.3%) (5,400) 22,644 24,490 18,964 19,000 21,379 19, % 0 58,726 46,463 45,370 50,000 37,889 40,000 (20.0%) (10,000) 446, , , , , ,100 (3.4%) (15,400) % 0 1,866,016 1,921,856 2,056,324 2,060,900 2,137,852 2,306, % 245,600 22,590 21,337 22,883 23,000 22,165 23, % 0 30,326 32,138 34,776 36,000 34,081 36, % 0 69,328 68,652 68,388 69,000 63,227 67,000 (2.9%) (2,000) 150, , , , , , % 0 89,015 91,499 95,281 95,000 96,899 95, % 0 361, , , , , ,000 (0.5%) (2,000) 439, , , , , , % 0 96, , , , , , % 5, , , , ,000 1,105, , % 5,000 $ 897,203 $ 973,227 $ 1,272,230 $ 1,243,000 $ 1,491,912 $ 1,246, % $ 3,000 Page 1 of 15
9 INTERGOVERNMENTAL WA Traffic Safety Commission Marijuana Excise Tax State & Federal Grants Motor Vehicle Fuel Tax - City Streets Multimodal Transpo City (New in 2016) Liquor Excise Tax Liquor Control Board Profits Yarrow Point Police Contract Services to other Communities TOTAL INTERGOVERNMENTAL CHARGES FOR GOODS AND SERVICES Zoning & Subdivision Fees Plan Checking Fees TOTAL CHARGES FOR GOODS AND SERVICES FINES AND FORFEITS Fines & Forfeitures Miscellaneous Fines & Penalties TOTAL FINES AND FORFEITS MISCELLANEOUS REVENUES Investment Interest Interest on Sales Taxes Total Interest and Earnings Space and Facilities Leases Total Rents, Leases, Concessions Sale of Surplus Property Other Miscellaneous Revenues Total Other TOTAL MISC REVENUES TOTAL GENERAL FUND REVENUES TOTAL REVENUE & TRANSFERS 2, n/a ,100 4,666 5, % 3,900 2, , n/a 0 63,111 65,194 66,271 67,000 66,009 67, % 0 0 3,090 3,217 3,000 4,243 4, % 1,200 8,154 14,090 14,750 15,000 15,242 15, % 0 26,243 26,015 25,835 25,000 24,982 25, % 0 380, , , , , , % 14, , n/a 0 483, , , , , , % 20,000 15,804 16,975 12,550 10,000 8,500 10, % 0 290, , , , , , % 25, , , , , , , % 25,000 90,437 57,288 51,291 55,000 32,306 50,000 (9.1%) (5,000) 147,834 83,327 46,755 7, , % 0 238, ,615 98,046 62,500 32,579 57,500 (8.0%) (5,000) 12,772 35,403 80, , , , % 40, , % 0 12,971 35,737 80, , , , % 40, , , , , , , % 9, , , , , , , % 9,175 3,629 21,284 3,593 25,000 48,616 3,500 (86.0%) (21,500) 47,805 25,193 21,031 15,000 31,111 15, % 0 51,434 46,477 24,624 40,000 79,727 18,500 (53.8%) (21,500) 337, , , , , , % 27,675 $ 4,128,758 $ 4,224,875 $ 4,660,758 $ 4,696,125 $ 5,255,811 $ 5,012, % $ 316,275 $ 4,128,758 $ 4,224,875 $ 4,660,758 $ 4,696,125 $ 5,255,811 $ 5,012, % $ 316,275 Page 2 of 15
10 GENERAL FUND EXPENDITURES General Government Services Legislative Misc - Special Meetings Misc - Public Notices Salaries Personnel Benefits Election Services Total Legislative Executive Salaries Personnel Benefits Misc. - Meetings Total Executive Finance and Record Services Salaries Personnel Benefits Office and Operating Supplies Minor Equipment Communication Travel Insurance Utility Services Repairs and Maintenance Misc-Dues and Subscriptions Misc. - Printing Misc-Training and Tuition Professional Services - Audit Operating Supplies - City Hall Information Technology - Repairs & Maintenance Personnel Services - Executive Recruitment Total Finance and Record Services Professional Service - Legal $ 90 $ - $ - $ 500 $ 125 $ % $ ,647 1,189 1, , % 0 3,400 3,850 3,850 5,000 3,750 5, % % 0 5,415 1,571 7,445 8,000 8,208 8, % 500 9,986 7,363 12,779 15,000 13,131 15, % 500 6,000 6,600 6,200 8,000 7,100 8, % 0 18,442 20,183 20,737 21,000 21,217 21, % , ,000 1,578 1, % 0 25,384 28,069 27,889 30,000 29,896 30, % , , , , , , % 45, , , , , , , % 22,500 9,262 11,520 10,154 10,000 12,298 10, % , , % 0 12,902 11,903 12,049 13,500 12,057 13, % 0 6,128 6,062 6,193 6,500 6,094 6, % 0 56,445 58,570 67,427 82,000 78,177 92, % 10,000 13,456 15,232 16,769 14,500 14,523 14, % 0 25,188 10,347 13,297 13,500 18,097 13, % 0 3,787 3,119 5,436 3,500 1,596 3, % 0 5,063 7,291 5,916 7,000 9,168 7, % 0 2,327 4, ,500 2,136 7, % 3,000 12,105 10,884 15,843 14,500 13,188 14, % 0 1,461 1,793 2,112 2,000 2,523 2, % ,890 52,823 50,063 62,000 65,400 66, % 4, ,275 5,000 n/a 5, , , , , , , % 90, , ,232 67, , , , % 0 Page 3 of 15
11 Other General Government Services AWC - Association of Washington Cities PSRC - Puget Sound Regional Council Animal Control Services SCA - Sound Cities Association ARCH - A Regional Coalition For Housing Total Other General Government Serv TOTAL GENERAL GOV'T SERV 1,497 1,524 1,554 1,650 1,567 1, % % , , % 0 1,884 2,324 2,160 2,500 2,373 3, % 500 3,760 3,873 3,951 4,100 4,050 4, % 100 7,720 8,324 8,307 9,900 8,750 10, % , , ,000 1,081,400 1,008,867 1,173, % 91,700 SECURITY OF PERSONS & PROPERTY Law Enforcement (Police Department) Salaries Salaries-Overtime Personnel Benefits Uniforms Office and Operating Supplies Fuel Consumption Prof Serv - Legal Prof Serv - Indigent Communications Repairs and Maintenance Misc. - Dues and Subscriptions Misc. - Filing, Recording, Witness Misc. - Printing Misc. - Police Grant Intergvt - Dispatch Intergvt - Detention Charges Prof Services - Alcoholism Total Law Enforcement Fire Control Services Intergvt - Fire Suppression $ 775,148 $ 684,248 $ 760,525 $ 887,000 $ 852,374 $ 872,000 (1.7%) ($15,000) 28,812 81,135 34,675 50,000 34,433 50, % 0 376, , , , , , % 6,500 8,078 14,973 8,554 9,000 14,505 9, % 0 5,037 5,660 8,330 10,500 16,373 10, % 0 14,509 11,360 15,644 22,000 19,743 22, % 0 48,000 48,000 48,000 49,000 48,000 49, % 0 7,050 8,150 7,750 7,500 8,250 8, % 500 5,031 5,425 5,494 5,500 5,356 5, % 0 11,807 13,066 9,540 20,000 21,599 15,000 (25.0%) (5,000) , % 0 55,185 26,940 26,850 50,000 18,647 35,000 (30.0%) (15,000) % , (100.0%) (1,000) 64,138 74,324 88, , , , % 1,775 19,998 13,073 13,450 25,000 3,220 25, % % 0 1,421,504 1,352,693 1,429,201 1,683,225 1,555,486 1,656,000 (1.6%) (27,225) 591, , , , , , % 53,675 TOTAL SECURITY - PERSONS/PROP $ 2,013,283 $ 1,970,283 $ 2,052,684 $ 2,336,200 $ 2,188,462 $ 2,362, % $ 26,450 Page 4 of 15
12 PHYSICAL ENVIRONMENT (PW) ENGINEERING (PUB WORKS ADMIN) Salaries Personnel Benefits Small Tools and Minor Equipment Prof Serv - Contractual Bldg Dept Misc. - Dues and Subscriptions Misc. - Training and Tuition Oper Rentals/Leases - Antenna Bldg Total Engineering (P. W. Admin) OTHER PHYSICAL ENVIRONMENT Intergvt - Puget Sound Clean Air Intergvt - Eastside Transportation Project Total Other Physical Environment Total Physical Environment TRANSPORTATION Road and Street Maintenance Other Improvement - Roadway Other Improvement - Storm Drain Other Improvement - Sidewalks Utility Services - Street Lights Utility Services - Signal Lights Other Improvements - Traffic Control Oper Supply - Snow and Ice Control Prof Serv - Street Cleaning Other Improvements - Landscaping Total Road and Street Maintenance 120, , , , , , % 3,500 54,981 61,200 50,909 55,000 53,074 55, % ,000 1,402 2, % 1, ,000 33,026 50, % 47, ,000 1,331 2, % 1,000 5, ,842 3,000 4,554 6, % 3,500 8,347 8,448 8,604 9,000 8,836 9, % , , , , , , % 56,700 5,326 6,423 6,406 6,700 6,569 6, % % 0 5,326 6,463 6,446 6,750 6,609 6, % , , , , , , % 56,725 2,834 4,109 1,511 6,000 5,334 6, % 0 18,445 11,983 26,144 5,000 6,044 5, % , , % 0 27,018 30,140 7,866 21,000 24,192 21, % 500 1,862 2,455 2,088 3,000 3,767 3, % 0 1,760 4,019 6,143 3,000 3,174 3, % ,155 2,500 3,144 3, % 1, ,258 14, , % 11,000 18,199 21,648 25,762 12,000 15,079 12, % 0 70,527 75,147 79,927 67,500 60,734 80, % 12,500 Page 5 of 15
13 Road and Street - PW Crew & Overhead Salaries Personnel Benefits Personnel Benefits - Uniforms Prof Serv - Engineering Office and Operating Supplies Fuel Consumed - PW Crew Small Tools and Minor Equipment Operating Rentals and Leases Utility Services - Public Works Building Repairs and Maintenance Total Road/Street - PW Crew & OH TOTAL TRANSPORTATION Professional Service - Urban Forestry Program Other Improvements - General Parks TOTAL PUBLIC WORKS 212, , , , , , % 4,000 99, , , , , ,000 (1.9%) (3,000) 1,377 1,879 4,388 4,000 3,544 4, % ,000 40,846 35, % 0 1,826 4,834 3,734 4,000 4,566 4, % 0 4,859 5,024 7,235 8,000 6,607 8, % 0 2,982 2,364 13,967 5,000 6,516 6, % 1, % 0 1,813 2,150 2,825 3,500 4,199 4, % 500 3,262 9,236 17,144 6,000 6,359 6, % 0 327, , , , , , % 3,000 $ 398,333 $ 450,594 $ 553,902 $ 605,500 $ 565,549 $ 621, % $ 15,500 4,882 6,890 8,219 15,000 21,408 25, % 10,000 9,230 9,237 21,137 24,000 29,361 24, % 0 $ 607,210 $ 688,810 $ 763,881 $ 842,250 $ 840,055 $ 924, % $ 82,225 TOTAL GENERAL FUND EXPEND $ 3,494,046 $ 3,568,927 $ 3,726,565 $ 4,259,850 $ 4,037,383 $ 4,460, % $ 200,375 Operating Surplus/(Deficit) $ 634,712 $ 655,948 $ 934,193 $ 436,275 $ 1,218,428 $ 552, % $ 115,900 Page 6 of 15
14 INTERFUND TRANSFERS Total Transfer to Reserve Fund Transfer to Housing Rental Dept Transfer to Grants Dept Transfer Out - Parks Department Transfer Out - Special Projects Dept Admin. Equipment Replacement PW Equipment Replacement Total Transfer to Projects Fund TOTAL INTERFUND TRANSFERS 35, , ,916 3,627 (99.5%) (720,289) 0 10,000 15,000 17,000 17,000 20, % 3, n/a 0 16,500 17,000 45,000 20,000 20,000 0 (100.0%) (20,000) 25, , , , ,000 1,169, % 947,800 10,000 10,000 10,000 10,000 10,000 10, % 0 15,000 50,000 15,000 25,000 25,000 15,000 (40.0%) (10,000) 66, , , , ,000 1,214, % 920, , , ,000 1,017,916 1,017,916 1,218, % 200,511 TOTAL EXPEND & TRANSFERS Total Fund Surplus/ (Deficit) ENDING GENERAL FUND BALANCE 3,595,931 4,194,877 4,442,565 5,277,766 5,055,299 5,678, % 400, ,827 29, ,193 (581,641) 200,512 (666,252) 14.5% (84,611) $ 869,687 $ 899,713 $ 1,117,912 $ 536,275 $ 1,318,427 $ 652, % $ 115,901 Page 7 of 15
15 Fund #002 Reserve Fund BEGINNING RESERVE FUND BALANCE $ 3,150,214 $ 3,186,476 $ 3,186,476 $ 3,186,476 $ 3,186,476 $ 3,910, % $ 723,917 REVENUES Operating Revenues & Transfers-In Transfer In - General Fund 92nd Ave LID Principal Payments TOTAL REVENUES AND TRANSFERS 35, , ,916 3,627 (99.5%) (720,289) n/a 0 36, , ,916 3,627 (99.5%) (720,289) EXPENDITURES Total Expenditures INTERFUND TRANSFERS Transfer Out - Projects Fund-Special Projects Dept. Total Transfer to Projects Fund Total Transfer to General Fund TOTAL INTERFUND TRANSFERS Total Expenditures and Transfers Fund Surplus/(Deficit) n/a ,950 n/a 691, ,950 n/a 691, n/a ,950 n/a 691, ,950 n/a 691,950 36, , ,916 (688,323) (195.1%) (1,412,239) ENDING RESERVE FUND BALANCE $ 3,186,476 $ 3,186,476 $ 3,186,476 $ 3,910,392 $ 3,910,392 $ 3,222,070 (17.6%) ($688,322) Page 8 of 15
16 Fund #100 Projects Fund BEGINNING PROJECTS FUND BALANCE Auditing Adjustments $ 3,105,678 $ 3,825,971 $ 4,418,703 $ 4,221,173 $ 4,221,173 $ 4,187,833 (0.8%) ($33,340) PROJECTS FUND SUMMARY* TOTAL FUND REVENUES TOTAL FUND EXPENDITURES TOTAL TRANSFERS IN TOTAL TRANSFERS OUT Fund Surplus/(Deficit) TOTAL ENDING PROJECTS FUND BALANCE 1,258,537 1,218,702 1,423,374 2,893,550 3,255,631 1,362,250 (52.9%) (1,531,300) 604,744 1,251,920 2,336,905 4,681,200 3,582,971 4,157,200 (11.2%) (524,000) 66, , , , ,000 1,906, % 1,612, n/a 0 720, ,732 (197,531) (1,493,650) (33,340) (888,200) (40.5%) 605,450 3,825,971 4,418,703 4,221,172 2,727,523 4,187,833 3,299, % 572,110 Trust and Agency Liability Accounts 300, , , , , , % 0 Total Ending Balance with Liability Accts $ 4,125,971 $ 4,718,703 $ 4,521,172 $ 3,027,528 $ 4,487,833 $ 3,599, % $ 572,110 Page 9 of 15
17 Criminal Justice Beginning Criminal Justice Department Balance Revenues Criminal Justice Sales Tax Criminal Justice - Population Criminal Justice - Special Programs DUI/Other Crim Justice Assistance Yarrow Point Criminal Justice Total Revenues $ 396,285 $ 393,351 $ 421,288 $ 432,910 $ 432,910 $ 452, % $ 19,878 76,562 82,862 84,839 86,000 90,742 86, % 0 1,000 1,000 1,000 1,000 1,000 1, % 0 2,932 3,033 3,140 3,100 3,160 3, % (9.1%) (50) 9,362 18,819 15,381 15,500 22,565 16, % , , , , , , % 550 Total Revenues and Transfers Expenditures Intergvt - Child Abuse Intergvt - Domestic Violence Police Equipment Police Vehicle Replacements Safety Programs Officer Training and Travel Civil Service Commission Law Enforcement Grant Programs Lexipol Computer Maintenance EPSCA Fees MDC Operations/Services Investigative Tech Fees Total Expenditures Total Expenditure and Transfer Total Department Surplus/(Deficit) Ending Criminal Justice Department Balance 90, , , , , , % 550 1,276 1,200 1,200 1, , % 0 1,656 1,833 1,940 2, , % 0 24,187 1,012 12,344 25,000 25,733 35, % 10,000 41,575 45,820 46,769 45,000 37,241 20,000 (55.6%) (25,000) 1, ,500 1,571 3, % 2,000 2,148 5,893 6,477 10,000 7,569 25, % 15, ,425 1,378 7,000 10,957 7, % , , % ,500 n/a 6,500 6,687 4,235 11,100 8,500 1,261 8, % 0 6,058 5,353 4,285 4,500 5,396 4, % 0 3,936 1,921 3,068 6,000 3,488 6, % 0 3,784 3,564 3,828 5,500 4,745 8, % 2,500 93,244 78,248 93, ,200 98, , % 11,000 93,244 78,248 93, ,200 98, , % 11,000 (2,934) 27,937 11,622 (15,050) 19,878 (25,500) 69.4% (10,450) $ 393,351 $ 421,288 $ 432,910 $ 417,860 $ 452,788 $ 427, % $ 9,428 Page 10 of 15
18 Grants Beginning Grants Department Balance Revenues NPDES Grant - Revenues WSDOT SR Revenues Street Lights - Revenues Growth Mgmt Grant Total Revenues Total Revenues and Transfers Expenditures NPDES - Expenditures WSDOT SR Expenditures Street Lights - Expenditures Growth Mgmt Grant - Expenditures Total Expenditures Total Expenditure and Transfer Dept. Surplus/(Deficit) Ending Grants Department Balance $29,170 $11,384 ($21,618) ($27,867) ($27,867) ($19,869) (28.7%) $7,998 17, ,000 50,000 30,467 0 (100.0%) (50,000) 3, ,393 0 n/a , n/a 0 1, n/a 0 22, ,576 50,000 37,860 0 (100.0%) (50,000) 22, ,576 50,000 37,860 0 (100.0%) (50,000) 32,487 33,002 24,049 50,000 29,862 0 (100.0%) (50,000) 4, n/a , n/a 0 3, n/a 0 40,335 33, ,825 50,000 29,862 0 (100.0%) (50,000) 40,335 33, ,825 50,000 29,862 0 (100.0%) (50,000) (17,786) (33,002) (6,249) 0 7,998 0 n/a 0 $11,384 ($21,618) ($27,867) ($27,867) ($19,869) ($19,869) (28.7%) $7,998 Page 11 of 15
19 Equipment Replacement Beginning Equipment Replace Department Balance Revenues Transfer In - General Fund - Administration Transfer In - General Fund - Public Works Total Transfers Expenditures Admin Equipment Replacement Equipment - Public Works Total Expenditures $ 127,253 $ 92,869 $ 152,869 $ 177,869 $ 177,869 $ 92,657 (47.9%) ($85,212) 10,000 10,000 10,000 10,000 10,000 10, % 0 15,000 50,000 15,000 25,000 25,000 15,000 (40.0%) (10,000) 25,000 60,000 25,000 35,000 35,000 25,000 (28.6%) (10,000) ,000 7,425 0 (100.0%) (12,000) 59, , ,787 0 (100.0%) (100,000) 59, , ,212 0 (100.0%) (112,000) Dept. Surplus/(Deficit) (34,384) 60,000 25,000 (77,000) (85,212) 25,000 (132.5%) 102,000 Ending Equipment Replace Department Balance Housing Dept. Beginning Housing Department Balance Revenues Housing Rentals and Leases Total Revenues Transfer In - General Fund Total Transfers Total Revenues and Transfers Expenditures Other Improvements - Rental Property ARCH Trust Fund Total Expenditures $ 92,869 $ 152,869 $ 177,869 $ 100,869 $ 92,657 $ 117, % $ 16,788 $13,040 $5,105 $9,410 $2,120 $2,120 ($1,339) (163.1%) ($3,459) 8,732 9,998 9,775 10,000 8,233 10, % 0 8,732 9,998 9,775 10,000 8,233 10, % ,000 15,000 17,000 17,000 20, % 3, ,000 15,000 17,000 17,000 20, % 3,000 8,732 19,998 24,775 27,000 25,233 30, % 3,000 1, ,065 4,000 3,692 4, % 0 15,000 15,000 25,000 25,000 25,000 25, % 0 16,667 15,693 32,065 29,000 28,692 29, % 0 Total Expenditure and Transfer Dept. Surplus/(Deficit) Ending Housing Department Balance 16,667 15,693 32,065 29,000 28,692 29, % 0 (7,935) 4,305 (7,290) (2,000) (3,459) 1,000 (150.0%) 3,000 $5,105 $9,410 $2,120 $120 ($1,339) ($339) (381.6%) ($459) Page 12 of 15
20 Parks & Recreation Beginning Parks & Recreation Department Balance $ 501 $ 213 $ (930) $ 25,162 $ 25,162 $ 29, % $ 4,508 Revenues Celebration Event Total Revenues , , % , , % 0 Transfer In - General Fund Total Transfers Total Revenues and Transfers Expenditures Tennis Court Maintenance Celebration Event Total Expenditures Total Expenditures and Transfers Total Department Surplus/(Deficit) 16,500 17,000 45,000 20,000 20,000 0 (100.0%) (20,000) 16,500 17,000 45,000 20,000 20,000 0 (100.0%) (20,000) 17,323 17,792 45,869 21,000 20,729 1,000 (95.2%) (20,000) , (100.0%) (25,000) 17,611 18,935 19,777 21,000 16,221 21, % 0 17,611 18,935 19,777 46,000 16,221 21,000 (54.3%) (25,000) 17,611 18,935 19,777 46,000 16,221 21,000 (54.3%) (25,000) (288) (1,143) 26,092 (25,000) 4,508 (20,000) (20.0%) 5,000 Ending Parks & Recreation Department Balance $213 ($930) $25,162 $162 $29,670 $9, % $9,508 Page 13 of 15
21 Special Projects Beginning Special Projects Department Balance Revenues King Conservation District - Arbor Day Other Misc - School District Total Revenues Transfers Transfer In - General Fund Transfer In - Reserve Fund Total Transfers Total Revenues and Transfers Expenditures Professional Services - Regional Advisory Facilities Strategic Plan Records Management - Storage Project Safety Comm - Emergency Preparedness - Wellness Engineering Studies & Surveys Traffic/Speed Management Improvements Lid Maintenance Assistance LEOFF 1 Liability Wetherill Nature Preserve Other Improvements - Arbor Day/Urban Forestry WRIA 8/NPDES Permits IT Development- Website Management City Hall Repair Right-Of-Way Enhancements Cable TV Communications Professional Services - Mapping/GIS Total Expenditures $ 69,101 $ 72,686 $ 224,644 $ 499,317 $ 499,317 $ 613, % $ 114,170 2, ,404 2,000 1,591 2, % , , ,404 2,000 11,016 2, % 0 25, , , , ,000 1,169, % 947, , ,950 25, , , , ,000 1,861, % 1,639,750 27, , , , ,016 1,863, % 1,639, ,668 25, , % ,025 6,419 50,000 48,750 2,100, % 2,050, ,503 39,024 25,000 12,997 20,000 (20.0%) (5,000) 0 36,918 2,500 12,000 10,447 7,500 (37.5%) (4,500) 0 28, , , % , ,000 17,562 65,000 (76.4%) (210,000) , ,000 1,888 25,000 (85.7%) (150,000) 0 150, , n/a , ,000 n/a 1,000 2,404 1,591 2,180 3,000 1,867 3, % 0 5,519 6,153 7,542 7,000 7,292 7, % ,198 3,060 50, , % 90, , ,000 1,034 0 (100.0%) (20,000) 0 15, ,000 n/a 10,000 2, , , % 0 12,579 17,759 19,597 25,000 17,010 25, % 0 23, , , , ,846 2,450, % 1,762,000 Total Expenditures and Transfers Total Department Surplus/(Deficit) Ending Special Projects Department Balance 23, , , , ,846 2,450, % 1,762,000 3, , ,673 (464,000) 114,170 (586,250) 26.3% (122,250) $ 72,686 $ 224,644 $ 499,317 $ 35,317 $ 613,487 $ 27,237 (22.9%) ($8,080) Page 14 of 15
22 Capital Projects Beginning Capital Projects Department Balance Revenues REET 1 - Real Estate Excise Tax REET 2 - Growth Excise Tax KC Flood Control District KC Parks Levy - Prop 2 Medina Share - 84th Ave Project TIB Grant for 24th / 84th Signal & Overlay Proj. TIB Grant for 24th Overlay Program Miscellaneous Revenue Total Revenues $ 2,470,330 $ 3,250,365 $ 3,633,042 $ 3,111,663 $ 3,111,663 $ 3,020,440 (2.9%) ($91,223) 449, , , , , , % 0 449, , , , , , % 0 110, , ,200 29,600 (75.6%) (91,600) 15,352 16,529 17,048 16,500 17,022 17, % , , , ,401 45,950 (93.9%) (704,400) 110, , , ,779 0 (100.0%) (936,350) ,000 n/a , n/a 0 1,134,121 1,101,727 1,163,926 2,724,400 3,079,880 1,242,550 (54.4%) (1,481,850) Total Revenues and Transfers Expenditures Other Improvements - Roadway Other Improvements - Storm Drainage Sidewalk Construction Capital Asset Maintenance Total Expenditures Rev less Exp Surplus/(Deficit) 1,134,121 1,101,727 1,163,926 2,724,400 3,079,880 1,242,550 (54.4%) (1,481,850) 15, , ,639 3,140,000 2,965, ,000 (71.5%) (2,245,000) 57,694 16, , , , , % 15, , ,913 1,012,351 60, , % 120,000 13, ,105 75, , % 0 354, ,050 1,685,305 3,635,000 3,171,103 1,525,000 (58.0%) (2,110,000) 780, ,677 (521,379) (910,600) (91,223) (282,450) (69.0%) 628,150 Total Expenditures and Transfers Total Department Surplus/(Deficit) Ending Capital Projects Department Balance 354, ,050 1,685,305 3,635,000 3,171,103 1,525,000 (58.0%) (2,110,000) 780, ,677 (521,379) (910,600) (91,223) (282,450) (69.0%) 628,150 $ 3,250,365 $ 3,633,042 $ 3,111,663 $ 2,201,063 $ 3,020,440 $ 2,737, % $ 536,927 Page 15 of 15
23 Monthly Operating Report City of Clyde Hill, Washington For December 31, 2018 ACTUAL BUDGETED VARIANCE 2017 December YEAR YEAR Favorable vs 2018 YTD 2018 TO DATE TO DATE (Unfavorable) BUDGET $ 8,504,898 Beginning Fund Balance $ 9,579,667 $ 8,525,567 $ 8,525,567 $ - $ 8,525,567 1,017,492 Property Taxes 5,552 1,007,596 1,013,000 (5,404) 1,013, ,669 Sales Tax 68, , , , , ,750 Utility Taxes/Franchise Fees/Bus Licensing 5, , ,900 (19,826) 830,900 1,277,504 Development Revenues 21,758 1,689,069 1,280, ,069 1,280,000 69,488 Motor Vehicle Revenues 7,392 70,252 70, ,000 55,401 State Shared Revenues 7,135 45,655 41,100 4,555 41, ,556 Services to Other Communities - 420, ,000 (155) 421,000 98,047 Traffic Fines and Other Penalties 2,024 32,579 62,500 (29,921) 62,500 80,865 Investment Income 19, , ,500 45, , ,363 Wireless Communication Facility Leases - 222, , ,125 24,624 Other Operating Revenues 14,694 79,727 40,000 39,727 40,000 $ 4,660,759 Total Operating Revenues $ 152,121 $ 5,255,811 $ 4,696,125 $ 559,686 $ 4,696, ,101 Restricted Funds - Real Estate Excise Taxes 96,327 1,341, , , , ,272 Restricted Funds - Other Revenues 149,653 1,914,153 1,993,550 (79,397) 1,993,550 $ 6,084,132 Total Revenues $ 398,101 $ 8,511,442 $ 7,589,675 $ 921,767 $ 7,589,675 General Government $ 40,667 Legislative & Executive Administrative $ 3,540 $ 43,027 $ 45,000 $ 1,973 $ 45, ,371 Salaries & Benefits 56, , ,000 94, ,000 67,249 Legal Services 21, , ,000 2, ,000 67,427 Insurance - 78,177 82,000 3,823 82,000 0 Equipment Replacement ,285 Other Expenses 28, , ,400 (31,413) 161,400 $ 909,998 Total General Government $ 110,034 $ 1,008,759 $ 1,080,400 $ 71,641 $ 1,080,400 Law Enforcement $ 1,194,844 Salaries & Benefits $ 115,310 $ 1,297,109 $ 1,381,000 $ 83,891 $ 1,381,000 74,850 Prosecutor & Filing Fees 11,957 66,647 99,000 32,353 99, ,243 NORCOM Dispatch & Jail Expense - 103, ,225 21, ,225 46,769 Equipment Replacement 5,593 37,241 45,000 7,759 45,000 57,262 Other Expenses 23,143 88,287 78,000 (10,287) 78,000 48,932 Restricted Funds- Criminal Justice 14,293 60,794 76,200 15,406 76,200 $ 1,524,900 Total Law Enforcement $ 170,295 $ 1,653,521 $ 1,804,425 $ 150,904 $ 1,804,425 Public Works $ 585,097 Salaries & Benefits $ 52,664 $ 600,146 $ 646,000 $ 45,854 $ 646,000 0 Equipment Replacement - 112, ,000 (12,787) 100, ,149 Street Utilities & Maintenance 27, , ,550 (4,431) 126,550 76,690 Other Expenses 9,817 76,009 67,700 (8,309) 67, Building Official Services 5,500 33,026 3,000 (30,026) 3,000 1,665,200 Restricted Funds - Construction 155,312 3,171,103 3,560, ,897 3,560, ,001 Limited Purpose Funds - Other Expenditures 29, , , , ,000 $ 2,980,082 Total Public Works $ 280,785 $ 4,325,099 $ 5,378,250 $ 1,053,151 $ 5,378,250 Other $ 623,483 Fire Services Contract & Medic One $ - $ 632,976 $ 652,975 $ 19,999 $ 652,975 25,000 Limited Purpose Funds - Regional Issues ,000 25,000 25,000 $ 648,483 Total Other $ - $ 632,976 $ 677,975 $ 44,999 $ 677,975 $ 6,063,464 Total Expenditures $ 561,114 $ 7,620,354 $ 8,941,050 $ 1,320,696 $ 8,941,050 $ 8,525,566 Ending Fund Balance $ 9,416,654 $ 9,416,655 $ 7,174,192 $ 2,242,463 $ 7,174,192 Summary for December, 2018 General Reserve Project ALL Fund Fund Fund FUNDS Beginning Fund Balance $ 1,522,225 $ 3,910,393 $ 4,147,049 $ 9,579,667 REVENUES 152, , ,101 EXPENDITURES 355, , ,114 Surplus of (Deficit): $ (203,797) $ - $ 40,784 $ (163,013) Total Transfer-Ins Total Transfer-Outs Fund Equity: $ 1,318,428 $ 3,910,393 $ 4,187,832 $ 9,416,654 Trust and Agency Fund Balance , ,966 Ending Fund Balance (Total Cash & Investments) $ 1,318,428 $ 3,910,393 $ 4,513,798 $ 9,742,620
24 COMBINED BALANCE SHEET - ALL FUND TYPES CITY OF CLYDE HILL, WASHINGTON As of December 31, 2018 GOVERNMENTAL FUND TYPES General Reserve Projects Trust & Agency 2018 TOTALS ASSETS Cash and Cash Equivalents $ 1,318,428 $ 3,910,393 $ 4,187,832 $ 325,966 $ 9,742,620 Investments, at Principal Value Accounts Receivable Subtotal $ 1,318,428 $ 3,910,393 $ 4,187,832 $ 325,966 $ 9,742,620 Equipment $ 607,100 Land 257,011 Buildings 1,057,167 Total Assets $ 1,318,428 $ 3,910,393 $ 4,187,832 $ 325,966 $ 11,663,898 LIABILITIES AND FUND BALANCES Liabilities Due to Other Governmental Units ,238 1,238 Customer & Employee Deposits , ,728 Total Liabilities , ,966 Fund Equity Investment in Fixed Assets 1,921,278 Total Fund Equity (Cash Basis) $ 1,318,428 $ 3,910,393 $ 4,187,832 $ - $ 9,416,654 Total Liabilities and Fund Equity $ 1,318,428 $ 3,910,393 $ 4,187,832 $ 325,966 $ 11,663,898 Cash and Cash Equivalents + Accounts Receivable US Bank Payroll Checking Account $ 3,621 US Bank Operating Checking Account 172,364 Petty Cash 325 Washington State Investment Pool (LGIP) 9,566,309 Deposit in Transit 0 $ 9,742,620 Investments, at Principal Value Total Cash & Investments by Bank Accounts $ 9,742,620 The amount of "Total Cash and Investments by Bank Account" equals the Subtotal in the Assets section of the Combined Balance Sheet and equals the Ending Fund Balance (including the Trust & Agency Fund balance) on the Monthly Operating Report on the lower right hand side of the page.
 net earnings rate as of 12/31/2018 was 2.3735% (Jan'18 = 1.4290%).")

25 The Cash and Investment Report City of Clyde Hill, Washington As of December 31, 2018 Purpose: To illustrate what funds currently account for the City's cash and investments and also where the financial resources are located. The Local Government Investment Pool (LGIP) net earnings rate as of 12/31/2018 was % (Jan'18 = %). Fund Accounting: Depository Location; General Fund $ 1,318,428 US Bank Checking - Operating $ 172,364 Reserve Fund $ 3,910,393 US Bank Checking - Payroll $ 3,621 Projects Fund $ 4,187,832 LGIP - State Treasurers Office $ 9,566,309 Trust & Agency Fund $ 325,966 Other $ - Total $ 9,742,620 Petty Cash & Change Fund $ 325 Total $ 9,742,620 Fund Accounting for Cash & Investments as of December 31, 2018 Projects Fund; $4,187,832 ; 43% Trust & Agency Fund; $325,966 ; 3% General Fund; $1,318,428 ; 14% Reserve Fund; $3,910,393 ; 40% Depository Location for Cash & Investments As of December 31, 2018 Petty Cash Accounts; $325 ; 0% US Bank Checking - Operating; $172,364 ; 2% US Bank Checking - Payroll; $3,621 ; 0% LGIP - State Treasurers Office; $9,566,309 ; 98%
GENERAL FUND Revenues
 GENERAL FUND Revenues The General Fund is used to account for general purpose revenues, which are used to fund general governmental services, excluding utilities. Following are descriptions of the City's
2019 BUDGET TOTALS City Of Soap Lake Time: 12:39:57 Date: 12/27/2018 MCAG #: 0325 Page: General Fund 01/01/2019 To: 12/31/2019
 MCAG #: 0325 Page: 1 001 General Fund 01/01/2019 To: 12/31/2019 308 80 01 00 Beginning Balance 56,910.72 56,910.72 310 Taxes 311 10 00 00 Property Tax 158,226.20 313 11 00 00 Retail Sales Tax 97,077.99
Grant-DOJ-Bulletproof Vest State Grants
 City of Colfax: Budget 2017-Revenues 001-General (Current Expense) Fund Beginning Fund Balances - Non Restricted 001-000-000-308-80-01-00 Beg Bal - General Unreserved $ 48,834.00 001-000-000-308-80-02-00
REVENUE ASSUMPTIONS. Actual Actual Adopted Revised Adopted TOTAL SOURCES BEGINNING FUND BALANCE $
 General Government Funds Revenues REVENUE ASSUMPTIONS This section explains and illustrates the estimates for revenue sources included in the General Government funds of the 2009/ Biennial. Key funding
City of Milton 4th Qtr Financial Report
 1 TO: CC: FROM: Debra Perry, Mayor Milton City Council City Administrator Department Directors Lisa Tylor, Finance Director DATE: March 17, 2014 SUBJECT: - Fourth Quarter/Year-End Financial Status Report
4. ADJOURN. Page 2 of 113
 AGENDA City of Clyde Hill Council Budget-Related Study Session Special Meeting Tuesday, August 21, 2018-7:00 PM Clyde Hill City Hall Page 1. CALL TO ORDER 2. ROLL CALL 3 2.1. Welcome and thanks to the
City of Williston Fiscal Year 2017/2018 Adopted Budget
 City of Williston Fiscal Year 2017/2018 Adopted Budget (Adopted on September 20, 2017) Table of Contents Page # Budget Summary Budget Comparison by Fund 1-2 Millage Rate Options 3 Team Count by Department
City of Prosser, WA Annual Report
 City of Prosser, WA 2015 Annual Report City of Prosser, WA Schedule C/4, C/5, 01 Detail of Revenues and Expenditures 2015 Annual Report City of Prosser Fund Resources and Uses Arising from Cash Transactions
Village of Kenilworth Fiscal Year 2019 Adopted Budget
 F Village of Kenilworth Fiscal Year 2019 Adopted FY 16 Delta FY18B v. FY19P 23 GENERAL FUND Total General Operating Revenues: 4,793,044 4,514,062 4,429,149 3,993,544 4,584,330 4,491,415 62,266 Administration
City of Williston Fiscal Year 2014/2015 Adopted Budget
 City of Williston Fiscal Year 2014/2015 Adopted Budget (Adopted on September 23, 2014) Table of Contents Page # Budget Summary Budget Advertisement 1 Budget Summary by Fund 2-3 Budget Comparison by Fund
Section E. Recap By Fund. Table of Contents
 Section E. Recap By Fund Table of Contents Fund # Fund Name Page # General Purpose Funds 001 General Fund... E-3 037 Self-Insurance Claim Reserve... E-9 061 Youth Services Endowment Fund... E-11 Special
Village of DeForest 2018 Adopted Budget
 Village of DeForest 2018 Adopted Budget Public Hearing December 5, Village Board Adopted December 5, 2018 Village of DeForest Table of Contents - Adopted Budget All Funds Schedule Page # Public Hearing
GENERAL FUND Revenues
 GENERAL FUND Revenues The General Fund is the general operating fund of the City and encompasses the major activities of the City excluding utilities. The activities of fire and police services, street
CITY OF WILLISTON, FLORIDA BUDGET WORKSHOP AGENDA
 CITY OF WILLISTON, FLORIDA BUDGET WORKSHOP AGENDA DATE: MONDAY, JULY 17, 2017 TIME: 5:30 P.M. PLACE: WILLISTON CITY COUNCIL ROOM CALL TO ORDER ROLL CALL MEMBERS: Mayor R. Gerald Hethcoat President Charles
ID: BP WOW FUND: GENERAL FUND
 DATE: 11/27/2013 VILLAGE OF GERMANTOWN PAGE: 1 TIME: 12:02:17 FUND: GENERAL FUND BEGINNING BALANCE 0 TAXES TAXES 10-410-411-1100 GENERAL PROPERTY TAXES 8,689,638 7,240,965 8,689,158 8,950,755 10-410-411-1400
CITY OF MOBILE MONTHLY FINANCIAL REPORT CUMULATIVE REPORT FOR PERIOD OCTOBER 1, 2016 THRU SEPTEMBER 30, 2017
 CITY OF MOBILE MONTHLY FINANCIAL REPORT CUMULATIVE REPORT FOR PERIOD OCTOBER 1, 2016 THRU SEPTEMBER 30, 2017 CITY OF MOBILE GENERAL FUND BALANCE SHEET SEPTEMBER - FISCAL YEAR 2017 ASSETS: CASH ACCOUNTS
CITYOF MEDINA. - Expense increase due to Executive separation agreement.
 CITYOF MEDINA ITEM PH-2/ OB-2 November 12, 2013 To: Mayor and City Council From: Robert J. Grumbach, Interim City Manager Re: 2014 Budget Message I am pleased to submit for review and adoption the City
BUDGET GENERAL FUND 2019 BEG. CASH BALANCE
 Borough of St. Lawrence BUDGET GENERAL FUND 2019 BEG. CASH BALANCE $ 163,621.21 REVENUE $ 846,151.37 EXPENDITURES $ (948,189.45) NETCASHINFLOW(OUTFLOW) $ (102,038.08) LIABILITIES $ ENDING CASH BALANCE
Buckingham Township Adopted Budget Summary - All Funds 2019
 Buckingham Township Summary - All Funds Proposed - Estimated Estimated Fund Beginning Fund Total Ending Fund No. Fund Name Balance Total Revenues Expenditures Balance 01 General Fund $ 5,031,275 8,865,550
City of Mountlake Terrace. Second Quarter 2016 Financial Report September 19, 2016
 City of Mountlake Terrace Second Quarter 2016 Financial Report September 19, 2016 1 Overview Reviewing the City s finances on a regular basis, and posting the review on the City s website, highlights the
CITY OF WILLISTON, FLORIDA BUDGET WORKSHOP AGENDA
 CITY OF WILLISTON, FLORIDA BUDGET WORKSHOP AGENDA DATE: TUESDAY, AUGUST 12, 2014 TIME: 7:00 P.M. PLACE: WILLISTON CITY COUNCIL ROOM CALL TO ORDER ROLL CALL MEMBERS: Mayor R. Gerald Hethcoat President Jason
Inter-govt $ 158,467 $ 143,495 $ 14, % $
 2017 2017 % 2017 Budget Current Expense/001 2,212,064 Taxes: Property Taxes 615,320 614,192 1,128 0.18% 1,092,204 Sales Tax 1,457,298 1,243,844 213,454 17.16% 1,698,696 Quarterly Mitigation Payments 48,313
September 2017 Monthly Financial Report
 GENERAL FUND OVERVIEW BTD Projection BTD Actuals BTD BTD % $ 450,269,075 $ 158,460,148 $ 164,069,809 $ 5,609,661 3.5% Expenditures $ 472,660,334 $ 163,254,649 $ 157,168,629 $ 6,086,020 3.7% Revenue Over
VILLAGE OF CHESTNUT RIDGE ADOPTED BUDGET YEAR ENDING MAY 31, 2018 ADOPTED APRIL 20, /20/17 Adopted Adopted 5/31/17 5/31/18 APPROPRIATIONS
 APPROPRIATIONS A 1010 Legislative - Village Trustees: Trustees 26,000 26,000 A 1110 Judicial - Justices: Justices 28,500 28,500 Prosecutor/Steno Prosecutor 14,000 18,000 Steno 6,000 6,000 Contractual 7,000
2019 Budget PROPOSED Budget & Finance Budget & Finance
 REVENUES TAXES 301 REAL PROPERY TAXES 301.100 Real Property Taxes 2,199,814 2,113,626 301.400 Delinquent, Tax Claim Bureau 60,151 60,524 301.500 Real Estate Taxes--Fire Protection 331,664 318,669 301.550
Interfund Loan Repayments $ - $ - Total Revenues $ 1,350,436 $ 1,104, , % $ 9,034,042. Non-Labor
 Current Expense/001 3,205,960 Taxes: Property Taxes $ 4,612 $ 4,307 305 7.08% $ 1,191,683 Sales Tax 380,962 358,333 22,629 6.32% 2,150,000 Sales Tax EMS 33,284 29,167 4,117 14.12% 175,000 Water/Sewer/Storm
October 2017 Monthly Financial Report
 GENERAL FUND OVERVIEW BTD Projection BTD Actuals BTD BTD % $ 450,269,075 $ 173,891,518 $ 181,528,672 $ 7,637,154 4.4% Expenditures $ 472,660,334 $ 180,624,776 $ 174,595,293 $ 6,029,483 3.3% Revenue Over
State of Kansas City. Water & Sewer Utility Fund 15 1,686,031 Gas Utility Fund 16 54,820
 CERTIFICATE 2015 To the Clerk of Cloud, State of Kansas We, the undersigned, officers of of Concordia certify that: (1) the hearing mentioned in the attached publication was held; (2) after the Budget
Non-Labor 4,067 3,076 (991) % 4,100. Non-Labor 128, ,752 24, % 263,575
 % 4,100. Non-Labor 128, ,752 24, % 263,575") Current Expense/001 2,774,210 Taxes: Property Taxes $ 703,90 711,777 (7,877) 1.11% $ 1,300,280 Sales Tax 1,454,535 1,273,220 181,315 14.24% 2,000,000 Quarterly Mitigation Payments 16,326 30,540 (14,214)
Current Expense/001 2,774,210 Taxes: Property Taxes $ 703,90 711,777 (7,877) 1.11% $ 1,300,280 Sales Tax 1,454,535 1,273,220 181,315 14.24% 2,000,000 Quarterly Mitigation Payments 16,326 30,540 (14,214)
Non-Labor 4,741 3,759 (981) % 4,100. Non-Labor 182, ,646 36, % 263,575
 % 4,100. Non-Labor 182, ,646 36, % 263,575") Current Expense/001 2,774,210 Taxes: Property Taxes $ 1,285,934 $ 1,288,348 (2,414) 0.19% $ 1,300,280 Sales Tax 2,018,181 1,814,471 203,710 11.23% 2,000,000 Quarterly Mitigation Payments 16,326 45,809
Current Expense/001 2,774,210 Taxes: Property Taxes $ 1,285,934 $ 1,288,348 (2,414) 0.19% $ 1,300,280 Sales Tax 2,018,181 1,814,471 203,710 11.23% 2,000,000 Quarterly Mitigation Payments 16,326 45,809
Inter-govt $ 438,562 $ 192, , % $
 Current Expense/001 2,774,210 Taxes: Property Taxes $ 1,300,015 $ 1,300,280 (265) 0.02% $ 1,300,280 Sales Tax 2,214,660 2,000,000 214,660 10.73% 2,000,000 Quarterly Mitigation Payments 16,326 61,079 (44,753)
Bus. Licenses/Franchise Fees/Cell Tower Rent/Gun Permits 394, ,200 36, % 372,200
 Current Expense/001 2,774,210 Taxes: Property Taxes $ 689,466 $ 689,547 (81) 0.01% $ 1,300,280 Sales Tax 899,328 783,411 115,917 14.80% 2,000,000 Quarterly Mitigation Payments 16,326 15,270 1,056 6.91%
2019 General Fund Budget
 Revenue 301 Real Property Taxes 301.10 Real Estate Taxes 676,500 301.20 Real Estate Taxes Prior 4,000 301.30 Real Estate Taxes Delinquent 15,000 Sub-Total $695,500 310 Local Enabling Taxes 310.01 Per Capita
CITY OF WILLISTON General Fund Chart of Accounts - Fiscal Year FY 2013 Annual Budget
 REVENUES 001-311-100 ADVALOREM TAXES $ 521,532 001-311-200 DELINQUENT AD VALOREM TAXES 7,000 001-312-400 LOCAL OPTION TAX: GAS 6C 32,059 001-312-600 LOCAL GOVT INFRTR TX-DISCRETIONARY 179,934 001-314-100
CITY OF WILLISTON, FLORIDA BUDGET HEARING AGENDA
 CITY OF WILLISTON, FLORIDA BUDGET HEARING AGENDA DATE: TIME: PLACE: TUESDAY, SEPTEMBER 20, 2016 6:50 P.M. WILLISTON CITY COUNCIL ROOM CALL TO ORDER ROLL CALL MEMBERS: Mayor R. Gerald Hethcoat President
New Mexico Department of Finance and Administration Local Government Division Property Valuation Estimate
 New Mexico Department of Finance and Administration Local Government Division Property Valuation Estimate COUNTY: Colfax County Fiscal Year: 2017-2018 ROUNDED TO NEAREST DOLLAR (A) (B) (C) (D) PROPERTY
June 2017 Monthly Financial Report
 GENERAL FUND OVERVIEW BTD Projection BTD Actuals BTD BTD % $ 450,69,075 $ 9,060,86 $,,08 $,07,64.6% Expenditures $ 47,660,4 $ 07,478,7 $ 0,508,57 $ 4,969,6 4.6% Revenue Over Expenditure (Fund Balance)
FARR WEST CITY Tentative Revised Budget
 GENERAL FUND - SUMMARY REVENUES GENERAL FUND Taxes $ 1,263,000 $ 1,216,000 $ 1,217,000 $ 1,030,324 $ 986,005 Licenses & Permits 250,000 153,000 258,000 156,518 99,662 Intergovernmental Revenues 198,000
CITY OF MOBILE MONTHLY FINANCIAL REPORT CUMULATIVE REPORT FOR PERIOD OCTOBER 1, 2017 THRU SEPTEMBER 30, 2018
 CITY OF MOBILE MONTHLY FINANCIAL REPORT CUMULATIVE REPORT FOR PERIOD OCTOBER 1, 2017 THRU SEPTEMBER 30, 2018 CITY OF MOBILE GENERAL FUND BALANCE SHEET SEPTEMBER - FISCAL YEAR 2018 ASSETS: Beginning Balance
Budget Summary For the Month of June, 2013
 Current Expense/001 Taxes: 1,184,755 2013 2013 % 2013 Budget Property Taxes 1,207,199 1,235,913 (28,714) 2.32% 2,289,936 Sales Tax / Quarterly Mitigation Payments 757,049 778,498 (21,449) 2.76% 1,557,000
Name. Basic Form Instructions
 Adopted Budget Form for: Cities, Towns & Counties Name Perry City Fiscal Year Ended 6/30/2018 1. As required by Utah statutes, budget forms submitted must present a balanced budget, meaning budgeted expenditures
2018 Proposed Budget
 Revenue 301 Real Property Taxes 301.00 Real Estate Taxes $665,600 301.20 Real Estate Taxes Prior $3,000 301.30 Real Estate Taxes Delinquent $15,000 Sub-Total $683,600 310 Local Enabling Taxes 310.10 Real
City of Oroville 2017 BUDGET 2017 BUDGET AMOUNT
 City of Oroville 2017 BUDGET FUND 2017 BUDGET AMOUNT 001 Current Expense Fund 1,600,000.00 101 Street Fund 1,380,000.00 103 Park Fund 400,000.00 104 Tourist Promo Fund 187,500.00 130 Park Development Reserve
THIRD QUARTER FINANCIAL REPORT September 30, 2018
 THIRD QUARTER FINANCIAL REPORT September 30, 2018 2018 Cider Squeeze Introduction The 3rd Quarter 2018 Financial Report is presented here. As has been the custom in the past, the report has been prepared
CITY OF MILTON ORDINANCE NO
 CITY OF MILTON ORDINANCE NO. 1931-17 AN ORDINANCE OF THE CITY OF MILTON, WASHINGTON; ADOPTING THE BUDGET FOR THE FISCAL YEAR ENDING DECEMBER 31, 2018; BUDGETING AMOUNTS BY FUND; PROVIDING FOR THE MAYOR
CITY OF WILLISTON, FLORIDA BUDGET HEARING AGENDA
 CITY OF WILLISTON, FLORIDA BUDGET HEARING AGENDA DATE: TUESDAY, SEPTEMBER 25, 2018 TIME: 6:50 P.M. PLACE: TEMPORARY WILLISTON CITY COUNCIL ROOM 427 WEST NOBLE AVENUE CALL TO ORDER ROLL CALL MEMBERS: Mayor
TOTAL TAXES 5,789,395 5,518,500 4,902,272 5,730,002 6,460, ,736
 BEGINNING BALANCE 3,520 316,623 REVENUES 301 REAL ESTATE PROPERTY TAXES 30110 RE TAX CURRENT YEAR 2,120,952 2,282,500 2,085,563 2,143,567 3,148,736 866,236 30120 RE TAX PRIOR YEAR 27,135 25,000 7,254 7,254
Town of South Palm Beach Adopted Budget Fiscal Year
 Adopted Budget Fiscal Year 2011 2012 Adopted General Fund Budget Summary FY2011 Actual FY2012 variance Budget @ 06/30/11 Adopted % dollar Revenues Ad Valorem Taxes $1,079,917 $1,045,228 $1,079,036 0.08%
July Director of Finance Report. CITY OF TACOMA Finance Department Robert K. Biles Director of Finance
 Director of Finance Report CITY OF TACOMA Finance Department Robert K. Biles Director of Finance In accordance with the City of Tacoma s Charter, the Director of Finance prepares a monthly report which
SECOND QUARTER FINANCIAL REPORT June 30, 2018
 SECOND QUARTER FINANCIAL REPORT June 30, 2018 UpTown Cruisin Car Show June, 2018 Introduction The second quarter 2018 financial report is presented here. As has been the custom in the past, the report
City of Rogers 2019 General Fund & Special Revenue Fund Expenditures and Other Financing Uses Budget Summary
 2019 General Fund & Special Revenue Fund Expenditures and Other Financing Uses Budget Summary GENERAL FUND REVENUES Use/(Contribution to) of Fund Balance -20,519-627,434 11,900 0-100.00% Property Taxes
2012 Budget FINAL 9/12/11
 FINAL 9/12/11 GENERAL FUND REVENUES CARRYOVER $ 58,230 600201 ADVALOREM TAX $ 524,066 600401 FOUNDATION REV-Capital $ - FOUNDATION REV-Operating $ 220,000 600601 MOTOR VEHICLE TAX $ 49,458 601001 DELINQUENT
DATE: 11/21/2014 VILLAGE OF GERMANTOWN PAGE: 2 TIME: 09:48:29 FUND: GENERAL FUND TOTAL LICENSES 63,136 57,688 51,800 52,839 70,448 54,000 BUILDING INS
 DATE: 11/21/2014 VILLAGE OF GERMANTOWN PAGE: 1 TIME: 09:48:29 FUND: GENERAL FUND TAXES 10-410-411-1100 GENERAL PROPERTY TAX 8,754,348 8,689,238 8,950,755 6,713,066 8,950,755 8,961,076 10-410-411-1400 MOBILE
Lower Swatara Township General Fund Budget Budget ******************* 2010 Budget
 REVENUES ADOPTED TAXES 301 REAL PROPERY TAXES 301.10 Real Property Taxes 1,450,000 301.20 Prior Year 0 301.40 Delinquent, Tax Claim Bureau 40,000 301.50 Real Estate Taxes--Fire Protection 155,000 SUBTOTAL
Inter-govt $ 166,684 $ 177,375 ($10,691) -6.03% $
 -6.03% $") 2014 2014 % 2014 Budget Current Expense/001 Beginning Cash: 1,376,335 Taxes: Property Taxes 2,393,711 2,338,650 55,061 2.35% 2,343,650 Sales Tax / Quarterly Mitigation Payments 1,578,690 1,527,726 50,964
2014 2014 % 2014 Budget Current Expense/001 Beginning Cash: 1,376,335 Taxes: Property Taxes 2,393,711 2,338,650 55,061 2.35% 2,343,650 Sales Tax / Quarterly Mitigation Payments 1,578,690 1,527,726 50,964
ADMINISTRATIVE HEARINGS 80, AMBULANCE & RESCUE FEES 420, CPR CLASS 1, FIRST AID CLASS 100
 DATE: 07/11/2014 VILLAGE OF MAYWOOD PAGE: 1 BUDGET REPORT FUND: GENERAL FUND NUMBER DESCRIPTION BUDGET --- BEGINNING BALANCE 0 CORPORATE REVENUES 01-10-30125 ADMINISTRATIVE HEARINGS 80,000 01-10-30130
City of Oak Ridge North Monthly Trend Report of Revenues and Expenditures
 City of Oak Ridge North Monthly Trend Report of Revenues and Expenditures Amended October November December January February March April May June FY 2017 YTD Total % GENERAL REVENUES 00 51010 Curr Coll-Prop
CITY OF MOBILE MONTHLY FINANCIAL REPORT CUMULATIVE REPORT FOR PERIOD OCTOBER 1, 2017 THRU JANUARY 31, 2018
 CITY OF MOBILE MONTHLY FINANCIAL REPORT CUMULATIVE REPORT FOR PERIOD OCTOBER 1, 2017 THRU JANUARY 31, 2018 CITY OF MOBILE GENERAL FUND BALANCE SHEET JANUARY - FISCAL YEAR 2018 ASSETS: Beginning Balance
CITY OF SPARTA REVENUES WITH COMPARISON TO BUDGET FOR THE 10 MONTHS ENDING OCTOBER 31, 2018 GENERAL FUND
 REVENUES WITH COMPARISON TO BUDGET PRIOR YTD PERIOD AMT YTD ACTUAL BUDGET UNEARNED PCNT TAXES 100-41100 GENERAL PROPERTY TAXES 1,297,987.00 8,800.66 21,134.90 1,478,479.80 1,457,344.90 1.4 100-41140 MOBIL
CITY OF WILLISTON, FLORIDA BUDGET HEARING AGENDA
 CITY OF WILLISTON, FLORIDA BUDGET HEARING AGENDA DATE: TUESDAY, SEPTEMBER 22, 2015 TIME: 6:50 P.M. PLACE: WILLISTON CITY COUNCIL ROOM CALL TO ORDER ROLL CALL MEMBERS: Mayor R. Gerald Hethcoat President
Inter-govt $ 101,873 $ 96,750 $ 5, % $
 Current Expense/001 Beginning Cash: 1,376,335 Taxes: Property Taxes 1,304,744 1,248,131 56,613 4.54% 2,343,650 Sales Tax / Quarterly Mitigation Payments 801,983 803,400 (1,417) 0.18% 1,606,800 Sales Tax
How to Read the Budget
 How to Read the Budget Identifies the overall mission of the department or division Describes the actions to be taken to fulfill the general goal, including services, programs or projects to be completed
Best Practices for Treasurers 2018 Summer Specialized Training RESPONSIBILITIES OF THE TREASURER
 Best Practices for Treasurers 2018 Summer Specialized Training RESPONSIBILITIES OF THE TREASURER BEFORE THE BOARD MEETING 1. Prepare some claims for payment (clerk may also do these), attach bills to claims,
City of Mountlake Terrace. Fourth Quarter 2014 Financial Report April 2, 2015
 City of Mountlake Terrace Fourth Quarter 2014 Financial Report April 2, 2015 1 Overview Reviewing the City s finances on a regular basis, and posting the review on the City s website, highlights the City
CITY OF SPARTA REVENUES WITH COMPARISON TO BUDGET FOR THE 6 MONTHS ENDING JUNE 30, 2015 GENERAL FUND
 REVENUES WITH COMPARISON TO BUDGET PRIOR YTD PERIOD AMT YTD ACTUAL BUDGET UNEARNED PCNT TAXES 100-41100 GENERAL PROPERTY TAXES ( 331.70) 2,413.22 2,979.94 1,237,581.20 1,234,601.26.2 100-41140 MOBIL HOME
CITY OF SPARTA REVENUES WITH COMPARISON TO BUDGET FOR THE 7 MONTHS ENDING JULY 31, 2015 GENERAL FUND
 REVENUES WITH COMPARISON TO BUDGET PRIOR YTD PERIOD AMT YTD ACTUAL BUDGET UNEARNED PCNT TAXES 100-41100 GENERAL PROPERTY TAXES 36.42.00 2,979.94 1,237,581.20 1,234,601.26.2 100-41140 MOBIL HOME TAXES 125,480.30
2016 Budgeted Revenue PW - Roads
 2016 Budgeted Revenue 10101.611. PW - Roads 30800. 00. 0000 Beginning Fund Balance $18,719,220 31000. 00. 0000 Taxes 31110. 00. 0000 Real and Personal Property Taxes 7,056,870 31130. 00. 0000 Sale of Tax
Profit & Loss Budget vs. Actual January through December 2018
 12:25 PM Manheim Borough -General Fund 10/08/18 Profit & Loss Budget vs. Actual January through December 2018 Accrual Basis Income 01 General Fund Income 301 Real Estate Taxes 301.100 Real Estate Tax Current
City of Concordia, KS Monthly Financial Report August 31, 2013
 City of Concordia, KS Monthly Financial Report August 31, 2013 BUDGETED FUNDS Beginning Ending Encumbrances Subtract Cash Balance Unencumbered Cash Unencumbered and Accounts Accounts August 31, Funds Cash
CITY OF EAST TAWAS Budget
 2015-2016 Budget Adopted June 1, 2015 GENERAL FUND 2015 16 ESTIMATED REVENUES 101 000 000.999 TRANSFER FROM PRIOR YEAR FUNDS 179,277 101 000 402.000 CURRENT PROPERTY TAX 1,207,797 101 000 426.000 PAYMENT
TOWN OF IOWA REVENUES WITH COMPARISON TO BUDGET FOR THE 1 MONTHS ENDING JULY 01, 2017 GENERAL FUND
 REVENUES WITH COMPARISON TO BUDGET GENERAL FUND PERIOD ACTUAL YTD ACTUAL BUDGET UNEARNED PCNT TAXES 01-31-100 TAXES - PROPERTY.00.00 85,000.00 85,000.00.0 01-31-300 TAXES - SALES.00.00 245,098.00 245,098.00.0
CITY OF HAILEY BALANCE SHEET JANUARY 31, 2018 GENERAL FUND TOTAL ASSETS 3,116,960.06
 BALANCE SHEET JANUARY 31, 2018 GENERAL FUND ASSETS 100-00-10100 CASH IN COMBINED CASH FUND ( 67,617.75) 100-00-10110 CASH IN FLEX ACCOUNT 3,304.65 100-00-10125 ELECTRONIC CHECKS IN TRANSIT 5,803.39 100-00-10225
April 2017 Monthly Financial Report
 GENERAL FUND OVERVIEW BTD Projection BTD Actuals BTD BTD % $450,269,075 $66,422,072 $68,580,838 $2,158,767 3.3% Expenditures $472,660,335 $71,585,978 $65,455,323 $6,130,655 8.6% Revenue Over Expenditure
VILLAGE OF TUCKAHOE WESTCHESTER COUNTY, NEW YORK ADOPTED BUDGET FISCAL YEAR ENDING MAY 31, 2019
 WESTCHESTER COUNTY, NEW YORK ADOPTED BUDGET FISCAL YEAR ENDING MAY 31, 2019 TABLE OF CONTENTS Page Budget Summary 1 General Fund Expenditure Summary 2-3 Revenue Summary 4 Expenditure Detail 5-17 Revenue
State of Kansas City. Water & Sewer Utility Fund 14 1,352,556 Gas Utility Fund 15 58,000
 CERTIFICATE 2016 To the Clerk of Cloud, State of Kansas We, the undersigned, officers of of Concordia certify that: (1) the hearing mentioned in the attached publication was held; (2) after the Budget
GENERAL FUND REVENUES AND EXPENDITURES FY Through March % of Budget Year
 GENERAL FUND REVENUES AND EXPENDITURES Current Actual Projected YTD Budget Final Amended Month Current YTD YTD Projected Actual YTD% Projected % REVENUES Budget Actuals Amount Amount Variance of Budget
CITY OF HAILEY BALANCE SHEET OCTOBER 31, 2018 GENERAL FUND TOTAL ASSETS 2,516,582.03
 BALANCE SHEET OCTOBER 31, 2018 GENERAL FUND ASSETS 100-00-10100 CASH IN COMBINED CASH FUND ( 11,909.51) 100-00-10110 CASH IN FLEX ACCOUNT 3,304.65 100-00-10125 ELECTRONIC CHECKS IN TRANSIT 93,085.40 100-00-10225
CITY OF HAILEY REVENUES WITH COMPARISON TO BUDGET FOR THE 1 MONTHS ENDING OCTOBER 01, 2017 GENERAL FUND
 REVENUES WITH COMPARISON TO BUDGET GENERAL FUND PERIOD ACTUAL YTD ACTUAL BUDGET UNEARNED PCNT GENERAL FUND REVENUE 100-00-31001 PROPERTY TAXES FROM COUNTY.00.00 2,449,925.00 2,449,925.00.0 100-00-31009
Local Option Gas Tax 104,847.80
 Ad Valorem 001-000310-311001-01-0000 Ad Valorem Taxes 4,347,633.72 001-000310-311002-00-0000 Ad Valorem Taxes - Delinquent 89,290.90 Total Ad Valorem 4,436,924.62 001-000310-312410-00-0000 Local Option
PROPERTY TAXES Property Taxes $209, Proposed 2017 Property Taxes $221, Change from %
 The purpose of Truth and Taxation is to discuss the proposed property tax levy for the taxes payable year 2018 and the proposed budget for the year 2018. This public hearing is held to discuss and seek
SCHUYLKILL TOWNSHIP - RECEIPTS BUDGET Budget Revised Date: November 2 for Possible Adoption
 1 2 3 4 5 6 7 8 9 10 11 12 13 14 15 16 17 18 19 20 21 22 23 24 25 26 27 28 29 30 31 32 33 34 35 36 37 38 39 40 41 42 43 44 YEARS 2016-2018 2017 2017 2018 Pg 1 ACCT. # GENERAL FUND as of 8/31/2017 CARRYOVER
CITY OF OAK RIDGE NORTH FY 2018 OPERATING BUDGET GENERAL FUND SUMMARY
 ACTUAL AMENDED ESTIMATED GENERAL FUND SUMMARY General Service 2,879,856 3,115,589 2,822,437 2,998,233-3.8% Building & Permits 261,715 221,850 140,066 217,270-2.1% Court 402,215 461,420 481,700 483,630
Township of Haverford
 Township of Haverford Mid-Year Financial Report Larry Gentile Twp. Manager Aimee Cuthbertson Dir. of Finance 2013 Community Tax Structure 30 25 20 15 Tax Levy 26.7305 10 5 5.452 6.992 0 County Township
June 2018 Monthly Financial Report
 GENERAL FUND OVERVIEW 2018 Budget YTD Projection YTD Actuals YTD YTD % $ 231,221,914 $ 122,469,971 $ 127,173,074 $ 4,703,104 3.8% Expenditures $ 253,846,860 $ 123,830,932 $ 111,880,437 $ 11,950,495 9.7%
ANNUAL REPORT. CITY OF DuPONT. MCAG No Submitted pursuant to RCW to the STATE AUDITOR S OFFICE
 ANNUAL REPORT MCAG No. 0576 Submitted pursuant to RCW 43.09.230 to the STATE AUDITOR S OFFICE FOR THE FISCAL YEAR ENDED DECEMBER 31, 2009 MCAG NO. 0576 STATEMENT C-4 FUND RESOURCES AND USES ARISING FROM
FINANCE & ECONOMIC DEVELOPMENT COMMITTEE MAY 4, :00 AM COUNCIL CHAMBERS
 FINANCE & ECONOMIC DEVELOPMENT COMMITTEE MAY 4, 2016 8:00 AM COUNCIL CHAMBERS 1. 2016 FIRST QUARTER FINANCIAL REPORT TROY WOO, FINANCE DIRECTOR (STAFF REPORT ATTACHED) FINANCE & ECONOMIC DEVELOPMENT COMMITTEE
CITY OF HAILEY BALANCE SHEET NOVEMBER 30, 2018 GENERAL FUND TOTAL ASSETS 2,214,020.31
 BALANCE SHEET NOVEMBER 30, 2018 GENERAL FUND ASSETS 100-00-10100 CASH IN COMBINED CASH FUND 20,837.18 100-00-10110 CASH IN FLEX ACCOUNT 3,304.65 100-00-10125 ELECTRONIC CHECKS IN TRANSIT 43,809.51 100-00-10225
CITY OF EAST POINT SUMMARY OF REVENUES & EXPENDITURES FOR THE PERIOD ENDING
 SUMMARY OF S & EXPENDITURES FOR THE PERIOD ENDING Nov 30th 2017 Nov17 FY 2018 FY 2018 % of YTD ACTUAL BUDGET VARIANCE Budget FUND 100 General Fund Taxation $ 7,857,111 $ 26,103,235 $ (18,246,124) 30% Licenses
QUARTERLY FINANCIAL REPORT
 QUARTERLY FINANCIAL REPORT Fourth Quarter to Actuals Trend Analysis This document has been prepared by the Finance department. Please direct any inquiries to the Director, Reginald Lindsey at 913-573-5292
FINANCE COMMITTEE: Chairman Turk, Councilman Gerl, and Councilman Hug
 April 15, 2013 TO: FROM: SUBJECT: FINANCE COMMITTEE: Chairman Turk, Councilman Gerl, and Councilman Hug Rachel Mayer, Director of Finance April 2013 Finance Committee Report The attached reports show both
City of Black Diamond, Wa. Financial Operating Report. For the First Quarter
 City of Black Diamond, Wa Financial Operating Report For the First Quarter General Fund 1st Quarter Finance Report REVENUE 1 Property Tax 1,481,893 1,498,568 1,534,740 54,847 1,479,893 3.6 2 Sales Tax
Biennial Budget Revenues. City of Port Orchard
 2017-2018 Biennial Budget Revenues City of Port Orchard General Ledger Budget Analysis Revenues 2014 2015 2016 Current Expense Fund No. 001 Taxes R01 General Property Taxes 311-10-00 1,084,433 1,308,460
GENERAL FUND REVENUES AND EXPENDITURES FY Through June % of Budget Year
 GENERAL FUND REVENUES AND EXPENDITURES Current Actual Projected YTD Budget Final Amended Month Current YTD YTD Projected Actual YTD% Projected % REVENUES Budget Actuals Amount Amount Variance of Budget
MUNICIPALITY OF NORRISTOWN PROPOSED GENERAL FUND BUDGET 1/1/ /31/2016 DEPT/ ACCT DESCRIPTION FY 2016 BUDGET
 REVENUES 301 REAL PROPERTY TAXES 301000 REAL ESTATE TAXES - CURRENT 10,920,000.00 302000 REAL ESTATE TAXES - DELINQUENT 550,000.00 302200 BOROUGH-INTERIM 20,000.00 11,490,000.00 310 LOCAL TAX ENABLING
Borough of Ebensburg FY 2018 Budget Operating Fund Budget
 OPERATING FUND REVENUES Real Property Taxes 301.100 Real Estate Tax, Current Levy $430,000 301.400 Real Estate Tax, Delinquent $24,000 Total Real Property Taxes $454,000 Local Act 511 Taxes 310.100 Real
VILLAGE OF TUCKAHOE WESTCHESTER COUNTY, NEW YORK FINAL BUDGET FISCAL YEAR ENDING MAY 31, 2018
 WESTCHESTER COUNTY, NEW YORK FINAL BUDGET FISCAL YEAR ENDING MAY 31, 2018 TABLE OF CONTENTS Page Budget Summary 1 General Fund Expenditure Summary 2-3 Revenue Summary 4 Expenditure Detail 5-17 Revenue
CITY OF RED OAK. PROPOSED BUDGET Fiscal Year
 CITY OF RED OAK PROPOSED BUDGET Fiscal Year 2015-2016 The City of Red Oak Required Legislation Notice for Proposed Budget This Budget will raise more total property taxes than last year s budget by an
Second Quarter Financial Statements
 Second Quarter Financial Statements For the six months ended 03.31.2014 Prepared by the Finance Department Quarterly Financial Statements for six months ended 03.31.2014 Quarterly Financial Statements
Licenses/Permits/TV 5, Fines: Fines-District Justice Fines-Clerk of Courts 45, Total 330-Fines 47,500.
 Budget 2017 New Salem Borough Estimated Balance Total Gen Fund Balance 12/31 204,829.00 Includes 125000.00 CD Proposed 2017 Budget REVENUES 301-Real Estate Taxes: 301.10-Real Estate-Current 40,500.00 301.20-Real
CITY OF HAILEY REVENUES WITH COMPARISON TO BUDGET FOR THE 1 MONTHS ENDING OCTOBER 31, 2018 GENERAL FUND
 REVENUES WITH COMPARISON TO BUDGET GENERAL FUND PERIOD ACTUAL YTD ACTUAL BUDGET UNEARNED PCNT GENERAL FUND REVENUE 100-00-31009 SALES TAX REVENUE THROUGH COUN.00.00 2,569,002.00 2,569,002.00.0 100-00-31910