Observations on Alaska s Economy and Economic Implications of Alaska s Fiscal Choices
|
|
|
- Amy Daniels
- 5 years ago
- Views:
Transcription


1 Observations on Alaska s Economy and Economic Implications of Alaska s Fiscal Choices Gunnar Knapp Director and Professor of Economics Institute of Social and Economic Research University of Alaska Anchorage Gunnar.Knapp@uaa.alaska.edu Prepared for presentation to Alaska Senate Finance Committee March 30, 2016 ISER publications and presentations are solely the work of individual authors and should be attributed to them, not to ISER, the University of Alaska Anchorage, or the research sponsors. 1
2 Outline Overview of Alaska s economy Short-run economic impacts of Alaska fiscal options Economic implications of how fast we reduce the deficit I am not advocating for or opposing any bills or proposals 2
3 Overview of Alaska s Economy 3


4 Thanks to the Alaska Department of Labor and Workforce Development economists who do an excellent job tracking Alaska s economy. They provided me with most of the data and charts about the economy that I m using in this presentation. 4
5 Summary of main points about Alaska s economy There is significant concern about: Are we facing a recession? Could what we do to reduce the deficit aggravate the recession? Could we be facing a repeat of the 1980s recession? Despite these concerns: The best available evidence is that Alaska s overall economy is not yet in a recession There are important positive indicators in the economy Several sectors of Alaska s economy are declining: Oil industry Construction State government We probably are facing a recession But it is unlikely that it will be as severe or damaging as the 1980s recession 5
6 Alaska has had twenty-five years of almost continuous but slowing economic growth. Source: Alaska Department of Labor and Workforce Development, Research and Analysis Section. 6

7 The best available evidence is that the total Alaska economy as measured by the number of jobs is still growing, but at a very slow rate. Source: Alaska Department of Labor and Workforce Development, Research and Analysis Section. 7

8 The most recent job estimates show total employment higher than a year ago. 1.7% Total Wage and Salary Jobs, Over-the-year Percent Change 1.2% Actual 0.7% Estimated 0.2% -0.3% -0.8% Chart provided by Alaska Department of Labor and Workforce Development, Research and Analysis Section. 8

9 Alaska personal income continued to grow in Chart provided by Alaska Department of Labor and Workforce Development, Research and Analysis Section. 9

10 Alaska s housing market is not showing signs of significant weakness.

11 Alaska s housing market is not showing signs of significant weakness.

12 Alaska s visitor industry is doing well. 12

13 Federal job losses have been a significant drag on Alaska s economy in recent years but these job losses appear to be easing. Source: Alaska Department of Labor and Workforce Development, Research and Analysis Section. 13

14 But job losses are occurring in selected economic sectors % Oil and Gas Jobs, Over-the-year Percent Change 10.0% Actual 5.0% Estimated 0.0% -5.0% -10.0% -15.0% Chart provided by Alaska Department of Labor and Workforce Development, Research and Analysis Section. 14
15 Chart provided by Alaska Department of Labor and Workforce Development, Research and Analysis Section.
16 National Oil Industry Employment 600 Oil industry employment in U.S., thousands * Source: AKDOL *January 2016 Chart provided by Alaska Department of Labor and Workforce Development, Research and Analysis Section.

17 Job losses in selected economic sectors % Construction Jobs, Over-the-year Percent Change 8.0% 6.0% Actual 4.0% 2.0% Estimated 0.0% -2.0% -4.0% -6.0% -8.0% Chart provided by Alaska Department of Labor and Workforce Development, Research and Analysis Section. 17

18 The capital budget has been cut very sharply over the past four years. 18
19 State Government Job Losses Growing Mar Apr May June July Aug Sept Oct Nov Dec Jan Feb ,000-1,200-1,200-1,300-1,300-1,300 *Total State Government Employment was 25,200, February 2016 Chart provided by Alaska Department of Labor and Workforce Development, Research and Analysis Section.

20 Job losses in selected economic sectors % State Gvt. Jobs, Over-the-year Percent Change 1.0% Actual 0.0% Estimated* -1.0% -2.0% -3.0% -4.0% -5.0% -6.0% * State government estimates are more reliable than other estimates because the job numbers come directly from state payroll data. Chart provided by Alaska Department of Labor and Workforce Development, Research and Analysis Section. 20

21 We are losing jobs in high-wage sectors of the economy 21
22 Alaska s Population Gains Grew With National Recession--But Now Slowing Alaska s total 2015 population count was 737,624 Total annual population gains Alaska 16,037 11,010 7,493 7,437 5,586 6,649 9,112 8,498 4,
23 23

24 Alaska Department of Labor and Workforce Development economic projections for

25 Alaska Department of Labor and Workforce Development economic projections for
26 Alaska Department of Labor and Workforce Development economic projections for
 with other projections.")
27 Alaska Department of Labor and Workforce Development comparison of their economic projections for 2016 ( ours ) with other projections... 27
28 The Extent Of Job Losses During Alaska s Great Recession Of The 1980s Jobs lost and gained between Alaska Anchorage -15,996-11,286-7% -11% MatSu Fairbanks Juneau Ketchikan Kodiak , % 3% -13% -12% -6% Source: Alaska Department of Labor and Workforce Development, Research and Analysis Section
29 The 1980s and now: What s different? Economy (as measured by jobs) is about 50% larger Older population bringing in much more retirement income Alaska Native Corporations bringing significant income to Alaska Much larger Permanent Fund dividend a stabilizing factor in the economy Visitor industry has grown dramatically Bank lending has been more conservative: people are less overextended in their borrowing Housing markets are much tighter and stronger We have not been experiencing a construction boom 29
30 Alaska housing markets are much stronger now than they were in the 1980s. Anchorage residential building permits issued in Total Anchorage residential building permits issued, ,808 30

31 As Alaska s population has aged, retirement income represents a significantly larger share of Alaska income, and a stabilizing component of the economy. 31
32 ISER s study of Short-Run Economic Impacts of Alaska Fiscal Options The study is posted on ISER s website at 32
33 What we studied, for selected fiscal options... Revenue impacts of taxes and dividend cuts What share would non-residents pay? What share would be offset by lower federal taxes? What would be the relative impacts on different income groups? Short run economic impacts of spending cuts, taxes and dividend cuts. Per hundred million of deficit reduction: What would be the impacts on Alaskans incomes? What would be the impacts on Alaska jobs? Total economic impacts of reducing the deficit What would the total short-run impacts on income and jobs of reducing the deficit by different amounts? Regional economic impacts How would the impacts of different options vary between regions? 33
34 We only studied short-run direct economic impacts of fiscal options. There are many other important potential impacts which we didn t study. A few examples of impacts we didn t study: Economic impacts of reductions in government services Impacts on investment Impacts on infrastructure development & resource industries Impacts on labor markets & population Our fiscal choices will significantly affect Alaska s future We should think about not only their short-term economic impacts but also their longer-term economic and social impacts. 34
35 Of all the options for reducing the deficit, only saving less (and using the money to fund government) would have no short-run economic impacts on the Alaska economy. Options for saving less include: Reducing inflation-proofing transfers to PF principal Adding less to the PF earnings reserve Saving less would not: take any money out of the economy have any short-run impacts on jobs or income But it would reduce: our future investment earnings how much savings we leave for future Alaskans 35

36 From 2010 to 2015, we saved an average of $1.4 billion annually of Permanent Fund realized earnings 36
37 All of the other options for reducing the deficit, including spending cuts, taxes, and dividend cuts, would have significant short-run economic impacts. They would all take significant amounts of money out of the economy. But they would do so in different ways, with different impacts on different Alaskans and different relative impacts on public and private income & jobs. 37
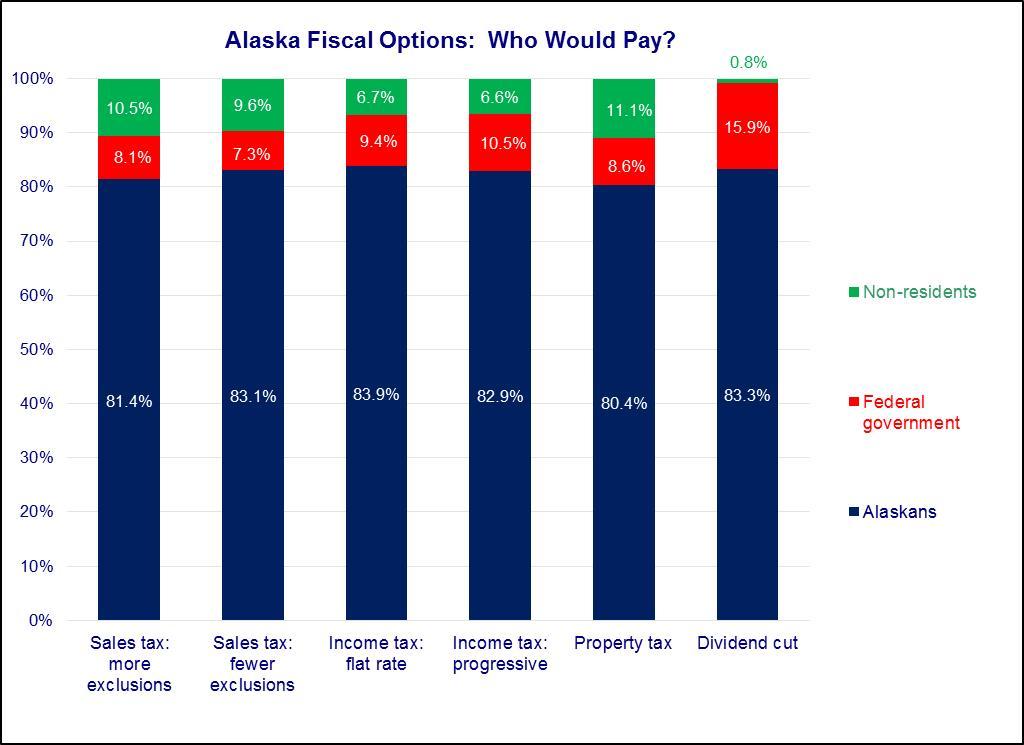
38 38

39 We estimated effects of taxes and dividend cuts for 10 groups of Alaska households, grouped by their per-capita cash income in 2013, from the lowest 10% to the highest 10% 39

40 The three lowest-income groups had average household incomes of less than $45,000. The highest-income group had an average household income of more than $200,
41 How options affect different groups: income reduction per person 41
42 How options affect different groups: percentage income reduction per person 42
43 Short-run economic impacts of spending cuts depend on what is cut What is cut affects the extent to which the cuts directly affect jobs and income of government and contractor workers and the resulting multiplier effects on the economy. What is cut also affects the extent to which the cuts have other short-run impacts on the economy, such as: - Transportation (Marine Highway service, road plowing, etc.) - Resource management (fish catches, mine permitting) You can t generalize about economic impacts of spending cuts. Our estimates illustrate a range of potential impacts. 43

44 Income impacts 44

45 Job impacts 45
46 Fiscal Option Direct economic impacts Who would be most affected Spending cut: workers Reduce gov't jobs & pay Gov't workers Spending cut: broad-based Summary of Fiscal Options & Estimated Impacts per $100 Million of Deficit Reduction Reduce gov't jobs & pay Reduce other gov't purchases Gov't workers Gov't contractors & workers Spending cut: capital Reduce gov't capital spending Construct. ind. & workers Spending cut: pay Reduce gov't employee pay Gov't workers Income tax: progressive Higher income Alaskans Income tax: flat rate Reduce Alaskans Sales tax: more exclusions disposable income Medium & lower income Sales tax: fewer exclusions Alaskans Property tax Dividend cut Reduce Alaskans' income Lower income Alaskans Saving less No short-term impacts Future Alaskans Short-run income impacts ($ millions) Short-run job impacts (FTE jobs) Note: The numbers shown for income and job impacts represent low and high estimates of impacts based on different assumptions about how households and markets would react to changes in disposable income. 46
47 The Permanent Fund re-plumbing proposals would reduce the deficit through a combination of cutting dividends and saving less. Fiscal Option Direct economic impacts Who would be most affected Spending cut: workers Reduce gov't jobs & pay Gov't workers Spending cut: broad-based Summary of Fiscal Options & Estimated Impacts per $100 Million of Deficit Reduction Reduce gov't jobs & pay Reduce other gov't purchases Gov't workers Gov't contractors & workers Spending cut: capital Reduce gov't capital spending Construct. ind. & workers Spending cut: pay Reduce gov't employee pay Gov't workers Income tax: progressive Higher income Alaskans Income tax: flat rate Reduce Alaskans Sales tax: more exclusions disposable income Medium & lower income Sales tax: fewer exclusions Alaskans Property tax Dividend cut Reduce Alaskans' income Lower income Alaskans Saving less No short-term impacts Future Alaskans Short-run income impacts ($ millions) Short-run job impacts (FTE jobs) Note: The numbers shown for income and job impacts represent low and high estimates of impacts based on different assumptions about how households and markets would react to changes in disposable income. 47
48 Examples of Ranges of Estimated Economic Impacts Per $100 Million of Deficit Reduction Resulting from Selected Potential Combinations of Fiscal Options Examples of potential combinations of options Option Spending cut: workers Four options Spending cut: broad-based 50% 50% 50% 33% 33% 33% 25% Spending cut: capital Spending cut: pay Income tax: progressive 50% 50% 50% 33% 33% 33% 25% Income tax: flat rate Sales tax: more exclusions Sales tax: fewer exclusions Property tax Two options Three options Dividend cut 50% 50% 50% 33% 33% 33% 25% Saving less 50% 50% 50% 33% 33% 33% 25% Total income impact (millions of $ of income) Range of estimated impacts Low scenario High scenario Total jobs impact (FTE jobs in Alaska) Low scenario High scenario
49 [Page V-1] Estimated income and job impacts of reducing the deficit by different amounts using different options Estimated Impacts of Reducing the Deficit by Selected Total Amounts Using Different Potential Combinations of Fiscal Options Combinations of fiscal options Estimated impacts of reducing deficit by $100 million Estimated impacts of reducing deficit by $500 million Estimated impacts of reducing deficit by $1.0 billion Estimated impacts of reducing deficit by $1.5 billion Estimated impacts of reducing deficit by $2.0 billion Estimated impacts of reducing deficit by $2.5 billion Estimated impacts of reducing deficit by $3.0 billion Two options Three options Four options Spending cut: broad-based 50% 50% 50% 33% 33% 33% 25% Income tax: progressive 50% 50% 50% 33% 33% 33% 25% Dividend cut 50% 50% 0% 50% 33% 33% 33% 25% Saving less 50% 50% 50% 33% 33% 33% 25% Income: Low scenario Income: High scenario Jobs: Low scenario Jobs: High scenario 1,023 1, Income: Low scenario Income: High scenario Jobs: Low scenario 3,812 3,845 2,754 2,451 1,394 1,361 3,470 2,563 2,541 1,836 2,603 Jobs: High scenario 5,116 5,380 4,196 3,150 2,230 1,966 4,898 3,587 3,411 2,798 3,673 Income: Low scenario 1,108 1,139 1, , Income: High scenario 1,265 1,320 1, , ,005 Jobs: Low scenario 7,623 7,690 5,509 4,902 2,788 2,721 6,940 5,126 5,082 3,673 5,205 Jobs: High scenario 10,232 10,761 8,393 6,300 4,461 3,932 9,795 7,174 6,821 5,595 7,346 Income: Low scenario 1,662 1,709 1, ,759 1,139 1,108 1,271 1,319 Income: High scenario 1,898 1,981 2, ,117 1,035 2,010 1,320 1,265 1,434 1,508 Jobs: Low scenario 11,435 11,534 8,263 7,353 4,182 4,082 10,411 7,690 7,623 5,509 7,808 Jobs: High scenario 15,348 16,141 12,589 9,450 6,691 5,898 14,693 10,761 10,232 8,393 11,019 Income: Low scenario 2,216 2,278 2, ,302 1,240 2,345 1,519 1,477 1,695 1,759 Income: High scenario 2,531 2,641 2,869 1,152 1,489 1,379 2,680 1,761 1,687 1,913 2,010 Jobs: Low scenario 15,246 15,379 11,018 9,804 5,575 5,442 13,881 10,253 10,164 7,345 10,411 Jobs: High scenario 20,464 21,521 16,785 12,600 8,921 7,864 19,590 14,348 13,643 11,190 14,693 Income: Low scenario 2,932 1,898 1,846 2,118 2,199 Income: High scenario 3,350 2,201 2,109 2,391 2,513 Jobs: Low scenario 17,351 12,816 12,705 9,181 13,013 Jobs: High scenario 24,488 17,934 17,053 13,988 18,366 Income: Low scenario 3,518 2,278 2,216 2,542 2,638 Income: High scenario 4,020 2,641 2,531 2,869 3,015 Jobs: Low scenario 20,821 15,379 15,246 11,018 15,616 Jobs: High scenario 29,385 21,521 20,464 16,785 22,039 Note: Units for income impacts are millions of dollars. Units for job impacts are FTE jobs. Table omits combination of options and total deficit reduction which would require reductions of more than $1 billion from any single option. Table calculated by extrapolating from the estimated impacts of reducing the deficit by $100 million shown in Table III-7. 49
50 How big is Alaska s economy? Selected Estimates of Alaska Income and Employment, 2014 Personal income 39,793 Earnings by place of work 30,059 Wages and salaries 20,683 Total full-time and part-time employment 465,130 Wage and salary jobs 367,291 Other jobs 97,839 Income ($ millions) Employment (jobs) Source: Bureau of Economic Analysis, SA30 Economic Profile (updated September 30, 2015), [Page V-2] 50
51 Estimated percentage income impacts of reducing the deficit by different amounts using different options Estimated Income Impacts of Reducing the Deficit by Selected Total Amounts Using Different Potential Combinations of Fiscal Options, Expressed as a Share of Estimated Total Alaska Personal Income in 2014 ($39.8 billion) Combinations of fiscal options $100 million $500 million $1.0 billion $1.5 billion $2.0 billion $2.5 billion $3.0 billion Two options Three options Four options Spending cut: broad-based 50% 50% 50% 33% 33% 33% 25% Income tax: progressive 50% 50% 50% 33% 33% 33% 25% Dividend cut 50% 50% 50% 33% 33% 33% 25% Saving less 50% 50% 50% 33% 33% 33% 25% Income: Low scenario 0.3% 0.3% 0.3% 0.1% 0.2% 0.2% 0.3% 0.2% 0.2% 0.2% 0.2% Income: High scenario 0.3% 0.3% 0.4% 0.1% 0.2% 0.2% 0.3% 0.2% 0.2% 0.2% 0.3% Income: Low scenario 1.4% 1.4% 1.6% 0.6% 0.8% 0.8% 1.5% 1.0% 0.9% 1.1% 1.1% Income: High scenario 1.6% 1.7% 1.8% 0.7% 0.9% 0.9% 1.7% 1.1% 1.1% 1.2% 1.3% Income: Low scenario 2.8% 2.9% 3.2% 1.2% 1.6% 1.6% 2.9% 1.9% 1.9% 2.1% 2.2% Income: High scenario 3.2% 3.3% 3.6% 1.4% 1.9% 1.7% 3.4% 2.2% 2.1% 2.4% 2.5% Income: Low scenario 4.2% 4.3% 4.8% 1.8% 2.5% 2.3% 4.4% 2.9% 2.8% 3.2% 3.3% Income: High scenario 4.8% 5.0% 5.4% 2.2% 2.8% 2.6% 5.1% 3.3% 3.2% 3.6% 3.8% Income: Low scenario 5.6% 5.7% 6.4% 2.5% 3.3% 3.1% 5.9% 3.8% 3.7% 4.3% 4.4% Income: High scenario 6.4% 6.6% 7.2% 2.9% 3.7% 3.5% 6.7% 4.4% 4.2% 4.8% 5.1% Income: Low scenario 7.4% 4.8% 4.6% 5.3% 5.5% Income: High scenario 8.4% 5.5% 5.3% 6.0% 6.3% Income: Low scenario 8.8% 5.7% 5.6% 6.4% 6.6% Income: High scenario 10.1% 6.6% 6.4% 7.2% 7.6% Note: Table omits combination of options and total deficit reduction which would require reductions of more than $1 billion from any single option. 51
52 Estimated percentage job impacts of reducing the deficit by different amounts using different options Estimated Job Impacts of Reducing the Deficit by Selected Total Amounts Using Different Combinations of Fiscal Options, Expressed as a Share of Estimated Total Alaska Full-Time and Part-Time Employment in 2014 (465,000 jobs) Combinations of fiscal options $100 million $500 million $1.0 billion $1.5 billion $2.0 billion $2.5 billion $3.0 billion Two options Three options Four options Spending cut: broad-based 50% 50% 50% 33% 33% 33% 25% Income tax: progressive 50% 50% 50% 33% 0% 33% 33% 25% Dividend cut 50% 50% 50% 33% 33% 33% 25% Saving less 50% 50% 50% 33% 33% 33% 25% Jobs: Low scenario 0.2% 0.2% 0.1% 0.1% 0.1% 0.1% 0.1% 0.1% 0.1% 0.1% 0.1% Jobs: High scenario 0.2% 0.2% 0.2% 0.1% 0.1% 0.1% 0.2% 0.2% 0.1% 0.1% 0.2% Jobs: Low scenario 0.8% 0.8% 0.6% 0.5% 0.3% 0.3% 0.7% 0.6% 0.5% 0.4% 0.6% Jobs: High scenario 1.1% 1.2% 0.9% 0.7% 0.5% 0.4% 1.1% 0.8% 0.7% 0.6% 0.8% Jobs: Low scenario 1.6% 1.7% 1.2% 1.1% 0.6% 0.6% 1.5% 1.1% 1.1% 0.8% 1.1% Jobs: High scenario 2.2% 2.3% 1.8% 1.4% 1.0% 0.8% 2.1% 1.5% 1.5% 1.2% 1.6% Jobs: Low scenario 2.5% 2.5% 1.8% 1.6% 0.9% 0.9% 2.2% 1.7% 1.6% 1.2% 1.7% Jobs: High scenario 3.3% 3.5% 2.7% 2.0% 1.4% 1.3% 3.2% 2.3% 2.2% 1.8% 2.4% Jobs: Low scenario 3.3% 3.3% 2.4% 2.1% 1.2% 1.2% 3.0% 2.2% 2.2% 1.6% 2.2% Jobs: High scenario 4.4% 4.6% 3.6% 2.7% 1.9% 1.7% 4.2% 3.1% 2.9% 2.4% 3.2% Jobs: Low scenario 3.7% 2.8% 2.7% 2.0% 2.8% Jobs: High scenario 5.3% 3.9% 3.7% 3.0% 3.9% Jobs: Low scenario 4.5% 3.3% 3.3% 2.4% 3.4% Jobs: High scenario 6.3% 4.6% 4.4% 3.6% 4.7% Note: Table omits combination of options and total deficit reduction which would require reductions of more than $1 billion from any single option.

53 Income distribution varies for different regions of Alaska [Pages IV-1, IV-2] 53
54 Regional economic impacts of state spending cuts would depend on how important state government jobs and income are in the regional economy. Some regions are much more dependent than others. 54
55 Regional economic impacts of cuts to revenue sharing, K-12 education, and other ways that state spending helps fund local government would depend on how important local government jobs are in the regional economy. Some regions are much more dependent than others. 55
56 Economic implications of how fast we reduce the deficit 56
57 We have lost billions of dollars of oil revenues. We will experience significant economic impacts of adjusting to lower oil revenues. Impacts of spending cuts we ve already made: Impacts of capital budget cuts on construction industry Delayed because capital projects take several years Actual capital spending will decline as money from past large capital budgets runs out Impacts of future adjustments we will have to make Spending cuts Taxes Dividend cuts It s not a question of whether we will face these impacts. It s only a question of when. 57
58 Alaskans are justifiably concerned about the impacts of deficit reduction on an already weakened economy We are already experiencing the impacts of: Oil industry job losses Past state capital budget reductions State government job losses Mining industry downturn Low salmon prices These impacts would be increased by large: Spending cuts New taxes Dividend cuts 58
59 We can reduce the direct short-run economic impacts of reducing the deficit by continuing to draw down our savings. BUT Continued large deficits and draws from our savings would also have significant negative economic impacts. 59

60 Negative economic impacts of continued large deficits... Certain downgrading of Alaska s credit rating and increases in our future borrowing costs 60
61 Negative economic impacts of continued large deficits... Loss of future investment income Deficit and resulting drawdown in investment assets Permanent annual loss of future investment 5% rate of return $1 billion $50 million $2 billion $100 million $3 billion $150 million $4 billion $200 million 61
62 Negative economic impacts of continued large deficits... Potential future insufficiency of cash in Permanent Fund earnings reserve to cover otherwise sustainable payouts of Permanent Fund investment earnings in low-earnings years. 62
63 Negative economic impacts of continued large deficits... Lack of time for new taxes to begin to bring in revenues before we really need the money. 63
64 Negative economic impacts of continued large deficits... Continued and growing UNCERTAINTY about Alaska s fiscal and economic future among Alaskans Alaska businesses Resource industries Public and private employees 64
65 Economic implications of uncertainty Alaska businesses postpone investment Alaskans postpone spending and investment Young Alaskans leave The best employees leave Resource industries invest elsewhere People focus on the negative impacts of what is coming rather than on moving forward 65
66 We face a tradeoff between the short-run negative economic impacts of reducing the deficit and the significant short-run and longer-run economic impacts of not reducing the deficit. 66
67 How can we minimize the economic impacts of adjusting to permanently lower oil revenues? Probably not by fully closing the deficit this year. Certainly not by running another huge deficit this year. 67
68 We will have a smoother economic transition to the reality of lower oil revenues if we Significantly reduce the deficit this year Make real choices about how we will reduce the rest Even if we implement them over several years Reduce uncertainty and build confidence about our economic future 68
69 If the fall in our oil revenues was temporary then it would make sense to run deficits to help support the economy. But the fall in our oil revenues is not temporary. We can t indefinitely support the economy by running deficits. 69
70 Not paying for what we spend this year means that our children will pay for what we spend this year. 70
An Introduction to Alaska Fiscal Facts and Choices
 An Introduction to Alaska Fiscal Facts and Choices Gunnar Knapp Director and Professor of Economics Institute of Social and Economic Research University of Alaska Anchorage Gunnar.Knapp@uaa.alaska.edu
The Most Important Things to Understand About Alaska s Fiscal Situation
 The Most Important Things to Understand About Alaska s Fiscal Situation Gunnar Knapp Director and Professor of Economics Institute of Social and Economic Research University of Alaska Anchorage Gunnar.Knapp@uaa.alaska.edu
Anchorage s Economic Climate And Forecast
 Anchorage s Economic Climate And Forecast Girdwood! January 25th, 2016 Alaska Department of Labor and Workforce Development, Research Section, Neal Fried, Economist Anchorage s Past Trends, A Roadmap
Affordable Care Act Implementation Alert
 CONTENTS > What is the PCORI Fee? What is the purpose of the PCORI fee? > What are the reporting and payment requirements? > How is the PCORI fee calculated? > What is the role of AmeriHealth Administrators?
Anchorage Employment Report
 Third Edition April Anchorage Employment Report CO-SPONSORED BY: TABLE OF CONTENTS EXECUTIVE SUMMARY...2 GOODS PRODUCING JOBS SUMMARY...3 SERVICES PROVIDING JOBS SUMMARY...4 HEALTH CARE SNAPSHOT...4 PROFESSIONAL
State of Oregon Economic Indicators TM
 sponsored by How can I interpret the Oregon Measure of Economic Activity? A reading of zero corresponds to the average growth rate for that particular region. In other words, the measures identify periods
Anchorage Employment Report
 Third Edition 2018 March Anchorage Employment Report CO-SPONSORED BY: TABLE OF CONTENTS EXECUTIVE SUMMARY...2 GOODS PRODUCING JOBS SUMMARY...3 SERVICES PROVIDING JOBS SUMMARY...4 HEALTH CARE SNAPSHOT...4
FOR RELEASE: MONDAY, MARCH 21 AT 4 PM
 Interviews with 1,012 adult Americans conducted by telephone by Opinion Research Corporation on March 18-20, 2011. The margin of sampling error for results based on the total sample is plus or minus 3
Alaska s Fiscal Facts. Presentation to: Alaska Seafood Marketing Institute All Hands on Deck October 21, 2015
 Alaska s Fiscal Facts Presentation to: Alaska Seafood Marketing Institute All Hands on Deck October 21, 2015 McDowell Group Research and consulting since 1972 16 professional staff Offices: Juneau, Anchorage,
NFIB SMALL BUSINESS ECONOMIC TRENDS
 NFIB SMALL BUSINESS ECONOMIC TRENDS William C. Dunkelberg Holly Wade January 19 SMALL BUSINESS OPTIMISM INDEX COMPONENTS Index C omponent Seasonally A djusted Level Change from Last Month Contribution
Common stock prices 1. New York Stock Exchange indexes (Dec. 31,1965=50)2. Transportation. Utility 3. Finance
2. Transportation. Utility 3. Finance") Digitized for FRASER http://fraser.stlouisfed.org/ Federal Reserve Bank of St. Louis 000 97 98 99 I90 9 9 9 9 9 9 97 98 99 970 97 97 ""..".'..'.."... 97 97 97 97 977 978 979 980 98 98 98 98 98 98 987 988
Digitized for FRASER http://fraser.stlouisfed.org/ Federal Reserve Bank of St. Louis 000 97 98 99 I90 9 9 9 9 9 9 97 98 99 970 97 97 ""..".'..'.."... 97 97 97 97 977 978 979 980 98 98 98 98 98 98 987 988
The Effects of State Revenue Options on Alaska Households
 The Effects of State Revenue Options on Alaska Households Institute of Social and Economic Research University of Alaska Anchorage January 27, 2004 The Institute of Social and Economic Research developed
Anchorage Employment Report
 First & Second Edition 2018 February Anchorage Employment Report COSPONSORED BY: TABLE OF CONTENTS EXECUTIVE SUMMARY...2 GOODS PRODUCING JOBS SUMMARY...3 SERVICES PROVIDING JOBS SUMMARY...4 HEALTH CARE
Monthly Labour Force Survey Statistics December 2018
 800 Monthly Labour Force Survey Statistics CALGARY CMA Table 282-0135 Labour force survey estimates (LFS), by census metropolitan area based on 2011 census boundaries, 3-month moving average, seasonally
Monthly Labour Force Survey Statistics November 2018
 800 Monthly Labour Force Survey Statistics CALGARY CMA Table 282-0135 Labour force survey estimates (LFS), by census metropolitan area based on 2011 census boundaries, 3-month moving average, seasonally
Nonfarm jobs slip 1,700 in December; unemployment rate declines to 4.4%
 Lincoln.dyer@ct.gov appears Office of Research Scott D. Jackson, Commissioner FOR IMMEDIATE RELEASE December 2016 Data CT Unemployment Rate = 4.4% US Unemployment Rate = 4.7% Nonfarm jobs slip 1,700 in
Emerging Trends in the Regional Economy
 Emerging Trends in the Regional Economy Alison Felix Economist & Branch Executive Federal Reserve Bank of Kansas City Denver Branch The views expressed are those of the presenter and do not necessarily
 Robert D. Cruz, PhD, Chief Economist Miami-Dade County 305-375-1879 cruzr1@miamidade.gov www.miamidade.gov/economicdevelopment Department of Regulatory and Economic Resources Page 1 Local economic indicators
Nonfarm jobs decline 2,000 in September; unemployment rate falls to 4.6%
 Lincoln.dyer@ct.gov appears Office of Research Scott D. Jackson, Commissioner FOR IMMEDIATE RELEASE September 2017 Data CT Unemployment Rate = 4.6% US Unemployment Rate = 4.2% Nonfarm jobs decline 2,000
T R U S T E D A D V I S O R S. Providing Outstanding Client Service Boston /Cambridge/Newport / Providence / Waltham
 T R U S T E D A D V I S O R S Providing Outstanding Client Service Boston /Cambridge/Newport / Providence / Waltham www.kahnlitwin.com Health Care Reform Overview Applicable Large Employer Determination
Zambia s Economic Outlook
 Zambia s Economic Outlook F R A N C I S C H I P I M O D I R E C T O R E C O N O M I C S B A N K O F Z A M B I A Z A M B I A I N V E S T M E N T C O N F E R E N C E N O V E M B E R 4, 2 0 1 5 L O N D O
Budget Retreat Financial Status. Presented to Mecklenburg Board of County Commissioners February 20, 2014
 Budget Retreat Financial Status Presented to Mecklenburg Board of County Commissioners February 20, 2014 Presentation Topics Economic Indicators Fiscal Year 2013 Operating Results Financial Update Projections
MBA Forecast Commentary Joel Kan
 MBA Forecast Commentary Joel Kan Economy & Labor Markets Strong Enough, First Rate Hike Expected in December MBA Economic and Mortgage Finance Commentary: November 2015 This month s outlook largely mirrors
New Hampshire Medicaid Program Enrollment Forecast SFY Update
 New Hampshire Medicaid Program Enrollment Forecast SFY 2011-2013 Update University of New Hampshire Whittemore School of Business and Economics Ross Gittell, James R Carter Professor Matt Magnusson, M.B.A.
If the Economy s so Bad, Why Is the Unemployment Rate so Low?
 If the Economy s so Bad, Why Is the Unemployment Rate so Low? Testimony to the Joint Economic Committee March 7, 2008 Rebecca M. Blank University of Michigan and Brookings Institution Rebecca Blank is
The Asian Face of the Global Recession
 The Asian Face of the Global Recession C.P. Chandrasekhar & Jayati Ghosh Delegates to the World Economic Forum at Davos this year came despondent and left in despair. Both the discussions and the new evidence
FOR RELEASE: WEDNESDAY, NOVEMBER 17 AT 11:30 AM
 Interviews with 1,014 adult Americans conducted by telephone by Opinion Research Corporation on November 11-14, 2010. The margin of sampling error for results based on the total sample is plus or minus
Commercial Cards & Payments Leo Abruzzese October 2015 New York
 US, China and emerging markets: What s next for the global economy? Commercial Cards & Payments Leo Abruzzese October 2015 New York Overview Key points for 2015-16 Global economy struggling to gain traction
Nonfarm Payroll Employment
 PRESIDENT'S REPORT TO THE BOARD OF DIRECTORS, FEDERAL RESERVE BANK OF BOSTON Current Economic Developments - June 10, 2004 Data released since your last Directors' meeting show the economy continues to
Monetary Policy Tools in an Environment of Low Interest Rates James Bullard
 Monetary Policy Tools in an Environment of Low Interest Rates James Bullard President and CEO CFA Society of St. Louis February 5, 2009 The Economy Today A sharp recession. Declining output during 2008
The Impact of the Recession on Employment-Based Health Coverage
 May 2010 No. 342 The Impact of the Recession on Employment-Based Health Coverage By Paul Fronstin, Employee Benefit Research Institute E X E C U T I V E S U M M A R Y HEALTH COVERAGE AND THE RECESSION:
Fastenal Company Reports 2011 Second Quarter Earnings
 Fastenal Company Reports 2011 Second Quarter Earnings WINONA, Minn., July 12, 2011 (GLOBE NEWSWIRE) -- The Fastenal Company of Winona, MN (Nasdaq:FAST) reported the results of the quarter ended June 30,
May brings largest nonfarm job gain in 2014 (+5,800); unemployment rate unchanged
; unemployment rate unchanged") Office of Research Sharon M. Palmer, Commissioner FOR IMMEDIATE RELEASE May 2014 Data CT Unemployment Rate = 6.9% US Unemployment Rate = 6.3% May brings largest nonfarm job gain in 2014 (+5,800); unemployment
Office of Research Sharon M. Palmer, Commissioner FOR IMMEDIATE RELEASE May 2014 Data CT Unemployment Rate = 6.9% US Unemployment Rate = 6.3% May brings largest nonfarm job gain in 2014 (+5,800); unemployment
The State of Working Florida 2011
 The State of Working Florida 2011 Labor Day, September 5, 2011 By Emily Eisenhauer and Carlos A. Sanchez Contact: Emily Eisenhauer Center for Labor Research and Studies Florida International University
Key Labor Market and Economic Metrics
 Key Labor Market and Economic Metrics May Update Incorporates Data Available on May 27 th, 2016 This reference is the result of a collaboration between the Bureau of Labor Market Information and Strategic
WESTWOOD LUTHERAN CHURCH Summary Financial Statement YEAR TO DATE - February 28, Over(Under) Budget WECC Fund Actual Budget
 Budget WECC Fund Actual Budget") WESTWOOD LUTHERAN CHURCH Summary Financial Statement YEAR TO DATE - February 28, 2018 General Fund Actual A B C D E F WECC Fund Actual Revenue Revenue - Faith Giving 1 $ 213 $ 234 $ (22) - Tuition $ 226
WESTWOOD LUTHERAN CHURCH Summary Financial Statement YEAR TO DATE - February 28, 2018 General Fund Actual A B C D E F WECC Fund Actual Revenue Revenue - Faith Giving 1 $ 213 $ 234 $ (22) - Tuition $ 226
Pay or Play Employer Shared Responsibility Penalties
 Brought to you by Biggs Insurance Services Pay or Play Employer Shared Responsibility Penalties The Affordable Care Act (ACA) requires certain large employers to offer affordable, minimum value health
CREDIT UNION TRENDS REPORT
 CREDIT UNION TRENDS REPORT CUNA Mutual Group Economics May 21 (March 21 Data) Highlights During March, credit unions picked-up 423, in new memberships, and loan and savings balances grew at a.5% and 5.7%
The Great Recession 1-2 Punch of Credit Crisis and Consumer Retrenchment
 Economic Recovery: Wherefore Art Thou? Jon Haveman Chief Economist, BAC Economic Institute October, 211 The Great Recession 1-2 Punch of Credit Crisis and Consumer Retrenchment 6 GDP Growth (SAAR) and
Sitka 2030 Comprehensive Plan. September 6, 2016 Planning Commission Work Session on Sitka s Economy - Presentation by Sheinberg Associates
 Sitka 2030 Comprehensive Plan September 6, 2016 Planning Commission Work Session on Sitka s Economy - Presentation by Sheinberg Associates Sitka Today Sitka 2030 Sitka 2030 Comprehensive Plan www.sitkacomprehensiveplan.com
The Urgent Need for Job Creation
 The Urgent Need for Job Creation John Schmitt and Tessa Conroy July 21 Center for Economic and Policy Research 1611 Connecticut Avenue, NW, Suite 4 Washington, D.C. 29 22-29338 www.cepr.net CEPR The Urgent
Chapter 6. Solution: Austin Electronics. State of Economy Sales Probability
 Chapter 6 Problems 6-1. Austin Electronics expects sales next year to be $900,000 if the economy is strong, $650,000 if the economy is steady, and $375,000 if the economy is weak. The firm believes there
The Health of Jefferson County: 2010 Demographic Update
 The Health of : 2010 Demographic Update BACKGROUND How people live the sociodemographic context of their lives influences their health. People who have lower incomes may not have the resources to meet
2010 Economic Forecast: U.S. and State Conditions
 2010 Economic Forecast: U.S. and State Conditions Russell R. Evans Director and Research Economist Center for Applied Economic Research Oklahoma State University Stillwater russell.evans@okstate.edu http://www.spears.okstate.edu/caer
Robert D. Cruz, PhD, Chief Economist
 Robert D. Cruz, PhD, Chief Economist Office of Economic Development and International Trade Miami-Dade County cruzr1@miamidade.gov / www.miamidade.gov/oedit Office of Economic Development and International
Nonfarm jobs fall by 400 in February; unemployment rate unchanged at 3.8%
 Lincoln.dyer@ct.gov appears Office of Research Kurt Westby, Commissioner FOR IMMEDIATE RELEASE February 2019 Data CT Unemployment Rate = 3.8% US Unemployment Rate = 3.8% Nonfarm jobs fall by 400 in February;
A Regional Assessment of Borough Government Finances And Employment
 A Regional Assessment of Borough Government Finances And Employment Prepared with support from Northrim Bank University of Alaska Strategic Investment Funds GCI By Mouhcine Guettabi, Assistant Professor
State of Ohio Workforce. 2 nd Quarter
 To Strengthen Ohio s Families through the Delivery of Integrated Solutions to Temporary Challenges State of Ohio Workforce 2 nd Quarter 2 0 1 2 Quarterly Report on the State of Ohio s Workforce Reference
Research & Policy Brief Number 4 December 2009
 Institute for Research on Labor and Employment Research & Policy Brief Number 4 December 2009 California Crisis: A Portrait of Unemployed Workers By Lauren D. Appelbaum, Ph.D. Research Director The United
Territory to State Double disasters earthquake and flood Prudhoe Bay oil strike $900 million oil lease sale ANCSA passed Pipeline construction boom
 Territory to State Double disasters earthquake and flood Prudhoe Bay oil strike $900 million oil lease sale ANCSA passed Pipeline construction boom Fisheries slowly recover Crab becomes "king" 80s boom
State of Oregon Economic Indicators TM
 October 218 sponsored by How can I interpret the Oregon Measure of Economic Activity? A reading of zero corresponds to the average growth rate for that particular region. In other words, the measures identify
Leading Economic Indicator Nebraska
 Nebraska Monthly Economic Indicators: August 15, 2014 Prepared by the UNL College of Business Administration, Department of Economics Authors: Dr. Eric Thompson, Dr. William Walstad Graduate Research Assistants:
Population Projections, 2007 to 2030
 Population Projections, 27 to 23 By Eddie Hunsinger, Demographer A look at Alaska s future hat will Alaska s population look like W in 23? Projections by the Alaska Department of Labor and Workforce Development
We are in the midst of a weak and fragile recovery, with unemployment grinding
 THE STATE OF WORKING WISCONSIN THE STATE OF WORKING WISCONSIN UPDATE 2011 1 Update 2011 LOOKING FOR WORK IN WISCONSIN We are in the midst of a weak and fragile recovery, with unemployment grinding on at
Revenue Options for the State of Alaska
 Revenue Options for the State of Alaska Status Update and Presentation to Alaska Municipal League Anchorage, Alaska Pat Pitney, Office of Management and Budget Director Ken Alper, Tax Division Director
CONSTRUCTION ECONOMICS MARKET CONDITIONS IN CONSTRUCTION 2014SPRING
 CONSTRUCTION ECONOMICS MARKET CONDITIONS IN CONSTRUCTION 2014SPRING CONTENTS Summary 5 Construction Starts 9 Construction Spending 13 Jobs / Productivity 35 Producer Price Index 47 Producer Price Index
North American Steel Industry Recent Market Developments, Future Prospects and Key Challenges
 North American Steel Industry Recent Market Developments, Future Prospects and Key Challenges OECD Steel Committee December 1-11, 29 Paris, France * American Iron and Steel Institute (AISI) Steel Manufacturers
Managing market ups and downs. Three tips to help you invest with confidence RETIREMENT PLAN SERVICES
 RETIREMENT PLAN SERVICES Managing market ups and downs Three tips to help you invest with confidence Insurance products issued by: The Lincoln National Life Insurance Company Lincoln Life & Annuity Company
Nationwide Consumer Confidence Index in partnership with TNS
 Consumer Confidence falls further CONSUMER CONFIDENCE CONTINUES TO FALL Confidence levels dropped to 51 in July. Overall consumer confidence is 18% lower than this time last month and 46% lower than a
Inflation Alert: Inflation in Alberta is seriously out of control. In June the Consumer Price Index for Alberta was 6.3% higher than one year ago.
 Inflation Alert: Inflation in Alberta is seriously out of control. In June the Consumer Price Index for Alberta was 6.3% higher than one year ago. See the data and analysis starting on page 6. 1 .Introduction:
Pay or Play Employer Shared Responsibility Penalties
 Brought to you by Olson Insurance Pay or Play Employer Shared Responsibility Penalties The Affordable Care Act (ACA) requires applicable large employers (ALEs) to offer affordable, minimum value health
After the Rate Increase, What Then?
 After the Rate Increase, What Then? Robert Eisenbeis, Ph.D. Vice Chairman & Chief Monetary Economist Bob.Eisenbeis@Cumber.com What the FOMC Did At Dec Meeting The Fed made the first step towards normalization
Housing Health Report Housing authorizations show early indications of economic slowdown
 December 2018 Housing Health Report Housing authorizations show early indications of economic slowdown Following November s blanket declines, new and existing housing activity decreases in December. Single-family
Outlook for the Texas Economy. Luis Bernardo Torres Ruiz, Ph.D. August 26, 2016
 Outlook for the Texas Economy Luis Bernardo Torres Ruiz, Ph.D. August 26, 2016 Research Economist Texas Society of Architects Contents 1. U.S. Economic Outlook 2. Texas Economic Outlook 3. Challenges and
$31,038. $8,500 June 18. June 12
 HISTORIC RETURNS* Growth of $10,000 since July 2003 $35,000 $30,000 $25,000 $31,038 Fund Performance Series C (PERCENT RETURN) SINCE 1YR 3YRS 5YRS 10YRS INCEPTION 6.78% 6.73% 6.77% 8.10% Target Asset Allocation
How Vulnerable Is Alaska s Economy to Reduced Federal Spending?
 How Vulnerable Is Alaska s Economy to Reduced Federal Spending? Note No., July 8 By Scott Goldsmith, Professor of Economics About a third of all jobs in Alaska can be traced to federal spending here and
Nonfarm jobs climb 6,700 in May; unemployment rate steady at 4.9%
 Lincoln.dyer@ct.gov appears Office of Research Scott D. Jackson, Commissioner FOR IMMEDIATE RELEASE May 2017 Data CT Unemployment Rate = 4.9% US Unemployment Rate = 4.3% Nonfarm jobs climb 6,700 in May;
ALASKA S ECONOMY. A bright future, but are we prepared? Mike Navarre, Commissioner Department of Commerce, Community and Economic Development
 ALASKA S ECONOMY A bright future, but are we prepared? Mike Navarre, Commissioner Department of Commerce, Community and Economic Development Our future is bright 2 What s happening in our economy? Does
Economic Indicators December 2017
 Economic Indicators December 2017 General Economy GDP % Change U.S. GDP Growth First two consecutive quarters over 3% in 3 years 6.0% 4.0% 2.0% 0.0% -2.0% -4.0% -6.0% Last 3 quarters: 3Q17: 3.2% 2Q17:
LABOR SITUATION Office of Research
 Sharon Palmer Commissioner LABOR SITUATION Office of Research FOR IMMEDIATE RELEASE May 2013 Data CT Unemployment Rate = 8.0% US Unemployment Rate = 7.6% Nonfarm jobs rise 1,000 in May but the unemployment
City of Modesto Economic Indicators December 2014 Edition
 City of Modesto Economic Indicators December 2014 Edition Steve Christensen City of Modesto Economic Outlook: City of Modesto The City of Modesto continues to slowly recover from the Great Recession. Some
Economic Indicators For Manufacturing Executives
 Economic Indicators For Manufacturing Executives Valuable Data for a Complex World Presented by: Cliff Waldman Chief Economist, MAPI Foundation cwaldman@mapi.net Today s Presentation The Value of Economic
Russia: Macro Outlook for 2019
 October 2018 Russia: Macro Outlook for 2019 Natalia Orlova Head of Alfa Bank Macro Insights +7 495 795 36 77 norlova@alfabank.ru Egypt Saudi Arabia Brazil S. Africa UAE Iraq China Japan US Mexico UK Russia
The Transitioning Massachusetts Economy
 The Transitioning Massachusetts Economy Alan Clayton-Matthews School of Public Policy and Urban Affairs Northeastern University February 4, 2011 MassEcon Members Meeting Quarterly Growth at Annual Rates
Nonfarm jobs grow by 1,500 in October; unemployment rate unchanged at 4.2%
 Lincoln.dyer@ct.gov appears Office of Research Kurt Westby, Commissioner FOR IMMEDIATE RELEASE October 2018 Data CT Unemployment Rate = 4.2% US Unemployment Rate = 3.7% Nonfarm jobs grow by 1,500 in October;
AFFORDABLE CARE ACT EMPLOYER SHARED RESPONSIBILITY PROVISION PLAY OR PAY
 AFFORDABLE CARE ACT EMPLOYER SHARED RESPONSIBILITY PROVISION PLAY OR PAY The Affordable Care Act s Employer Shared Responsibility (ESR) provision often called the Employer Mandate or Play or Pay requires
National Economic Conditions. Cheyenne AIA Meeting February 25th, 2011 Rob Godby
 National Economic Conditions Cheyenne AIA Meeting February 25th, 2011 Rob Godby Percent Change Recovery is Technically Underway 8 Quarter-Quarter Growth in Real GDP 6 4 2 0-2 -4-6 -8 I II III IV I II III
Nonfarm jobs increase by 6,100 in June; unemployment rate at 4.4%
 Lincoln.dyer@ct.gov appears Office of Research Kurt Westby, Commissioner FOR IMMEDIATE RELEASE June 2018 Data CT Unemployment Rate = 4.4% US Unemployment Rate = 4.0% Nonfarm jobs increase by 6,100 in June;
Construction Spending, Labor and Materials Outlook
 Construction Spending, Labor and Materials Outlook AGC Nebraska Building Chapter Kearney, January 23, 2018 Ken Simonson Chief Economist, AGC of America simonsonk@agc.org AGC members expectations for 2018
Growth. Total non-farm Positive Nation , ,008,000
 Employment May 2007 Jun 2007 Growth Number of Growth Last 12 months Number of Jobs Total non-farm June 2007 employment Rate % Jobs Rate % Positive Nation +0.10 +132,000 +1.48 +2,008,000 RMW* +0.11 +21,300-0.03-6,400
U.S. and Regional Economic Outlook
 U.S. and Regional Economic Outlook Chad Wilkerson Vice President, Economist, and Oklahoma City Branch Executive Federal Reserve Bank of Kansas City www.kansascityfed.org/oklahomacity Overview of the Federal
New Sustainable Alaska Plan FY2017 Budget Overview. December 14, 2015 Office of Management and Budget
 New Sustainable Alaska Plan FY2017 Budget Overview December 14, 2015 Office of Management and Budget 1 Alaska s Fiscal Challenge Federal Funds $3.3 billion (27%) Unrestricted General Fund Gap $3.4 billion
$1.5 Billion A Year and Growing: Economic Contribution of Older Alaskans By Scott Goldsmith and Jane Angvik
 $1.5 Billion A Year and Growing: Economic Contribution of Older ns By Scott Goldsmith and Jane Angvik September 2006 UA Research Summary No. 7 Institute of Social and Economic Research University of Anchorage
NATIONAL SUMMARY OF FIRST-TIME CLAIMANTS FOR UI
 2013 JAN 5 553,348 553,348 372,000 372,000 92,383,961 93,647,000 12 555,708 1,109,056 335,000 707,000 92,939,669 93,982,000 19 437,025 1,546,081 330,000 1,037,000 93,376,694 94,312,000 26 369,480 1,915,561
Highlights. GDP growth rebounded somewhat in Q3, but business spending weakened
 OSU Economic Outlook Conference December, Chad Wilkerson Oklahoma City Branch Executive and Economist Federal Reserve Bank of Kansas City www.kansascityfed.org/oklahomacity Highlights U.S. economic growth
IN THIS ISSUE OCTOBER ISSUE ANCHORAGE EMPLOYMENT REPORT SPONSORED BY. A September jobs update. Anchorage housing market numbers
 ANCHORAGE EMPLOYMENT REPORT OCTOBER ISSUE IN THIS ISSUE A September jobs update Anchorage housing market numbers The most in-demand jobs in Anchorage SPONSORED BY 1 THANK YOU. Thank you to our sponsors
Anchorage Employment Report
 First Edition 2017 February Anchorage Employment Report CO-SPONSORED BY: TABLE OF CONTENTS EXECUTIVE SUMMARY...2 GOODS PRODUCING JOBS SUMMARY...3 SERVICES PROVIDING JOBS SUMMARY...5 HEALTH CARE SNAPSHOT...5
Nonfarm jobs fall by 500 in September; unemployment rate falls to 4.2%
 Lincoln.dyer@ct.gov appears Office of Research Kurt Westby, Commissioner FOR IMMEDIATE RELEASE September 2018 Data CT Unemployment Rate = 4.2% US Unemployment Rate = 3.7% Nonfarm jobs fall by 500 in September;
What is Monetary Policy?
 What is Monetary Policy? Monetary stability means stable prices and confidence in the currency. Stable prices are defined by the Government's inflation target, which the Bank seeks to meet through the
2013 San Diego Economic Outlook. Marney Cox Chief Economist San Diego Association of Governments November 15, 2012
 2013 San Diego Economic Outlook Marney Cox Chief Economist San Diego Association of Governments November 15, 2012 The Problem Gross Domestic Product Trillion$ Annual Gap Potential GDP Actual GDP 1990-2012
Manufacturing Technology Orders Show Continued Strength in 2018
 Contact: Penny Brown, AMT, 703-827-5275 pbrown@amtonline.org For Release: April 9th, 2018 Manufacturing Technology Orders Show Continued Strength in 2018 U.S. manufacturing technology orders for the first
CBER Indexes for Nevada and Southern Nevada
 CBER Indexes for Nevada and Southern Nevada Published June 23, 2017 Stephen M. Miller, PhD, Director Nicolas Prada, Graduate Research Assistant Summary of CBER s Nevada Indexes Coincident Index (March)
MACRO Report: Review of Wyoming s Economy
 MACRO Report: Review of Wyoming s Economy Economic Update as of December 31, 2017 The MACRO Report is a quarterly publication comprised of charts focusing on energy, employment, state revenues, and other
Issue Brief. Salary Reduction Plans and Individual Saving for Retirement EBRI EMPLOYEE BENEFIT RESEARCH INSTITUTE
 November 1994 Jan. Feb. Salary Reduction Plans and Individual Saving for Retirement Mar. Apr. May Jun. Jul. Aug. EBRI EMPLOYEE BENEFIT RESEARCH INSTITUTE This Issue Brief explores the issues of salary
HEALTH INSURANCE INFORMATION REPORTING: Forms 1094 and 1095
 HEALTH INSURANCE INFORMATION REPORTING: Forms 1094 and 1095 Information is reported to employees and the IRS information is used to determine if EMPLOYEE is subject to penalties Employer plan information
Southeast Alaska Resiliency Mapping Weatherizing for the Economic Storm
 Southeast Alaska Resiliency Mapping Weatherizing for the Economic Storm At Southeast Conference s March 2016 Mid-Session Summit, audience members participated in a resiliency mapping exercise. The purpose
Economic Outlook. Cathy E. Minehan President and CEO Federal Reserve Bank of Boston. Presented to Regional and Community Bankers June 7, 2005
 Economic Outlook Cathy E. Minehan President and CEO Federal Reserve Bank of Boston Presented to Regional and Community Bankers June 7, 5 Overview of the US Economy Over the near-term, the expansion appears
Alaska Superintendents Association (ASA) Alaska Association of School Business Officials (ALASBO) February 21, 2016
 Alaska Association of School Business Officials (ALASBO) February 21, 2016") Alaska Superintendents Association (ASA) Alaska Association of School Business Officials (ALASBO) February 21, 2016 Randall J Hoffbeck, Commissioner Department of Revenue 2 Fiscal Challenge Federal Funds
Alaska Superintendents Association (ASA) Alaska Association of School Business Officials (ALASBO) February 21, 2016 Randall J Hoffbeck, Commissioner Department of Revenue 2 Fiscal Challenge Federal Funds
CBER Economic Indexes for Nevada and Southern Nevada
 CBER Economic Indexes for Nevada and Southern Nevada Published December 19, 2017 Stephen M. Miller, PhD, Director Nicolas Prada, M.A., Graduate Research Assistant Summary of CBER s Nevada Indexes Coincident
Data current as of: April 4, % 10.0% 8.0% 6.0% 4.0% 2.0% 250, , , ,000 50, , , , , ,000
 Forecast current as of: January 213 Economic Indicators U.S. unemployment decreased to 7.7% in February from 7.9% last month, as nonfarm payroll employment increased by 236,. In the previous 3 months,