A Regional Assessment of Borough Government Finances And Employment
|
|
|
- Beatrice Harris
- 6 years ago
- Views:
Transcription

1 A Regional Assessment of Borough Government Finances And Employment Prepared with support from Northrim Bank University of Alaska Strategic Investment Funds GCI By Mouhcine Guettabi, Assistant Professor of Economics, Institute of Social and Economic Research University of Alaska Anchorage 3211 Providence Drive Anchorage, Alaska June 2017 All ISER publications are solely the work of the individual authors. This report and its findings should be attributed to the authors, not to ISER, the University of Alaska Anchorage, or the research sponsors. Random Reamey provided valuable research help.
2 Introduction Alaska s state budget revenues declined by more than 90% from 2012 to 2016, mainly due to a sharp drop in oil prices: oil revenues have paid for most state government operations since the 1980s. This loss of so much revenue has led to a shortfall of billions of dollars in the state budget and a sluggish economy. The health of a state s tax revenues is critical to its economic growth and ability to finance public services. Considerable attention has been paid to the state s fiscal woes, which are still ongoing. But the state also provides considerable support to Alaska s local governments and there has been little analysis of how the decline of state revenues might affect local governments. This analysis reports how much Alaska s 19 borough governments rely on state aid individually and as a group and considers how vulnerable they are to cuts in state aid as time goes on. Alaska also has city governments, both within and outside organized boroughs, but here we look only at borough governments which are essentially regional governments that, unlike cities, all have the same mandatory powers. We want to emphasize that our figures are estimates; boroughs report their revenues quite differently, and sometimes in ways that make it nearly impossible to identify allocations from the state. Alaska provides three main kinds of aid to local governments: aid for general government operating expenses (revenue sharing), grants for public works projects, and aid for schools. It has mostly relied on its oil wealth to fund that aid to local governments. Revenue sharing helps ensure that all areas of the state can pay for basic public services and have reasonably equitable and stable local tax rates. Aid to schools is a major part of the state s budget, and it pays for a large share of school costs. State grants for local capital projects can vary sharply by year. In the years when oil prices were high much of the time between 2008 and 2012 those grants were large. Since then, the state capital budget has shrunk to a small fraction of what it was a few years back. Executive Summary Below we first summarize the big picture of findings, and then report more details. What Are the Main Findings? Boroughs depend much more on state dollars now than they did 10 years ago the share of borough revenues coming from the state more than doubled between 2005 and If borough governments had to replace the state dollars they received in 2015 with local tax dollars, residents of different boroughs would have to pay anywhere from $250 to nearly $5,000 per person in additional taxes. While the state budget has declined precipitously, local government revenues have remained stable so far. In fact, in most places they have continued to grow which is almost certainly temporary. That stability can t last, because the boroughs depend so much on state revenues so it s only a matter of time before the state s fiscal crisis starts affecting the fiscal health of boroughs. Most of the variation in borough revenues from year to year results from changes in how much state money they receive. Among individual boroughs, the amount of variation in their revenues that can be explained by dollars coming from the state runs from almost zero to a high of 94%. Across boroughs, local government jobs and wages make up much different shares of total employment and wages. Local government jobs make up anywhere from 8% to 10% of all jobs in the larger urban 2

3 areas but as much as 60% in more remote places. Wages from local government jobs are anywhere from 11% to 78% of all wages among individual boroughs. What Do Boroughs Look Like? Map S-1 and Table S-1 provide the big picture of where organized boroughs are in Alaska, how many residents they have, and how many city government lie within and outside boroughs. The organized boroughs are very different in their land areas and populations. Anchorage, with a population of about 300,000, covers around 2,000 square miles in Southcentral Alaska; the North Slope Borough, with about 10,000 residents, covers nearly 95,000 square miles. Skagway, in Southeast Alaska, is the smallest borough in both size and population, with just over 1,000 residents and an area of about 440 square miles. Large areas of western and interior Alaska have no organized boroughs the areas in white on the map and are known collectively as the unorganized borough. There are several types of boroughs, depending on how they are organized. Four have unified city and borough governments; most but not all the others have city governments within their boundaries. Nearly 100 city governments are in areas without borough governments. A number of city governments inside and outside boroughs levy their own taxes. 3
.")
4 Where Did Boroughs Get Their Revenues in 2015? The average share of revenues boroughs got from the state in 2015 was 28%. On average they raised 52% of their revenues from local taxes, and the remaining 20% came from federal dollars and miscellaneous other local fees (top pie, Figure S-1). Taxes on local property made up 60% of all taxes boroughs collected in 2015, and taxes they collected on oil and gas property made up another 27%. Sales taxes accounted for 7% of borough taxes, and the other 6% came from other types of taxes, including bed, tobacco, raw fish, and alcohol taxes. Not all boroughs collect all types of taxes; 13 have property taxes, 15 have bed taxes, 9 have sales taxes; 5 have tobacco taxes; and 2 have alcohol taxes. The size of local tax bases varies sharply across boroughs. Anchorage property taxes accounted for close to 60% of all local property taxes in 2015, and the North Slope Borough collected more than 90% of taxes on oil and gas property. 4

5 How Has Borough Dependence on State Dollars Changed Over Time? Boroughs depended much more on state revenues in 2015 than in Figure S-2 shows that across boroughs, the percentage of revenues from the state fell from 2000 through 2004 before the spike in oil prices and then more than doubled, from about 12% in 2005 to 28% in Some boroughs depend much more on state dollars than others do. On average during the period from 2000 through 2015, the share of revenues from the state varied from as little as 4% in Anchorage which has a far bigger local tax base than any other borough to more than 35% in several boroughs with smaller tax bases. How Much Variation in Borough Revenues Can be Explained by Changes in State Dollars? Over the past 15 years, overall revenues in individual boroughs have fluctuated significantly from year to year and so have state revenues going to boroughs. We wanted to examine how much of that fluctuation in overall borough revenues can be explained by changes in the amount of state revenue they receive. Other factors for instance, changes in the price of fish or numbers of tourists or federal dollars can also affect how much revenue boroughs collect. We specify simple parsimonious regressions (explained later in the report) that allow us to estimate how much of the revenue variation in individual boroughs from was likely due to changes in state revenues. Figure S-4 shows the results. This is important, because it reminds us that any future declines in state dollars going to boroughs would be much harder on some than on others. 5

6 Changes in state revenues explain more than 90% of the variation in overall revenues in the Bristol Bay, Mat-Su, and Northwest Arctic Boroughs. By contrast, changes in state revenues account for less than 20% of the fluctuation in overall revenues in Anchorage and the Ketchikan Gateway Borough. In other boroughs, changes in state revenues seem to be responsible for anywhere from about 25% to 87% of the variation in overall borough revenues. How Important are Local Government Jobs and Wages in Boroughs? The percentage of total borough jobs that are in local government and the share of borough wages that comes from those jobs is another way of looking at how vulnerable individual borough economies might be, if state dollars that help support those jobs decline. Local employment includes not only borough employees, but also those who work for city governments or school districts in the boroughs. Local government jobs made up anywhere from 8% to 10% of all jobs in the larger urban areas Anchorage, Mat-Su, Fairbanks in 2015, but as much as 40% 60% in more remote places, including the Lake and Peninsula Borough, where private-sector jobs are often scarce. Wages from local government jobs make up from 11% to 78% 1 of all wages among the boroughs again, the smaller shares are in areas with more jobs. 1 These calculations used employment by place of residence which is smaller than employment by place of work. It has the advantage of focusing the analysis on people who work and reside in the communities we analyze. 6

7 How Much Would It Cost Boroughs To Replace State Dollars? Table S-2 looks at the importance of state dollars to boroughs by estimating how much the boroughs would have to collect in additional taxes, if there were no state aid at all. We re not predicting that the state will eliminate aid the state constitution requires the state to provide for public education. But the estimates do clearly illustrate how critical state dollars are to boroughs and to borough taxpayers. In Anchorage, where nearly half the state population lives, replacing dollars the municipality got in 2015 would require every resident about 300,000 to pay an additional $250 in local taxes. In the other larger boroughs, additional tax bills would be from about $300 to $1,000 more person depending on the level of state aid relative to the size of the population. In smaller boroughs, with smaller populations, residents would be facing additional tax bills of several thousand dollars per person again, depending on the size of state aid relative to the population. Replacing state aid it received in 2015, Bristol Bay would need to collect nearly $5,000 more in taxes from every resident. 7

8 8
9 A REGIONAL ASSESSMENT OF BOROUGH GOVERNMENT FINANCES AND EMPLOYMENT Background In this analysis we look only at finances of borough governments, but before we discuss our study methods and findings, here we describe Alaska s municipal government system. Alaska has two types of municipal government: organized cities and organized boroughs. 2 Cities A city government is a municipal corporation and political subdivision of the State of Alaska. City governments are subject to the limitation of community doctrine. (See Mobil Oil Corp. v. Local Boundary Commission, 518 P.2d 92, 100 (Alaska 1974).) The doctrine requires the area taken into the boundaries of a city to be urban or semi-urban. Organized Boroughs Like a city, an organized borough in Alaska is a municipal corporation and political subdivision of the State of Alaska. However, organized boroughs are regional governments much larger than cities. The state constitution requires the state be divided into boroughs, either organized or unorganized. A borough is supposed to consist of an area and population that has common interests. Alaska has 19 organized boroughs and a single unorganized borough consisting of all the areas outside organized boroughs. All organized boroughs have three mandatory powers: education, planning and land use regulation, and property assessment and taxation. What Is the Difference Between a City and a Borough? According to the Alaska Department of Commerce, a city generally exercises its powers within an established boundary that normally encompasses a single community, while a borough provides services and exercises power regionally. Under the state's constitution, a city is also part of the borough in which it is located. An organized borough may provide services on three levels. These are: areawide (throughout the borough), non-areawide (that part of the borough outside cities), and service areas (size and make-up vary). A borough also has the flexibility and capacity to provide services at the community level, typically through the creation of service areas. (State Constitution, Article X, Section 5) What Kinds of Taxes Do the Boroughs Impose and How Important are They? 3 Table 1 describes the taxes each Alaska borough 4 levied in 2015 and how much they collected. Those include property, sales, bed, raw fish, car rental, and alcohol taxes. Our goal in this table is to show the variety of and amounts of revenues each borough receives from taxes. This is just a partial picture of overall borough revenues, because it omits money they receive from investments, the federal government, and the state. 5 It s important to start out with the internal sources of revenues these boroughs rely on from 2 Definitions of cities and borough are from the Alaska Department of commerce: pdf 3 We define internal sources as the taxes collected by the boroughs. They exclude investment income, fees, and other revenues. 4 These sources exclude money coming from the state or federal government. 5 We address the share of money coming from the state later in the text. 9
10 year to year, given that they have more control over them and are typically more stable than external revenue sources. Aleutians East Borough had a population of 3,047 in 2015 and only one internal source of revenues a fish tax that generated $3,998,104. That amounted to 35% of overall borough revenues. Bristol Bay has a bed tax, a personal and real property tax, and an alcohol tax, which generated 52% of its total 2015 revenues. Juneau has a tobacco tax, a bed tax, a sales tax, a real and personal property tax, and an alcohol tax, bringing in 63% of its overall 2015 revenues. Sitka has a tobacco tax, a bed tax, a sales tax that varies by season, a real and personal property tax, and a raw fix tax. In total, 39% of all Sitka s 2015 revenues come from those taxes. Wrangell has a bed tax, a sales tax, and a real property tax, accounting for 40% of all 2015 revenues. Yakutat has a bed tax, a sales tax, a property tax, and a car rental tax, bringing in about 37% for all the borough s revenues. Denali has only a bed tax, bringing in 71% of all its revenues. Fairbanks has a tobacco tax, a bed tax, a real property tax, and an alcohol tax. These sources made up 70% of all revenue for the borough in Haines has a bed tax, a sales tax, and a real property tax. These three taxes accounted for 50% of all the borough s revenues in Kenai Peninsula has a sales tax, and a real and a personal property tax. These taxes made up 77% of all the borough s 2015 revenues. Ketchikan Gateway has a bed tax, a sales tax, and a real property tax. These three taxes were responsible for 49% of the borough s 2015 revenues. Kodiak has a bed tax, a real and property tax, a raw fish tax, and a car rental tax. These generated about 54% of the borough s 2015 revenues. The Lake and Peninsula borough has a bed tax and raw fish tax, making up 28% of total borough revenues in The Mat-Su borough has a tobacco tax, a bed tax, and a real and a personal property tax, which generated half its 2015 revenues. The Northwest Arctic imposes no taxes, but does collect payment in lieu of taxes form the operators of the Red Dog zinc mine. Anchorage has a tobacco tax, a bed tax, a real and property tax, and a car rental tax, which brought in 69% of its 2015 revenues. The North Slope borough collects 82% of its local revenues from taxes on oil and gas property. Skagway has a bed tax, a sales tax that varies by season and a property tax, which generated 53% of its 2015 revenues. Petersburg has a bed tax, a sales tax, and a property tax, which brought in 46% of its 2016 revenues. Overall, only two boroughs have alcohol taxes, five have tobacco taxes, fifteen have bed taxes, nine have sales tax, and thirteen have real property tax. The bed tax, and car rental tax are more likely to be borne by non-residents and therefore do not add to the tax burden to the year-round residents. Property taxes and sales taxes on the other hand do represent a reduction in income for the borough residents. 10
11 Table 1: Tax imposed by borough and their associated revenues (2015) 6 Borough 78 Tobacco Tax Bed Tax Sales Tax Revenue Rate Wholesale Revenue Rate Revenue Rate Population Rate(Mills) Anchorage 21,926,133 55% 24,936,211 12% 398, Aleutians East ,047 - Bristol Bay $96,991 10% Juneau $1,845,856 $3/pack 45% $1,062,249 7% $44,210,114 5% 33, Sitka $735,594 $1.231/cig 45% $411,916 6% $9,471,481 5% Oct - Mar 6% Apr - Sep 8, Skagway $154,696 8% 7,067,794 3% Oct-March 5% April- Sept 1,039 8 mills Wrangell $44,502 6% $2,681,436 7% 2, Yakutat $122,562 8% $986,253 5% Denali $3,318,321 7% - - 1,781 - Fairbanks North Star $1,470,899 8% - $1,746,676 8% , Haines $109,808 4% $2,805, % 2, Kenai Peninsula $30,040,682 3% 57, Ketchikan Gateway $50,591 6% $8,483, % 13, Kodiak Island $101,595 5% , Lake and Peninsula $203,579 6% - - 1,668 - Matsu $7,548, % - $1,117,249 8% , Northwest Arctic ,889 - Petersburg $61,530 4% 3,090, % North Slope , An excellent resource from which we draw most of our information can be found here: 8 We obtain information on the presence of real and property tax from : AlaskaTaxableSupplement.pdf 9 While the Kodiak Island Borough does not have a sales tax the City of Kodiak does have one. 11
12 Borough Property Tax Property Tax Revenue Raw Fish Tax Car Rental Tax Alcohol Tax Real Personal Local Oil and Gas Revenue Rate Revenue Rate Revenue Rate Anchorage Yes Yes 509,671,675 5,589,282 5,637,102 8% Aleutians East No No - - 3,998,104 2% Bristol Bay Yes Yes $4,196,650 - $2,412,396 3% Juneau Yes Yes $47,205, $1,062,249 3% Sitka Yes Yes $6,194,986 - $127,020 10$/fishbox Skagway Yes $1,812,889 Wrangell Yes No $1,703, Yakutat Yes No $364,617-1% $28,689 $37,588 8% - - Denali No No Fairbanks North Star Yes No $95,169,571 $11,971, $998,195 5% Haines Yes No $2,825, Kenai Yes Yes $50,520,180 $11,558, Ketchikan Gateway Yes No $8,427, Kodiak Island Yes Yes $14,397,697 - $1,550, % Lake and Peninsula No No - - $1,655,163 2% Matsu Yes Yes $ 119,079,479 $189, Northwest Arctic No No Petersburg Yes $ 3,144,058 North Slope Yes Yes $12,777,163 $373,349, In Table 2, we show total borough revenues in 2015, along with the amounts derived from broad-based and transient taxes. 12
13 Table 2: Share of revenues derived from internal sources in 2015 Internal sources Total revenues Share from internal sources Anchorage 567,760, ,266,590 69% Aleutians East 3,998,104 11,441,970 35% Bristol Bay 6,706,037 12,981,345 52% Borough of Juneau 95,386, ,290,557 63% Borough of Sitka 16,940,997 42,939,071 39% Borough of Skagway 9,041,379 16,881,249 53% Borough of Wrangell 4,429,557 10,959,208 40% Borough of Yakutat 1,511,020 4,089,189 37% Denali 3,318,321 4,688,173 71% Fairbanks North Star 111,356, ,657,292 70% Haines 5,740,492 11,412,805 50% Kenai Peninsula 92,119, ,905,916 77% Ketchikan Gateway 16,961,551 34,463,118 49% Kodiak Island 16,049,998 29,615,703 54% Lake and Peninsula 1,858,742 6,729,323 28% Matsu 127,935, ,828,556 50% Northwest Arctic 9,301,954 35,012,972 26% Petersburg 6,295,938 13,879,193 46% North Slope 386,137, ,133,079 82% How does Dependence on State Money Differ Across Boroughs? As we explained earlier, all boroughs also get part of their revenues from the state government. There are, however, considerable differences in how much each depends on that state money. Table 3 shows the average share each borough received from the state between 2000 and The boroughs with the lowest average share across those years were Anchorage, Kodiak, and the Mat-Su. Haines, Northwest Arctic 10, and Lake and Pen had the highest average shares. Another point the table shows is the large differences between the minimum and maximum state revenues boroughs received during that period. It is, however, important to be cautious in making these comparisons across boroughs, because the definitions of money coming from the state are not consistent across places. Some boroughs have considerable dollars classified as intergovernmental, without specifying whether they are state or federal (see appendix). 13
14 Table 3: Average borough revenues and amounts received from the state between 2000 and 2015 Borough 11 Average State Revenues Revenues State Revenues Minimum Maximum Average Share of Revenues Coming From State Anchorage 630,203,358 26,260,435 12,075,621 74,331, % Aleutians East Borough $13,632,996 $3,667,517 $1,877,670 $6,910, % Borough of Juneau $113,066,593 $15,449,555 $5,646,628 $36,574, % Bristol Bay Borough $7,907,776 $2,441,132 $996,056 $4,323, % Borough of Sitka $29,599,741 $5,445,953 $1,855,173 $15,088, % Borough of Wrangell $10,130,885 $1,979,182 $512,386 $4,513, % Borough of Yakutat $3,724,866 $847,846 $166,784 $2,243, % Denali Borough $3,454,797 $597,296 $128,137 $1,541, % Fairbanks North Star Borough $126,430,890 $18,403,737 $3,164,217 $33,271, % Haines Borough $9,754,010 $3,776,856 $913,279 $6,818, % Kenai Peninsula Borough $92,346,094 $12,526,042 $4,032,895 $25,565, % Ketchikan Gateway Borough $28,474,204 $2,010,568 $431,992 $4,154, % Kodiak Island Borough $23,114,521 $5,423,061 $2,086,628 $12,938, % Lake and Peninsula Borough $5,089,425 $1,897,743 $828,064 $3,875, % Matanuska-Susitna Borough $145,982,605 $16,564,326 $7,504,693 $33,277, % North Slope Borough 341,492, Northwest Arctic Borough $19,215,264 $7,318,801 $319,643 $18,724, % Skagway 11,603, Petersburg Borough 11 As in a few of the other tables below, we are unable to separate state revenues for the North Slope, Skagway, and Petersburg, as all three combine federal/state dollars under a category classified as intergovernmental. 14
15 How Has the Importance of State Revenues Changed Over Time? To further explore borough dependence on state revenues, Table 4 looks at the yearly shares of revenue coming from the state for each borough from 2000 to It shows those shares are very different across boroughs over that entire period, but also that in general the state share of revenues declined steadily from 2000 to 2004 in most boroughs, only to rebound and then continue increasing in later years. Figure 1 groups all the boroughs and shows that the average share of revenues coming from the state across boroughs bottomed out at 12% in 2004 and was at 28% by This level of reliance on state revenues is much higher than what it was in As we pointed out earlier, the sharp decline in the state s revenues in the past few years means that the amount of money flowing to these areas will more than likely decline in the next few years. This, in essence, tells us that the boroughs will either need to replace a portion of these revenues through taxes, or reduce the services they provide their citizens. 15
16 Table 4: Share of borough revenues coming from the state by year Borough Anchorage 5.66% 6.82% 7.59% 4.74% 2.54% 3.03% 2.64% 2.73% 2.74% 4.64% 3.21% 3.00% 3.53% 3.28% 3.08% 9.10% Aleutians East Borough 41.17% 36.96% 21.07% 22.80% 18.19% 10.63% 10.90% 22.41% 30.57% 40.40% 48.47% 23.29% 28.99% 32.72% 27.48% 33.17% Borough of Juneau 10.67% 7.04% 7.57% 8.86% 6.73% 6.55% 7.94% 10.85% 13.14% 17.10% 17.65% 15.39% 15.91% 16.40% 17.17% 24.02% Bristol Bay Borough 30.35% 35.74% 28.73% 26.21% 21.63% 23.64% 22.44% 34.38% 35.24% 32.45% 29.89% 29.39% 35.74% 31.29% 30.63% 33.31% Borough of Sitka 9.82% 10.77% 14.11% 14.33% 8.19% 10.68% 11.45% 11.66% 19.36% 24.71% 19.23% 15.61% 18.36% 25.74% 23.37% 35.14% Borough of Wrangell 28.60% 21.90% 21.24% 25.61% 15.94% 16.90% 7.20% 7.45% 16.33% 19.14% 17.65% 36.71% 13.95% 16.99% 22.46% 25.73% Borough of Yakutat 13.29% 13.11% 15.57% 18.36% 8.97% 8.30% 5.40% 10.07% 17.45% 29.10% 23.22% 20.78% 35.98% 34.49% 35.63% 32.31% Denali Borough 5.94% 8.07% 7.51% 9.15% 11.79% 7.44% 8.35% 27.00% 18.22% 22.40% 18.14% 23.17% 31.67% 16.04% 18.02% Fairbanks North Star Borough 15.17% 14.65% 13.76% 13.83% 13.16% 12.30% 12.05% 14.05% 14.10% 17.18% 14.61% 2.15% 14.21% 20.97% 20.22% 17.31% Haines Borough 49.69% 45.66% 34.69% 10.14% 7.02% 48.47% 42.12% 42.69% 42.77% 31.03% 38.16% Kenai Peninsula Borough 19.43% 13.66% 7.85% 7.83% 8.63% 5.36% 7.46% 10.27% 9.67% 11.60% 19.00% 11.22% 15.27% 21.08% 19.31% 18.25% Ketchikan Gateway Borough 14.42% 14.18% 3.68% 2.18% 1.85% 2.51% 6.79% 4.27% 5.12% 5.26% 6.60% 8.39% 10.23% 9.45% 12.06% Kodiak Island Borough 12.32% 12.70% 13.56% 12.78% 15.10% 11.63% 16.77% 18.56% 18.75% 24.61% 37.96% 28.14% 21.29% 30.92% 40.04% 34.89% Lake and Peninsula Borough Matanuska-Susitna Borough North Slope Borough 26.10% 30.48% 42.97% 32.10% 23.37% 26.16% 34.30% 29.90% 41.84% 44.13% 32.34% 38.79% 59.13% 35.39% 32.44% 49.04% 11.81% 12.32% 11.95% 10.12% 8.73% 8.65% 8.97% 11.90% 10.92% 10.55% 10.68% 10.31% 12.82% 14.27% 10.93% 13.06% Northwest Arctic Borough 8.82% 3.68% 16.91% 21.85% 30.28% 31.72% 31.72% 27.19% 32.57% 43.84% 33.85% 32.53% 61.74% 53.01% 51.10% Skagway Petersburg Borough 16

17 What If Boroughs Had to Replace State Money: A Thought Experiment To get an idea of the potential scale of the problem for boroughs as state aid declines, Table 5 shows the tax amounts each borough would need to collect from its residents to replace all 2015 state aid. The taxes would range from a low of $248 per person in Anchorage to a high of $4,847 in Bristol Bay. This is an extreme example state aid is not all going to disappear but it allows us to see the scale of the problem and the potential difficulties boroughs may face as they grapple with state revenue declines. Table 5: Tax dollars necessary per person to replace dollars coming from the state in 2015 Tax amount Borough name State dollars Number of residents per person Anchorage 74,331, , Aleutians East Borough 1,040,664 3, Borough of Juneau 36,574,789 33,277 1,099 Bristol Bay Borough 4,323, ,874 Borough of Sitka 15,088,635 8,929 1,690 Borough of Wrangell 2,819,638 2,442 1,155 Borough of Yakutat 1,321, ,155 Denali Borough 844,961 1, Fairbanks North Star Borough 27,470,931 98, Haines Borough 4,355,440 2,493 1,747 Kenai Peninsula Borough 21,704,735 57, Ketchikan Gateway Borough 4,154,678 13, Kodiak Island Borough 10,332,739 13, Lake and Peninsula Borough 3,300,079 1,668 1,978 Matanuska-Susitna Borough 33,277, , North Slope Borough 10,420 Northwest Arctic Borough 17,892,275 7,889 2,268 Skagway 1,039 Petersburg Borough 17
18 How Volatile are Local Government Revenues? The fluctuation in the share of revenues coming from the state (shown in Table 4) highlights the volatility of borough revenues. To compare overall revenue fluctuations across places, below we show coefficients of variation, 12 which are calculated as the standard deviation over the mean by borough. These coefficients (Figure 2) allow us to compare volatility across boroughs. Table 6 ranks the boroughs, from the least to the most volatile. Table 6: Volatility of revenues by borough between 2000 and 2015 Boroughs Coefficient of variation Rank Fairbanks North Star Borough Kenai Peninsula Borough Kodiak Island Borough Ketchikan Gateway Borough Borough of Juneau Borough of Sitka Municipality of Anchorage Borough of Wrangell Aleutians East Borough Denali Borough North Slope Borough Lake and Peninsula Borough Haines Borough Bristol Bay Borough Borough of Yakutat Matanuska-Susitna Borough Northwest Arctic Borough Skagway We are unable to calculate a coefficient for Petersburg. 18

19 Fairbanks had the least volatile revenues between 2000 and 2015, while the Northwest Arctic Borough had the most. This volatility subject to changing rapidly and unpredictably is related to the sources of revenues and the amount by which they change from year to year. Fairbanks, for example, received 70% of its revenues from taxes in 2015, and those taxes are much more stable that state dollars. The boroughs with the second and third most stable revenues from year to year are the Kenai Peninsula, which gets 77% of its revenues from local taxes, and Kodiak, which gets 54%. The three boroughs with the most volatile revenues are Skagway, the Northwest Arctic, and the Mat-Su. To be clear, volatility can also stem from growth in revenues and is not necessarily negative. It simply shows large changes over the period. The evidence above seems to suggest that the level of reliance on state dollars is responsible for much of the year-to-year variation in revenues. Boroughs that get a sizable share of their revenues from internal sources tend to have more stable revenues. Property tax revenues, for example, tend to be very stable, since property values do not fluctuate wildly from year to year. How Much of the Variation in Borough Revenues do State Dollars Explain? The next step, then, is to examine how much of the variation in a borough s revenues can be explained by the amount of money it receives from the state. To do that, below we plot below the from a regression of borough revenues on state dollars received by that borough. That tells us the percentage of local revenues variation that is explained by a linear model. R-squared = Explained variation / Total variation It basically tells us that an R^2=.15, means that 15% of the variation in our response variable (borough revenues) can be explained a linear relationship with the predictor (amount money coming from the state). We estimated these regressions separately for each borough. Figure 3 shows the results. 19
20 Table 7 shows that across the boroughs, the amount of variation of local revenues than can be explained by dollars coming from the state runs from a low of 14% for Anchorage to a high of 93% for Bristol Bay. 13 In general, this tells us that state dollars are a very important predictor of the variation of borough revenues across the board. It also tells us that some boroughs are much more sensitive than others to changes in state revenues meaning that future declines in state aid could have vastly different consequences for different boroughs. Table 7: Variation Borough name 14 Variation Rank Aleutians East Borough Anchorage Ketchikan Borough Borough of Wrangell Haines Borough Fairbanks North Star Lake and Penn Denali Borough Kodiak Borough Kenai Peninsula Borough of Sitka Borough of Yakutat Borough of Juneau NWA Matanuska State dollars do not explain any variation in Aleutians total revenues. This is mainly due to large fluctuations in federal government dollars, and investment income. 14 We cannot calculate the variation of local revenues explained by state revenues for the North Slope, Skagway, and Petersburg. These three boroughs report intergovernmental revenues including both state and federal dollars that we cannot separate. 20
21 Bristol Bay How Responsive are Borough Revenues to State Revenue Fluctuations? Because how different boroughs are affected by a common statewide recession is of interest, a particular type of expected or counterfactual reaction suggests itself: namely, the resistance of the statewide revenues as a whole. In other words, the expectation is that, other things being equal, each borough s revenues would contract (in recessions) at the same rate as the state s. Thus, the expected change in revenues in borough r during a recession, say of duration k periods, would be given as: ( = (1) Where is the rate of contraction (in recession) of state revenues; and are revenues in region r in starting time t, the base year, that is, the turning point into recession. Then a measure of regional resistance can be expressed as: (1) Where: is the expected contraction using equation 1. is the actual contraction at the borough level A positive value of indicates that a region is more resistant to recession (that is, less affected) than the state revenues, and less resistant (more affected) for a negative value. For example, a value of of, say, 0.5 would indicate that the borough revenues in question are 50% more resistant than the state revenues, and a value of 0.5 that its resistance is only half that of the nation. We use the period between 2012 and 2015 for the purposes of this analysis, because in 2013 state revenues started declining and have continued to plummet since. Therefore, we are investigating how the borough revenues have responded to this precipitous decrease and whether the declines in the boroughs of interest were more or less pronounced than those of the state. Figure 4 makes it clear that revenues of all the boroughs we analyzed have been more resilient than state revenues. For example, the Mat-Su Borough has been 157% more resistant than the state during this period. The Mat-Su s overall revenues actually grew during this period, in large part due to dollars coming from the state and the federal government. Although all borough revenues have managed to remain robust thus far, that does not mean that they will be immune going forward. Additionally, it seems that there is variation across places in how well communities have fared. One reason for this temporary resistance is the lag between appropriations and cash hitting the street. This means many currently ongoing construction projects are a result of past allocations which are very unlikely to continue given the small state capital project. 21

22 What is the Relationship Between Employment and Government Revenues? Figure 5 shows the share of employment in local government by borough including employees of borough and city governments and school districts. This is yet another way of assessing the vulnerability of borough economies to future declines in revenues. As in all the analyses above, there is considerable variation among boroughs, with Anchorage being the least reliant on local government employment and the Lake and Peninsula Borough the most, with almost 61% of all borough jobs in local government. Local governments employ a wide range of occupations requiring all levels and kinds of skills. Not surprisingly, teachers and their aides represent the single largest group a third of all local government employment. Many of the other jobs are also tied to education, including janitors, crossing guards, counselors, cooks, and administrators. Some of the common local-government occupations not linked to education include laborers, police officers, office clerks, nurses, bookkeepers, water and sewage treatment plant operators, and firefighters. To understand how much local government revenues influence local government employment, we estimated the average relationship between a borough s revenues and its local government employment and found that a 10% increase in borough revenues leads to a 8.3% percent increase in employment across all boroughs. The regression that establishes this relationship is as follows: Where: is the log value of a borough s local government employment (2) 22
23 is the log value of a borough s local government revenues is a year fixed effect which accounts for shocks common across all areas of the state. We also estimate another set of reduced-form equations showing the relationship between local government employment and borough revenues, one borough at a time (Table 8). Given that we have very few observations, these regressions do not include a year fixed effect. While these regressions likely omit other important variables that influence the independent effect of revenues on employment, they do provide us with a sense of how sensitive employment changes are to revenue fluctuations. Table 8: effect of change in borough revenues on change in local government employment % change in local government employment for a 10% change in local government revenues R^2 Aleutians East Borough (.037) Borough of Juneau 0.122*** (0.045) Borough of Sitka 0.335*** (0.0476)
24 Bristol Bay Borough (0.41) Denali Borough 0.02 (0.035) Fairbanks North Star Borough 0.09** (0.039) Haines Borough 0.151*** (0.044) Kenai Peninsula Borough (0.04) Ketchikan Gateway Borough 0.08* (0.048) 0.18 Kodiak Island Borough 0.109* (0.064) Lake and Peninsula Borough (0.085) Matanuska-Susitna Borough 0.303*** (0.027) 0.90 Municipality of Anchorage (0.041) 0.05 North Slope Borough (0.041) Northwest Arctic Borough (0.025) Wrangell, City and Borough of 0.10 (0.073) Yakutat, City and Borough of 0.475** (0.130) 0.50 ***, **,* represent statistical significance at 1, 5, and 10% levels. The relationship between changes in revenues and changes in employment are mostly in the expected direction: we see an increase in local government employment as a result of an increase in local revenues. Column 2 shows us the percent change in employment for a 10% change in revenues. For example, in Juneau, a 10% increase in revenues is associated with a 1.2% increase in employment. The third column 24


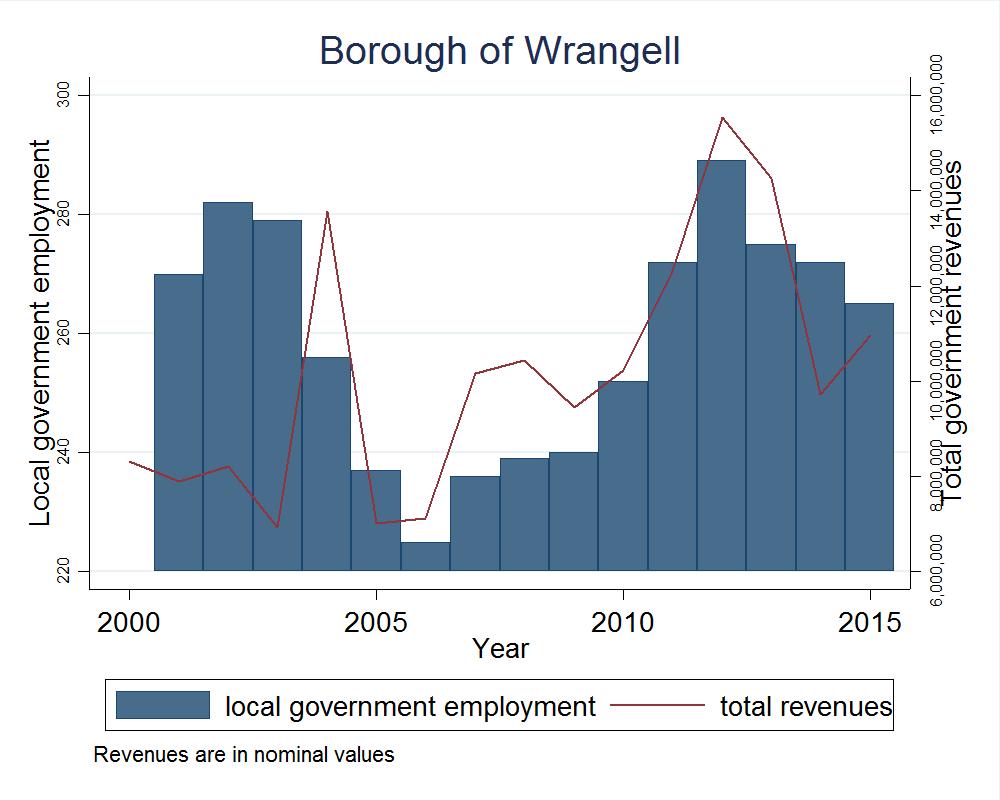
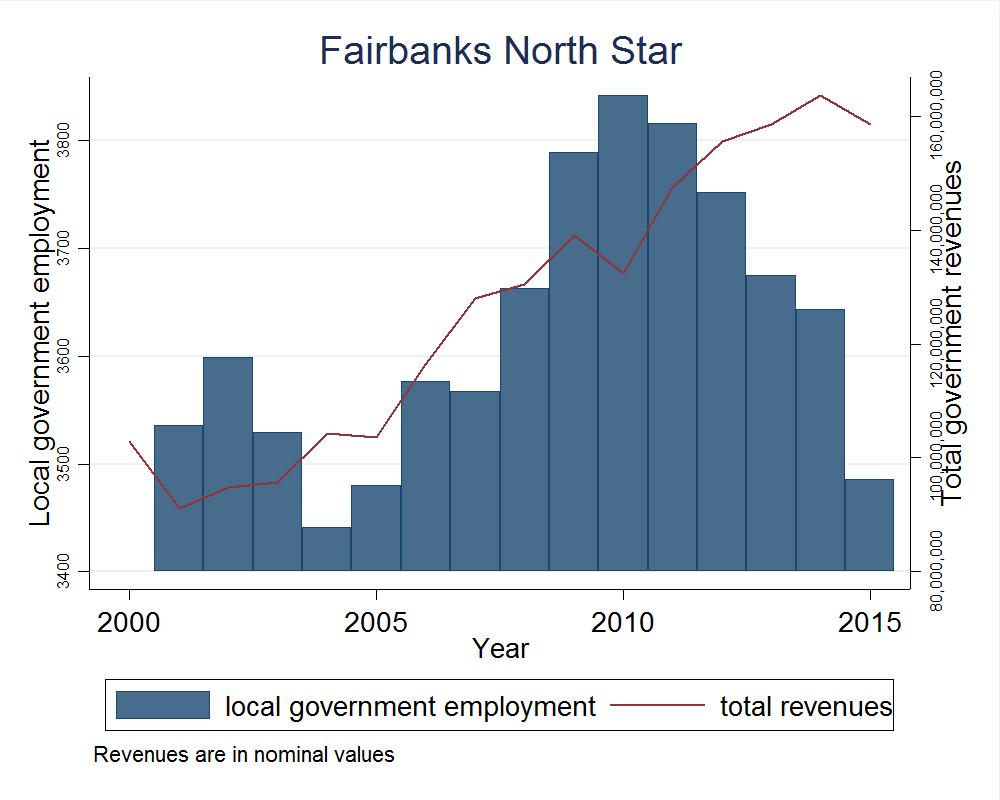
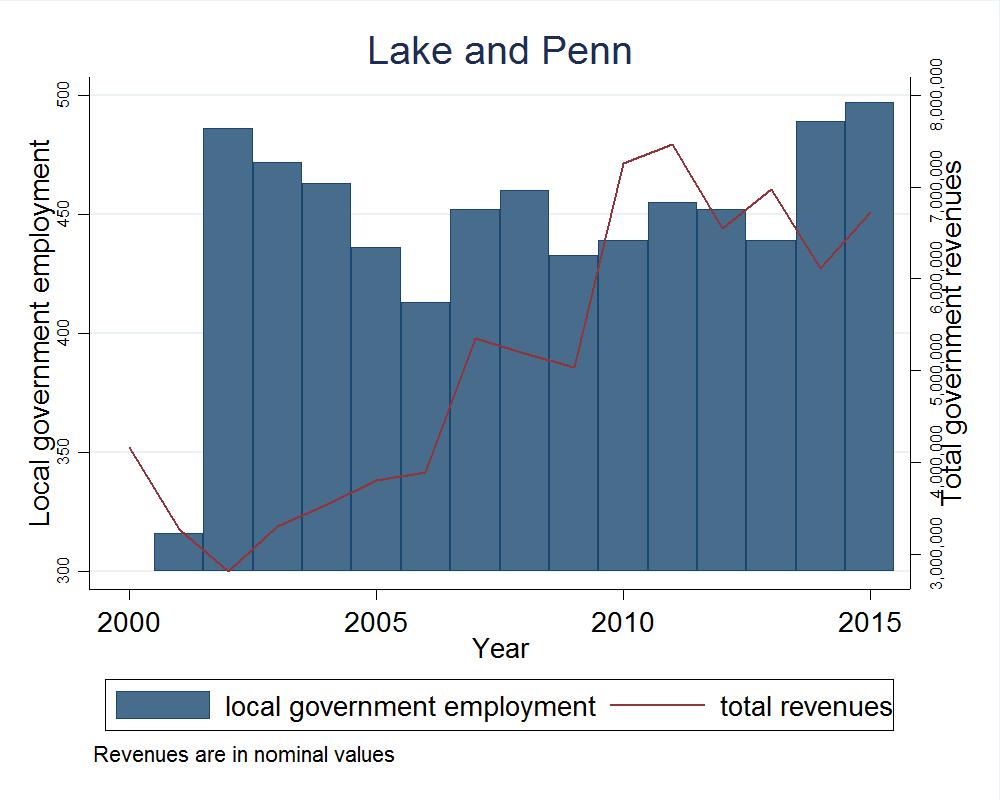
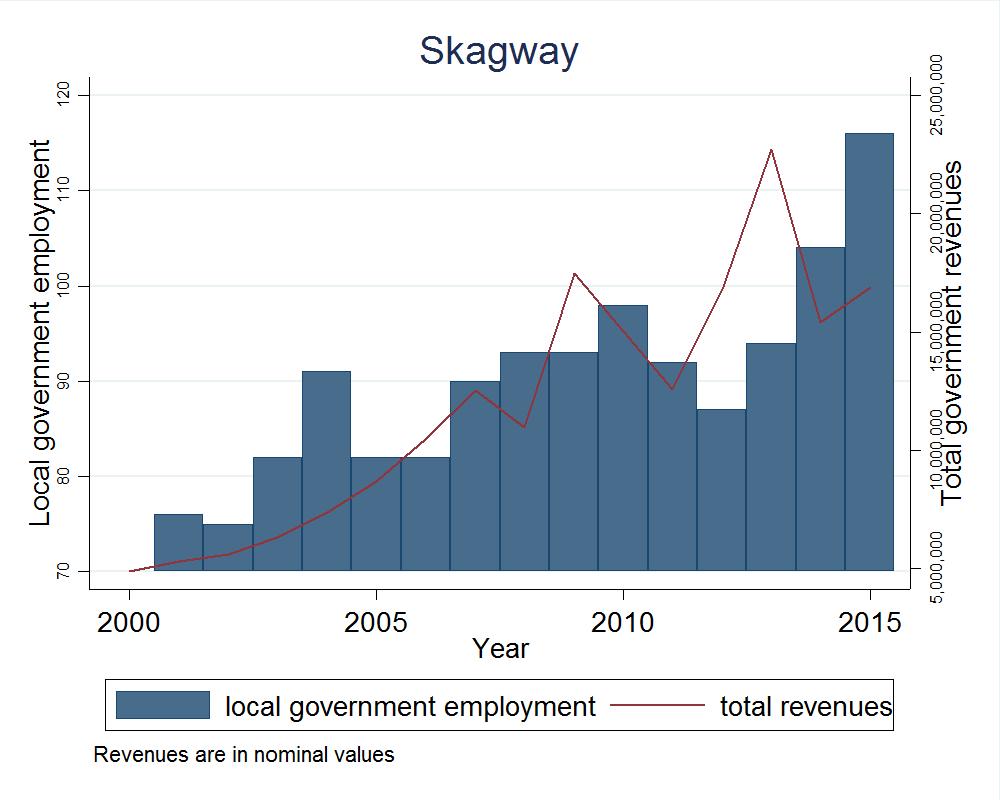
25 tells us the amount of variation in local government employment that can be explained by the borough s revenues. Figure 6 shows nominal local government revenues and local government employment for each borough separately. While once again the patterns differ, revenues have increased since the mid-2000s and employment has either increased or remained stable in most places. Figure 6: Local government employment and revenues by borough between 2000 and

26 26

27 27

28 28
29 How Important are Local Government Wages to Borough Economies? Table 9 shows local government employment, average wages in local government, total wages, and the share of wages coming from local government. The share of wages coming from local government employment is high overall, ranging from a low of 11% in Fairbanks to a high of 78% in the Lake and Peninsula Borough. Boroughs with diversified economies and high-paying private sector jobs will have a fewer share of their dollars coming from local government. Examining the dependence of the overall economy on local government revenues and local government employment is another way to determine the relative vulnerability of the boroughs to potential declines in money flowing from the state. Table 9: Local government employment and wages by borough in 2015 Local government employment in 2015 Average wage in local government Total wages in the borough Aleutians East 234 $2,712 $22,456,574 Borough Borough of 2172 $4,605 $668,784,603 Juneau Borough of 738 $4,342 $135,268,226 Sitka Borough of 265 $3,420 $28,215,450 Wrangell Borough of 120 $3,041 $8,492,184 Yakutat Bristol Bay 119 $3,445 $16,186,437 Borough Share of wages coming from local government 33.91% 17.95% 28.43% 38.54% 51.57% 30.39% Denali Borough 146 $2,795 $36,010, % Fairbanks 3486 $4,240 $1,605,980,000 North Star 11.04% Borough Haines Borough 165 $3,013 $29,970, % Kenai Peninsula 3,500 $4,245 $1,074,509,866 Borough 16.59% Ketchikan 1,144 $3,985 $234,886,971 Gateway 23.29% Borough Kodiak Island 865 $3,410 $202,596,195 Borough 17.47% Lake and 497 $2,397 $18,296,974 Peninsula 78.13% Borough Matanuska- 4,442 $4,019 $1,825,973,854 Susitna 11.73% Borough Municipality of 10,682 $4,992 $ 8,862,827,961 Anchorage 7.21% 29
30 North Slope Borough Northwest Arctic Borough Petersburg Borough 1,986 $4,758 $150,985,839 1,145 $3,166 $105,873, $3,273 $36,362, % 41.09% 38.34% Conclusion We have shown that state dollars play a very important role in financing local government in Alaska. The fiscal stress the state is experiencing has yet to make its way to local government budgets. But it seems inevitable that local governments will need to either raise taxes or reduce services as aid from the state drops. We found that state dollars explain a considerable portion of the variation in local government revenues. Also, we found that borough revenues are volatile from year to year. This volatility is high in boroughs with few internal sources of revenues. This last point is important, because taxes property taxes in particular tend to be stable while external dollars tend to fluctuate. Since 2005, local governments have become more reliant on state dollars. But this boom period is coming to an end. On the employment front, it is obvious that the employment and wages of local government are crucial to the health of those economies. Going forward, it will be crucial for the vulnerable economies to balance the needs of providing services and imposing taxes that fall on their residents. Appendix: Table 9: Intergovernmental dollars received by boroughs not identified as either state/federal Intergovernmental dollars Not broken down Share of all dollars Anchorage 95,127, % Borough of Sitka 2,807, % Borough of Wrangell 2,280, % Fairbanks North Star Borough 1,578, % Ketchikan Gateway Borough 7,299, % Matanuska Borough 84,407, % North Slope Borough 57,515, % Skagway 3,763, % Petersburg Borough 3,069, % 30
IN THIS ISSUE OCTOBER ISSUE ANCHORAGE EMPLOYMENT REPORT SPONSORED BY. A September jobs update. Anchorage housing market numbers
 ANCHORAGE EMPLOYMENT REPORT OCTOBER ISSUE IN THIS ISSUE A September jobs update Anchorage housing market numbers The most in-demand jobs in Anchorage SPONSORED BY 1 THANK YOU. Thank you to our sponsors
THE STATEWIDE TAX CAP SQUEEZE
 THE STATEWIDE TAX CAP SQUEEZE Scott Goldsmith and Alexandra Hill Institute of Social and Economic Research University of Alaska Anchorage October 6, 2000 A property tax cap of 10 mills would restrict the
February 2013 Employment Report. Anchorage 5.2% February Unemployment Rate for Anchorage
 February Employment Report Anchorage 5.2% February Unemployment Rate for Anchorage Monthly Unemployment special update At the end of every calendar year the State of Alaska revises the employment estimates
Anchorage Employment Report
 Third Edition 2018 March Anchorage Employment Report CO-SPONSORED BY: TABLE OF CONTENTS EXECUTIVE SUMMARY...2 GOODS PRODUCING JOBS SUMMARY...3 SERVICES PROVIDING JOBS SUMMARY...4 HEALTH CARE SNAPSHOT...4
Population Projections, 2007 to 2030
 Population Projections, 27 to 23 By Eddie Hunsinger, Demographer A look at Alaska s future hat will Alaska s population look like W in 23? Projections by the Alaska Department of Labor and Workforce Development
Anchorage Employment Report
 Third Edition April Anchorage Employment Report CO-SPONSORED BY: TABLE OF CONTENTS EXECUTIVE SUMMARY...2 GOODS PRODUCING JOBS SUMMARY...3 SERVICES PROVIDING JOBS SUMMARY...4 HEALTH CARE SNAPSHOT...4 PROFESSIONAL
What do we know about the Alaska economy and where is it heading?
 What do we know about the Alaska economy and where is it heading?, PhD Institute of Social and Economic Research University of Alaska Anchorage 1/18/2017 Outline 1 General Overview Alaska s Economy: An
Anchorage Employment Report
 Fourth Edition Anchorage Employment Report Sponsored by: TABLE OF CONTENTS EXECUTIVE SUMMARY...3 MONTHLY REVISIONS...4 ANCHORAGE ECONOMY HIGHLIGHT: INSIDE THE INFORMATION INDUSTRY...5 GOODS PRODUCING JOBS
Anchorage Employment Report
 First Edition 2017 February Anchorage Employment Report CO-SPONSORED BY: TABLE OF CONTENTS EXECUTIVE SUMMARY...2 GOODS PRODUCING JOBS SUMMARY...3 SERVICES PROVIDING JOBS SUMMARY...5 HEALTH CARE SNAPSHOT...5
Territory to State Double disasters earthquake and flood Prudhoe Bay oil strike $900 million oil lease sale ANCSA passed Pipeline construction boom
 Territory to State Double disasters earthquake and flood Prudhoe Bay oil strike $900 million oil lease sale ANCSA passed Pipeline construction boom Fisheries slowly recover Crab becomes "king" 80s boom
Local Tax and Regulatory Environments
 Local Tax and Regulatory Environments In this section the local tax and regulatory environments that businesses must address in Southeast Alaska is reviewed. Local Tax Environment In Alaska only incorporated
Anchorage Employment Report
 First & Second Edition 2018 February Anchorage Employment Report COSPONSORED BY: TABLE OF CONTENTS EXECUTIVE SUMMARY...2 GOODS PRODUCING JOBS SUMMARY...3 SERVICES PROVIDING JOBS SUMMARY...4 HEALTH CARE
What do we know to date about the Alaska recession and the fiscal crunch? Prepared with support from. Northrim Bank
 What do we know to date about the Alaska recession and the fiscal crunch? Prepared with support from Northrim Bank By Mouhcine Guettabi 1, Assistant Professor of Economics Institute of Social and Economic
FY 2017 PERS Proj Current
 Source of FY17 Wage Projection: DRB, FY14 Actuarial Valuations; verified and adjusted by districts - see NOTES at right Current Rates Incr-FY17 Incr-FY18 Incr-FY19 Incr-FY20 NOTES ALASKA GATEWAY SD $2,930,197
Department of Commerce, Community & Economic Development
 Department of Commerce, Community & Economic Development presented to Alaska Municipal League Summer Legislative Meeting August 17, 2017 Deputy Commissioner Fred Parady State Budget Situation State has
Alaska Department of Labor Tony Knowles, Governor
 In the NWAB, most residents are Inupiat Eskimo, who participate in subsistence harvest of caribou, salmon, seal and moose. A tightly integrated social area, its economic powerhouse is the Red Dog Mine.
$1.5 Billion A Year and Growing: Economic Contribution of Older Alaskans By Scott Goldsmith and Jane Angvik
 $1.5 Billion A Year and Growing: Economic Contribution of Older ns By Scott Goldsmith and Jane Angvik September 2006 UA Research Summary No. 7 Institute of Social and Economic Research University of Anchorage
HOME BUYER APPLICATION PACKET (Read carefully before submitting application.)
") Home Opportunity Program Sponsored by: Alaska Community Development Corporation 1517 S. Industrial Way, #8, Palmer, AK 99645 (907) 746-5680 FAX: (907) 746-5681 Email ltice@alaskacdc.org or pshafer@alaskacdc.org
Home Opportunity Program Sponsored by: Alaska Community Development Corporation 1517 S. Industrial Way, #8, Palmer, AK 99645 (907) 746-5680 FAX: (907) 746-5681 Email ltice@alaskacdc.org or pshafer@alaskacdc.org
Observations on Alaska s Economy and Economic Implications of Alaska s Fiscal Choices
 Observations on Alaska s Economy and Economic Implications of Alaska s Fiscal Choices Gunnar Knapp Director and Professor of Economics Institute of Social and Economic Research University of Alaska Anchorage
Ketchikan Economic Indicators 2010
 Ketchikan Economic Indicators 2010 Volume I: Economic Indicators Summary Prepared by: Prepared for: Ketchikan Gateway Borough Planning and Community Development Introduction This component of the Ketchikan
Sitka 2030 Comprehensive Plan. September 6, 2016 Planning Commission Work Session on Sitka s Economy - Presentation by Sheinberg Associates
 Sitka 2030 Comprehensive Plan September 6, 2016 Planning Commission Work Session on Sitka s Economy - Presentation by Sheinberg Associates Sitka Today Sitka 2030 Sitka 2030 Comprehensive Plan www.sitkacomprehensiveplan.com
How do oil prices influence Alaska and other energy-dependent states?
 How do oil prices influence Alaska and other energy-dependent states? Prepared with support from Northrim Bank By Mouhcine Guettabi (mguettabi@alaska.edu) Institute of Social and Economic Research and
ALASKA S ECONOMY. A bright future, but are we prepared? Mike Navarre, Commissioner Department of Commerce, Community and Economic Development
 ALASKA S ECONOMY A bright future, but are we prepared? Mike Navarre, Commissioner Department of Commerce, Community and Economic Development Our future is bright 2 What s happening in our economy? Does
Alaska Taxable January Volume L. Sean Parnell, Governor State of Alaska
 Alaska Taxable 2010 Municipal Taxation - Rates and Policies Full Value Determination Population and G.O. Bonded Debt January 2011 Volume L Sean Parnell, Governor State of Alaska Susan Bell Commissioner
Alaska Public School Administrator Salary & Benefits Report
 Alaska Public School Administrator 2017 2018 Salary & Benefits Report Association of Alaska School Boards 1111 W. 9 th St. Juneau, AK 99801 Phone: 907-463-1660 Fax: 907-586-2995 E-Mail: aasb@aasb.org Website:
Alaska Five-Year Floodplain Management Work Plan
 Purpose: The purpose of the Community Assistance Program State Support Services Element (CAP-SSSE) is to provide, through a State grant mechanism, a means to ensure that communities participating in the
2012 Alaska Economic Performance Report
 $/$6.$ ' ( 3 $ 5 7 0 ( 1 7 2 ) & 2 0 0 ( 5 & ( & 2 0 0 8 1, 7 < $1' (&2120,& '(9(/230(17 2012 Alaska Economic Performance Report Sean Parnell Governor State of Alaska Susan Bell Commissioner Department
Brynn Keith, Chief Research and Analysis. Sara Whitney, Editor Sam Dapcevich, Cover Artist. Trends Authors
 Governor Sean Parnell Commissioner Click Bishop June 2011 Volume 31 Number 6 ISSN 0160-3345 To contact us for more information, a free subscription, mailing list changes, or back copies, e-mail trends@alaska.gov
Partnership Stewardship Integrity
 Alaska s Finance Authority INVESTING IN ALASKANS Partnership Stewardship Integrity Our Mission Advancing economic growth and diversification in Alaska by providing longterm financing and investment. Our
SOUTHEAST ALASKA by the Numbers 2018
 SOUTHEAST ALASKA by the Numbers 218 SOUTHEAST CONFERENCE Rain Coast Data Mid Session Summit February 12th, 219 219 Southeast Economic Theme You! 224 Pre-registrants 224 Pre-registrants 149 Organizations
Alaska Superintendents Association (ASA) Alaska Association of School Business Officials (ALASBO) February 21, 2016
 Alaska Association of School Business Officials (ALASBO) February 21, 2016") Alaska Superintendents Association (ASA) Alaska Association of School Business Officials (ALASBO) February 21, 2016 Randall J Hoffbeck, Commissioner Department of Revenue 2 Fiscal Challenge Federal Funds
Alaska Superintendents Association (ASA) Alaska Association of School Business Officials (ALASBO) February 21, 2016 Randall J Hoffbeck, Commissioner Department of Revenue 2 Fiscal Challenge Federal Funds
Alaska Taxable Municipal Taxation - Rates and Policies Full Value Determination Population and G.O. Bonded Debt. January 2014.
 Alaska Taxable 2013 Municipal Taxation Rates and Policies Full Value Determination Population and G.O. Bonded Debt January 2014 Volume LIII Sean Parnell, Governor State of Alaska Susan Bell, Commissioner
Your Home, Our Business
 Your Home, Our Business Revised July 7, 2017 Table of Contents Single-Family Loans General Requirements... 1 Single-Family Loans Purpose... 2 Single-Family Loan Limits... 3 Single-Family Loan Programs
Alaska Public School Teacher Salary & Benefits Report
 Alaska Public School Teacher 2014 2015 Salary & Benefits Report Association of Alaska School Boards 1111 W. 9 th St. Juneau, AK 99801 Phone: 907-463-1660 Fax: 907-586-2995 E-Mail: aasb@aasb.org Website:
Gas pipeline project would boost Alaska economy, but less than 1970s oil line
 Gas pipeline project would boost Alaska economy, but less than 1970s oil line By: Bill White, Researcher/Writer, Office of the Federal Coordinator February 1, 2012 Building a major pipeline to carry stranded
The Matanuska-Susitna Borough 12. Employment Scene 20
 December 200 Volume 30 Number 2 ISSN 060-3345 To contact us for more information, a free subscription, mailing list changes, or back copies, e-mail trends@alaska. gov or call (907) 465-4500. Brynn Keith,
FROM THE COMMISSIONER
 FROM THE COMMISSIONER Trade with China is a major opportunity for Alaska About nine months ago, GUEST EDITORIAL shortly after I became commissioner for the Department of Commerce, Community, and Economic
Center on Regional Politics
 Policy Brief Hard Choices Still Ahead: William Hartman & Timothy J. Shrom MARCH 2017 s (CORP), Penn State s College of Education, the University of Pittsburgh s Center for Metropolitan Studies, and the
We recently renewed our ABAWD work requirement waiver. The only change is to the Kenai area.
 From: Subject: Wednesday, April 16, 2003 3:52 PM All DPA Statewide Staff; All DPA State Associates Kenai Census Area ABAWD Exempt Year Round Broadcast to all Staff From the Food Stamp Policy Unit We recently
Alaska s 2009 Population 4. The Kenai Peninsula Borough 11. Alaska s Unemployment Insurance Trust Fund 16
 April 200 Volume 30 Number 4 ISSN 060-3345 To contact us for more information, a free subscription, mailing list changes or back copies, email Trends@alaska. gov or call (907) 465-4500. Alaska Economic
Alaska s Petroleum Industry: Transformative, But is it Sustainable?
 Alaska s Petroleum Industry: Transformative, But is it Sustainable? by Scott Goldsmith Institute of Social and Economic Research University of Alaska Anchorage Alaska House Finance Committee Invited Presentation
New Sustainable Alaska Plan FY2017 Budget Overview. December 14, 2015 Office of Management and Budget
 New Sustainable Alaska Plan FY2017 Budget Overview December 14, 2015 Office of Management and Budget 1 Alaska s Fiscal Challenge Federal Funds $3.3 billion (27%) Unrestricted General Fund Gap $3.4 billion
Frank H. Murkowski, Governor of Alaska Greg O Claray, Commissioner of Labor and Workforce Development
 June 2004 Volume 24 Number 6 ISSN 0160-3345 Alaska Economic Trends is a monthly publication dealing with a variety of economic-related issues in the state. Alaska Economic Trends is funded by the Employment
Women earned 65 cents for every dollar earned by men in Alaska in 1997.
 Women earned 65 cents for every dollar earned by men in Alaska in 1997. Alaska Department of Labor Tony Knowles, Governor February 1999 Volume 19 Number 2 ISSN 0160-3345 Alaska Economic Trends is a monthly
Anchorage Employment Report
 Revised - Second Edition Anchorage Employment Report Sponsored by: TABLE OF CONTENTS EXECUTIVE SUMMARY...3 MONTHLY REVISIONS...4 GOODS PRODUCING JOBS SUMMARY...5 SERVICES PROVIDING JOB SUMMARY...6 HEALTH
Total state and local business taxes
 Total state and local business taxes State-by-state estimates for fiscal year 2017 November 2018 Executive summary This study presents detailed state-by-state estimates of the state and local taxes paid
ALASKA S ECONOMY. A bright future, but are we prepared? Mike Navarre, Commissioner Department of Commerce, Community and Economic Development
 ALASKA S ECONOMY A bright future, but are we prepared? Mike Navarre, Commissioner Department of Commerce, Community and Economic Development Our future is bright 2 Good news in oil and gas.. 1. Modest
Alaska Public School Teacher Salary & Benefits Report
 Alaska Public School Teacher 2017 2018 Salary & Benefits Report Association of Alaska School Boards 1111 W. 9 th St. Juneau, AK 99801 Phone: 907-463-1660 Fax: 907-586-2995 E-Mail: aasb@aasb.org Website:
Southeast Alaska Resiliency Mapping Weatherizing for the Economic Storm
 Southeast Alaska Resiliency Mapping Weatherizing for the Economic Storm At Southeast Conference s March 2016 Mid-Session Summit, audience members participated in a resiliency mapping exercise. The purpose
The current study builds on previous research to estimate the regional gap in
 Summary 1 The current study builds on previous research to estimate the regional gap in state funding assistance between municipalities in South NJ compared to similar municipalities in Central and North
The Center for Local, State, and Urban Policy
 The Center for Local, State, and Urban Policy Gerald R. Ford School of Public Policy >> University of Michigan Michigan Public Policy Survey October 2012 Michigan s local leaders satisfied with union negotiations
AMHS Reform Project Strategic Business and Operational Plan. Update: February 15, 2018
 AMHS Reform Project Strategic Business and Operational Plan Update: February 15, 2018 Project Purpose Create a strategic plan for AMHS To provide financially sustainable ferry service that meets the needs
Total state and local business taxes
 Total state and local business taxes State-by-state estimates for fiscal year 2016 August 2017 Executive summary This study presents detailed state-by-state estimates of the state and local taxes paid
AMHS Reform Project Strategic Business and Operational Plan
 AMHS Reform Project Strategic Business and Operational Plan Project Purpose Create a strategic plan for AMHS To provide financially sustainable ferry service that meets the needs of Alaskans Multi-phase
Business Optimism Survey Report Summer 2017
 Center for Economic and Business Research Business Optimism Survey Report Summer 2017 July 24, 2017 Student Author(s) Elena Rodriguez In Collaboration With Contents Executive Summary..3 Clarifying Notes
Revenue Options for the State of Alaska
 Revenue Options for the State of Alaska Status Update and Presentation to Alaska Municipal League Anchorage, Alaska Pat Pitney, Office of Management and Budget Director Ken Alper, Tax Division Director
GAUGING ALASKA s ECONOMY PAGE 10
 OCTOBER 2017 Volume 37 Number 10 ISSN 0160-3345 JOB TURNOVER Measuring employers entry and exit rates By MALI ABRAHAMSON PAGE 4 YOUNG ADULTS IN ALASKA A snapshot of workers between ages 20 and 34 By ALYSSA
POPULATION: New Es mates Alaska had 735,601 people in July 2014, a slight decline
 APRIL 2015 Volume 35 Number 4 ISSN 0160-3345 POPULATION: New Es mates Alaska had 735,601 people in 2014, a slight decline By EDDIE HUNSINGER TWO UNIQUE ALASKA COMMUTES Most Alaskans work close to home,
The Impact of the Recession on Employment-Based Health Coverage
 May 2010 No. 342 The Impact of the Recession on Employment-Based Health Coverage By Paul Fronstin, Employee Benefit Research Institute E X E C U T I V E S U M M A R Y HEALTH COVERAGE AND THE RECESSION:
ARLA Survey of Residential Investment Landlords
 Prepared for The Association of Residential Letting Agents ARLA Survey of Residential Investment Landlords March 2013 Prepared by O M Carey Jones 5 Henshaw Lane, Yeadon, Leeds, LS19 7RW March 2013 CONTENTS
Alaska Oil and Gas Association
 January/February 2008 straight talk Alaska Oil and Gas Association The Role of the Oil and Gas Industry in Alaska s Economy In this issue of Straight Talk, AOGA shares the results of an economic study
Sarah Palin, Governor of Alaska Commissioner Click Bishop
 October 2007 Volume 27 Number 0 ISSN 060-3345 To contact us for more information, a free subscription, mailing list changes or back copies, email us at trends@labor. state.ak.us or call (907) 465-4500.
The Property Tax in New York State. Condition Report Prepared for the Education Finance Research Consortium December 2008
 The Property Tax in New York State Nelson A. Rockefeller Institute of Government 411 State Street Albany, New York 12203 Condition Report Prepared for the Education Finance Research Consortium December
GAO GENDER PAY DIFFERENCES. Progress Made, but Women Remain Overrepresented among Low-Wage Workers. Report to Congressional Requesters
 GAO United States Government Accountability Office Report to Congressional Requesters October 2011 GENDER PAY DIFFERENCES Progress Made, but Women Remain Overrepresented among Low-Wage Workers GAO-12-10
FINANCE A POLICY PRIMER
 WISCONSIN S Local Government FINANCE A POLICY PRIMER The Robert M. La Follette School of Public Affairs University of Wisconsin Madison The Robert M. La Follette School of Public Affairs is a nonpartisan
WESTERN COASTAL ALASKA
 WESTERN COASTAL ALASKA County Community Data Profile Vantage Point 2015: 12 th District Community Indicators Project Federal Reserve Bank of San Francisco Project Contact: Gabriella Chiarenza gabriella.chiarenza@sf.frb.org
Notes and Definitions Numbers in the text, tables, and figures may not add up to totals because of rounding. Dollar amounts are generally rounded to t
 CONGRESS OF THE UNITED STATES CONGRESSIONAL BUDGET OFFICE The Distribution of Household Income and Federal Taxes, 2011 Percent 70 60 Shares of Before-Tax Income and Federal Taxes, by Before-Tax Income
How to fill out Blue City Sales Tax Return form
 How to fill out Blue City Sales Tax Return form Step by Step instruction on how to file Quarterly City Sales Tax Return Form. Prepared by your friendly city tax division. Business information Instructions
ALASKA LEGAL SERVICES CORPORATION. Financial Statements, Supplementary Information, and Compliance Reports
 Financial Statements, Supplementary Information, and Compliance Reports (With Independent Auditor s Report Thereon) Year Ended December 31, 2017 Financial Statements, Supplementary Information, and Compliance
THE EFFECTS OF STATE EXPENDITURES ON RURAL POPULATION SETTLEMENT AND INTRASTATE POPULATION MIGRATION. Volume I. Theodore Lane Will Nebesky Teresa Hull
 THE EFFECTS OF STATE EXPENDITURES ON RURAL POPULATION SETTLEMENT AND INTRASTATE POPULATION MIGRATION Volume I by Theodore Lane Will Nebesky Teresa Hull Institute of Social and Economic Research University
2003 Minnesota Tax Incidence Study
 2003 Minnesota Tax Incidence Study (Revised using February 2003 Forecast) An analysis of Minnesota s household and business taxes. March 2003 2003 Minnesota Tax Incidence Study Analysis of Minnesota s
Striking it Richer: The Evolution of Top Incomes in the United States (Updated with 2009 and 2010 estimates)
") Striking it Richer: The Evolution of Top Incomes in the United States (Updated with 2009 and 2010 estimates) Emmanuel Saez March 2, 2012 What s new for recent years? Great Recession 2007-2009 During the
Striking it Richer: The Evolution of Top Incomes in the United States (Updated with 2009 and 2010 estimates) Emmanuel Saez March 2, 2012 What s new for recent years? Great Recession 2007-2009 During the
AMHS Reform Project Strategic Business and Operational Plan. Update: September 2017
 AMHS Reform Project Strategic Business and Operational Plan Update: September 2017 Project Purpose Create a strategic plan for AMHS To provide financially sustainable ferry service that meets the needs
ISER FISCAL POLICY PAPERS
 ISER FISCAL POLICY PAPERS No. 5, April 1991 Institute of Social and Economic Research University of Alaska Anchorage Alaska s Dependence on State Spending It would be hard to exaggerate Alaska s economic
Gender Pay Differences: Progress Made, but Women Remain Overrepresented Among Low- Wage Workers
 Cornell University ILR School DigitalCommons@ILR Federal Publications Key Workplace Documents 10-2011 Gender Pay Differences: Progress Made, but Women Remain Overrepresented Among Low- Wage Workers Government
The Cost of Living in Alaska 4 Energy prices a large part of 2011 s rise in infl ation. Employment Scene 13 Characteristics of Alaska s labor force
 July 2012 Volume 32 Number 7 ISSN 0160-3345 To contact us for more information, a free subscription, mailing list changes, or back copies, e-mail trends@alaska.gov or call (907) 465-4500. Alaska Economic
Sarah Palin, Governor of Alaska Commissioner Click Bishop
 June 2007 Volume 27 Number 6 Web site: almis.labor.state.ak.us ISSN 060-3345 To contact us for more information, a free subscription, mailing list changes or back copies, email us at trends@labor.state.ak.us
Fiscal Impacts Appendix
 Fiscal Impacts Appendix This chapter focuses on the fiscal impacts to local governments and the State of Alaska resulting from Operation F-35 Beddown at Eielson, which we will hereafter refer to as the
In early 2003, financial analysts gave Alaska state officials some very
 No.86 How Is the State Dealing With the Shortfall in Pension Systems? Institute of Social and Economic Research, University of Alaska Anchorage By Cliff Groh In early 2003, financial analysts gave Alaska
TAX CREDITS FOR GROWING BUSINESSES ACT 2011 REPORT
 TAX CREDITS FOR GROWING BUSINESSES ACT 2011 REPORT June 1, 2011 * State of North Carolina Department of Commerce Secretary J. Keith Crisco * Distribution of Article 3J Tax Credits by Industry section was
The Role of the Oil and Gas Industry in Alaska s Economy
 The Role of the Oil and Gas Industry in Alaska s Economy JUNE 30, 2008 ACKNOWLEDGEMENTS Information Insights and McDowell Group thank the oil and gas industry primary companies and support activity businesses
Frank H. Murkowski, Governor of Alaska Greg O Claray, Commissioner of Labor and Workforce Development
 June 2003 Volume 23 Number 6 ISSN 0160-3345 http://almis.labor.state.ak.us Frank H. Murkowski, Governor of Alaska Greg O Claray, Commissioner of Labor and Workforce Development Alaska Economic Trends is
20 Years of School Funding Post-DeRolph Ohio Education Policy Institute August 2018
 20 Years of School Funding Post-DeRolph Ohio Education Policy Institute August 2018 The 15 charts that accompany this summary provide an overview of how state and local funding has changed in 20 years
CHAPTER 2 Describing Data: Numerical
 CHAPTER Multiple-Choice Questions 1. A scatter plot can illustrate all of the following except: A) the median of each of the two variables B) the range of each of the two variables C) an indication of
Notes and Definitions Numbers in the text, tables, and figures may not add up to totals because of rounding. Dollar amounts are generally rounded to t
 CONGRESS OF THE UNITED STATES CONGRESSIONAL BUDGET OFFICE The Distribution of Household Income and Federal Taxes, 2013 Percent 70 60 50 Shares of Before-Tax Income and Federal Taxes, by Before-Tax Income
 TABLE I SUMMARY STATISTICS Panel A: Loan-level Variables (22,176 loans) Variable Mean S.D. Pre-nuclear Test Total Lending (000) 16,479 60,768 Change in Log Lending -0.0028 1.23 Post-nuclear Test Default
Total state and local business taxes
 Total state and local business taxes State-by-state estimates for fiscal year 2014 October 2015 Executive summary This report presents detailed state-by-state estimates of the state and local taxes paid
Summary of Economic Indicators
 La Paz County Summary of Economic Indicators The economic overview includes a variety of topic areas and benchmarks of economic performance over the past six years Data is indexed based on 2005 county
Socio-economic Series Changes in Household Net Worth in Canada:
 research highlight October 2010 Socio-economic Series 10-018 Changes in Household Net Worth in Canada: 1990-2009 introduction For many households, buying a home is the largest single purchase they will
STRUCTURAL CHANGE IN THE ALASKAN ECONOMY: THE ALYESKA EXPERIENCE. and. Lee Huskey Assistant Professor of Economics
 STRUCTURAL CHANGE IN THE ALASKAN ECONOMY: THE ALYESKA EXPERIENCE by 0, Scott Goldsmith Assistant Professor of Economics and Lee Huskey Assistant Professor of Economics Institute of Social and Economic
The overall cost of living in Anchorage rose
 By NEAL FRIED The Cost of Living in Alaska Infl ation rose modestly in 2012 The overall cost of living in Anchorage rose a modest 2.2 percent between 2011 and 2012. This inflation rate was a full percentage
The Effects of State Revenue Options on Alaska Households
 The Effects of State Revenue Options on Alaska Households Institute of Social and Economic Research University of Alaska Anchorage January 27, 2004 The Institute of Social and Economic Research developed
Optimal Taxation : (c) Optimal Income Taxation
 Optimal Income Taxation") Optimal Taxation : (c) Optimal Income Taxation Optimal income taxation is quite a different problem than optimal commodity taxation. In optimal commodity taxation the issue was which commodities to tax,
Optimal Taxation : (c) Optimal Income Taxation Optimal income taxation is quite a different problem than optimal commodity taxation. In optimal commodity taxation the issue was which commodities to tax,
ANWR AND THE ALASKA ECONOMY
 ANWR AND THE ALASKA ECONOMY AN ECONOMIC IMPACT ASSESSMENT PREPARED FOR: SUPPORTING ALASKA FREE ENTERPRISE (SAFE) PREPARED BY: ANCHORAGE JUNEAU SEPTEMBER 2002 TABLE OF CONTENTS Executive Summary... 1 Introduction...
THE ECONOMIC IMPACTS OF SEALASKA CORPORATION ON RURAL SOUTHEAST ALASKA COMMUNITIES
 THE ECONOMIC IMPACTS OF SEALASKA CORPORATION ON RURAL SOUTHEAST ALASKA COMMUNITIES PREPARED FOR: SEALASKA CORPORATION ONE SEALASKA PLAZA, SUITE 400 JUNEAU, ALASKA 99802 AUGUST 2001 THE ECONOMIC IMPACTS
PROPERTY ASSESSMENT AND TAXATION
 AUTHORITY The City and Borough of Juneau s authorization to levy a property tax is provided under Alaska State Statute Section 29.45. Under this section, the State requires the Assessor to assess property
Final Report on MAPPR Project: The Detroit Living Wage Ordinance: Will it Reduce Urban Poverty? David Neumark May 30, 2001
 Final Report on MAPPR Project: The Detroit Living Wage Ordinance: Will it Reduce Urban Poverty? David Neumark May 30, 2001 Detroit s Living Wage Ordinance The Detroit Living Wage Ordinance passed in the
Six-Year Income Tax Revenue Forecast FY
 Six-Year Income Tax Revenue Forecast FY 2017-2022 Prepared for the Prepared by the Economics Center February 2017 1 TABLE OF CONTENTS EXECUTIVE SUMMARY... i INTRODUCTION... 1 Tax Revenue Trends... 1 AGGREGATE
Indicators of a recovering economy Building permits through the roof
 Indicators of a recovering economy The resale and new home market continues to improve nationwide. The National Association of Realtors reported that previously-owned homes sold at an annual pace of 4.92
Kansas Tax Facts Supplement to the Eighth Edition. December 2016
 Kansas Tax Facts 2016 Supplement to the Eighth Edition December 2016 Kansas Legislative Research Department Room 68-W State Capitol Building 300 SW Tenth Avenue Phone: (785) 296-3181/FAX (785) 296-3824