Projections for Western North Dakota Bottineau County
|
|
|
- Eustacia Casey
- 5 years ago
- Views:
Transcription


1 Projections for Western North Dakota Bottineau County
2 Acknowledgments Analysts Dean Bangsund, NDSU Dr. Nancy Hodur, NDSU Funders North Dakota Association of Oil and Gas Producing Counties North Dakota Energy Infrastructure and Impact Office Vision West ND Moderators Deb Nelson, Vision West ND Administrator Host and Coordinator Center for Rural Entrepreneurship and DLN Consulting, Inc.
3 Employment, Housing & Population Projections Department of Agribusiness and Applied Economics North Dakota State University Dean Bangsund Dr. Nancy Hodur Research Scientist Ph: Research Assistant Professor Ph:
4 Baseline Conditions Population Economy Workforce characteristics Employment Oil and gas industry activity
5 North Dakota Population Change ND population growth outpaced all 50 states in the last four years 13 percent increase in 5 years 18 percent increase in 15 years Communities in oil and gas producing counties experienced even more rapid growth than statewide
6 Recent Population Trends Slight declines since percent increase since 2010
7 Changing Characteristics of Population State has gotten younger the only state to get younger from 2014 to 2015 For the first time since the early 1980s the number of children age 14 and under grew A sustained growth in birth rates began in 2002, 11,352 births in 2014 Increase in birth rate a result of the increase in the year cohort Continuation of aging of baby boomers Oldest boomers hit age 65 in 2011 Youngest will turn 65 in 2029 Baby boomers will influence future housing needs Population growth being driven by two factors Natural births Migration
8 Economy: Gross State Product GSP growth rate that far exceed historical trends Fastest growing state economy for the previous 4 years Statewide personal income grew by 5 percent from 2013 to 2014 Personal income grew faster than the national average in 90 percent of North Dakota counties, half grew at a rate twice that of the national average GSP decline of 6 percent in 2014 Low commodity prices in agriculture and oil and gas Other sectors saw modest growth
9 Workforce Workforce defined as population age 16 and older does not include non-resident workers or self-employed Work force has grown by 10 percent or 37,000 workers Workforce participation rate is 71 percent, the highest in the nation, very important statistic, little excess capacity Have a better understanding of the oil and gas industry workforce know there is a substantial non-resident workforce Did lose jobs in ,580 Losses concentrated in oil and gas producing counties Many of the lost jobs were held by non-resident workers Unemployment rates are still low Workforce participation rates remain high Steady labor force numbers and workforce characteristics study reinforce that notion Labor markets have improved More jobs than active resumes statewide
10 All Employment (Public and Private) R2 = Average annual change from = 4,900 jobs Average annual change from = 15,000 jobs

11 Production has declined, but production is 8 times what it was in 2007 Production as of June 20-16
12 Summary of current conditions Despite the downturn in oil and gas industry activity the state s population and economy is much larger than it was just a few years ago. Population characteristics have changed which may influence future planning We have better data and a better understanding of workforce characteristics, economic drivers Growth and industry activity has moderated substantially Dealing with uncertainty of new normal and uncertain future and what may happen under various macro-economic conditions, e.g. oil prices increase Change and growth has not been uniform, Bottineau County has not experienced similar growth Economic development and economic diversification as important as ever
13 So What is New for Our Project? Cohort component model Actual fertility and mortality rates Recent migration trends Workforce by place of work and place of residency Verified and adjusted housing supply data Include data on farmers and ranchers Oil and Gas employment numbers (ND Job Service) Housing Needs Assessment (NDSU) and general population forecast (ND Dept of Commerce-Census Office) NDSU Workforce characteristics study
14 Actual Fertility and Mortality Rates for Cohort Component Population Model current population + births deaths + net migration (in-migration out migration) = population new year
 = population new")
15 Net Migration current population + births deaths + net migration (in-migration out migration) = population new year
16 Verifying Total Housing Units Housing Inventory Rational: Concerns regarding accuracy of U.S. Census estimates of total housing units Collected actual building permit data from 12 largest cities in the state Used same computational data as the Census with actual building permit data rather than building permit data from the U.S. Census Bureau s Building Permit Survey For most jurisdictions, Census Bureau s estimates were accurate and within a few percentage points Especially true for cities with stable growth Adjusted census estimates to reflect actual housing inventory for estimates of future housing from cities and counties where data was collected For all other counties 2014 Census estimates were used for estimate of baseline housing inventory

17 Job Service Data Oil and Gas Employment
18 Forecasting Model and Research Methods Employment Modeling (retained our previous model) Dynamic adjustments for efficiencies in oil and gas industry Include other economic sectors Include secondary job creation New population and housing models
19 How Does All This Work? Step 1: What is the size of current workforce? Resident Population Participation Rate Employment Rate Resident Workforce Total Workforce Commuters Outside the region Delineated by segment of industry Non-resident Workforce
20 Step 2: How much workforce do we need? Demand Supply Future Labor Requirements Existing Labor Pool Future Scenario using Employment Model Residents Greater Less Equal Resident Workforce Nonresidents Greater Less Equal Nonresident Workforce Employment Change combined with Workforce Characteristics
21 Step 3: Incorporate labor force (needs/changes) into cohort model. Start (2015) Employment Workforce Needed Migration Period 2 Period 3 Employment Employment Workforce Needed Workforce Needed Workforce Present Workforce Present Needs/changes Needs/changes New Population New Population Available Workforce Available Workforce New Population Available Workforce
22 Step 4: Estimate housing inventory requirements. residents commuters Employment permanent service Population Permanent Single Family Apartments Mobile Housing Requirements Housing Forecasts utilized the models and assumptions applied in the North Dakota Statewide Housing Needs Assessment.
23 What future possibilities are we considering? Profitability (prices and costs)? Rig counts and drilling activity? Re-fracking? CO2 EOR? Well counts? Oil production? Restrictions on fracking?


24 Future Price Projections? Much Uncertainty.
25 Examined Three Sets of Future Conditions Scenarios* Prices** Wells Completed Per Year Rig Counts Per Year First Purchaser Prices in ND Low Moderate High Low High Low Price $25-$ Moderate Price $60-$90 1,000 1,250 1, High Price $>90 1,700 2,000 2, * Price ranges are approximate as many factors influence development activities. * Scenarios do not include re-fracking, CO2 EOR, or restrictions on fracking.


26 *Prices are approximate
27 Results/Findings Employment Trends Petroleum as a Percentage of All Employment Farm and Ranch Proprietors Non-farm and Ranch Proprietors Commuter Data Where people live that work in Bottineau County Where people work that live in Bottineau County Industry Employment Population Housing

28 Farm and Ranch Proprietors

29 Non-farm and Ranch Proprietors and Non-farm and Ranch Proprietors as a Percentage of Total Employment

30 Farm and Ranch Proprietors and Wage and Salary Employment

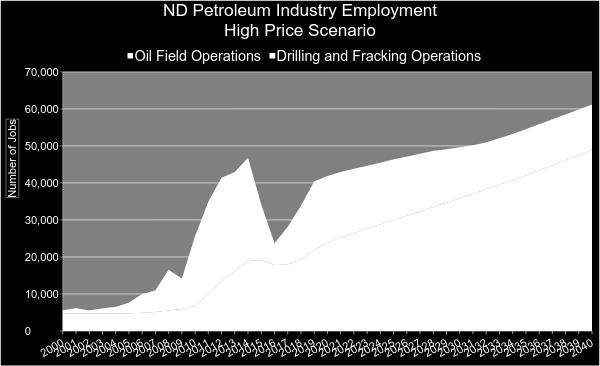
31 Oil and Gas Industry Employment as a Percentage of All Wage and Salary Employment

32 Wage and Salary Employment

33 Wage and Salary Employment, by County and State Planning Region

34 Annual Change in Wage and Salary Employment
35 Change in Employment Bottineau County Total Percent Change Average Annual Change in Jobs Average Annual Percent Change in Jobs

36 Commuter Data Where People Work and Where They Live (in flows)
")
37 Commuter Data Where People Live and Where They Work (out flows)
38 What does this mean? Employment at a specific location may/may not translate to residents of that location Employment in one location can affect population in another location Workforce is not limited to those residing in the immediate area Our modeling incorporates locational dynamics


39 Oil and Gas Industry Over Range of Potential Prices
40
41
42
43
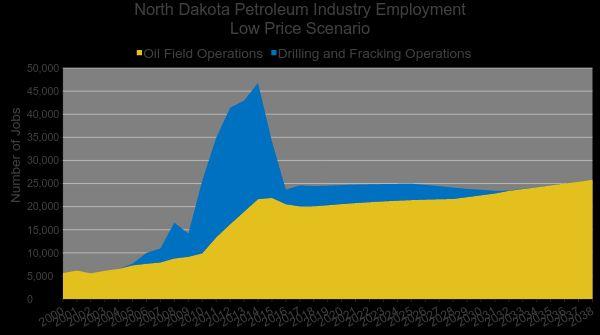
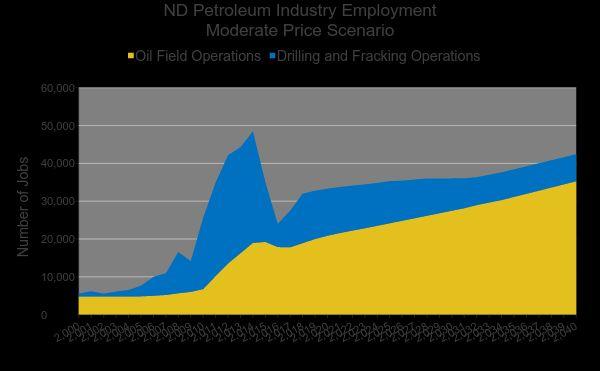
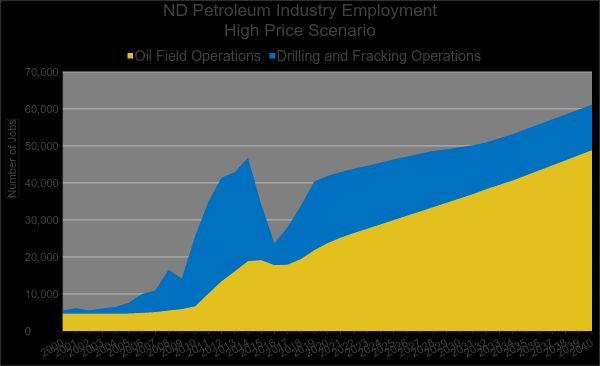
44 Employment Forecasts, Low, Moderate and High Price Scenario
45 Bottineau County Employment Projections Scenario Change from Average annual growth rate Jobs % % Low Price 2,377 2, Moderate Price 2,377 2, High Price 2,377 31,

46 Population Projections: Low, Medium and High Price Scenarios
47 Bottineau County Population Projections Change from people % Average annual growth rate % Scenario Low Price 6,636 7, Moderate Price 6,636 7,682 1, High Price 6,636 8,195 1,

48 Projected Total Housing Units Added Low Price Scenario

49 Projected Total Housing Units Added Moderate Price Scenario
50 Projected Total Housing Units Added High Price Scenario
51 Recent Trends and Other Research Findings Household Composition Trends in the mix of housing of housing Workforce characteristics Changing makeup of the population, results of state wide housing needs assessment Seniors Younger population First-time homebuyers Cost-burdened seniors Age of housing inventory

52 Characteristics: Household composition Continued increase in non-family household Continued increase in married with out children First increase in household that are married with children Potentially substantial implications for future mix of housing Source: U.S. Census Bureau, 2014 ACS 5-Year Estimates

53 Historic Distribution of Total Housing Units, by Type of Housing Source: U.S. Census Bureau, 2014 ACS 5-Year Estimates

54 Results from Workforce Characteristics Study Source: Assessment of the Oil and Gas Industry Workforce,

55 Non-Resident Workforce Intentions to Move to North Dakota YE S NO Source: Assessment of the Oil and Gas Industry Workforce,

56 Type of Housing North Dakota : n=1,158 Elsewhere: n=489 Source: Assessment of the Oil and Gas Industry Workforce,

57 Projected Change in Population, by Age, Source: 2015 North Dakota Housing Needs Assessment

58 Projected Change in the Number of Households, by Household Income, Source: 2015 North Dakota Housing Needs Assessment

59 Projected Change in Number of Households By Type of Homebuyer, Source: North Dakota Statewide Housing Needs Assessment

60 Cost-Burdened Seniors Source: U.S. Census Bureau, 2014 ACS 5-Year Estimates

61 Total Occupied Housing Units, by Year Built Source: U.S. Census Bureau, 2014 ACS 5-Year Estimates
62 Key Findings/Implications Characteristics of population are changing Increase in younger cohort has implications for housing, childcare, schools Aging of the baby boomers has substantial implications for housing for seniors Affordable housing a key issue, substantial number of cost burdened seniors Age of housing stock may be a consideration Workforce characteristics and data on commuters and non-resident workers suggest workforce will not be just local residents Communities should plan for a high degree of commuters and non-resident workers in the high price scenario Service population will likely continue to be an a more appropriate measure of public service requirements
63 Key Findings/Implications Low price environment is steady and stable with growth rates that exceed the period Moderate prices may produce excitement and challenges Sustained high prices may bring a return to challenges faced from Average annual growth of 3 percent challenging Likely result in increased and rapid demand for temporary housing The industry is becoming more efficient and will likely lower lab0r requirements in the future As the industry get larger, it becomes more stable, larger base in production and operations
64 Additional Resources Available North Dakota Statewide Housing Needs Assessment eds.html North Dakota Compass Assessment of the Oil and Gas Industry Workforce, North Dakota Kids Count NDSU Department of Agribusiness and Applied Economics Vision West NDSU Center for Social Research sion-centers ND Department of Commerce North Dakota Job Service: North Dakota s Oil and Gas Economy b/index.asp?docid=578 Census on the Map
65 Nancy Hodur, Dean Bangsund,

66 Thanks for Listening! th Avenue West, Suite G Dickinson ND VisionWest@dlnconsulting.com Website:
Williston Basin 2016: Employment, Population, and Housing Projections
 Williston Basin 2016: Employment, Population, and Housing Projections Vision West Consortium Meeting December 8, 2016 Dickinson, ND Dean A. Bangsund Department of Agribusiness and Applied Economics Nancy
Employment and Population Projections in the Williston Basin
 Employment and Population Projections in the Williston Basin Dean A. Bangsund Nancy M. Hodur Rancy C. Coon Presented to: Williston Economic Development Summit September 2-4, 2014 Background Starting in
Agribusiness and Applied Economics Report No. 708 S February 2013
 Agribusiness and Applied Economics Report No. 708 S February 2013 Estimates of Projections: Ray, Stanley, Watford City, Williston and Dickinson Nancy M. Hodur, Dean A. Bangsund, Richard Rathge, Karen Olson
Williston Basin 2012: Projections of Future Employment and Population North Dakota Summary
 Agribusiness and Applied Economics Report 704 January 2013 Williston Basin 2012: Projections of Future Employment and Population North Dakota Summary Dean A. Bangsund Nancy M. Hodur North Dakota State
Six Cities Impacts Forecasting
 Six Cities Impacts Forecasting Annual Meeting Progress Update October 26, 2016 STUDY SCOPE Impacts Forecasts for Six Participating Cities Williston Watford City Dickinson Tioga Stanley Killdeer Study Funded
Methods and Data for Developing Coordinated Population Forecasts
 Methods and Data for Developing Coordinated Population Forecasts Prepared by Population Research Center College of Urban and Public Affairs Portland State University March 2017 Table of Contents Introduction...
Lehigh Valley Planning Commission
 Lehigh Valley Planning Commission 961 Marcon Boulevard, Suite 310 Allentown, Pennsylvania 18109 Telephone: 610-264-4544 or 1-888-627-8808 E-mail: lvpc@lvpc.org POPULATION PROJECTIONS FOR LEHIGH AND COUNTIES:
Ravenna s most significant growth occurred before Between 1960 and 1980 the city s population declined by 8.5%.
 DRAFT Ravenna Comprehensive Plan Draft May 2008 1 A Profile of Ravenna This section examines demographic trends that will affect Ravenna. The analysis examines population and demographic dynamics, including
Community and Economic Development
 192 193 194 195 196 197 198 199 2 21 22 23 24 2-1 Lycoming County Comprehensive Plan Update 218 Community and Economic Development At a Glance Over the last ten years, has experienced a decline in population,
Sussex Demographic and Labor Market Trends
 Sussex Demographic and Labor Market Trends Ed Simon (302) 672-6845 edward.simon@state.de.us October 2013 Introduction Statistical Update Differences among the regions in Sussex Demographic, economic and
Sussex Demographic and Labor Market Trends
 Sussex Demographic and Labor Market Trends Ed Simon (302) 672-6845 edward.simon@state.de.us October 2014 Introduction Statistical Update Differences among the regions in Sussex Demographic, economic and
Rifle city Demographic and Economic Profile
 Rifle city Demographic and Economic Profile Community Quick Facts Population (2014) 9,289 Population Change 2010 to 2014 156 Place Median HH Income (ACS 10-14) $52,539 State Median HH Income (ACS 10-14)
Population Change in the West Data Sources and Methods December, 2014
 Population Change in the West Data Sources and Methods December, 2014 This document describes the data sources and methods used to generate the interactive data tool, Migration and Population Trends in
The Case of Dickinson
 Agribusiness and Applied Economics Report 695 Modeling Employment, Housing, and Population in Western North Dakota: The Case of Dickinson Dean Bangsund Nancy Hodur Richard Rathge Karen Olson NDSU is an
E APPENDIX METHODOLOGY FOR LAND USE PROJECTIONS IN THE BOSTON REGION INTRODUCTION
 E APPENDIX METHODOLOGY FOR LAND USE PROJECTIONS IN THE BOSTON REGION INTRODUCTION The Metropolitan Area Planning Council (MAPC), the region s land use planning agency, is responsible for preparing detailed
Population and Labor Force Projections for New Jersey: 2008 to 2028
 Population and Labor Force Projections for New Jersey: 2008 to 2028 by Sen-Yuan Wu, Division of Labor Market and Demographic Research Similar to other northern states, New Jersey has had slower population
OVERVIEW OF THE SAN DIEGO REGION Current Conditions and Future Trends
 OVERVIEW OF THE SAN DIEGO REGION Current Conditions and Future Trends Why do we need a Regional Comprehensive Plan? Let s examine the facts. It helps to look at some objective statistical information that
Sussex Demographic and Labor Market Trends
 Sussex Demographic and Labor Market Trends Ed Simon (302) 672-6845 edward.simon@state.de.us October 28, 2009 Introduction Statistical Update Changing economic and labor market conditions Impact on population
Population and Household Projections Northeast Avalon Region
 Northeast Avalon Region June 2008 Prepared By: Economic Research and Analysis Division Economics and Statistics Branch Department of Finance P.O. Box 8700 St. John s, NL A1B 4J6 Telephone: (709) 729-3255
Population & Demographic Analysis
 Population & Demographic Analysis The United States Census Bureau conducts a nationwide census every ten years. This census compiles information relating to the socio-economic characteristics of the entire
The Province of Prince Edward Island Employment Trends and Data Poverty Reduction Action Plan Backgrounder
 The Province of Prince Edward Island Employment Trends and Data Poverty Reduction Action Plan Backgrounder 5/17/2018 www.princeedwardisland.ca/poverty-reduction $000's Poverty Reduction Action Plan Backgrounder:
Clay County Comprehensive Plan
 2011-2021 Clay County Comprehensive Plan Chapter 1: Demographic Overview Clay County Comprehensive Plan Demographic Overview Population Trends This section examines historic and current population trends
Marshall & Lyon County Economic Update
 Marshall & Lyon County Economic Update Cameron Macht, Regional Analyst Minnesota Department of Employment and Economic Development 320-231-5174 ext. 7535 cameron.macht@state.mn.us www.deed.state.mn.us/lmi
Environmental Justice Task Force
 Attachment 5 Year 2050 Population and Economic Forecasts #211068v1 Environmental Justice Task Force April 16, 2013 1 Introduction Population and economic projections serve as a basis for updating the regional
DEMOGRAPHY AND THE ECONOMY
 DEMOGRAPHY AND THE ECONOMY David Keyser State Demography Office September 22, 2011 Colorado.gov/demography Demography Powerful Big changes often predictable Informative Today Information about us Role
Sussex Demographic and Labor Market Trends
 Sussex Demographic and Labor Market Trends Ed Simon (302) 672-6845 edward.simon@state.de.us October 2012 Introduction Statistical Update Economic and labor market update for 2012 Is Sussex doing better?
MORGANTOWN METROPOLITAN STATISTICAL AREA OUTLOOK COLLEGE OF BUSINESS AND ECONOMICS. Bureau of Business and Economic Research
 2013 MORGANTOWN METROPOLITAN STATISTICAL AREA OUTLOOK COLLEGE OF BUSINESS AND ECONOMICS Bureau of Business and Economic Research 1 MORGANTOWN METROPOLITAN STATISTICAL AREA OUtlook 2013 EXECUTIVE SUMMARY
NSW Long-Term Fiscal Pressures Report
 NSW Long-Term Fiscal Pressures Report NSW Intergenerational Report 2011-12 Budget Paper No. 6 Table of Contents Executive Summary... i Chapter 1: Background to the Report 1.1 Fiscal Sustainability... 1-1
Richmond Community Schools
 2017 Study Prepared by: Carl H. Baxmeyer, AICP, REFP Senior Planner Wightman & Associates, Inc. 2303 Pipestone Road Benton Harbor, MI 49022 cbaxmeyer@wightman-assoc.com Phone: (269) 487-9699 [direct]
BROWARD COUNTY LABOR FORCE
 BROWARD COUNTY LABOR FORCE Broward County s has a workforce of 978,000 people, including 54,000 self-employed. Twenty-three percent of residents commute to a job outside Broward County and five percent
Big Chino Water Ranch Project Impact Analysis Prescott & Prescott Valley, Arizona
 Big Chino Water Ranch Project Impact Analysis Prescott & Prescott Valley, Arizona Prepared for: Central Arizona Partnership August 2008 Prepared by: 7505 East 6 th Avenue, Suite 100 Scottsdale, Arizona
Nova Scotia Retirements drive rising hiring requirements, despite muted growth outlook
 CONSTRUCTION & MAINTENANCE LOOKING FORWARD Nova Scotia Retirements drive rising hiring requirements, despite muted growth outlook The Nova Scotia construction industry has seen significant expansion over
Supplemental Information and Analysis for Blount County Plans Table of Contents
 Supplemental Information and Analysis for Blount County Plans Table of Contents Introduction page 1 Time Horizon page 3 Population Growth Historical Trends page 3 Population Projections to 2030 page 5
Regional Socio-Economic Profile
 Overview The central work of the State Demography Office is the research and production of population data and information and of the forces (fertility, mortality, migration) that lead to population change.
In contrast to its neighbors and to Washington County as a whole the population of Addison grew by 8.5% from 1990 to 2000.
 C. POPULATION The ultimate goal of a municipal comprehensive plan is to relate the town s future population with its economy, development and environment. Most phases and policy recommendations of this
CITY OF STRATFORD OFFICIAL PLAN REVIEW BACKGROUND REPORT DEMOGRAPHIC AND ECONOMIC PROFILE AND POPULATION AND HOUSING GROWTH FORECAST NOVEMBER 21, 2012
 CITY OF STRATFORD OFFICIAL PLAN REVIEW BACKGROUND REPORT DEMOGRAPHIC AND ECONOMIC PROFILE AND POPULATION AND HOUSING GROWTH FORECAST NOVEMBER 21, 2012 IN ASSOCIATION WITH: CONTENTS Page 1. INTRODUCTION
The Beehive Shape: Provisional 50-Year Demographic and Economic Projections for the State of Utah,
 Policy Brief October 2016 The Beehive Shape: Provisional 50-Year Demographic and Economic Projections for the State of Utah, 2015-2065 Authored by: Mike Hollingshaus, Ph.D., Emily Harris, M.S., Catherine
Eligibility for Child Care Subsidies of Parents with Child Support Income
 Eligibility for Child Care Subsidies of Parents with Child Support Income Emma Caspar Steven T. Cook Institute for Research on Poverty University of Wisconsin Madison November 26 This report has been prepared
HEMSON C o n s u l t i n g L t d.
 GROWTH OUTLOOK TO 2036 City of Greater Sudbury DRAFT C o n s u l t i n g L t d. May 2013 TABLE OF CONTENTS EXECUTIVE SUMMARY... 1 I II III INTRODUCTION AND PURPOSE... 3 POSITIVE GROWTH OUTLOOK FOR GREATER
Outlook for the Hawai'i Economy
 Outlook for the Hawai'i Economy May 3, 2001 Dr. Carl Bonham University of Hawai'i Economic Research Organization Summary The Hawaii economy entered 2001 in its best shape in more than a decade. While the
Entrepreneurship in the Nebraska Economy. Eric Thompson (November 15, 2006)
") Entrepreneurship in the Nebraska Economy Eric Thompson (November 15, 2006) Entrepreneurs benefit from the freedom, self-reliance and opportunity to build wealth that accompanies business ownership. In
Entrepreneurship in the Nebraska Economy Eric Thompson (November 15, 2006) Entrepreneurs benefit from the freedom, self-reliance and opportunity to build wealth that accompanies business ownership. In
2. Demographics. Population and Households
 2. Demographics This analysis describes the existing demographics in. It will be used to identify the major demographic trends that may have an effect on public policy in in the next decade. Demographic
Cumberland Comprehensive Plan - Demographics Element Town Council adopted August 2003, State adopted June 2004 II. DEMOGRAPHIC ANALYSIS
 II. DEMOGRAPHIC ANALYSIS A. INTRODUCTION This demographic analysis establishes past trends and projects future population characteristics for the Town of Cumberland. It then explores the relationship of
THE ECONOMY AND POPULATION OF THE SOUTHEASTERN WISCONSIN REGION
 THE ECONOMY AND POPULATION OF THE SOUTHEASTERN WISCONSIN REGION NEWSLETTER JANUARY214 The reports were developed under the guidance of the SEWRPC Advisory Committee on Regional Population and Economic
POPULATION 1 I. INTRODUCTION BACKGROUND POLICY:
 POPULATION 1 POLICY: FOR PLANNING PURPOSES, JACKSON COUNTY SHALL MONITOR POPULATION TRENDS AND ASSIST IN THE DEVELOPMENT OF POPULATION FORECASTS. THESE FORECASTS SHALL BE DEVELOPED IN COOPERATION WITH
Texas: Demographically Different
 FEDERAL RESERVE BANK OF DALLAS ISSUE 3 99 : Demographically Different A s the st century nears, demographic changes are reshaping the U.S. economy. The largest impact is coming from the maturing of baby
Wyoming Economic and
 Wyoming Economic and Demographic Data Tools for your Toolbox Presented to: Wyoming Association of Municipal i Clerks and Treasurers (WAMCAT) 2011 Region VIII & WAMCAT Winter Workshop Jackson, Wyoming January
Investment Company Institute and the Securities Industry Association. Equity Ownership
 Investment Company Institute and the Securities Industry Association Equity Ownership in America, 2005 Investment Company Institute and the Securities Industry Association Equity Ownership in America,
A Profile of Non-Labor Income
 A Profile of Non-Labor Income Selected Geographies: Yellowstone County, MT Benchmark Geographies: Produced by Economic Profile System EPS May 21, 2015 About the Economic Profile System (EPS) About EPS
CRP 566 DEMOGRAPHIC ANALYSIS INTRODUCTION. Dave Swenson Department of Economics College of Agriculture and Life Sciences Iowa State University
 CRP 566 DEMOGRAPHIC ANALYSIS INTRODUCTION Dave Swenson Department of Economics College of Agriculture and Life Sciences Iowa State University OBJECTIVES Understanding of the role of demographic analysis
8,400 NEW ENTRANTS 2,600 (-6.5%) EMPLOYMENT CHANGE
 EMPLOYMENT CHANGE") CONSTRUCTION & MAINTENANCE LOOKING FORWARD Manitoba Construction investment slows from the peak HIGHLIGHTS 2018 2027 The Manitoba construction industry has seen a significant expansion over the past decade,
CONSTRUCTION & MAINTENANCE LOOKING FORWARD Manitoba Construction investment slows from the peak HIGHLIGHTS 2018 2027 The Manitoba construction industry has seen a significant expansion over the past decade,
10,100 NEW ENTRANTS 1,300 (3%) EMPLOYMENT CHANGE
 EMPLOYMENT CHANGE") CONSTRUCTION & MAINTENANCE LOOKING FORWARD SASKATCHEWAN The pace slows ahead of new opportunities HIGHLIGHTS 2018 2027 2027 The Saskatchewan construction industry has seen significant expansion over the
CONSTRUCTION & MAINTENANCE LOOKING FORWARD SASKATCHEWAN The pace slows ahead of new opportunities HIGHLIGHTS 2018 2027 2027 The Saskatchewan construction industry has seen significant expansion over the
Socio-Demographic Projections for Autauga, Elmore, and Montgomery Counties:
 Information for a Better Society Socio-Demographic Projections for Autauga, Elmore, and Montgomery Counties: 2005-2035 Prepared for the Department of Planning and Development Transportation Planning Division
Albany City School District
 Albany City School District Enrollment and Demographics Dr. Jim Butterworth, CASDA Introduction Projection: Projects the past and present demographics into the future in order to estimate population. Forecast:
Socio-economic Series Long-term household projections 2011 update
 research highlight October 2011 Socio-economic Series 11-008 INTRODUCTION This Research Highlight presents an update of the projections of household growth for Canada reported in the 2009 Canadian Housing
UNEMPLOYMENT RATE Seasonally Adjusted. EMPLOYMENT BY INDUSTRY In Thousands. NON-FARM EMPLOYMENT In Thousands JUNE 2014 US = 6.1% MT = 4.
 JUNE 2014 UNEMPLOYMENT RATE Seasonally Adjusted US = 6.1% Industry Employment EMPLOYMENT BY INDUSTRY In Thousands Total Non-Agricultural Natural Resources & Mining June 2014 (prelim) May 2014 Net Change
Business in Nebraska
 Business in Nebraska VOLUME 61 NO. 684 PRESENTED BY THE UNL BUREAU OF BUSINESS RESEARCH (BBR) OCTOBER 2006 Labor Force Implications of Population Decline in Non-Metropolitan Nebraska By Dr. Randy Cantrell,
NEWFOUNDLAND & LABRADOR
 CONSTRUCTION & MAINTENANCE LOOKING FORWARD NEWFOUNDLAND & LABRADOR At the midpoint of the down-cycle; stable demands ahead HIGHLIGHTS 2018 2027 2027 The Newfoundland and Labrador construction industry
CHAPTER 2: SOCIO-ECONOMIC PROFILE
 2040 Regional Transit Element CHAPTER 2: SOCIO-ECONOMIC PROFILE STUDY AREA The study area for this 2040 RTE is the NFRMPO region, also designated by the Colorado Department of Transportation (CDOT) as
SASKATCHEWAN Re-calibration ahead as resource expansion slows
 CONSTRUCTION & MAINTENANCE LOOKING FORWARD SASKATCHEWAN Re-calibration ahead as resource expansion slows HIGHLIGHTS 2017 2026 DISTRIBUTION OF CONSTRUCTION EMPLOYMENT IN 2017, SASKATCHEWAN Construction
THE COSTS AND BENEFITS OF GROWTH: LAWRENCE, KS,
 THE UNIVERSITY OF KANSAS WORKING PAPERS SERIES IN THEORETICAL AND APPLIED ECONOMICS THE COSTS AND BENEFITS OF GROWTH: LAWRENCE, KS, 1990-2003 Joshua L. Rosenbloom University of Kansas and NBER May 2005
THE BABY BOOM CHART BOOK 1996
 Deutsche Morgan Grenfell C.J. Lawrence Established Portfolio Strategy Service #5 The High-Tech Revolution In The US of @ # The US Economy s Mega-Trends #7, In # Liquidity Story Is Wildly Bullish Topical
Jason Henderson Vice President and Branch Executive Federal Reserve Bank of Kansas City Omaha Branch September 2012
 Jason Henderson Vice President and Branch Executive September 2012 The views expressed are those of the author and do not necessarily reflect the opinions of the Federal Reserve Bank of Kansas City or
Her Majesty the Queen in Right of Canada (2018) All rights reserved
 All rights reserved") 0 Her Majesty the Queen in Right of Canada (2018) All rights reserved All requests for permission to reproduce this document or any part thereof shall be addressed to the Department of Finance Canada.
0 Her Majesty the Queen in Right of Canada (2018) All rights reserved All requests for permission to reproduce this document or any part thereof shall be addressed to the Department of Finance Canada.
Monitoring the Nantucket Economy An Update to the 1993 Nantucket Economic Base Study
 Monitoring the Nantucket Economy An Update to the 1993 Nantucket Economic Base Study June 2002 Sponsored by: The Nantucket Planning and Economic Development Commission and The Nantucket Island Chamber
NEBRASKA SNAPS BACK By the Bureau of Business Research and the Nebraska Business Forecast Council
 VOLUME 72, NO. 721 PRESENTED BY THE UNL BUREAU OF BUSINESS RESEARCH (BBR) DECEMBER 2017 NEBRASKA SNAPS BACK By the Bureau of Business Research and the Nebraska Business Forecast Council U.S. Macroeconomic
Economic Impact of the Oklahoma Manufacturing Sector Winter 2018 Prepared by Prepared for
 Economic Impact of the Oklahoma Manufacturing Sector Winter 2018 Prepared by Prepared for Population, Labor Force, & Employment Summary Population in any given year is determined by adding the net natural
The Graying of Hawaii s Workforce 2006
 The Graying of Hawaii s Workforce 2006 April 2008 Hawaii State Department of Labor and Industrial Relations Research and Statistics Office Quality Information for Informed Decisions Introduction The Graying
Napier City Socio-Demographic Profile Report prepared for the Napier City Council by Professor Natalie Jackson
 Napier City Socio-Demographic Profile 1986-2011 Report prepared for the Napier City Council by Professor Natalie Jackson November 2011 Table of Contents EXECUTIVE SUMMARY 4 What you need to know about
Coping with Population Aging In China
 Coping with Population Aging In China Copyright 2009, The Conference Board Judith Banister Director of Global Demographics The Conference Board Highlights Causes of Population Aging in China Key Demographic
2017 ECONOMIC AND WORKFORCE PROFILE Dane County
 2017 ECONOMIC AND WORKFORCE PROFILE Dane County STATE OF WISCONSIN DETI-17957-DAN-P (R. 3/2018) Percentage of Total Popula on, Ages 65 and Older Wisconsin now has more people employed and more private
MANITOBA Building to a plateau
 CONSTRUCTION & MAINTENANCE LOOKING FORWARD MANITOBA Building to a plateau HIGHLIGHTS 2017 2026 DISTRIBUTION OF CONSTRUCTION EMPLOYMENT IN 2017, MANITOBA Construction activity in Manitoba is expected to
Papers presented at the ICES-III, June 18-21, 2007, Montreal, Quebec, Canada
 Future Developments In the Bureau of Labor Statistics Business Employment Dynamics Data By Kristin Fairman and Sheryl Konigsberg Division of Administrative Statistics and Labor Turnover Bureau of Labor
A Profile of Non-Labor Income
 A Profile of Non-Labor Income Selected Geographies: Shawano County, WI Benchmark Geographies: U.S. Produced by Economic Profile System EPS January 12, 2016 About the Economic Profile System (EPS) About
Metro Houston Population Forecast
 Metro Houston Population Forecast Projections to 2050 Prepared by the Greater Houston Partnership Research Department Data from Texas Demographic Center www.houston.org April 2017 Greater Houston Partnership
Putting Maine Job Growth in Context, Report for Labor Commissioner Jeanne Paquette, May, 2014
 Maine State Library Maine State Documents Center for Workforce Research and Information Documents Labor 9-4-2014 Putting Maine Job Growth in Context, Report for Labor Commissioner Jeanne Paquette, May,
Population Trends in the Larger Greater Yellowstone Region Population Trends in the 8-County Area Surrounding Park County, WY
 Summary of Findings Population Trends in the Larger Greater Yellowstone Region A 24- county area encompassing Park County, Wyoming, and Yellowstone National Park and extending in all directions (shown
Economic Profile. Capital Crossroads. a vision forward
 Economic Profile Capital a vision forward This profile was prepared by: Liesl Eathington Department of Economics State University phone: (515) 294 2954 email: leathing@iastate.edu 5/23/2012 Distribution
ECONorthwest ECONOMICS FINANCE PLANNING
 ECONorthwest ECONOMICS FINANCE PLANNING DATE: July 13th, 2015 TO: TriMet Board of Directors FROM: Andrew Dyke, Senior Economist SUBJECT: PORTLAND ECONOMIC RECOVERY ANALYSIS Introduction TriMet contracted
NEW ENTRANTS 300 (6.8%) EMPLOYMENT CHANGE
 EMPLOYMENT CHANGE") CONSTRUCTION & MAINTENANCE LOOKING FORWARD Prince Edward Island Steady non-residential growth follows the residential boom HIGHLIGHTS 2018 2027 Prince Edward Island s construction labour market has been
CONSTRUCTION & MAINTENANCE LOOKING FORWARD Prince Edward Island Steady non-residential growth follows the residential boom HIGHLIGHTS 2018 2027 Prince Edward Island s construction labour market has been
Demographic Future of the Southern California Region
 Demographic Future of the Southern California Region Simon Choi, Ph.D Chief of Research & Forecasting Southern California Association of Governments(SCAG) Southern California Water Dialogue, Metropolitan
Life Science Industries Increase Indiana's Personal Income
 Life Science Industries Increase Indiana's Personal Income TIMOTHY F. SLAPER Director of Economic Analysis, Indiana Business Research Center, Indiana University Kelley School of Business A measure of the
Sussex Demographic and Labor Market Trends
 Sussex Demographic and Labor Market Trends Ed Simon (302) 672-6845 edward.simon@state.de.us October 29, 2008 Introduction Demographic Update Update on short-term and long-term trends How Sussex is very
2017 Farm Bank Performance Report
 2017 Farm Bank Performance Report 2017 Farm Bank Performance Report Key Findings The banking industry is the nation s most important supplier of credit to agriculture providing nearly 50 percent of all
TECHNICAL MEMORANDUM
 08/29/00 Page 1 TECHNICAL MEMORANDUM SUBJECT: Green River Basin Plan Population Projections PREPARED BY: Gary Watts, Watts & Associates, Inc. Introduction This memorandum presents population projections
POTOMAC HIGHLANDS ECONOMIC OUTLOOK
 POTOMAC HIGHLANDS ECONOMIC OUTLOOK 2018-2023 Potomac Highlands Economic Outlook 2018-2023 is published by: Bureau of Business & Economic Research West Virginia University College of Business & Economics
Construction and Maintenance Looking Forward Manitoba
 2016 2025 Key Highlights Construction and Maintenance Looking Forward Manitoba New hydro development, transmission lines, pipelines and infrastructure projects will boost employment over the next few years,
Why is understanding our population forecasts important?
 % Population Growth per annum Population Why is understanding our population forecasts important? Understanding the ACT s population growth and its demographic trends, is fundamental to longterm strategic
Sussex Demographic and Labor Market Trends
 Sussex Demographic and Labor Market Trends Ed Simon (302) 672-6845 edward.simon@state.de.us October 2011 Introduction Statistical Update Economic and labor market update for 2011 How does Sussex compare
2017 Regional Indicators Summary
 2017 Regional Indicators Summary Regional Indicators Regional indicators are a specific set of data points that help gauge the relative health of the region in a number of areas. These include economy,
THE BABY BOOM CHART BOOK 1997
 Deutsche Morgan Grenfell US Equity Research Portfolio Strategy Service # The Economic Consequences Of The Peace #3 Conference Call With Alan Blinder #37 New Era Recession? #3 Fed s Stock Market Model Finds
THE RHODE ISLAND ECONOMIC OUTLOOK AND FORECAST: MATCHING SKILLS TO JOBS
 THE RHODE ISLAND ECONOMIC OUTLOOK AND FORECAST: MATCHING SKILLS TO JOBS Through April of 2012, Rhode Island continued to have the second highest unemployment rate in the United States with 62,178 people
GROWTH STRATEGY REPORT FOR THE OKANAGAN SIMILKAMEEN REGION, 2004 to 2031
 GROWTH STRATEGY REPORT FOR THE OKANAGAN SIMILKAMEEN REGION, 2004 to 2031 Population Age Profile, Okanagan Similkameen RD, 2004 and 2031 100 95 90 85 80 75 70 65 60 55 50 45 40 35 30 25 20 15 10 5 0 Female
SUBMITTED FOR THE HEARING RECORD UNITED STATES HOUSE OF REPRESENTATIVES COMMITTEE ON WAYS AND MEANS
 SUBMITTED FOR THE HEARING RECORD UNITED STATES HOUSE OF REPRESENTATIVES COMMITTEE ON WAYS AND MEANS HOW TAX REFORM WILL GROW OUR ECONOMY AND CREATE JOBS MAY 18, 2017 Submitted By: The American Farm Bureau
Construction and Maintenance Looking Forward Alberta
 2014 2023 Key Highlights Construction and Maintenance Looking Forward Alberta Alberta continues to lead Canada s construction industry; adding jobs and building the productive capacity of the provincial
Indicators of the Kansas Economy
 Governor s Council of Economic Advisors Indicators of the Kansas Economy A Review of Economic Trends and the Kansas Economy 1000 S.W. Jackson St. Suite 100 Topeka, KS 66612-1354 Phone: (785) 296-0967 Fax:
Hastings District Socio Demographic Profile Report prepared for the Hastings District Council by Professor Natalie Jackson
 Hastings District Socio Demographic Profile 1986 2011 Report prepared for the Hastings District Council by Professor Natalie Jackson November 2011 Table of Contents EXECUTIVE SUMMARY 4 What you need to
Projections for Palmerston North
 1 Projections for Palmerston North 2006-2031 Draft for consultation Prepared by: Peter Crawford Jason Pilkington Kirsten Wierenga July 2008 1 2 Table of Contents Executive Summary 3 Introduction 6 Overview
Economic Impacts Associated with Improvements to Storm Lake
 Daniel Otto, Professor and Extension Economist Economics Department Iowa State University Dec. 2004 Economic Impacts Associated with Improvements to Storm Lake This report analyzes the economic impacts
Regional Economic Benchmarking Report For Aiken County 2016 Update
 Regional Economic Benchmarking Report For Aiken County 2016 Update Commissioned by the Greater Aiken Chamber of Commerce and the Economic Development Partnership of Aiken, Edgefield and Saluda Counties,