Initial Transportation Asset Management Plan
|
|
|
- Jesse Gordon Ray
- 5 years ago
- Views:
Transcription

1 Initial Transportation Asset Management Plan

2
3 Table of Contents Acronym Table Introduction Act 51 Michigan Public Act 51 of 1951 Program Development Call For Projects Process Life Cycle Planning Risk Management Process Inventory and Condition Analysis Financial Plan Investment Strategies Performance Gap Analysis Conclusion: Closing the Gap BCFS CFP CNG CPM EDMC FAE FAST FHWA FY GF HTF IRI ITS MAP-21 MDOT MPO MTF MTPA NBI NBIS NHS PASER Bridge Condition Forecasting System Call for Projects Compressed Natural Gas Capital Preventive Maintenance Elemental Decomposition and Multi-Criteria Federal Aid-Eligible Fixing America s Surface Transportation Act Federal Highway Administration Fiscal Year State General Fund Federal High Trust Fund International Roughness Index Intelligent Transportation System Moving Ahead for Progress in the 21st Century Act Michigan Department of Transportation Metropolitan Planning Organization Michigan Transportation Fund Michigan Transportation Planning Association National Bridge Inventory National Bridge Inspection Standards National Highway System Pavement Surface and Evaluation Rating PCFS RQFS RSL RTF SOGR STC STF STIP STPD TAMC TAMP TIP TOC TPM Pavement Condition Forecasting System Road Quality Forecasting System Remaining Service Life Rural Task Force State of Good Repair State Transportation Commission State Trunkline Fund Statewide Transportation Improvement Program Statewide Transportation Planning Division Transportation Asset Management Council Transportation Asset Management Plan Transportation Improvement Program Traffic Operations Center Transportation Performance Measure
4
.")

5 Introduction In 2012, the Moving Ahead for Progress in the 21st Century Act (MAP-21) began a national effort to implement a performance-based approach to transportation investment decision-making. That effort was strengthened in 2015 by the Fixing America s Surface Transportation Act (FAST Act). The performance goals enumerated in MAP-21 and affirmed by the FAST Act address safety, infrastructure condition, congestion, system reliability, economic vitality, and environmental sustainability. Implementing these new federal performance management requirements nationwide has been no small task. It has been a lengthy process, one that is still in progress. Data needs to be collected for new federal performance measures such as pavement rutting, cracking and faulting. New tools are still needed to accurately measure and project pavement performance using the new measures as well as the International Roughness Index (IRI). Performance targets are still being discussed here in Michigan, as MDOT works cooperatively with its metropolitan planning organization (MPO) partners to develop targets according to federal due dates. The new federal performance measures may, over time, prompt some changes to Michigan s decades-long approach to asset management and performance measurement. In 1997, the Michigan State Transportation Commission (STC) approved 10-year aspirational condition goals for Michigan s freeway (95 percent good/fair) and non-freeway (85 percent good/fair) state trunkline systems, based on pavement distress. A year later, the STC approved similar goals for Michigan freeway and non-freeway bridges. In the decade that followed, MDOT worked diligently to achieve those goals using its asset management process, as well as measurement and forecasting tools it had developed for pavement distress. In 2007, the agency successfully achieved its 10-year condition goals for both pavements and bridges. MDOT s asset management approach linked data, goals, investment strategies, programs, and projects in a systematic process to ensure achievement of desired results. Expanding on MDOT s demonstrated success with asset management, the Michigan Legislature in 2002 created the Transportation Asset Management Council (TAMC). The TAMC s charge was to implement asset management practices for federal-aid-eligible highways across state and local jurisdictions. Working from MDOT s example, the group developed tools that local agencies could use, as well as a methodology that all agencies could agree on for data collection and analysis. As a result, several hundred road agencies work together each year through their regional planning agencies and MPOs to gather performance data on almost 37,000 miles of federal-aid-eligible highway pavements and more than 9,000 highway bridges across the state. The development of this Initial TAMP is just one step in a federal process that may take several years to be fully implemented. It is intended as a preliminary document, including a description of the processes used in Michigan. Once MPO targets are set and new federal performance measures begin to be more fully implemented, a final TAMP will be completed by June 2019, as required by law. It is possible, even likely, that as data on the new federal performance measures (IRI, rutting, cracking, faulting) becomes available, it may differ from the data that Michigan has previously developed since the new data will relate to different aspects of road condition. The focus of the Initial TAMP, consistent with federal guidance, is on the Interstate and the National Highway Systems (NHS), and the national performance measures for those. Interstate and NHS pavements and bridges, while important from a national perspective, are just a subset of the total transportation infrastructure in Michigan. Michigan s history of asset management and performance measurement helps set the context for the development of this asset management plan, but the focus of this plan is just on those assets initially required by the federal government, Interstate and NHS pavements and bridges. The asset management planning process is led by the Bureau of Transportation Planning and Bureau of Development and engages all facets of the department to deliver the comprehensive and evolving Five-Year Transportation Program on an annual basis Transportation Asset Management Plan 2018 Transportation Asset Management Plan 1
.")
6 Some 82 percent of the NHS is managed by MDOT. The remaining 18 percent of Michigan s NHS is operated, preserved and maintained by 84 local road agencies (66 cities and 18 counties or county road commissions). The entire road network in Michigan is comprised of 122,115 miles. The TAMP focuses on the most critical portion of the system the NHS system, which encompasses 6,472 miles. The roadway components addressed in the report are shown in Figure 1. Figure 1: Michigan s Road Network 122,115 miles Total 1 1 Total includes roads not under MDOT or local jurisdiction, such as state park or federal roads. 2 Michigan Department of Transportation

7 This Initial TAMP describes the asset management processes by which MDOT makes its program and project decisions. It also includes inventory and condition information, a description of investment strategies, and financial and performance gap analyses based on four pavement investment strategies outlined in federal guidance: Achieve the national goals: No more than 5 percent poor Interstate pavements; no more than 10 percent poor bridges. Preserve the condition of the pavement and bridge assets: Maintain current condition for Interstate and NHS pavements and bridges. Achieve and sustain a desired State of Good Repair (SOGR): SOGR aspirational goals for Interstate and NHS pavements and bridges based on MDOT s current goals for these systems. Constrained Investment: The outcome of investment of the funds reasonably expected to be available for Interstate and NHS pavement and bridges Transportation Asset Management Plan 3

8 The chapters of this Initial TAMP are based on the most recent available data and include: Program Development Call For Projects (CFP) Process a description of MDOT s CFP process used to develop a list of pavement and bridge projects for the State Transportation Improvement Program that is intended to make progress toward performance goals, based on the investment strategies, life cycle planning, and potential risks. Life Cycle Planning a description of the processes used to calculate life cycle impacts of the proposed investment strategies on pavements and bridges. Risk Management Process a description of the process used to assess risks and develop a Risk Management Plan as required by regulations. Inventory and Condition Analysis a summary of the lane and route miles of pavement, as well as the deck area and number of bridges on the NHS and their current condition. Financial Plan a description of state, federal and local revenues anticipated to be available for investment in the NHS over the next 10 years, including the process used to develop estimates. Investment Strategies a description of investment strategies that are analyzed to determine the best investment strategy to help achieve progress toward the performance goal and a description of the process by which investment strategies guide the allocation of capital resources to achieve the goals established. Performance Gap Analysis this chapter will explain what performance gaps are currently anticipated based on the identified set of goals, including the process used to address the following: 1) Targets for asset condition of NHS pavements and bridges; 2) Gaps, if any, in the performance of the NHS that affect NHS pavements and bridges; and 3) Alternative strategies to close or address the identified gaps. 4 Michigan Department of Transportation


9 Program Development Call for Projects Process MDOT takes an asset management approach to managing pavement and bridge (highway) investments. Asset management is simply a strategic approach to linking data, goals, investment strategies, programs, and projects into a systemic process to ensure achievement of a desired result. This strategic approach can be described in a circular model as shown here. Figure 2: Balancing Investments Asset Management Approach Steps in the asset management process are: 1. Goals and objectives are established. 2. System inventory and condition data are collected. 3. The condition data are analyzed, and rates of deterioration are computed. 4. Performance measures and standards are set or reaffirmed. 5. Life cycle network analysis is performed using forecasting tools. 6. Gaps in funding and performance and risk factors are evaluated. 7. Investment strategies are analyzed and selected. 8. The selected investment strategies are implemented through the development of programs, selection of projects, and use of practices that fit into the investment strategies. 9. The process and system are monitored and adjusted based on the outcome of the projects and programs that were implemented. MDOT s highway program development process is a yearlong, multistage process as shown in Figure 2. MDOT continues to emphasize and strengthen partnering efforts with transportation stakeholders and the general public throughout this process. MDOT also continues to implement processes developed at workshops and stakeholder meetings to incorporate context-sensitive solutions into transportation projects, and seeks public input from a variety of sources on future Five-Year Transportation programs. MDOT is committed to improving its process of tracking public engagement at the regional level to enhance local communication and follow-up with transportation industry partners and the public Transportation Asset Management Plan 5


10 Program Development Call for Projects Process Figure 3: Five-Year Transportation Program Development Process Transportation Program Development Key Steps Develop Revenue Estimates The anticipated funding available and cost of future work constrain program development. State and federal revenue available for the capital program is forecasted based on historical trends, federal funding acts, and state legislation. Future funding that will be available for asset management is projected. Develop Investment Strategies MDOT trunkline investment strategies have been driven by its vision and goals. Within the vision and goals are key components that help enhance the department s practices, essentially allowing the department to be better, faster, cheaper, safer, and smarter. The STC establishes these policies, goals, and objectives that provide the basis for investment strategy decisions. Highway Goals 90 percent in fair or better pavement condition. 90 percent rate fair or better in ride quality. Bridge Goals 95 percent freeway bridges in fair or better condition. 85 percent non-freeway bridges in fair or better condition. MDOT uses forecasting tools to evaluate the network-level impact of varying investment strategies on the whole life costs of assets. Risks that can affect the condition of the transportation assets in Michigan are evaluated as investment strategies are developed. Gap analysis is considered when various investment strategies are compared to determine the best strategy to meet the overall goals and objectives set by the STC. Issue CFP MDOT issues an internal call for preservation projects annually for the Highway Program. A letter and instructions are issued to all seven MDOT region offices, which are responsible for proposing preservation projects. Key emphasis areas and strategic objectives are outlined, and detailed technical instructions are issued. Target funding levels for each region are calculated from a formula based on weightings relating to variables such as condition, usage, costs, and eligible assets. For pavement allocations, each region s relative share of eligible lane miles are weighted on several factors. The factors are weighted 50 percent on condition, 25 percent on cost factors and 25 percent on usage. Bridge funding is allocated based on deck area of eligible candidates. Develop Condition Strategies Regional improvement strategies for the road and bridge networks are developed by MDOT region staff using the Road Quality Forecasting System (RQFS) and Bridge Condition Forecasting System (BCFS) tools, as well as input from partners and stakeholders. These strategies guide project selection and ensure that a mix of fixes is incorporated into program development. There are a number of repairs or fixes that can be made to existing facilities that have different impacts on the trunkline network. Fixes are categorized into three groups: long-term, mediumterm, and short-term. By applying a mix-of-fixes approach that includes a combination of long, medium, and short-term fixes, MDOT can systematically address system needs in the most cost-effective means possible. Examples of a mix of fixes include longer-lasting but highercost reconstructions and more moderately priced medium-length rehabilitation projects on poor pavements, as well as low-cost capital preventive maintenance work on good and fair pavements. Once a recommended strategy is approved, candidate road and bridge projects are selected that are consistent with the strategy and funds available. Candidate Project Selection and Submittal Candidate projects are selected based on a need that meets the 6 Michigan Department of Transportation
11 Program Development Call for Projects investment strategy and program criteria. A list of candidate projects is compiled and prioritized. Priority is determined by analyzing risks, life cycle costs and other factors, such as the severity of the distress, the amount of traffic on the roadway, public input, maintenance costs, and the context of the roadway. For instance, a roadway that serves commercial or industrial businesses may be given preference over a similar roadway that does not. From the prioritized list of projects, a list of projects is selected to proceed with scoping and estimating. This list is determined by the funds available for construction. Scope and Estimate Candidate Projects The first step in preparing the scope of a project is to review the project and verify the proposed fix in the field. A group of technical staff is assembled and drives the proposed project from end to end. This van tour identifies work in addition to the pavement or bridge work; i.e., drainage work, sidewalk needs, safety work, access issues, etc. In addition, some project issues, such as environmental issues and utility conflicts, can be identified. Crash data are also compiled and analyzed to look for areas of concern during the van tour. Other items of work not originally considered may be added at this point in the process. For example, if a road project is proposed but no bridge work, the van tour may identify some preventive maintenance work that can be performed on the bridges so that all the needs in the corridor can be addressed in a single project. During this time, public input is solicited in several ways. Candidate projects are discussed with local road agencies, local governmental agencies, and MPOs and input is solicited from the general public either through the public agencies or through project-specific input sessions. Once the need is verified on the van tour and additional issues are identified, a scoping document is prepared. The scoping document is a thorough analysis of all the aspects of the project and may look at several types of fixes so the most cost-effective fix can be selected. It also analyzes several methods of maintaining traffic during construction so that customer mobility can be maximized. Other items considered during scoping are upgrades to the operation of the roadway, complete streets/context-sensitive solutions, innovative construction methods, environmental concerns, and necessary permits, etc. Rough preliminary plans are drafted for the project during the scoping stage and these plans are used as the beginning point for the design stage of the project. A detailed estimate is performed based on estimated contract pay items and the expected unit prices for these pay items. An inflation rate is applied to the estimate so that an accurate cost for the year of construction can be determined. Final Project Selection When the scoping documents are completed, and a project scope and estimate are finalized, project selection can be completed. Projects are selected to meet the approved strategies as closely as possible. During final project selection, consideration is given to providing balance of work across the regions so that mobility for users can be provided regionwide. Other items considered during final selection include risk, life cycle costs and other factors such as the severity of the distress, the amount of traffic, public input, maintenance costs, and the context of the roadway. Proposed Program Submission Candidate projects are submitted to the CFP subcommittees for review. Feedback is provided to the regions based on analysis of program consistency with approved strategies and submittal criteria, condition data, appropriate fix life project estimates, and if proposed project budgets are within established thresholds. CFP Approval The subcommittees then recommend approval of the projects to the CFP Approval Committee, which reviews the program and recommends approval to the MDOT chief administrative officer and chief operations officer. The Approval Committee is not only responsible for recommending final approval of the program but is the centerpiece in the MDOT processes for ensuring statewide consistency and compliance. As such, the Approval Committee is responsible for the following actions throughout the CFP process: Approve program approach to Transportation System Management for consistency throughout the state; Approve region and statewide condition strategies; Recommend CFP Program (including project list) for final executive approval; Provide strategic direction; Approve funding; Resolve any projects or conflicts in the CFP submittals that do not comply with the guidelines in the CFP Letter; Approve changes to CFP process, tools, data, etc.; and Approve adding/deleting programs to the CFP Transportation Asset Management Plan 7


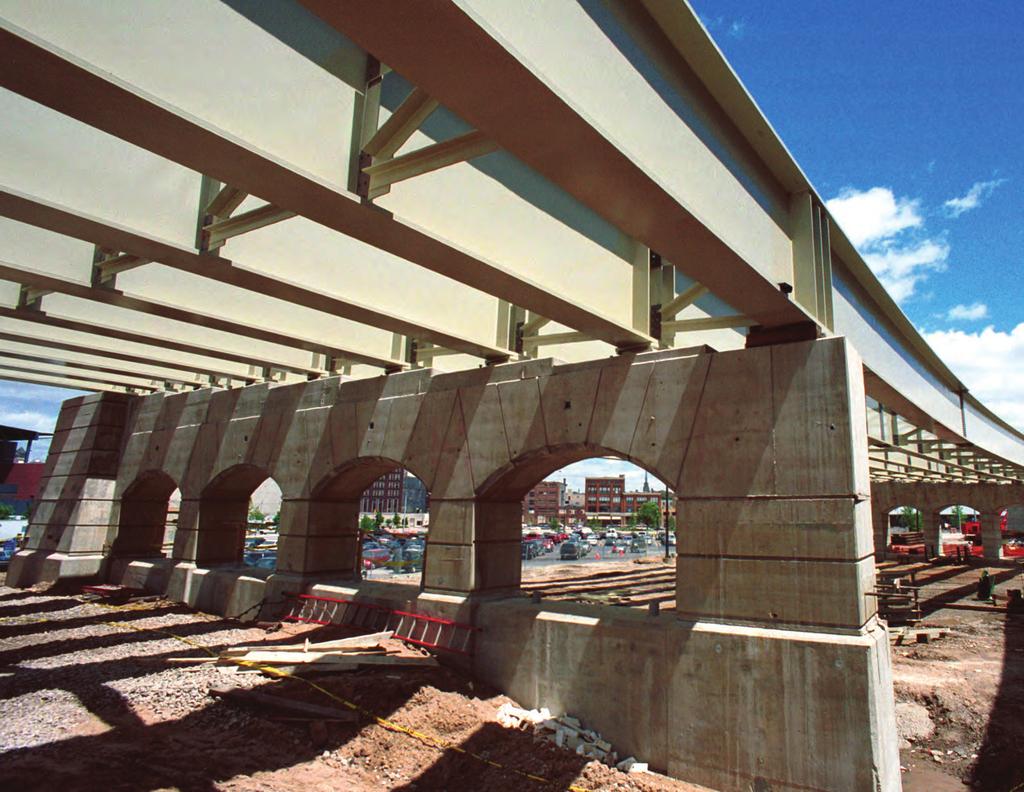
12 Program Development Call for Projects Five-Year Transportation Program Assembly of the draft Five-Year Transportation Program begins after the CFP process is completed for the Highway Program. Each year, the Five-Year Transportation Program is finalized when it is approved by the STC. The document is also submitted to the Legislature. The Five-Year Transportation Program is an integral component of the department s input to the Statewide Transportation Improvement Program (STIP). The Five-Year Transportation Program schedule has recently been synchronized with the STIP schedule to allow for seamless STIP updates by assuring that projects appear in both documents. Throughout the year, changes to scope, schedule, and budget are submitted to the STIP for inclusion in the bi-monthly TIP amendments by the Statewide Transportation Planning Division (STPD). MICHIGAN DEPARTMENT OF TRANSPORTATION FIVE-YEAR TRANSPORTATION PROGRAM Public Involvement and Outreach Outreach and coordination occurs throughout the Five-Year Transportation Program process, beginning with candidate project selection and continuing through final project selection and review of the draft transportation program. Stakeholders include the public, rural task forces, MPO partners, individual units of government, and the Legislature. Adjustments Throughout the Process Within a strategic, proactive asset management approach to system preservation, it is essential to monitor progress, obtain feedback, and, when necessary, make adjustments or refinements to improve the project selection process in future years. Within each annual cycle of the CFP process, MDOT makes observations about the data, analytical tools, assumptions made in the analysis, forecast condition, and the overall program development process, and makes the necessary modifications. Program and project changes are also made over the course of any given year in response to customer and stakeholder comments and changing system needs and constraints. STPD provides a bi-weekly monitoring report to the department to keep projects aligned to investment categories. Additionally there are quarterly monitoring meetings for more detailed analysis of progress in the investment categories. Approved by the State Transportation Commission on September 21, 2017 Fort Street Bridge (M-85) over Rouge River 8 Michigan Department of Transportation

13 Life Cycle Planning MDOT utilizes two pavement condition modeling tools, the Road Quality Forecasting System (RQFS) and the Pavement Condition Forecasting System (PCFS), which evaluate pavement condition, deterioration and forecasting. While these life cycle tools do not use the new performance measures identified for the target setting required for the TAMP, they are used to develop and implement strategies to achieve and monitor progress toward internal targets within the department. Those internal targets help inform the decision-making process of developing targets for the TAMP. MDOT directly manages 82 percent of Michigan s NHS system located on state trunklines. There are asset management systems in place to track condition, deterioration, and investment. The remaining 18 percent of Michigan s NHS is located on the local system, which is managed by 84 jurisdictions (66 cities and 18 counties). Historically, there has been a cooperative data gathering effort through the Michigan Transportation Asset Management Council (TAMC) to collect and share condition information on the entire federal-aid system, which fully encompasses the NHS, utilizing the Pavement Surface and Evaluation Rating (PASER) process. Road Quality Forecasting System (RQFS) The RQFS is a network-level pavement condition model. It utilizes remaining service life (RSL) as the pavement performance measure to forecast future pavement condition of the trunkline system based on investment strategies. RSL is a forecasted estimate of time until a reconstruction or a major rehabilitation treatment is more cost-effective than preventive maintenance. For RQFS, RSL is divided into Categories I-VI, with I being the least amount of remaining pavement life and VI being the greatest amount of remaining pavement life. It is a tool that uses RSL estimations and fix lives based on the data collected from project-level deterioration curve analysis. There are four inputs to RQFS: the pavement condition file, investment strategies, treatment costs, and inflation. The pavement condition file stores RSL information. The file is updated annually by MDOT staff. The strategies entered into RQFS identify specified percentages, or lane miles, of the pavement network to move from a lower RSL category to a higher RSL category. Strategies are finalized by MDOT experts familiar with pavement deterioration and knowledge of what is best for the system. A standard inflation cost is built into RQFS for accurate funding forecasting needs. MDOT uses this tool in all phases of asset management, from initial investment strategy development to project selection and program monitoring and reporting. Pavement Condition Forecasting System (PCFS) The PCFS is a spreadsheet-based Markovian model used by the TAMC to estimate the surface condition of Michigan s paved roads. The model uses the latest four years of pavement condition ratings to calculate the probability that a segment of road will deteriorate over the course of the forecast period. In addition to pavement condition, inputs for the model include such variables as pavement management strategies, anticipated revenues available for road construction and maintenance, and the cost of road repairs. PCFS is the forecasting tool that is used to model networklevel deterioration and forecast future condition for NHS pavements that are owned by county and/or local agencies in Michigan. The reason for a separate tool for the local NHS pavements is that RSL data are not available on non-trunkline (local) NHS pavements. The metric that is currently available for local NHS is PASER condition data. Pavement Surface and Evaluation Rating (PASER) System The PASER system was originally developed by the University of Wisconsin-Madison Transportation Information Center to be used as the state of Wisconsin s standard road rating system. PASER is a windshield road rating system that uses a 1 to 10 rating scale, with a value of 10 representing a new road and a value of 1 representing a failed road. Condition ratings are assigned by evaluating the type and amount of visual defects along a road segment while driving the segment. The PASER system interprets these observations into a condition rating. The Michigan Transportation Asset Management Council (TAMC) adopted and adapted the PASER system as the standard tool for gathering information on the condition of all federal-aid-eligible roads in Michigan. The information gathered by road-rating teams is reported on the TAMC interactive map and dashboards using the following categories: 2018 Transportation Asset Management Plan 9
14 Life Cycle Planning Roads with PASER ratings of 8-10 are considered to be in Good condition and require only routine maintenance. Routine maintenance is the day-to-day maintenance activities that are scheduled, such as street sweeping, drainage clearing, shoulder gravel grading, and sealing cracks to prevent standing water and water penetration. Roads with PASER ratings of 5-7 are considered to be in Fair condition and require some form of capital preventive maintenance (CPM). CPM is a planned set of cost-effective treatments to an existing roadway system and its appurtenances that preserves, impedes future deterioration, and maintains or improves the functional condition of the system without significantly increasing structural capacity. The purpose of CPM fixes is to protect the pavement structure, slow the rate of pavement deterioration and/or correct pavement surface deficiencies. Surface treatments are targeted at pavement surface defects primarily caused by the environment and by pavement material deficiencies. Roads with PASER ratings of 1-4 are considered to be in Poor condition and require structural improvements. This category includes work identified as rehabilitation and reconstruction that addresses the structural integrity of a road. Bridge Management MDOT performs network analyses using National Bridge Inventory (NBI) minimum condition ratings. Minimum condition ratings are found by taking the lowest condition of either the deck, superstructure, substructure, or culvert ratings. MDOT uses a web-based inspection and reporting system called MiBridge. MiBridge allows inspectors to enter both NBI and Element Level data. The system then provides inspection data that is readily accessible by the individuals managing the bridges. MiBridge also allows the inventory to be viewed quickly on a dashboard, providing condition information and sorting functions that directly connect to the condition-based goals. This allows the person performing the analysis to evaluate bridge performance at the network level while being able to drill down to the bridge level. Bridge Condition Forecasting System (BCFS) MDOT calculates the probability of deterioration of bridges, compares deterioration to investment in bridge projects, and predicts future network condition levels using an internally developed, spreadsheetbased Markovian model titled the Bridge Condition Forecasting System (BCFS). BCFS uses the current minimum NBI conditions of the inventory as the starting point of the analysis. Anticipated budgets are entered to predict future work that will be performed on the network. BCFS also requires a preservation strategy to be entered that is used to dedicate a percentage of the budget to each primary work category. The primary work categories are preventive maintenance, rehabilitation and replacement. Project costs for each primary work category must be entered so that BCFS can calculate how many projects in each category can be performed. The anticipated benefits of each main work category are entered as an input and are used to determine the impacts of the proposed budgets. Finally, BCFS can account for programmed projects. The cornerstone of BCFS is calculating and applying transition probabilities. Using the changing minimum NBI condition rating over time, BCFS calculates the likelihood that a structure will change from one minimum condition rating to another. A matrix is developed from the historic data and is applied to the entire network of bridges to project condition out each successive year included within the analysis. This projected network condition is a combination of deteriorating the calculated percentage of bridges in each condition rating and improving bridges based on future projects, budgets, preservation strategies, and the preservation path increasing or maintaining conditions. For bridges, the minimum component condition rating is forecasted using BCFS at the network level. Deterioration is performed at the bridge level, or in units of each. Average deck areas are then applied to the assumed number of bridges expected to deteriorate. As the required measure is in square feet of deck area, there will be an increased level of uncertainty as compared to reporting in units of each. MDOT is in the process of incorporating AASHTOWare Bridge Management as an additional tool to improve deterioration models at the bridge level using a combination of component and element-level condition ratings. MDOT does not anticipate having the required calibrations done in time to incorporate this advanced method for the first performance period but will implement the process when complete. Network-Level Deterioration Models As stated previously, MDOT currently uses two network-level pavement models for deterioration and forecasting, and one model for bridges. RQFS is the tool that is used for the NHS pavements on MDOT s state trunkline system. 10 Michigan Department of Transportation

15 Life Cycle Planning The collaboration of staffing expertise and data allows RQFS to produce network-level strategies and conclusions for program development. Reports that can be produced include pavement condition forecasts, RSL category information, percent of the network rehabilitated, program cost, and detailed investment strategy showing category to category shifts for reconstruction, rehabilitation, and CPM. MDOT will continue to use NBI ratings to calculate good, fair, and poor, and will use the BCFS to forecast conditions. Bridge condition data are, generally, collected on a biennial basis, with a subset of the population inspected more frequently. In alignment with goals set by the STC, most reporting has been on percentage of bridges by count, while the national measure is based on percentage by deck area. The department is making the transition to deck area as part of the TAMP process. BCFS will be used to forecast future condition by deck area, and projects in the Five-Year Transportation Plan will be compared to target dates to determine improvements. Based on this combination of deterioration and improvements, a fiscally constrained NHS bridge condition target will be established. (full replacement of road surface, base, and sub-base, and bridge replacement). Strategy Development and Evaluation The various investment strategies are developed, analyzed and compared to determine how they would impact the overall goals and objectives set by the STC. The life cycle planning tools are utilized in this process by using the network-level deterioration models available to forecast future asset conditions, based on investment strategies designed to strive to meet the condition targets of each investment scenario. The models can produce projected system condition utilizing investment level as a control. Conversely, the models can produce projected investment requirements utilizing desired system condition levels as a control. Using these models enables MDOT to develop investment strategies that achieve the desired outcome, using the most cost-efficient distribution of investments between work types. Potential Work Types MDOT utilizes a variety of work types to implement an asset management based mix of fixes approach on both pavements and bridges, which are applied throughout the life cycle of each asset. The goal is to implement the correct fix at the correct time of the life cycle at the least cost to maximize the life of the asset. The Statewide Transportation Planning Division maintains a list of these work types. Requests for new or modification of existing work type codes are reviewed by MDOT s Work Type Code Approval Committee to ensure alignment with MDOT business practices. MDOT tracks and evaluates pavement condition on a project-byproject basis and uses that project-level data to develop network-level assumptions of what sort of life-adding benefits individual fix types can provide. These network-level assumptions are updated as needed. As part of this process, MDOT plans to provide up-to-date cost per lane mile information, and additional life assumptions, for the major work types with the next submittal. Asset management work types include initial construction (new construction), maintenance (routine maintenance), preservation (capital scheduled maintenance of bridges, CPM of roads), rehabilitation (repair road or bridge), and reconstruction 2018 Transportation Asset Management Plan 11


16 Life Cycle Planning System Stratification In 2016, MDOT further stratified the pavement network from two tiers (Freeway and Non-Freeway) to the following four tiers to provide a mechanism for focusing investment on the high-volume, economically significant roads: Interstate Non-Interstate Freeway Non-Freeway NHS Non-NHS This analysis will be done on a tiered basis with individual analysis for Interstate and Non-Interstate NHS pavements, although the tools have the capability to stratify the networks even further into more discrete tiers. In addition, the tools have the capability to create regional strategies that will influence the overall statewide strategies. All tiers are managed by the department s asset management process, but only the NHS-related tiers are documented in the TAMP. All tiers are managed by the department s asset management process, but only the NHS related tiers are documented in the TAMP. Figure 4 Long-Term Goal The long-term goal is to incorporate new or modify existing deterioration and forecasting models based on the new metrics provided by the FHWA. However, MDOT is looking for additional guidance from FHWA on developing such a tool and does not anticipate having a tool, or the data needed to run such a model, fully implemented for the first performance period. 12 Michigan Department of Transportation
 technologies, that reduce the risk of disruptions to")
17 Risk Management Process MDOT has completed a Vulnerability Assessment of its assets and, as part of the upcoming Long-Range Plan, MDOT will continue to define what risk means for the department. MDOT has also instituted partnerships and made direct investments in systems, such as implementation of Intelligent Transportation System (ITS) technologies, that reduce the risk of disruptions to the transportation system. Development of the TAMP provides an opportunity to bring those studies together and create a comprehensive risk management plan. Repeatedly Damaged Assets The initial review of the past 20 years, as required by 23 CFR Part 667.5, has found no instance of the same roadway section or bridge having been repaired more than once using FHWA Emergency Relief Program Funding. MDOT has reviewed its records and will continue to monitor, record, and issue reports regarding the use of FHWA Emergency Relief Program Funding, as required by the Transportation Asset Management Plan regulations. Creating a Risk Management Plan The Final Rule for 23 CFR 515.7c requires that a state s asset management plan includes both a risk matrix and a risk mitigation plan. While MDOT has already incorporated many aspects of risk management into its planning and operations practices, the TAMP will provide an opportunity to develop a comprehensive management plan and matrix. The management plan will incorporate existing activities such as emergency bridge repair practices, asset vulnerability assessments, emergency response practices, the Great Lakes Regional Transportation Operations Coalition, Southeast Michigan Transportation Operations Center (SEMTOC), West Michigan TOC (WMTOC), Blue Water Bridge TOC, Statewide TOC (STOC), ITS messaging, and financial planning into one document that will serve the department and the residents of Michigan. As part of the 2045 Long Range-Plan, MDOT will conduct an internal workshop to identify all actions related to risk management and to define what risk means to the department. This information will be used to identify how these areas can work together to address and mitigate risks to the NHS. MDOT has extensive knowledge and experience in identifying risks from financial to structural to disruptive events. This effort will bring all the information into one plan and matrix. Risk management process, definition, and matrix will be developed in 2018 as one of the first Long-Range Plan deliverables. Assessing risk on portions of the NHS that are part of county, city, or village road networks will be accomplished through a cooperative process working closely with the agencies that have NHS mileage in their jurisdictions. MDOT already works with those same cities and counties to evaluate the condition of all federal-aid eligible roads in their jurisdiction through a process developed by the TAMC. MDOT will develop a risk management plan based on the following principles: Identify disruptive events and risks; Estimate the likelihood that each of those events might actually happen; Identify options to minimize the likelihood of the negative events occurring, or reducing the magnitude of the negative impacts; and Estimate the costs to implement each of those options; strategies for recovering from unanticipated events. Below is a preliminary set of risks that can affect condition of NHS pavements and bridges in Michigan. Federal and State Funding for NHS Routes Recurring Congestion Events Non-Recurring Congestion Events Infrastructure Failure Events Disruptive and Unpredicted Events Extreme Weather and Climate Events The risk management plan and matrix will be coordinated within the Bureau of Planning with coordination from the Bureau of Field Services, Bureau of Finance, Bureau of Development and approved by the MDOT Executive Team Transportation Asset Management Plan 13

18 14 Michigan Department of Transportation

19 Inventory and Condition Analysis Michigan s NHS is a vital network of roads that supports the mobility of its citizens, as well as the vitality of the state economy. While MDOT manages most of the state s NHS, approximately one-fifth of the network is maintained by local transportation agencies at the county or municipal level. Inventory Figure 5 summarizes the NHS pavement infrastructure maintained in the state of Michigan. This table indicates the number of lane miles of Interstate and Non-Interstate NHS pavement in Michigan. In addition, the ownership of those pavements is also identified. Figure 5: NHS Pavement Inventory State of Michigan NHS Pavement Inventory Route Type Lane Miles Route Miles Interstate (State-Owned) 6,326 1,252 Non-Interstate NHS 18,546 5,173 State-Owned 13,678 3,974 Locally Owned 4,868 1,198 Source: MDOT Statewide Systems Management Section Figure 6 summarizes the deck area of NBI structures carrying the NHS system in the state of Michigan. This table shows the breakdown between the Interstate and Non-Interstate NHS systems. Figure 6: NHS Bridge Inventory State of Michigan 2016 NHS Bridge Inventory Owner Deck Area (sq. ft.) Number of Bridges Interstate 18,970,912 1,226 Non-Interstate NHS 18,679,349 1,766 State-Owned 14,250,625 1,529 Bridge Authorities and Local Agencies 4,428, Source: MDOT Statewide Systems Management Section Pavement Condition MDOT s business process utilizes RSL as the primary performance measure for evaluating current and forecasting future pavement condition. However, RSL data are not collected by local agencies. For the NHS roads that are locally owned, pavement condition is evaluated using the PASER performance measure, consistent with the data collection practices of the Michigan TAMC. This differentiation in performance measure is displayed in Figure 7. MDOT manages the entire Interstate system, and condition data are shown exclusively using RSL data. Since the Non-Interstate NHS system is owned by several agencies including MDOT, both RSL and PASER information is displayed according to pavement ownership. A combined non-interstate NHS condition is also shown using a blend of the RSL and PASER data. Figure 7: Michigan NHS 2016 Pavement Conditions State of Michigan NHS Current Pavement Condition Route Type Percent of Network Source: MDOT Statewide Systems Management Section Good Fair Poor Lane Miles Percent of Network Lane Miles Percent of Network Lane Miles Interstate (RSL) 48% 3,033 37% 2,315 15% 977 Non Interstate NHS (Combined) State-Owned (RSL) Locally Owned (PASER) 32% 5,949 45% 8,281 23% 4,316 38% 5,170 45% 6,139 17% 2,369 16% % 2,142 40% 1, Transportation Asset Management Plan 15
20 Inventory and Condition Analysis Figure 8: Interstate RSL Pavement Condition % MDOT Historic Interstate RSL Pavement Condition For the Interstate system, pavement condition has remained relatively stable for the past decade. However, large amounts of fair pavements have the potential to fall into poor condition in future years. 90% 80% 70% 60% 50% 40% 30% 20% 10% 0% Good Fair Poor Source: MDOT Statewide Systems Management Section Figure 9: Non-Interstate RSL Pavement Condition % 90% 80% 70% Historic Non Interstate NHS RSL/PASER Pavement Condition The Non-Interstate NHS network s overall condition remained relatively stable from 2006 through However, since 2011 there has been a steady decline in good pavements that have transitioned to fair and then poor condition. Like the Interstate system, the high percentage of pavement in fair condition creates a future risk for increased amounts of Non-Interstate segments falling into poor condition. 60% 50% 40% 30% 20% 10% 0% Good Fair Poor Source: MDOT Statewide Systems Management Section 16 Michigan Department of Transportation
21 Inventory and Condition Analysis Figure 10: Historic Pavement Condition Figure 10: shows both the Interstate and Non-Interstate NHS systems historic pavement condition by percent of the system in good or fair condition. For both the Interstate and Non-Interstate freeway systems, pavement condition has declined in the past decade. Source: MDOT Statewide Systems Management Section Bridge Condition Jurisdiction of bridges is split between MDOT and local agencies, similar to NHS pavements. Unlike pavements, this split has no impact on reporting bridge condition. Regardless of ownership, all NHS bridges are evaluated using the NBI scale. Figure 11: NHS 2016 NBI Bridge Conditions State of Michigan NHS Current NBI Bridge Condition by Deck Area Owner Good Fair Poor Deck Area Percent Deck Area Percent Deck Area Percent Interstate (Trunkline Only) 6,159,678 32% 10,584,061 56% 2,227,173 12% Non-Interstate NHS 6,872,776 37% 10,403,484 56% 1,403,089 8% State-Owned 11,145,968 34% 18,568,765 56% 3,221,383 10% Bridge Authorities and Local Agencies 782,324 32% 1,197,624 49% 446,003 18% Total 13,032,454 35% 20,987,545 56% 3,630,262 12% Source: MDOT Statewide Systems Management Section 2018 Transportation Asset Management Plan 17
22 Inventory and Condition Analysis In the past decade, investments in Interstate bridges have decreased the amount of poor deck area on bridges in that network. However, large amounts of bridge deck area in fair condition do exist. Figure 12: Historic Interstate NBI Bridge Conditions Figure 14 shows the percent of deck area in good or fair condition based on historic NBI data. Both Interstate and Non-Interstate NHS bridge conditions have dramatically improved over the past two decades; however, in recent years they have leveled out. Figure 14: NBI Bridge Condition % 90.0% 80.0% 70.0% 60.0% 50.0% 40.0% 30.0% 20.0% 10.0% 0.0% Michigan Historic Interstate NBI Bridge Condition By Deck Area Good Fair Poor Source: MDOT Statewide Systems Management Section The same trend can also be seen for Non-Interstate NHS bridges. Poor bridge deck area has decreased, but the large number of fair deck area remains a potential concern for the future. Figure 13: Non-Interstate NHS NBI Bridge Conditions Source: MDOT Statewide Systems Management Section 100% 90% 80% 70% 60% 50% 40% 30% 20% 10% 0% Michigan Historic Non-Interstate NBI Bridge Condition By Deck Area Good Fair Poor Poor bridge deck area has decreased, but the large number of fair deck area remains a potential concern for the future. Source: MDOT Statewide Systems Management Section 18 Michigan Department of Transportation
23 Financial Plan This Financial Plan chapter describes the sources of funding available for Interstate and NHS pavement and bridge investment, how future revenues available for capital improvements are estimated as part of the financial plan development process, how the value of capital assets is determined, and how the cost of work to sustain those assets is calculated. It also provides 10-year projections of revenue available for capital investment in Interstate and NHS pavements and bridges based on the best available data. Identifying Funding Sources and Estimating Funding Levels Funding for the NHS system is comprised of federal aid, state revenue and local revenue. The Statewide Transportation Planning Division (STPD) develops funding estimates. Funding Sources Federal Transportation Funding Federal-aid revenue is based on Fixing America s Surface Transportation (FAST) Act funding available for Michigan. Revenue estimates for the FAST Act are provided by the Federal Highway Administration (FHWA) on their website, and by apportionment and obligation authority notices that are provided by FHWA Michigan Division. On Dec. 4, 2015, the FAST Act was signed into law. This legislation replaces the Moving Ahead for Progress in the 21st Century (MAP-21) Act, which expired on Sept. 30, The FAST Act authorizes the investment of $305 billion in federal funding in the nation s surface transportation system for five years, through fiscal year (FY) The legislation breaks the cycle of short-term funding authorizations that characterized the federal program in the recent past. In covering nearly five full fiscal years, it represents the longest surface transportation authorization bill enacted since The FAST Act builds on the reforms included in MAP-21, which was put in place in MAP-21 increased the emphasis on freight by encouraging agencies to have greater interaction with freight stakeholders and engage in specific freight planning efforts. The FAST Act continues this focus on freight by creating two new programs to better target investments to projects that promote efficient movement of freight. MAP-21 also transformed federal highway and transit programs through the establishment of a performance-based approach to decision-making. The FAST Act supports this initiative by funding efforts to collect and manage data for performance analysis, and to improve the capacity of transportation agencies to better link investments with outcomes. Reliance on non-transportation revenue to support investments in surface transportation is continued in the FAST Act. It transfers $70 billion from the federal General Fund into the federal Highway Trust Fund (HTF) to ensure that all the investments in highways and transit during its five-year duration are fully paid for. Federal revenue beyond 2020 is estimated to grow at the rate assumed throughout the FAST Act. Federal aid accounts for about 65 percent of the MDOT s Highway Capital Program, on average. In Michigan, PA 51 of 1951 (Act 51) prescribes the amount of federal aid to be utilized by the MDOT system and the local system. Act 51 states MDOT s share of federal aid is 75 percent of the federal apportionment and the local share is 25 percent, to be used on federal-aid-eligible roads. State Transportation Funding State revenue estimates are based on MDOT s share of the Michigan Transportation Fund (MTF), as estimated by consensus with the Michigan Department of Treasury, Economic and Revenue Forecasting Division. Future state revenues are forecasted using a long-range forecasting model managed by MDOT s STPD. New state transportation revenues from legislation passed in November 2015 are included. The state forecast assumes an annual dedicated income tax revenue transfer at the FY 2021 level to continue. Estimated annual amounts are in year of expenditure dollars. The state has experienced challenges in providing adequate transportation funding. For many years, Michigan had difficulty finding state and local funds to match federal aid. State General Fund dollars were used in to assure that MDOT did not lose available federal aid Transportation Asset Management Plan 19

24 Financial Plan On Nov. 10, 2015, Gov. Rick Snyder signed into law a funding package that provides more state transportation revenue. The nine-bill package included registration fee increases, motor fuel tax increases, and appropriations from the income tax revenue. The new revenue package is expected to generate $1.2 billion for transportation when it takes full effect in FY 2021: $600 million from gas taxes and registration fees, and $600 million from income tax revenues. Almost 94 percent of the new revenue will be distributed through the Act 51 formula for road agencies: 39.1 percent for state highways, 39.1 percent for Michigan s 83 county road agencies, and 21.8 percent for 533 villages and cities. The gasoline tax increased from 19 to 26.3 cents per gallon on Jan. 1, 2017, and the diesel fuel tax increased from 15 to 26.3 cents per gallon. The motor fuel tax was applied to natural gas (CNG) as well. Beginning in 2022, fuel tax rates will be tied to inflation to help remedy the decline in purchasing power of the fuel tax. Registration fees for most cars and trucks increased 20 percent on Jan. 1, New electric car fees of $100 per year, and $30 per year for plug-in hybrid cars, equalize road-user fees for vehicles that use little or no taxed fuel. The user fee increases are estimated to generate an additional $600 million per year for the MTF. Starting in FY 2019, $150 million in income tax revenues will be appropriated for roads, increasing to $325 million in FY 2020, and then $600 million in FY The forecasted revenue from FY 2022 to 2025 assumes that $600 million will be transferred from the income tax revenues every year to the MTF. These revenues will be distributed to road agencies only, under the current Act 51 formula. Before transportation revenue is available for trunkline road and bridge projects, non-capital uses must be deducted from the fund. These non-capital uses include debt service, administration, grants to other departments, routine maintenance, and buildings and facilities. The estimated revenue available for the NHS portion of the Trunkline Capital Program is based on MDOT s historic capital investment on the NHS. Of this revenue, only a portion will be available for asset management of pavements and bridges on the NHS. STPD and the Bureau of Bridges generate the cost to implement investment strategies for pavements and bridges, respectively. Department leadership approves investment levels, which can be annually adjusted to maintain asset value. Local Transportation Revenue Sources Revenues at the local level for roads are generally held by local governing bodies. MDOT does not have jurisdiction over local roads and, therefore, does not maintain data regarding the revenues associated with these roads. Funding for roads on the local level is generally a mix of federal, state, and local general funds and/or local property taxes. Most of the funding for local roads and bridges, under the jurisdiction of a county road commission or the jurisdiction of a city or village, comes from state revenue, which is determined by the Act 51 formula distribution. Federal funding is passed through from the state level for roads that are eligible for funding. The Financial Plan in the TAMP estimates state and federal funding for non-trunkline road and bridges on the NHS. No local general funds or local property taxes are estimated. These revenue estimates are based on FAST Act estimates of federal funding to local jurisdictions for use on federal-aid-eligible local roads. The state revenue estimate is based on the share of the MTF for counties, 20 Michigan Department of Transportation
25 Financial Plan cities, and villages, including the state revenue package that was enacted in November Revenue for non-trunkline roads and bridges on the NHS was estimated based on road lane miles and number of bridges. Funding Trends Federal Transportation Revenues In the 10 years before passage of the FAST Act, federal funding for Michigan s highways fluctuated. Apportioned program funding to Michigan first exceeded $1 billion in In 2016, apportioned program funding to Michigan still barely exceeded $1 billion. The FAST Act is expected to break this trend of level funding by providing a modest increase through FY These increases are assumed to continue through FY 2025, as the plan assumes a 2 percent growth rate through this period. State Transportation Revenues Act 51 established the MTF as the means of collecting and distributing state transportation revenues. For many years, the main sources of MTF funding were motor fuel taxes and vehicle registration fees. As detailed above, state transportation funding in the coming years is shifting from two sources to three. In 2019, funds from Michigan income tax revenues will transfer into the MTF to augment the funding available for transportation within the state. State Fuel Tax Trends Between 2005 and 2014, Michigan s fuel tax revenues were flat or declining. In 2012, collected gasoline revenues declined to their lowest point since In 2013 and 2014, gallons sold remained flat, but in 2015 gasoline revenues increased by about 5 percent, and by 1 percent in Some of this increase can be attributed to the decrease in fuel prices, and an uptick in economic activity. Long-term state fuel tax revenues are still forecasted to decline as mile per gallon increases continue across the vehicle fleet. State Vehicle Registration Tax Trends Most of the vehicle registration tax in the state is based on ad valorum vehicles. These vehicles include the model year 1983 and newer. Their tax is calculated on the base price of the vehicle; therefore, as long as the price of vehicles are increasing steadily, and Michigan drivers are purchasing new cars, the registration taxes will reflect growth. Vehicle registration revenues have been increasing in Michigan annually. The last time they reflected declines was in 2008 and 2009 due to the state and national economic downturn. New Source of MTF Revenue: Michigan Income Tax Revenues Beginning in FY 2019, $150 million will be appropriated from Michigan income tax revenues into the MTF for distribution through the Act 51 formula for state funding. Income tax revenues will increase to $600 million per fiscal year beginning in FY The forecasted revenue from FY 2022 to 2025 assumes that $600 million will be transferred from income tax revenue every year to the MTF, with this revenue distributed to road agencies under the current Act 51 formula. Estimating Funding Levels Trunkline Capital Program The FY federal-aid revenues are based on FAST Act estimates of federal funding available for Michigan. Federal funding beyond FY 2020 is estimated to grow about 2 percent annually, which is the rate assumed throughout the FAST Act. The intent of Act 51 regarding federal highway aid is to distribute approximately 25 percent of federal aid to local jurisdictions for use on federal-aid-eligible local roads, with the remainder to be used by MDOT. State revenue estimates are based on MDOT s share of the MTF, as estimated by consensus with the Michigan Department of Treasury, Economic and Revenue Forecasting Division. Future state revenues are forecasted using a long-range forecasting model managed by MDOT s STPD. State revenue included $113 million in one-time General Fund redirection to the State Trunkline Fund (STF) in FY 2016 in order to match all available federal aid. In addition, it included $101.8 million in FY 2016, which also is a portion of a one-time redirection from the General Fund. Additional revenue was added to the overall revenue available, based on the new state revenue package. The forecasted revenue from FY 2022 to 2025 assumes that $600 million will be transferred from income tax revenue every year to the MTF, with these revenues distributed to road agencies under the current Act 51 formula. The state Legislature has recently added $175 million as a supplemental transportation appropriation. These funds were added after this financial analysis was completed and were not included in the funding estimate Transportation Asset Management Plan 21

26 Financial Plan Figure 15: FY Forecasted Total Revenues for the Trunkline Before Capital and Non-Capital Uses (in millions) In Millions $2,500 $2,000 $1,500 $1,000 $1,774 $1,739 $1,774 $1,803 $1,705 $1,733 $1,881 $1,773 $1,970 $1,820 $2,098 $2,121 $2,146 $2,173 $2,200 $1,900 $1,883 $1,868 $1,854 $1,841 Revenue adjusted for inflation assumes a 2 percent inflation rate, which is the average annual compounded increase of the Consumer Price Index - All Urban Consumers, Detroit, for the period covering (U.S. Bureau of Labor Statistics). This rate was used to convert year of expenditure dollars to constant (2016) dollars. Figure 15 shows the total state and federal forecasted revenues for the trunkline before uses, by FY, in both year of expenditure and base year (2016) dollars. $500 $ Fiscal Year Forecasted Revenue in Year of Expenditure Forecasted Revenue Adjusted for Inflation Revenue is before capital and non-capital uses. Numbers may not calculate exactly due to rounding. Source: MDOT Bureau of Transportation Planning Figure 16: Average Historic Trunkline Allocations, Before transportation revenue is available for trunkline road and bridge projects, non-capital uses must be deducted. These non-capital uses include routine maintenance, debt service, administration, and other uses such as building and facilities, and grants to other departments. Figure 16 shows the average historic trunkline allocations from FY Source: MDOT Bureau of Transportation Planning 22 Michigan Department of Transportation
27 Financial Plan Figure 17 summarizes state and federal revenue forecasted to be available for the capital highway program through FY 2025, after deducting dedicated revenues for non-capital uses. However, not all of these funds will be available for asset management of pavements and bridges. MDOT has several other responsibilities, such as safety initiatives. The revenue available for the NHS portion of the trunkline capital program is estimated at almost 85 percent, which is the percent of currently planned highway capital road and bridge program investments that are on the NHS. The Investment Strategies chapter includes a discussion of the estimated revenue for asset management of trunkline pavements and bridges on the NHS. Figure 17: MDOT Highway Revenue Forecast in Year of Expenditure Dollars (in millions) (in millions) Federal Highway Revenue $800 $806 $822 $838 $853 $870 $887 $905 $923 $942 State Highway Revenue $974 $933 $981 $1,043 $1,117 $1,228 $1,233 $1,241 $1,249 $1,258 (Less) Non-Capital Uses* $409 $422 $426 $431 $440 $415 $420 $402 $420 $427 (Less) Routine Maintenance $311 $314 $316 $317 $319 $320 $327 $334 $341 $348 STF Available for Capital Program $1,054 $1,003 $1,061 $1,133 $1,211 $1,363 $1,373 $1,410 $1,411 $1,425 STF Available for NHS portion of Capital Program** $893 $850 $899 $960 $1,026 $1,154 $1,163 $1,195 $1,196 $1,207 *Administration, debt service, buildings and facilities, and grants to other departments. **Includes other programs beside the road and bridge programs. Note that 2018 estimate does not include a one-time appropriation for state NHS and non-nhs roads of $68.4 million signed by Gov. Snyder on March 20, Numbers may not calculate exactly due to rounding. Source: MDOT, Bureau of Transportation Planning. Non-Trunkline Roads and Bridges on the NHS FY revenue estimates are based on FAST Act estimates of federal funding to local jurisdictions for use on federal-aid-eligible local roads. The state revenue estimate was based on the share of the MTF for counties, cities, and villages, including the state revenue package that was enacted in November Revenue for non-trunkline roads and bridges on the NHS are shown in Figure 18. Estimates were based on road lane miles and number of bridges. Figure 18: FY Forecasted Transportation Revenue for Local Roads and Bridges on the NHS in Year of Expenditure Dollars (in millions) (in millions) Federal Revenue $13 $16 $17 $17 $17 $18 $18 $18 $19 $19 State Revenue $36 $47 $51 $55 $59 $65 $66 $67 $68 $69 Total Revenue $49 $63 $67 $72 $76 $83 $84 $86 $87 $88 Note that 2018 estimate does not include a one-time appropriation for county, city, and village NHS and non-nhs roads of $106.6 million signed by Gov. Snyder on March 20, Numbers may not calculate exactly due to rounding. Source: MDOT Bureau of Transportation Planning 2018 Transportation Asset Management Plan 23

28 Estimating Costs of Expected Future Work to Implement Investment Strategies MDOT conducts investment planning, which guides capital resource allocation to achieve established goals. Program categories or templates are developed to allocate revenues according to the department s investment strategy. These program categories are defined by FY, by work type to be performed, or deficiency to be addressed. Asset management work types include initial construction (new construction), maintenance (routine maintenance), preservation (capital scheduled maintenance of bridges, capital preventive maintenance of roads), rehabilitation (repair road or bridge), and reconstruction (full replacement of road surface, base, and sub-base, and bridge replacement). Program emphasis areas are determined by MDOT leadership and help guide the allocation of funding among the templates. Goals and performance standards are established for many of the program categories, with funding allocated in a manner to achieve these goals and standards. The template provides both a tool to constrain the overall statewide program to available revenues, and a mechanism to monitor the use of funds. The investment template is also guided by the STC s policies, legislative mandates, statewide need, geographic equity, and economic considerations. Investment strategies are summed by work type, by FY, and are shown in the Investment Strategies chapter. Estimating the Value of Michigan s NHS Pavement and Bridge Assets, and Annual Investment Needed to Maintain These Assets Infrastructure assets are long-lived capital assets that normally are stationary in nature and typically can be preserved for a significantly greater number of years than most capital assets. Asset values are estimated for the current time; they are not the historic (original construction) costs. NHS Pavements Valuation To estimate the value of NHS pavement, an average cost per lane mile for reconstruction was developed based on actual road construction costs from the Bureau of Development. The average cost per lane mile was then multiplied by the number of NHS lane miles. This estimates the amount it would cost today to reconstruct Michigan s NHS roads. In 2017, the cost to reconstruct all of Michigan s NHS pavements was estimated at $36.8 billion based on 20,010 trunkline NHS lane miles at $1.7 million per trunkline 24 Michigan Department of Transportation

29 Financial Plan NHS lane mile and 4,870 federal-aid paved non-tunkline NHS lane miles at $0.6 million per non-truckline NHS lane mile. NHS Bridges Valuation MDOT owns about 88 percent of the NHS bridge deck area in Michigan. The asset valuation method for bridges on the NHS was based upon the Elemental Decomposition and Multi-Criteria (EDMC) Method (Dojutrek et al., 2012), which uses different deterioration rates for various bridge components. This accounts for the condition, service life, and preservation investments in the In 2017, the cost to reconstruct all of Michigan s NHS pavements was estimated at $36.8 billion. The estimated value of NHS bridges in 2017 was $15.8 billion. valuation. The NHS, NBI only, including local agency NHS and bridge authorities estimated valuation in 2017 was $15.8 billion. Investments Needed to Maintain the Asset Value of NHS Pavements and Bridges The annual investments needed to maintain Michigan s NHS pavement condition are estimated using RQFS and PCFS. Annual investments needed to maintain MDOT s NHS bridge condition are estimated using the BCFS. These software programs use current pavement condition, projected deterioration, estimated project fix life, and a mix-of fix-strategy to estimate the funding that would be needed to maintain the NHS pavement and bridge conditions. The annual investments needed to maintain NHS roads and bridges are shown in the Investment Strategies chapter. Identifying Risks and Assumptions Forecasted revenues and construction costs are based on the best available information at the time they are prepared. Because foresight and information are not perfect, uncertainties and risks are inherent in any forecast. Some risks stem from uncertainties about fiscal and monetary policy, inflation, commodity prices, labor markets, abnormal weather, international economic growth and/or geopolitical tensions, and business and consumer sentiment. These risks can affect many items, from revenues and construction costs to project delivery and timing, system performance, and target achievement. Financial Plan assumptions are based on existing legislation, historic growth rates, and estimates and guidance from federal and state agencies. Short-term federal and state revenues are developed using estimates prepared by FHWA and the Michigan Department of Treasury, respectively. Long-term federal revenue growth is based on short-term estimated growth. Long-term state revenue growth is forecasted using a long-range forecasting model managed by MDOT s STPD. Future income tax revenue transfers to state revenue are assumed based on existing legislation. The forecasted revenue from FY 2022 to 2025 assumes that $600 million will be transferred from the income tax revenues every year to the MTF, with these revenues distributed to road agencies under the current Act 51 formula. Finally, base-year construction costs are developed from road construction information accumulated in RQFS, while future construction costs are inflated based on FHWA guidance Transportation Asset Management Plan 25

30 26 Michigan Department of Transportation
31 Investment Strategies By implementing an asset management approach, MDOT develops an understanding of the current gaps in system performance, how pavement and bridge assets should be managed throughout their whole-life, how to mitigate the risks that pose a threat to pavement and bridge assets, and how funding distribution and various trade-off options influence the overall system condition and performance. This asset management approach helps MDOT find the right balance among various investment strategies so that progress toward targets is made, risks minimized, and assets managed for their whole-life. Investment Strategy Process Department goals for state trunkline pavement and bridge condition are established by the STC and influence the manner in which MDOT invests in and maintains state-owned transportation infrastructure. To do this, MDOT conducts investment planning. Investment strategies guide the allocation of capital resources to achieve the goals established. Investments are focused where they will most benefit the public, consistent with the direction established. Investment strategies are developed utilizing anticipated available funding, life cycle planning, financial and performance gap analysis, and the results of risk analysis. Annually, MDOT uses updated information on available funding, and the estimated cost of future work by work type, to perform life cycle analysis for pavement and bridge assets. This analysis is produced for strategies that would: Achieve and sustain a desired SOGR; Improve or preserve the condition of the pavement and bridge assets; Achieve the constrained Michigan targets for asset condition; and Achieve the national goals. For each strategy, gaps in funding are identified. The risks associated with each strategy are also analyzed. The various strategies are analyzed and compared to determine how they would impact the overall goals and objectives set by the STC. The desired mix of fixes, investment levels, and funding targets are developed for the selected investment strategy and provided in the Highway CFP memo. They form the basis for project selection and prioritization. The selected investment strategy is communicated to the public by way of the annual Five-Year Transportation Program. The Program Development Call for Projects Process chapter details the steps of the Transportation Program Development activities leading to investment strategies. Investment strategies are influenced by several factors. Influence of the Financial Plan The anticipated funding available and cost of future work constrains the development of investment strategies. State and federal revenue available for the NHS portion of Michigan s pavement and bridge assets is forecasted based on historical trends, federal funding acts, and state legislation. Future funding that will be available for asset management over a minimum timeframe of 10 years is projected. The expected cost of future work to implement the investment strategies is determined. The Financial Plan is considered when various investment strategies are compared to determine the best strategy to meet the overall goals. The available funds are allocated to program areas based on selected investment strategies. Influence of Performance Gap Analysis Monitoring and reporting performance gap is an important part of demonstrating whether the organization is delivering the desired levels of service. It provides information on the progress toward the organization s strategic goals, accountability to customers, and identifies areas in need of improvement. Performance gap analysis includes the following: Develop condition targets for assets; Assess the current condition of assets; Identify the performance and funding gap of assets; and Understand the relationship between varying funding levels and future asset conditions. This gap analysis is considered when various investment strategies are compared to determine the best strategy to meet the overall goals and objectives set by the STC Transportation Asset Management Plan 27
32 Investment Strategies Influence of Life Cycle Analysis Michigan incorporates life cycle considerations when modeling future asset conditions. MDOT uses forecasting tools to evaluate and forecast the network-level impact of varying investment strategies on the whole life costs of roads and bridges. The life cycle analysis tools used are detailed in the Life Cycle Planning chapter. Influence of Risk Management Risks that can affect the condition of roads and bridges in Michigan are evaluated as investment strategies are developed. MDOT also considers risk as part of the program development process. Risk management encompasses the following: Identifying agency-level risks that could impact implementation of asset management programs; Identifying program-level risks that could impact implementation of specific programs; Evaluating the agency and program-level risks in terms of their likelihood of occurrence, the consequences if they occur, and using the results to prioritize the risks; and, Identifying strategies for mitigating the highest priority risks. Results of the risk management analysis are considered when various investment strategies are compared to determine the best strategy to meet the overall goals and objectives set by the STC. Local Road Agencies Investment Strategies The state of Michigan has a substantial number of local governments. Included in the state s system of local governments are counties, townships, cities, and villages. The 83 counties, 275 cities, and 258 villages have ownership and control over the local road system. Sixtysix cities and 18 counties manage some portion of the NHS segments. These segments comprise 18 percent of the NHS system. The Michigan TAMC was formed to promote the use of asset management practices among Michigan s road and bridge-owning agencies; to develop a coordinated, unified effort by the various agencies within the state; and to advise the STC on a statewide asset management strategy. The TAMC s primary responsibility is to oversee the biannual collection of physical inventory and condition data on all federal-aid-eligible roads and bridges in Michigan, including NHS routes. The TAMC also provides training and other events to help local agencies understand the importance of asset management as they plan their capital programs. Each local agency develops its own transportation investment strategy and budgets accordingly. MDOT incorporates local revenue available and work expected to be performed on the locally owned NHS pavement and bridges into the Financial Plan. MDOT s STPD will coordinate with local agencies and MPOs on STIP and TIP amendments and performance target setting and will monitor the local investment on non-state-owned NHS pavements and bridges. Investment Strategy Analysis As part of MDOT s Asset Management program, four investment strategies were developed and considered. After MDOT determined the estimated available funding and NHS funding needs for the TAMP timeframe, the department worked through various investment strategies to select a strategy that would best meet the department s asset management objectives. The financial plan, life cycle planning, gap analysis and risk mitigation strategies were considered when each investment strategy was reviewed. Anticipated funding available from the financial plan is utilized when various investment strategies are compared to determine the most realistic strategy to meet the overall goals and objectives set by the STC. Life cycle planning was completed for the various investment strategies. MDOT currently uses two network-level pavement models and one model for bridges, which are detailed in the Life Cycle Planning chapter. The life cycle planning identifies the amount of work needed by category for each investment strategy. Financial gap analysis is considered when various investment strategies are compared to determine the most realistic strategy to meet overall goals and objectives. Where funding gaps existed, cross-asset analysis was considered. Agency-level and program-level risks that could impact implementation of the analysis were considered. Obtaining the anticipated state income tax revenue is a major risk to all the pavement and bridge preservations investment strategies. Without this funding, the funding gap between available revenue and investment needed would be greater. 28 Michigan Department of Transportation
33 To develop an investment strategy to reach each goal, MDOT utilized life cycle analysis that represented the most efficient and effective approach to achieving the asset management objective. A mix of fixes was developed that would produce the desired asset condition. The life cycle analysis constrained the amount of preservation work Achieve the National Pavement Goal The national pavement goal is no more than 5 percent poor on the Interstate. The investment needed to meet the pavement national goal for the Interstate in Michigan exceeds the pavement funding available. The total estimated shortfall in investment over the 10-year period is $683 million. Even if all NHS trunkline pavement funding is redirected to the Interstate, there are still not enough funds to do the work needed to reach the national goal. Additionally, if all pavement funds are redirected to the Interstate, there would be no funds for capital investment on the Non- Interstate NHS routes. This would result in a drastic decline of condition of the Non-Interstate pavement and have undesirable impacts on the motoring public. Redirecting bridge funding would also result in an unacceptable decline in statewide bridge condition. Figure 19: Revenue Available and Estimated Cost of Work for Pavement for FY : National Goal Pavement Investment Strategy by year to balance mobility impacts. The desired level of work for this investment objective was compared to the available funding as identified in the 10-year financial plan forecast. The four investment strategies that were evaluated are detailed on the following pages Year Total (in millions) Renenue for NHS Revenue Available for NHS Trunkline Capital Program $893 $850 $899 $960 $1,026 $1,154 $1,163 $1,195 $1,196 $1,207 $10,543 Maintenance (Pavement and Bridge) $311 $314 $316 $317 $319 $320 $327 $334 $341 $348 $3,247 Investment Strategies Expected Cost of Future Work - Constrained Target Trunkline Pavement (no local) $474 $440 $519 $498 $587 $677 $687 $687 $687 $687 $5,944 Pavement - National Goal - Expected Work Needed Reconstruction $100 $100 $391 $393 $366 $356 $378 $401 $427 $444 $3,355 Rehabilitation $97 $97 $119 $358 $322 $470 $488 $500 $211 $220 $2,883 Preservation $39 $39 $82 $41 $45 $27 $28 $29 $30 $31 $390 Initial construction $0 $0 $0 $0 $0 $0 $0 $0 $0 $0 $0 Total $236 $236 $593 $792 $733 $852 $894 $930 $668 $695 $6,628 National Goal Pavement Revenue Gap $238 $204 ($74) ($294) ($145) ($175) ($206) ($242) $19 ($8) ($683) The investment needed to meet the pavement national goal for the Interstate in Michigan exceeds the pavement funding available. National Goal condition will not be reached until 2030, continued investment needed 2026 through Gap for National Goal compares expected work needed to constrained pavment - trunkline amounts only. Source: MDOT Bureau of Transportation Planning 2018 Transportation Asset Management Plan 29
34 Investment Strategies Pavement State of Good Repair (SOGR) Michigan s goal for Pavement SOGR is 95 percent good/fair on the Interstate and 85 percent good/fair on Non-Interstate NHS pavement. The investment needed to meet the SOGR exceeds the available pavement funding. The total estimated shortfall in investment over the 10-year period is more than $8 billion. Redirecting funding from the bridge preservation and other programs would result in an intolerable decline in the condition of those assets and would not be enough to bring the pavement condition up to a state of good repair. Figure 20: Revenue Available and Estimated Cost of Work for Pavement for FY : State of Good Repair (SOGR) Pavement Investment Strategy Year Total millions Renenue for NHS Revenue Available for NHS Trunkline Capital Program $893 $850 $899 $960 $1,026 $1,154 $1,163 $1,195 $1,196 $1,207 $10,543 Maintenance (Pavement and Bridge) $311 $314 $316 $317 $319 $320 $327 $334 $341 $348 $3,247 Expected Cost of Future Work - Constrained Target NHS pavement (trunkline and local) $538 $504 $583 $571 $660 $759 $769 $772 $772 $775 $6,702 Pavement SOGR - Expected Work Needed Reconstruction $261 $261 $767 $771 $737 $735 $764 $803 $843 $876 $6,818 Rehabilitation $175 $175 $636 $881 $698 $973 $1,042 $1,220 $555 $578 $6,933 Preservation $151 $151 $179 $125 $149 $93 $96 $100 $104 $108 $1,256 Initial construction $0 $0 $0 $0 $0 $0 $0 $0 $0 $0 $0 Total $586 $586 $1,582 $1,777 $1,584 $1,801 $1,903 $2,123 $1,502 $1,562 $15,006 SOGR Pavement Revenue Gap ($48) ($83) ($999) ($1,206) ($924) ($1,042) ($1,134) ($1,351) ($730) ($787) ($8,304) SOGR condition will not be reached until 2030, continued investment needed 2026 through Source: MDOT Bureau of Transportation Planning 30 Michigan Department of Transportation
35 Investment Strategies Preserve Current Condition Michigan s current condition on Interstate routes is 84.6 percent good/fair and 76.7 percent good/fair on the Non-Interstate NHS pavement. The investment needed to preserve current pavement conditions exceeds the available pavement funding. The total estimated shortfall in investment over the 10-year period is more than $7.6 billion. Redirecting funding from the bridge preservation and other program would result in an unacceptable decline in the condition of those assets and MDOT would not be able to maintain the current pavement condition. Figure 21: Revenue Available and Estimated Cost of Work for Pavement for FY : Preserve Current Condition Pavement Investment Strategy Year Total (in millions) Renenue for NHS Revenue Available for NHS Trunkline Capital Program $893 $850 $899 $960 $1,026 $1,154 $1,163 $1,195 $1,196 $1,207 $10,543 Maintenance (Pavement and Bridge) $311 $314 $316 $317 $319 $320 $327 $334 $341 $348 $3,247 Expected Cost of Future Work - Constrained Target NHS pavement (trunkline and local) $538 $504 $583 $571 $660 $759 $769 $772 $772 $775 $6,702 Pavement - Preserve - Expected Work Needed Reconstruction $250 $250 $757 $759 $725 $724 $753 $790 $830 $862 $6,701 Rehabilitation $163 $163 $625 $869 $686 $893 $874 $1,029 $547 $567 $6,415 Preservation $146 $146 $174 $120 $144 $89 $92 $95 $98 $101 $1,203 Initial construction $0 $0 $0 $0 $0 $0 $0 $0 $0 $0 $0 Total $559 $559 $1,555 $1,748 $1,555 $1,706 $1,719 $1,914 $1,475 $1,531 $14,320 Preserve Condition Pavement Revenue Gap ($21) ($56) ($972) ($1,178) ($895) ($946) ($950) ($1,142) ($703) ($756) ($7,618) Preserve current condition will not be reached until 2030, continued investment needed 2026 through Source: MDOT Bureau of Transportation Planning 2018 Transportation Asset Management Plan 31
36 Investment Strategies Constrained Investment for Pavement Michigan s constrained investment strategy for pavement is based on available funding. Michigan s highway capital program places significant emphasis on the preservation of pavement. MDOT s CFP process includes strategic direction that emphasizes the Interstate and NHS systems over Non-NHS routes. To develop an investment strategy to utilize the available funding, MDOT utilized a life cycle analysis that represented the most efficient and effective approach. A mix of fixes was developed that would produce the best possible outcome with the funding available. This investment strategy represents the funding available for pavement preservation of the NHS system. There is no financial gap with this investment strategy. Figure 22: Revenue Available and Estimated Cost of Work for Pavement for FY : Constrained Pavement Investment Strategy Year Total (in millions) Renenue for NHS Revenue Available for NHS Trunkline Capital Program $893 $850 $899 $960 $1,026 $1,154 $1,163 $1,195 $1,196 $1,207 $10,543 Maintenance (Pavement and Bridge) $311 $314 $316 $317 $319 $320 $327 $334 $341 $348 $3,247 Expected Cost of Future Work - Constrained Target NHS pavement (trunkline and local) $538 $504 $583 $571 $660 $759 $769 $772 $772 $775 $6,702 Pavement - Constrained Investement - Expected Work Needed Reconstruction $240 $225 $195 $203 $230 $385 $363 $391 $334 $335 $2,908 Rehabilitation $158 $148 $218 $231 $282 $286 $316 $290 $347 $348 $2,633 Preservation $140 $131 $170 $136 $148 $88 $91 $91 $91 $92 $1,162 Initial construction $0 $0 $0 $0 $0 $0 $0 $0 $0 $0 $0 Total $538 $504 $583 $571 $660 $759 $769 $772 $772 $775 $6,702 Constrained Investment Pavement Revenue Gap Source: MDOT Bureau of Transportation Planning Source: MDOT Bureau of Transportation Planning $0 $0 $0 $0 $0 $0 $0 $0 $0 $0 $0 32 Michigan Department of Transportation
37 Bridge Investment Strategies The national bridge goal is no more than 10 percent structurally deficient (or poor) by deck area on the NHS. While current bridge conditions are very near this penalty threshold, one project under construction on large deck area bridges represents more than 4 percent of the NHS deck area statewide. With the completion of this project and using constrained investments, the national goal for NHS bridges is expected to be achieved and maintained throughout the 10-year forecast period. In other words, achieving the national goal, a constrained investment, and preserving the conditions of the bridge assets by deck area are all achieved under the same investment strategy. Investment Strategies Figure 23: Revenue Available and Estimated Cost of Work for Bridge for FY : National Goal / Preserve Asset Bridge / Constrained Target Investment Strategy (in millions) 10-Year Total Renenue for NHS Revenue Available for NHS Trunkline Capital Program $893 $850 $899 $960 $1,026 $1,154 $1,163 $1,195 $1,196 $1,207 $10,543 Maintenance (Pavement and Bridge) $311 $314 $316 $317 $319 $320 $327 $334 $341 $348 $3,247 Expected Cost of Future Work - Constrained Target Bridge $182 $182 $161 $159 $152 $161 $161 $161 $161 $161 $1,639 Bridge Authorities and Local Agencies $12 $16 $14 $17 $20 $14 $16 $29 $45 $63 $246 Total $194 $198 $175 $176 $172 $175 $177 $190 $206 $224 $1,885 Bridge Constrained Expected Work Reconstruction $93 $93 $82 $81 $77 $82 $74 $74 $74 $74 $804 Rehabilitation $49 $49 $43 $43 $41 $43 $48 $48 $48 $48 $460 Preservation $40 $40 $36 $35 $34 $36 $39 $39 $39 $39 $376 Bridge Authorities and Local Agencies $12 $16 $14 $17 $20 $14 $16 $29 $45 $63 $246 Total $194 $198 $175 $176 $172 $175 $177 $190 $206 $224 $1,885 National Goal / Preserve Asset / Constrained Investment Bridge Revenue Gap $0 $0 $0 $0 $0 $0 $0 $0 $0 $0 $0 Source: MDOT Bureau of Transportation Planning 2018 Transportation Asset Management Plan 33
38 Investment Strategies Bridge State of Good Repair (SOGR) Michigan s goal for bridge SOGR is 95 percent good/fair by deck area on the NHS. The investment needed to meet the SOGR is within the constrained amounts, based on a mix of fixes that is purely bridge preservation-focused. This may be an achievable goal; however, it will depend on what other project-level needs must also be addressed. These include risk management, such as scour needs, and coordinating work within projects for other assets, such as pavement. This multi-objective approach is necessary to reduce project impacts on the public, as well as improving resiliency of the network through risk mitigation. The SOGR was also evaluated using the current strategy, which already includes the consideration of risk mitigation and other asset programs. This strategy was used to identify the revenue gap between current conditions and the SOGR. Figure 24: Revenue Available and Estimated Cost of Work for Bridge for FY : National Goal / Preserve Asset Bridge / Constrained Target Investment Strategy (in millions) 10-Year Total Renenue for NHS Revenue Available for NHS Trunkline Capital Program $893 $850 $899 $960 $1,026 $1,154 $1,163 $1,195 $1,196 $1,207 $10,543 Maintenance (Pavement and Bridge) $311 $314 $316 $317 $319 $320 $327 $334 $341 $348 $3,247 Expected Cost of Future Work - Bridge $182 $182 $161 $159 $152 $161 $161 $161 $161 $161 $1,639 Bridge Authorities and Local Agencies $12 $16 $14 $17 $20 $14 $16 $29 $45 $63 $246 Total $194 $198 $175 $176 $172 $175 $177 $190 $206 $224 $1,885 Bridge Constrained Expected Work Reconstruction $100 $100 $90 $89 $85 $90 $81 $81 $81 $81 $877 Rehabilitation $53 $53 $47 $47 $45 $47 $53 $53 $53 $53 $502 Preservation $44 $44 $39 $39 $37 $39 $42 $42 $42 $42 $410 Bridge Authorities and Local Agencies $12 $16 $14 $17 $20 $14 $16 $29 $45 $63 $246 Total $209 $213 $190 $191 $187 $190 $192 $205 $221 $239 $2,035 State of Good Repair Bridge Revenue Gap $15 $15 $15 $15 $15 $15 $15 $15 $15 $15 $150 Source: Source: MDOT MDOT Bureau of Bureau Transportation of Bridges Planning and Structures 34 Michigan Department of Transportation

39 Investment Strategies Selected Investment Strategy The selected pavement and bridge investment strategy is constrained investment, meaning it is constrained to available funding, minimizes risk, has no financial gap and manages assets for their whole-life. It is the best achievable strategy consistent with the overall goals and objectives established by the STC. The investment strategy is implemented within the department through the annual integrated Highway CFP process, which provides the mechanism for project selection. The desired mix of fixes, investment levels, and the funding targets are developed for the selected investment strategy and provided in the CFP memo. They form the basis for project selection and prioritization. The selected investment strategy is communicated to the public by way of the annual Five-Year Transportation Program. The selected pavement and bridge investment strategy is constrained investment, meaning it is constrained to available funding, minimizes risk, has no financial gap and manages assets for their whole-life. It is the best achievable strategy consistent with the overall goals and objectives established by the STC Transportation Asset Management Plan 35

40 36 Michigan Department of Transportation
41 Performance Gap Analysis Establishing Targets for Asset Condition of NHS Pavements and Bridges A methodology has been adopted by MDOT for vetting and approving pavement and bridge targets. Pavement and Bridge Transportation Performance Measure (TPM) teams have been created that include multi-disciplinary representation throughout the department as well as representation from the Michigan Transportation Planning Association (MTPA). These teams are tasked with developing target recommendations, which are then presented to the full MTPA, as well as MDOT leadership, for approval. Pavement Target-Setting Process As required by law, MDOT is currently in the process of establishing targets for pavement condition measures, identified as Percent Good and Percent Poor, on the Interstate and Non-Interstate NHS. Targets are required for two and four-year intervals for each measure, with eight targets in total (for the Interstate measures, there will be no two-year targets in the First Performance Period per 23 CFR Part 490; therefore, there will only be six targets in this period). The rule establishes four metrics to be used to determine condition, depending on the surface type of the pavement: IRI, Cracking Percent, Rutting, and Faulting. Data used to determine pavement condition are collected by a private contractor who supplies MDOT with data on an annual basis. These data are submitted to MDOT s Data Inventory and Integration Division, where it is segmented into tenth-of-a-mile units. These data are used to determine overall pavement condition for each year and will establish the baseline condition on which targets will be founded. Using the condition data from prior years, MDOT will conduct historical trend analyses to forecast future condition, which will be used to establish targets. The analysis will include data on available metrics for up to the past five or six years, depending on data collection cycles. Trend lines will help to project future condition. Other factors considered will be the largest percent changes in condition from year to year to assess variability. Reasons for year-to-year changes will be determined to the best extent possible. The department will also subcategorize the good, fair, and poor metric ranges to consider trends within those categories, and to determine the likelihood of further category shifts within the two and four-year periods. In the First Performance Period, defined as the four-year period between Jan. 1, 2018, and Dec. 31, 2021, the Non-Interstate NHS is subject to the Non-Interstate NHS Transition Period, in which the IRI is the only metric to be used to determine overall pavement condition. This change will be reflected in MDOT s target development process for this period. Bridge Target-Setting Process In addition to pavement targets, MDOT, as required by law, is presently establishing targets for bridge condition measures, identified as Percent Good and Percent Poor, by deck area on the NHS. Targets are required for two and four-year intervals for each measure, with four targets in total. The minimum general condition rating from the NBI will be used to determine Good, Fair and Poor categories. Bridge condition data are collected throughout the year by inspectors as delegated by the bridge owner. Data collection and quality control follows the requirements of the National Bridge Inspection Standards (NBIS). Bridges are generally inspected on a biennial basis. Inspection data are submitted through MDOT s MiBridge inspection and reporting system. By March 15 of each year, the data will be submitted to FHWA as required by the NBIS. Using the condition data from prior years, MDOT will develop deterioration rates to identify the expected number of bridges falling to a lower condition rating each year. Using average deck area, the deterioration rates by bridge will be used to estimate the projected change in deck area. MDOT is in the process of calibrating the analysis modules of AASHTOWare Bridge Management software, which allows users the ability to predict deterioration of specific bridges based on element condition in addition to NBI component ratings. This process is not expected to be completed in time to use for the initial target setting, but will be incorporated when complete. The Five-Year Transportation Program and NHS bridge projects currently under construction will be reviewed to identify open-to-traffic or anticipated inspection dates and determine when improvements would be credited to the system, as well as the specific deck area to be improved. These improvements, the projected deterioration and current condition will be combined to develop the initial performance targets Transportation Asset Management Plan 37
42 Performance Gap Analysis Target-Setting Coordination with MPOs The rule requires that MDOT coordinate target establishment with MPOs for both pavements and bridges. MDOT s coordination strategy includes adding MPO representatives to its TPM Pavement Implementation Team and to meet with MPOs to review the rule, discuss new data requirements, and to share data and methods. To prepare for the new rule, MDOT began collecting data for all the new metrics on the entire NHS in This included data collection on the non-trunkline non- Interstate NHS routes, which are under local government jurisdiction. Using these data, MDOT will provide each MPO with a report card for pavement condition on the Interstate and Non-Interstate NHS in their metropolitan planning areas and how this condition compares to the statewide condition. A similar parallel effort is occurring using the bridge target-setting data. This effort will reduce the burden of data collection and analysis on MPOs and will ensure that they all have consistently measured and analyzed data. MDOT and MPOs will use these historical data to establish statewide targets and to understand which target option will be appropriate for each MPO, whether it is to support the statewide targets or to establish their own. The TPM Pavement team has been coordinating with the MTPA since April 2017 and has included members from three different MPOs as official team members. The process is on schedule to meet the May 2018 deadline for target development. Target Risk Assessment After making condition projections as described above, MDOT will assess risks to achieving pavement and bridge targets. Three major risk categories are considered potential hindrances to MDOT s ability to achieve performance targets for both pavements and bridges: climate impacts, funding uncertainty, and funding levels. For bridges, age of structures is also a risk factor. Additional risks may be considered as determined in the future. Climate Impacts In 2015, MDOT completed an FHWA-funded initial study on potential climate and extreme weather risks. Some of the asset management concerns included how increasing precipitation and temperatures might result in erosion, increased frequency of freeze/thaw cycles, and buckling resulting from heat. Increasing precipitation and temperatures could also result in impacts to scour susceptibility. While these factors might not directly impact deterioration, mitigating increased scour risks would divert resources that could otherwise be spent on preservation activities. Increased deterioration resulting from these climate impacts creates uncertainty in the target development process. Funding Uncertainty In 2015, Gov. Rick Snyder passed a funding package increasing state transportation revenue, which began to go into effect in As part of the additional funding, appropriations from state income tax revenue would begin in 2019; however, these funds are not guaranteed. While MDOT is planning projects based on receiving this funding, the possibility that funding will not be appropriated creates uncertainty in the target development process, because MDOT may not be able to complete all projects as planned. Even with the additional funding expected to be provided, MDOT s funding levels are not enough to maintain or improve current pavement conditions. Funding Levels Even with the additional funding expected to be provided, MDOT s funding levels are not enough to maintain or improve current pavement conditions. MDOT currently uses RSL to forecast pavement condition, and based on current funding, including the new revenue and the income tax revenue appropriations, MDOT s trunkline system is projected to decline rapidly over the next decade. MDOT s current revenue will need to be considered and factored into forecasts as the department transitions into using the new metrics. Bridges are just one of the many assets that are considered when managing funding for a transportation agency. Should other areas subject to performance measures encounter significant obstacles in meeting their minimum condition goals or performance targets, the agency will need to determine if funding should be shifted. Age of Structures MDOT s bridge network is continuing to age. MDOT s focus on preservation has extended the life of the average structure in the inventory and slowed the rate of structures falling into poor condition. However, the effectiveness of multiple preservation or rehabilitation projects on the same structure can diminish over time, and could result 38 Michigan Department of Transportation
43 Performance Gap Analysis in faster than expected deterioration rates or reducing the available repair options, which often leads to replacements. Any shift toward replacements, given constant fiscal constraints, would reduce the number of structures preserved each year and lead toward lower network conditions. This risk is minimal for the two-year target due to the slow deterioration of bridges; however, it is more of a concern for the four-year target and for long-term analysis and strategy setting. These risks decrease the chances MDOT will achieve targets. To account for this uncertainty, MDOT will select the most reasonably conservative targets based on trend forecasting. The largest percent changes that have occurred from year to year will be used to gauge what can be considered a reasonable conservative forecast from the baseline condition. Additionally, as part of the coordination process, MDOT will consult with MPOs on what is considered reasonably conservative. MDOT may need to adjust targets accordingly at the midpoint of the performance period. Identifying Gaps in the Performance of the NHS That Affect Pavements and Bridges The objective of performance gap analysis is to track performance compared to short-term targets and long-term performance goals for an SOGR. Information from the gap analysis will be used with life cycle and financial planning to develop alternative strategies that close or address the identified gaps to operate, improve or preserve existing assets. The gap analysis requires, at a minimum, a comparison of the current condition of NHS pavements and bridges with MDOT s TAMP targets. The gap analysis should also explain how the current conditions compare to the state DOT s long-term performance goals for an SOGR. MDOT will identify the performance gap (percentage point difference) between the current condition and the state-identified TAMP target for each condition measure. MDOT will identify the performance gap (percentage point difference) between the current condition and the MDOT long-term performance goals for an SOGR. Pavement Gap Analysis Process For both the Interstate and Non-Interstate NHS, MDOT will determine the current pavement condition (calculated as described in 23 CFR ) for each condition measure (percent good and percent poor). MDOT s current long-term pavement condition goals are based on RSL and are 95 percent good/fair on the freeway and 85 percent good/fair on the non-freeway system. As the state and federal performance measures vary on measurement units, for gap analysis comparison purposes in the TAMP, it will be assumed that the percent good/fair goal on the Interstate is 95 percent and the percent good/fair goal on the Non-Interstate NHS system is 85 percent. Bridge Gap Analysis Process MDOT will determine the current bridge condition by deck area carrying the NHS for each condition measure (percent good and percent poor). MDOT s current long-term bridge condition goals are based on count of bridges rather than deck area and are 95 percent good or fair on the freeway and 85 percent good or fair on the non-freeway system. The non-freeway goal has been exceeded since 2007 and the freeway goal was recently met in late As the Michigan inventory contains a few structures with deck areas that can cause a noticeable swing in condition, the projections and measurements will be more sensitive to the condition of these large structures. Michigan s TAMP-reported targets to FHWA will be a combination of trunkline, bridge authority, and local agency NHS bridge condition. Bridge authority bridges comprise 5 percent of the statewide NHS deck area and were all in good or fair condition in Local agency bridges comprise 6 percent of the statewide NHS deck area, with 16 percent of bridges in poor condition by deck area. As the state and federal performance measures vary both on measurement units, as well as inventories, the assumption is made that maintaining current condition (which exceeds the state goal) is a reasonable conversion of aspirational goals. For gap analysis comparison purposes in the TAMP, it will be assumed that the combined statewide NHS percent good aspirational goal by bridge deck area on the NHS is 95 percent good or fair. Process for Analyzing Gaps Regardless of Physical Condition State DOTs are also required to have a process for analyzing gaps in the performance of the NHS that affect NHS pavements and bridges regardless of their physical condition. MDOT will analyze and address instances where the results or recommendations from other plans (Highway Safety Improvement Program, State Freight Plan, etc.) may 2018 Transportation Asset Management Plan 39
44 Performance Gap Analysis affect NHS pavement and bridge assets. MDOT will review these plans if there is a call for additions or changes to existing pavements or bridges in a manner beyond the current investment strategy. If significant, MDOT will identify the change in condition gap as a result of these strategies. Developing Alternative Strategies to Close or Address the Identified Gaps MDOT will develop and analyze alternative life cycle strategies and/or financial scenarios for closing or addressing gaps relating to the SOGR and any other identified gaps for pavements and bridges. What are MDOT s Pavement and Bridge Goals? STC Policy Maintaining and growing Michigan s economy depends on the preservation, modernization, and efficient operation of its transportation system. To achieve the goals that have been set forth, it is necessary to benchmark and monitor the performance of the system. MDOT formalized its approach to improving, measuring, and reporting the condition of its transportation network with the STC s 1997 adoption of pavement and bridge condition goals. Pavement Condition Commission Goals In 1997, the STC adopted the long-term goal of having 95 percent of freeways and 85 percent of MDOT non-freeways in good or fair condition based on the RSL performance measure. RSL measures a pavement s overall condition, and is defined as the estimated remaining time in years until a pavement s most cost-effective treatment requires either reconstruction or major repair. When pavements reach an RSL of two years or less, the pavement is considered poor. The graph below represents historic MDOT system condition based on RSL. In 2005, MDOT surpassed the non-freeway goal of 85 percent pavement in good or fair condition and maintained this condition through Freeway condition peaked at 93 percent good or fair condition in Pavement condition deterioration is forecasted to accelerate considerably in the coming years. Figure 25: Historic MDOT Truck Freeway and Non-Freeway RSL Pavement Condition Freeway condition peaked at 93 percent good or fair condition in Source: MDOT Bureau of Transportation Planning 40 Michigan Department of Transportation
 Pavement Goals increased again in 2016 and met the freeway bridge condition goal of 95 percent at the end of 2016.")

45 Performance Gap Analysis Pavement Condition SOGR Goals In 2017, MDOT SOGR goals for each of the pavement networks, as well as local NHS routes, were as shown below. Figure 26: State of Good (SOGR) Pavement Goals increased again in 2016 and met the freeway bridge condition goal of 95 percent at the end of However, projections indicate that, without additional funding, the freeway bridge condition declines and bridge condition will again fall below the freeway bridge goal. As shown in the chart below, MDOT has met and sustained the non-freeway bridge goal of 85 percent good or fair condition since Pavement and Bridge Condition Performance Gaps Short-Term Targets for Pavements and Bridges Condition Gap As mentioned earlier, MDOT is currently in the process of establishing short-term targets for pavement condition measures on the Interstate and Non-Interstate NHS based on the four-condition metrics outlined in federal regulations. Similar to the pavement process, MDOT is currently in the process of establishing short-term targets for bridge condition measures on the NHS. These targets will be based on the NBI minimum condition ratings. Once these statewide targets are adopted, a future edition of this plan will identify the performance gap between current pavement and bridge conditions and the short-term targets. The long-term SOGR goal for the Interstate system is consistent with the national goal of having no more than 5 percent in poor condition. The long-term SOGR goal for Non-Interstate NHS routes is 85 percent in good/fair condition. Figure 27: Trunkline Freeway and Non-Freeway Bridge Condition Bridge Condition SOGR Goals In addition to the pavement goals adopted by the STC in 1997, MDOT bridge condition goals were established one year later. MDOT s current long-term bridge condition goals are based on count of bridges and are 95 percent good or fair on the freeway system and 85 percent good or fair on the non-freeway system. Bridge condition is based on NBI minimum condition ratings. Minimum condition ratings are found by taking the lowest condition of either the deck, superstructure, substructure or culvert ratings. A bridge is considered poor when one of these ratings is 4 or less. MDOT bridge conditions were close to 95 percent good or fair at the end of They declined slightly in 2014 and 2015, but Source: Bureau of Bridges and Structures 2018 Transportation Asset Management Plan 41
46 Performance Gap Analysis Long-Term SOGR Goals - Pavement Condition Gap The following two graphs depict the gap in condition between the long-term SOGR pavement goals and the current and/or projected future pavement condition for the Interstate and Non-Interstate NHS networks. Future condition is forecasted based on the constrained investment strategy discussed in the Investment Strategies chapter of this plan. Figure 28: Interstate Pavement Condition Gap Figure 29: Non-Interstate NHS Pavement Condition Gap Source: MDOT Bureau of Transportation Planning Source: MDOT Bureau of Transportation Planning 42 Michigan Department of Transportation
47 Performance Gap Analysis Bridge Condition Gap - Long-Term SOGR Goals The following graph depicts the gap in condition between the long-term SOGR bridge goals and the current and/or projected future bridge condition for the NHS network. This condition is statewide NHS and includes local agency and bridge authority bridges. Future condition is forecasted based on the constrained investment strategy discussed in the Investment Strategies chapter of this plan. Figure 30: NHS Bridge Condition Gap Source: MDOT Bureau of Bridges and Structures 2018 Transportation Asset Management Plan 43
48


49 Conclusion: Closing the Gap To meet the national goal for Interstate pavement, an average additional investment of $308 million per year would be needed through This includes the $235 million currently invested annually in the Non-Interstate trunkline NHS pavement plus an addition $73 million in new revenue per year. This investment improves the condition of the Interstate routes to 95 percent good/fair at the expense (by diversion of funds) of the current constrained investment on the Non-Interstate trunkline NHS. This results in a severely declining condition on the Non- Interstate NHS over the analysis period, which is deemed unacceptable. Figure 31: Achieving National Interstate Condition Goal with All Current Trunkline Funds Plus $73M/yr (No Available Investment for Trunkline Non-Interstate NHS) Meeting the national goal for Interstate pavement would require diverting investment from the Non-Interstate NHS. Source: MDOT Bureau of Transportation Planning 2018 Transportation Asset Management Plan 45
50 Conclusion: Closing the Gap To meet the SOGR for NHS pavement, an average additional investment of $924 million per year would be needed through This is comprised of an additional $308 million per year for the Interstate system and an additional $616 million per year for the Non-Interstate NHS. This investment improves the condition of the Interstate routes to 95 percent good or fair and improves the Non-Interstate NHS pavement conditions to 85 percent good/fair. The two condition curves for meeting the SOGR for the Interstate System and Non-Interstate NHS are shown on the following pages: Figure 32: Michigan Interstate RSL Pavement Forecast Comparison by Lane Miles An increase of $308 million annually over current investment levels is needed to improve the Interstate System to a State of Good Repair. Source: MDOT Bureau of Transportation Planning 46 Michigan Department of Transportation
51 Conclusion: Closing the Gap Figure 33: Michigan Non-Interstate NHS RSL/PASER Pavement Condition Forcast Comparison by Lane Miles An increase of $616 million annually over current investment levels is needed to improve the Non-Interstate System to a State of Good Repair. Source: MDOT Bureau of Transportation Planning To preserve the current condition for NHS pavement, additional investment would be needed through The average additional investment needed is $800 million per year through This is comprised of $240 million per year additional for the Interstate and $560 million per year additional for the Non-Interstate NHS. This investment generally maintains Michigan s current condition on Interstate routes of 85 percent good/fair and 77 percent good/fair on the Non-Interstate NHS pavement over the analysis period with some intermediate declines before recovery Transportation Asset Management Plan 47

52
Tools & Methods for Monitoring Performance Results
 Tools & Methods for Monitoring Performance Results Craig B. Newell Bureau of Transportation Planning Manager Michigan Department of Transportation Overview of MDOT s Tools & Methods for Monitoring Performance
Maintenance Funding & Investment Decisions STACEY GLASS, P.E. STATE MAINTENANCE ENGINEER ALABAMA DEPARTMENT OF TRANSPORTATION
 Maintenance Funding & Investment Decisions STACEY GLASS, P.E. STATE MAINTENANCE ENGINEER ALABAMA DEPARTMENT OF TRANSPORTATION Funding Allocations Routine State $ 166 Million Resurfacing Federal $ 260 Million
GLOSSARY. At-Grade Crossing: Intersection of two roadways or a highway and a railroad at the same grade.
 Glossary GLOSSARY Advanced Construction (AC): Authorization of Advanced Construction (AC) is a procedure that allows the State to designate a project as eligible for future federal funds while proceeding
Pavement Management Technical Report
 Pavement Management Technical Report October 2008 Prepared by the Genesee County Metropolitan Planning Commission Pavement Management Technical Report Pavement Management System Technical Report 1 What
10-Year Capital Highway Investment Plan DRAFT
 This document is made available electronically by the Minnesota Legislative Reference Library as part of an ongoing digital archiving project. http://www.leg.state.mn.us/lrl/lrl.asp 10-Year Capital Highway
Tony Mento, P.E. January 2017
 Tony Mento, P.E. January 2017 Evolution of the Federal Program Manage ITS & Operations Manage Build preserve maintain Outcome Performance 2 National Highway Performance Program ($21.8B) Funds an enhanced
Florida Department of Transportation INITIAL TRANSPORTATION ASSET MANAGEMENT PLAN
 Florida Department of Transportation INITIAL TRANSPORTATION ASSET MANAGEMENT PLAN April 30, 2018 (This page intentionally left blank) Table of Contents Chapter 1 Introduction... 1-1 Chapter 2 Asset Management
2016 PAVEMENT CONDITION ANNUAL REPORT
 2016 PAVEMENT CONDITION ANNUAL REPORT January 2017 Office of Materials and Road Research Pavement Management Unit Table of Contents INTRODUCTION... 1 BACKGROUND... 1 DATA COLLECTION... 1 INDICES AND MEASURES...
FY Statewide Capital Investment Strategy... asset management, performance-based strategic direction
 FY 2009-2018 Statewide Capital Investment Strategy.. asset management, performance-based strategic direction March 31, 2008 Governor Jon S. Corzine Commissioner Kris Kolluri Table of Contents I. EXECUTIVE
10-Year Capital Highway Investment Plan DRAFT
 10-Year Capital Highway Investment Plan DRAFT 2018-2027 DRAFT AUGUST 2017 1 Table of Contents PURPOSE OF 10-YEAR CAPITAL HIGHWAY INVESTMENT PLAN... 1 This page intentionally left blank. SUMMARY OF INVESTMENT
House Bill 20 Implementation. House Select Committee on Transportation Planning Tuesday, August 30, 2016, 1:00 P.M. Capitol Extension E2.
 House Bill 20 Implementation Tuesday,, 1:00 P.M. Capitol Extension E2.020 INTRODUCTION In response to House Bill 20 (HB 20), 84 th Legislature, Regular Session, 2015, and as part of the implementation
Economic Impact and Policy Analysis of Four Michigan Transportation Investment Proposals
 Issued: June 2012 Revised-September 2012 Economic Impact and Policy Analysis of Four Michigan Transportation Investment Proposals Prepared by: Anderson Economic Group, LLC Alex Rosaen, Consultant Colby
Michigan s Roads Crisis: How Much Will It Cost to Maintain Our Roads and Bridges? 2014 Update
 Michigan s Roads Crisis: How Much Will It Cost to Maintain Our Roads and Bridges? 2014 Update By Rick Olson, former State Representative Reporting analytical work performed by Gil Chesbro and Jim Ashman,
SCDOT & MPO/COG Planning Partnership. Rebuilding our Roads Performance Management
 SCDOT & MPO/COG Planning Partnership Rebuilding our Roads Performance Management Fatality Rate in the Nation Structurally Deficient Bridges in our inventory Current Dashboard of our Transportation System
Corridors of Commerce DRAFT Scoring and Prioritization Process. Patrick Weidemann Director of Capital Planning and Programming November 1, 2017
 Corridors of Commerce DRAFT Scoring and Prioritization Process Patrick Weidemann Director of Capital Planning and Programming November 1, 2017 Project Purpose To develop and implement a scoring and project
Draft. Amendment FY Unified Planning Work Program
 FY 2018 FY Unified Planning Work Program Kalamazoo Area Transportation Study 5220 Lovers Lane, Suite 110 Portage, MI 49002 (269) 343-0766 www.katsmpo.org Page 1 of 75 [This page intentionally left blank.]
City of Grand Forks Staff Report
 City of Grand Forks Staff Report Committee of the Whole November 28, 2016 City Council December 5, 2016 Agenda Item: Federal Transportation Funding Request Urban Roads Program Submitted by: Engineering
Additionally, the UPWP serves as a source for the following information:
 Executive Summary ES.1 WHAT IS THE UPWP? The Unified Planning Work Program (UPWP) produced by the Boston Region Metropolitan Planning Organization (MPO) explains how the Boston region s federal transportation
Interested Parties William E. Hamilton Transportation Needs and Revenue Distribution
 MEMORANDUM DATE: December 3, 2010 TO: FROM: RE: Interested Parties William E. Hamilton Transportation Needs and Revenue Distribution Introduction Michigan residents rely on a safe efficient transportation
Webinar 11 August 12, 2014
 Transporta)on*Asset*Management* Webinar*Series* Webinar(11:(Managing(NHS(Assets(( Not(Owned(by(the(State( ( Sponsored(by(FHWA(and(AASHTO( ( Submit*ques)ons*and*comments*using*the*webinar s*q&a*feature(
2017 UNIFIED TRANSPORTATION PROGRAM AND HB 20 IMPLEMENTATION
 2017 UNIFIED TRANSPORTATION PROGRAM AND HB 20 IMPLEMENTATION TEMPO Meeting July 21, 2016 Current Initiatives On-going efforts to address performance-based planning and programming processes as required
CHAPTER 5 INVESTMENT PLAN
 CHAPTER 5 INVESTMENT PLAN This chapter of the 2014 RTP/SCS plan illustrates the transportation investments for the Stanislaus region. Funding for transportation improvements is limited and has generally
Mn/DOT Scoping Process Narrative
 Table of Contents 1 Project Planning Phase...3 1.1 Identify Needs...4 1.2 Compile List of Needs = Needs List...4 1.3 Define Project Concept...5 1.4 Apply Fiscal/Other Constraints...5 1.5 Compile List of
White Paper: Performance-Based Needs Assessment
 White Paper: Performance-Based Needs Assessment Prepared for: Meeting Federal Surface Transportation Requirements in Statewide and Metropolitan Transportation Planning: A Conference Requested by: American
Appendix E: Revenues and Cost Estimates
 Appendix E: Revenues and Cost Estimates Photo Source: Mission Media Regional Financial Plan 2020-2040 Each metropolitan transportation plan must include a financial plan. In this financial plan, the region
INVESTMENT STRATEGIES
 3 INVESTMENT STRATEGIES 70 INVESTMENT STRATEGIES 71 A key role of Mobilizing Tomorrow is to outline a strategy for how the region will invest in transportation infrastructure over the next 35 years. This
MoDOT Dashboard. Measurements of Performance
 MoDOT Dashboard Measurements of Performance 1997 1998 1999 2000 2001 2002 MoDOT Dashboard Executive Summary Performance measurement is not new to MoDOT. In July 2001, MoDOT staff began completing quarterly
ABILENE MPO TRANSPORTATION POLICY BOARD MEETING
 ABILENE MPO TRANSPORTATION POLICY BOARD MEETING Tuesday, October 16, 2018 at 1:30 pm City Council Chambers Abilene City Hall 555 Walnut Street, Abilene, Texas 1. Call to Order. Public comment may be taken
Revenue Sharing Program Guidelines
 Revenue Sharing Program Guidelines For further information, contact Local VDOT Manager or Local Assistance Division Virginia Department of Transportation 1401 East Broad Street Richmond, Virginia 23219
INVESTING STRATEGICALLY
 11 INVESTING STRATEGICALLY Federal transportation legislation (Fixing America s Surface Transportation Act FAST Act) requires that the 2040 RTP be based on a financial plan that demonstrates how the program
2017 Educational Series FUNDING
 2017 Educational Series FUNDING TXDOT FUNDING INTRODUCTION Transportation projects take many years to develop and construct. In addition to the design, engineering, public involvement, right-of-way acquisition,
RIDOT The Ten Year Plan, Asset Management, and Innovation Moving Ahead in the 21 st Century
 RIDOT The Ten Year Plan, Asset Management, and Innovation Moving Ahead in the 21 st Century Accent image here Rhode Island Bar Association Environmental and Energy Law Committee (EELC) February 16, 2018
Contents. Alamo Area Metropolitan Planning Organization. Introduction S. St. Mary s Street San Antonio, Texas 78205
 Contents Introduction 1 Alamo Area Metropolitan Planning Organization Tel 210.227.8651 Fax 210.227.9321 825 S. St. Mary s Street San Antonio, Texas 78205 www.alamoareampo.org aampo@alamoareampo.org Pg.
PENNSYLVANIA S 2017 TRANSPORTATION PROGRAM FINANCIAL GUIDANCE
 November 20, 2015 Revised December 18, 2015 to reflect FAST Act PENNSYLVANIA S 2017 TRANSPORTATION PROGRAM FINANCIAL GUIDANCE This is a collaborative product jointly developed by the Pennsylvania Planning
Revenue Sharing Program Guidelines
 Revenue Sharing Program Guidelines For further information, contact Local VDOT Manager or Local Assistance Division Virginia Department of Transportation 1401 East Broad Street Richmond, Virginia 23219
NCHRP Consequences of Delayed Maintenance
 NCHRP 14-20 Consequences of Delayed Maintenance Recommended Process for Bridges and Pavements prepared for NCHRP prepared by Cambridge Systematics, Inc. with Applied Research Associates, Inc. Spy Pond
2017 UNIFIED TRANSPORTATION PROGRAM AND HB 20 IMPLEMENTATION
 2017 UNIFIED TRANSPORTATION PROGRAM AND HB 20 IMPLEMENTATION HGAC Transportation Policy Council Meeting Current Initiatives On-going efforts to address performance-based planning and programming processes
A PROCEDURAL DOCUMENT DESCRIBING THE PROCESS OF DEVELOPING THE 4-YEAR PLAN
 5-9035-01-P8 A PROCEDURAL DOCUMENT DESCRIBING THE PROCESS OF DEVELOPING THE 4-YEAR PLAN Authors: Zhanmin Zhang Michael R. Murphy TxDOT Project 5-9035-01: Pilot Implementation of a Web-based GIS System
SOUTHERN BELTWAY US-22 TO I-79 PROJECT 2013 FINANCIAL PLAN. Pennsylvania Turnpike Commission Allegheny and Washington Counties, Pennsylvania
 SOUTHERN BELTWAY US-22 TO I-79 PROJECT 2013 FINANCIAL PLAN Pennsylvania Turnpike Commission Allegheny and Washington Counties, Pennsylvania January 2013 Table of Contents... 1 Introduction... 2 Project
Projected Funding & Highway Conditions
 Projected Funding & Highway Conditions Area Commission on Transportation Gary Farnsworth ODOT Interim Region 4 Manager March, 2011 Overview ODOT is facing funding reductions that will require new strategies
City of Glendale, Arizona Pavement Management Program
 City of Glendale, Arizona Pavement Management Program Current Year Plan (FY 2014) and Five-Year Plan (FY 2015-2019) EXECUTIVE SUMMARY REPORT December 2013 TABLE OF CONTENTS TABLE OF CONTENTS I BACKGROUND
ALL Counties. ALL Districts
 TEXAS TRANSPORTATION COMMISSION ALL Counties rhnute ORDER Page of ALL Districts The Texas Transportation Commission (commission) finds it necessary to propose amendments to. and., relating to Transportation
Deck Preservation Strategies with a Bridge Management System. Paul Jensen Montana Department of Transportation
 Deck Preservation Strategies with a Bridge Management System Paul Jensen Montana Department of Transportation Email : pjensen@mt.gov Development Of A Roadmap Definitions Outcomes Culture Models Performance
LOCAL MAJOR BRIDGE PROGRAM
 LOCAL MAJOR BRIDGE PROGRAM The Local Major Bridge Program provides federal funds to counties and municipal corporations for bridge replacement or bridge major rehabilitation projects. A Local Major Bridge
The City of Owen Sound Asset Management Plan
 The City of Owen Sound Asset Management Plan December 013 Adopted by Council March 4, 014 TABLE OF CONTENTS 1 EXECUTIVE SUMMARY... 1 INTRODUCTION....1 Vision.... What is Asset Management?....3 Link to
BINGHAMTON METROPOLITAN TRANSPORTATION STUDY CERTIFICATION NARRATIVE FY 2016
 BINGHAMTON METROPOLITAN TRANSPORTATION STUDY CERTIFICATION NARRATIVE FY 2016 The Binghamton Metropolitan Transportation Study Policy Committee is designated by the Governor of New York as the Metropolitan
Residential Street Improvement Plan
 Residential Street Improvement Plan Introduction Aging infrastructure, including streets, is a nationwide problem and it is one of the biggest challenges facing many cities and counties throughout the
Michigan s Roads Crisis: What Will It Cost to Maintain Our Roads and Bridges? 2012 Update
 Michigan s Roads Crisis: What Will It Cost to Maintain Our Roads and Bridges? 2012 Update (A Report of the Work Group on Transportation Funding, of the House of Representatives Transportation Committee)
Improving Management Presentations
 Southeastern States Equipment Managers Conference EMTSP Improving Management Presentations 2016 National Conference June 29, 2016 John F. White, PE 803 737 6675 Challenge You have a story to tell. The
2018 Annual Report. Highway Department Accomplishments
 2018 Annual Report Highway Department The vision of the Eau Claire County Highway Department is to provide services to the taxpayer that, to the best of our ability, provides safe and efficient travel
JACKSONVILLE URBAN AREA METROPOLITAN PLANNING ORGANIZATION UNIFIED PLANNING WORK PROGRAM AMENDMENT 1 FISCAL YEAR 2018 TABLE OF CONTENTS
 JACKSONVILLE URBAN AREA METROPOLITAN PLANNING ORGANIZATION UNIFIED PLANNING WORK PROGRAM AMENDMENT 1 FISCAL YEAR 2018 TABLE OF CONTENTS Introduction 1 Five Year Planning Calendar 3 Budget Summary 4 Unified
2045 Long Range Transportation
 The Jackson Area Comprehensive Transportation Study 2045 Long Range Transportation June 2018 Jackson Area Comprehensive Transportation Study 2045 Long Range Transportation Plan Jackson County, Michigan
In addition to embarking on a new dialogue on Ohio s transportation priorities,
 Strategic Initiatives for 2008-2009 ODOT Action to Answer the Challenges of Today In addition to embarking on a new dialogue on Ohio s transportation priorities, the Strategic Initiatives set forth by
Hosten, Chowdhury, Shekharan, Ayotte, Coggins 1
 Hosten, Chowdhury, Shekharan, Ayotte, Coggins 1 USE OF VDOT S PAVEMENT MANAGEMENT SYSTEM TO PROACTIVELY PLAN AND MONITOR PAVEMENT MAINTENANCE AND REHABILITATION ACTIVITIES TO MEET THE AGENCY S PERFORMANCE
Maricopa County DOT. Transportation Asset Management (TAM) Planning. March 1, 2018 DYE MANAGEMENT GROUP, INC.
 Planning. March 1, 2018 DYE MANAGEMENT GROUP, INC.") Maricopa County DOT Transportation Asset Management (TAM) Planning March 1, 2018 DYE MANAGEMENT GROUP, INC. Transportation Asset Management (TAM) A strategic and systematic process of operating, maintaining,
Maricopa County DOT Transportation Asset Management (TAM) Planning March 1, 2018 DYE MANAGEMENT GROUP, INC. Transportation Asset Management (TAM) A strategic and systematic process of operating, maintaining,
UNIFIED TRANSPORTATION PROGRAM
 2002 UNIFIED TRANSPORTATION PROGRAM Blank Page SUMMARY OF CATEGORIES CATEGORIES NUMBER, NAME AND YEAR ESTABLISHED PROGRAMMING AUTHORITY FUNDING BANK BALANCE (Yes/) RESPONSIBLE ENTITY RANKING INDEX OR ALLOCATION
HigHway Carrying Bridges in new Jersey
 Highway Carrying Bridges in New Jersey Final Report October 2007 Table of Contents Executive Summary 2 I. Introduction 3 II. Findings Current Bridge Condition 4 Total Bridge Inventory 4 Age of Bridges
Developing a Transportation Asset Management Plan
 Developing a Transportation Asset Management Plan A Workshop for the NCDOT July 2, 2015 Conducted By: Katie Zimmerman, P.E., Applied Pavement Technology, Inc. (APTech) And Lacy Love, Volkert, Inc. Workshop
Incorporating Climate and Extreme Weather Risk in Transportation Asset Management. Michael Meyer and Michael Flood WSP Parsons Brinckerhoff
 Incorporating Climate and Extreme Weather Risk in Transportation Asset Management Michael Meyer and Michael Flood WSP Parsons Brinckerhoff 1. Define Scope 2. Assess & Address Climate Risk 3. Integrate
C ITY OF S OUTH E UCLID
 C ITY OF S OUTH E UCLID T A B L E O F C O N T E N T S 1. Executive Summary... 2 2. Background... 3 3. PART I: 2016 Pavement Condition... 8 4. PART II: 2018 Current Backlog... 12 5. PART III: Maintenance
SFY 2018 (July 1, 2017 to June 30, 2018) Annual Report
 Annual Report") SFY 2018 (July 1, 2017 to June 30, 2018) Annual Report Thurston Regional Planning Council UNIFIED PLANNING WORK PROGRAM Annual Report for second year of TRPC s UPWP State Fiscal Years 2017-2018 (July 1,
SFY 2018 (July 1, 2017 to June 30, 2018) Annual Report Thurston Regional Planning Council UNIFIED PLANNING WORK PROGRAM Annual Report for second year of TRPC s UPWP State Fiscal Years 2017-2018 (July 1,
Texas Department of Transportation Page 1 of 42 Planning and Development of Transportation Projects
 Texas Department of Transportation Page of Proposed Preamble The Texas Department of Transportation (department) proposes amendments to.,.,. -.,.0 -.0, new.0, and amendments to. -.,.,.0, and.0 -.0, all
Fiscal Year VDOT Annual Budget June 2017
 Fiscal Year 2018 VDOT Annual Budget June 2017 This Page Intentionally Left Blank Annual Budget FY 2018 2 Virginia Department of Transportation Table of Contents Overview.. 5 Revenues.. 7 Highway Maintenance
Financial Snapshot October 2014
 Financial Snapshot October 2014 Financial Snapshot About the Financial Snapshot The Financial Snapshot provides answers to frequently asked questions regarding MoDOT s finances. This document provides
Chapter 6: Financial Resources
 Chapter 6: Financial Resources Introduction This chapter presents the project cost estimates, revenue assumptions and projected revenues for the Lake~Sumter MPO. The analysis reflects a multi-modal transportation
2040 Long Range Transportation Plan - Needs Assessment: System Preservation Pavement, Bridges, and Transit Costs and Benefits
 2040 Long Range Transportation Plan - Needs Assessment: System Preservation Pavement, Bridges, and Transit Costs and Benefits Prepared For: 601 East Kennedy Boulevard Tampa, FL 33602 Prepared by: Jacobs
FY Unified Planning Work Program. FY 2017 Unified Planning Work Program
 FY 2017 Unified Planning Work Program Kalamazoo Area Transportation Study 5220 Lovers Lane, Suite 110 Portage, MI 49002 (269) 343-0766 info@katsmpo.org www.katsmpo.org 1 [This page intentionally left blank.]
CalACT Expo Transit Asset Management (TAM) Plan Workshop 49 CFR 625 April 24, 2017
 Plan Workshop 49 CFR 625 April 24, 2017") CalACT Expo Transit Asset Management (TAM) Plan Workshop 49 CFR 625 April 24, 2017 Poll Question 2 Today s Presentation Transit Asset Management Context and Background Final Rule Provisions Reduced burden
CalACT Expo Transit Asset Management (TAM) Plan Workshop 49 CFR 625 April 24, 2017 Poll Question 2 Today s Presentation Transit Asset Management Context and Background Final Rule Provisions Reduced burden
Analysis of Past NBI Ratings for Predicting Future Bridge System Preservation Needs
 Analysis of Past NBI Ratings for Predicting Future Bridge System Preservation Needs Xiaoduan Sun, Ph.D., P.E. Civil Engineering Department University of Louisiana at Lafayette P.O. Box 4229, Lafayette,
N A D O N A D O R E S E A R C H F O U N D AT I O N R P O A M E R I C A
 2009 NATIONAL SCAN: RURAL TRANSPORTATION PLANNING ORGANIZATIONS 2009 National Scan Results: Rural Transportation Planning Organizations Since the passage of ISTEA, an increasing number of states have turned
Safety Target Meeting Summary 10/3/2017
 Safety Target Meeting Summary 10/3/2017 Recommendation: It was the recommendation of the committee that OTO support the statewide safety targets. Discussion: Natasha Longpine presented background information
Regional Equity Analysis Of Current Funding (Highway STIP and CIP) Project Selection Advisory (PSA) Council
 Project Selection Advisory (PSA) Council") Regional Equity Analysis Of Current Funding (Highway STIP and CIP) Project Selection Advisory (PSA) Council TABLE OF CONTENTS 1 Introduction and Analysis Framework... 1-1 1.1 The Project Selection Advisory
Regional Equity Analysis Of Current Funding (Highway STIP and CIP) Project Selection Advisory (PSA) Council TABLE OF CONTENTS 1 Introduction and Analysis Framework... 1-1 1.1 The Project Selection Advisory
Performance-based Planning and Programming. white paper
 white paper May 2012 white paper Performance-based Planning and Programming date May 2012 NOTICE This document is disseminated under the sponsorship of the U.S. Department of Transportation in the interest
Performance-Based Planning and Programming Why Is It Important? Northwest TTAP and BIA Symposium Portland, OR March 17, 2015
 Performance-Based Planning and Programming Why Is It Important? Northwest TTAP and BIA Symposium Portland, OR March 17, 2015 Transportation has two purposes & Mobility Access Quileute Reservation La Push,
Chapter 12: Programming/Resource Allocation
 Chapter 12: Programming/Resource Allocation What is works programming? Works programming refers to the preparation of annual and multi-annual works programs in which road assets requiring treatment are
STUDY SCHEDULE STUDY PURPOSE
 STUDY SCHEDULE This Open House is the last of three public meetings for the Route Centennial Bridge Study. The material presented previously at the second Open House in July 2015 focused upon Corridor
Analysis of TAMC Investment Reporting Data for Network Level Modeling on the Locally Owned Road System in Michigan
 Analysis of TAMC Investment Reporting Data for Network Level Modeling on the Locally Owned Road System in Michigan Photo Credit: Alcona County Road Commission Andy Manty, PE, Research Engineer Center for
Stephen Gaj Leader, Asset Management Team Office of Asset Management, Pavements, and Construction FHWA
 Stephen Gaj Leader, Asset Management Team Office of Asset Management, Pavements, and Construction FHWA National Goals Focus the Federal-aid program on the following national goals: 1) SAFETY 2) INFRASTRUCTURE
Transportation Trust Fund Overview
 Transportation Trust Fund Overview Created pursuant to New Jersey Transportation Trust Fund Authority Act of 1984 Established to finance the cost of planning, acquisition, engineering, construction, reconstruction,
Pavement Condition Forecasting System (PCFS) A Network Level Funding & Strategy Analysis Tool
 A Network Level Funding & Strategy Analysis Tool") Pavement Condition Forecasting System (PCFS) A Network Level Funding & Strategy Analysis Tool Ron Vibbert, Manager Asset Management Section, Michigan DOT San Diego, CA April 17, 2012 What is the PCFS?
Pavement Condition Forecasting System (PCFS) A Network Level Funding & Strategy Analysis Tool Ron Vibbert, Manager Asset Management Section, Michigan DOT San Diego, CA April 17, 2012 What is the PCFS?
Randy Ort Assistant Chief - Administration. Southwest Arkansas Transportation
 Randy Ort Assistant Chief - Administration Southwest Arkansas Transportation Monday, October 19, 2018 ARDOT Quick Facts 3rd Largest State Agency (app. 3,700 Employees) Maintains 16,418 miles of Highway
Strengthening Vermont s Economy by Integrating Transportation and Smart Growth Policy
 Strengthening Vermont s Economy by Integrating Transportation and Smart Growth Policy Technical Memorandum #4: Short List of Recommended Alternatives May 21, 2013 Tech Memo #4: Short List of Recommended
Joint Appropriations Subcommittee on Transportation
 Joint Appropriations Subcommittee on Transportation Funding Overview February 21, 2013 H. Tasaico, PE 1 NCDOT Funding Overview - Agenda State Transportation Comparative Data Transportation Funding Sources
Examples of Decision Support Using Pavement Management Data
 Examples of Decision Support Using Pavement Management Data John Coplantz, PE Pavement Management Engineer Oregon Department of Transportation October 27, 2016 Strategic Network (Tactical) Project (Operational)
Chapter 2 Performance and Funding Gap Analysis
 Chapter 2 Performance and Funding Gap Analysis The first steps in addressing a county s system preservation issues is to assemble pertinent data, evaluate it, ascertain if preservation needs exist, and
1.0 CITY OF HOLLYWOOD, FL
 1.0 CITY OF HOLLYWOOD, FL PAVEMENT MANAGEMENT SYSTEM REPORT 1.1 PROJECT INTRODUCTION The nation's highways represent an investment of billions of dollars by local, state and federal governments. For the
Asset Management Guide for Local Agencies in Michigan
 Asset Management Guide for Local Agencies in Michigan sponsored by Michigan Transportation Asset Management Council prepared by Cambridge Systematics, Inc. revised by Michigan s Local Technical Assistance
Pennsylvania Department of Transportation s Statewide Procedures for STIP and TIP Revisions
 MEMORANDUM OF UNDERSTANDING Pennsylvania Department of Transportation s Statewide Procedures for 2017-2020 STIP and TIP Revisions Purpose This Memorandum of Understanding (MOU) establishes a set of procedures
Multisector Asset Management Case Studies CHAPTER 5 THE PORTLAND, OREGON, EXPERIENCE
 56 Multisector Asset Management Case Studies CHAPTER 5 THE PORTLAND, OREGON, EXPERIENCE The City of Portland (City) with a population of 568,000 comprises an area of approximately 145 square miles in north-western
MADISON ATHENS-CLARKE OCONEE REGIONAL TRANSPORTATION STUDY UNIFIED PLANNING WORK PROGRAM FY
 MADISON ATHENS-CLARKE OCONEE REGIONAL TRANSPORTATION STUDY UNIFIED PLANNING WORK PROGRAM FY - 2018 Final April 12, 2017 Prepared by: Athens-Clarke County Planning Department In Cooperation with: The Georgia
10-Year Capital Highway Investment Plan
 10-Year Capital Highway Investment Plan 2017-2026 OCTOBER 2016 1 Table of Contents PURPOSE OF 10-YEAR CAPITAL HIGHWAY INVESTMENT PLAN...1 This page intentionally left blank. SUMMARY OF INVESTMENT PLANS...6
Making the Business Case for Risk- Based Asset Management
 Making the Business Case for Risk- Based Asset Management TRB 11 th National Conference on Transportation Asset Management Brenda Dix July 11, 2016 Presentation Agenda Setting the stage Why do we care?
PUBLIC WORKS CIP SUPPORT
 PUBLIC WORKS Public Works is comprised of several Departments/Divisions that develop, improve, and maintain the County s basic infrastructure needs related to transportation, storm water management, and
8 FINANCIAL PLAN AND INVESTMENT STRATEGIES: SUPPLEMENTAL INFORMATION
 Chapter 8 FINANCIAL PLAN AND INVESTMENT STRATEGIES: SUPPLEMENTAL INFORMATION CHAPTER 8 FINANCIAL PLAN AND INVESTMENT STRATEGIES: SUPPLEMENTAL INFORMATION PAGE 86 FINANCIAL PLAN AND INVESTMENT STRATEGIES:
MEMORANDUM OF UNDERSTANDING Lehigh Valley Transportation Study's Procedures for TIP M odifications
 MEMORANDUM OF UNDERSTANDING Lehigh Valley Transportation Study's Procedures for 2017-2020 TIP M odifications Purpose This Memorandum of Understanding (MOU) establishes a set of procedures to be used by
Transportation Improvement Program and Incentives for Local Planning
 Capital District November 9, 2004 Transportation Committee Transportation Improvement Program and Incentives for Local Planning CDTC has been successful in funding 36 Linkage Program planning studies since
Georgia Department of Audits and Accounts Performance Audit Division
 Special Examination Report No. 16-17 December 2016 Georgia Department of Audits and Accounts Performance Audit Division Greg S. Griffin, State Auditor Leslie McGuire, Director Why we did this review This
I-64 Capacity Improvements Segment III Initial Financial Plan
 I-64 Capacity Improvements Segment III Initial Financial Plan State Project # 0064-965-229/0064-099-229 P101, R201, C501, B638, B639, B640, B641, B642, B643, D609, D610, D611 Federal # NHPP-064-3(498)/
Glossary Candidate Roadway Project Evaluation Form Project Scoring Sheet... 17
 Kitsap County Public Works Transportation Project Evaluation System 2017 Table of Contents Introduction... 1 Four-Tier system... 4 Tier 1 - Transportation Improvement Program (TIP)... 4 Tier 2 Prioritized