Performance-based Planning and Programming. white paper
|
|
|
- Claude Hamilton
- 6 years ago
- Views:
Transcription

1 white paper May 2012
2 white paper Performance-based Planning and Programming date May 2012
3 NOTICE This document is disseminated under the sponsorship of the U.S. Department of Transportation in the interest of information exchange. The U.S. Government assumes no liability for the use of the information contained in this document. This report does not constitute a standard, specification, or regulation. The U.S. Government does not endorse products or manufacturers. Trademarks or manufacturers names may appear in this report only because they are considered essential to the objective of the document. QUALITY ASSURANCE STATEMENT The Federal Highway Administration (FHWA) provides high-quality information to serve Government, industry, and the public in a manner that promotes public understanding. Standards and policies are used to ensure and maximize the quality, objectivity, utility, and integrity of its information. FHWA periodically reviews quality issues and adjusts its programs and processes to ensure continuous quality improvement.
4 Technical Report Documentation Page 1. Report No. 2. Government Accession No. 3. Recipient s Catalog No. FHWA-HEP Title and Subtitle 5. Report Date Performance-based Planning and Programming May Performing Organization Code 7. Author(s) Hugh Louch 9. Performing Organization Name and Address Cambridge Systematics, Inc. 38 E. 32nd Street, 7 th Floor New York, NY Sponsoring Agency Name and Address United States Department of Transportation Federal Highway Administration 1200 New Jersey Ave, SE Washington, DC Performing Organization Report No. 10. Work Unit No. 11. Contract or Grant No. DTFH Type of Report and Period Covered White Paper May 2011 to May Sponsoring Agency Code HEP 15. Supplementary Notes Mr. Egan Smith, Federal Highway Administration, COTR 16. Abstract In response to recent economic, political, and social trends that have placed greater emphasis on publicsector accountability and cost-effectiveness, transportation agencies across the country have increasingly embraced performance management and performance-based planning and programming as a way to ensure that transportation resources are spent on projects and strategies that best serve communities needs. This white paper describes the common elements of a performance-based transportation planning and programming process, building on work conducted by State departments of transportation (DOT), metropolitan planning organizations (MPO), and transit agencies. The white paper describes current practices in use at several transportation agencies and opportunities to incorporate performance measurement and management techniques into the federally required planning process. 17. Key Words Performance, performance measurement, performance management, planning, programming 19. Security Classif. (of this report) Unclassified 18. Distribution Statement No restrictions. This document is available to the public through the National Technical Information Service, Springfield, VA Security Classif. (of this page) Unclassified 21. No of Pages Price N/A Form DOT F (8-72) Reproduction of completed pages authorized
5 Table of Contents Executive Summary Introduction Key Concepts Organization of the White Paper Performance-based Planning and Programming Examples Minnesota DOT Southeast Michigan Council of Governments Washington Metropolitan Area Transit Authority Performance-based Planning and Programming Common Elements of Performance-based Planning and Programming Performance-based Planning and Programming Process Other Issues Next Steps i
6 List of Tables Table ES.1 Performance-based Planning and Programming Elements... 2 Table 2.1 SEMCOG Performance Measures Table 2.2 SEMCOG Scenario Analysis Table 2.3 SEMCOG Transportation Improvement Program Consistency with Long-Range Plan Table 2.4 WMATA Initiative Prioritization Factors Table 3.1 Mn/DOT Targets for Infrastructure Preservation Table 3.2 Performance-based Planning and Programming Elements ii
7 List of Figures Figure 2.1 Mn/DOT Family of Plans Figure 2.2 Mn/DOT Highway Investment Plan Approach Figure 2.3 Mn/DOT Performance Expectations Figure 2.4 Mn/DOT s Performance-based Highway Investment Process Figure 2.5 SEMCOG Investment Analysis Figure 2.6 WMATA s Performance Management Tools Figure 2.7 WMATA Capital Program Investment Analysis Figure 3.1 Performance-based Planning and Programming Process Figure 3.2 Example of Information Expected in a Performance-based Planning and Programming Process iii
8 Executive Summary In response to recent economic, political, and social trends that have placed greater emphasis on public-sector accountability and cost-effectiveness, transportation agencies across the country have increasingly embraced performance management and performance-based planning and programming as a way to ensure that transportation resources are spent on projects and strategies that best serve communities needs. This white paper describes the common elements of a performance-based transportation planning and programming process, building on work conducted by State departments of transportation (DOT), metropolitan planning organizations (MPO), and transit agencies. The white paper was initiated in response to a National Forum on Performance-based Planning and Programming conducted in September, 2010 in Dallas, TX and has been refined to reflect discussions at a follow up Workshop on Performance-based Planning and Programming held in Chicago, IL in September, These two events have included representatives from state DOTs, MPOs, rural planning organizations, and transit agencies. Participants at both events have recognized performance-based planning and programming as a best practice for the transportation industry and desired to more concretely define what is meant by performance-based planning and programming, what action items will best advance its implementation across the industry, and what steps are necessary to overcome the practical challenges to its meaningful implementation. Key findings of this white paper and the National Workshops include: Many transportation agencies are conducting performance-based planning and programming and a framework based on the elements common to these efforts may be useful to agencies considering implementing such a process. Performance-based planning and programming must be integrated into the existing planning process to be successful. Performance-based planning and programming involves data driven analysis, which is the focus of this white paper. But, planning and decision-making must balance a broad range of quantitative and qualitative concerns including public/stakeholder perspectives. Given the range of data, information, and tools available to transportation agencies, it is important to tailor the approach to work for areas with varying geographies, levels of development, governance structures, and size, as well as across various program or performance areas. These will include using qualitative methods or providing clear visual representations of performance that are clear for stakeholders and/or decision makers to understand. ES-1
9 Performance-based planning and programming should build on successful planning efforts. Existing tools such as state pavement and bridge management systems, transit agency asset management plans, and complementary planning processes such as the Strategic Highway Safety Plan (SHSP), Congestion Management Process (CMP), Transit Development Plan (TDP) and other similar efforts provide a strong foundation for performance-based planning and programming. Fundamental to a performance-based approach is the recognition that agencies should first identify projects that are consistent with their goals and performance targets, and then determine the appropriate funding source for those projects. Unlike a traditional programming and budgeting process that identifies funding sources first, this approach first identifies the set of projects that best help the agency meet its goals or targets. The potential benefits from a performance-based planning and programming process include helping to guide resource allocation decisions in a constrained funding environment. However, it is recognized that a performance-based process alone, without sufficient resources, will not drive better performance results over the long term. A performance-based approach can help communicate needs and explain why performance may decline in the future. But implementing a performance-based approach itself may take additional organizational resources or at least a redistribution of existing resources devoted to planning and programming activities. Table ES.1 presents a framework of elements that have been identified as part of any performance-based planning and programming effort. Table ES.1 Performance-based Planning and Programming Elements Elements Description Examples Strategic Direction (Where do we want to go?) Goals and objectives Performance measure Goals and objectives that capture an agency s strategic direction Agreed on measures for goals and objectives. Long Range Planning (How are we going to get there?) Identify targets and trends Establish aspirational targets or preferred trends based on an understanding of a desirable future for each goal area and measure. Infrastructure condition, safety, mobility, reliability, and other goals established by an agency. Percent of bridges in good condition, travel time index, and other measures linked to agency goals. Desired conditions of pavement, bridge, and transit assets. Desired future corridor travel times or reliability levels. Desired future crash, injury, and fatality reductions ES-2
10 Elements Description Examples Identify strategies Strategy evaluation Strategies, policies, and investments that address transportation system needs within the identified goal areas. Evaluate strategies and define program level system performance expectations, may be qualitative. Programming (What will it take?) Investment plan Resource constrained targets and trends Program of projects Identify the amount and mix of funding needed to achieve performance goals within individual program areas. Established quantitative or qualitative targets or desired trends for each goal/measure. Identify specific transportation projects for an agency capital plan, or S/TIP that are consistent with system performance expectations established in strategy evaluation. Implementation and Evaluation (How did we do?) Reporting and monitoring Evaluation Monitor progress on goals relative to targets and resource allocation efforts. Identify improvements in analytics, process, etc. to improve the planning process. Evaluating the mix of projects. Resurfacing, rehabilitation, replacement and reconstruction to support infrastructure condition. Signal timing, vehicle maintenance, service patrols, additional capacity, (transit or highway), tolling, and other strategies/investments to improve mobility or reliability. Seat belt or drunk driving enforcement, graduated drivers licenses, rumble strips, training, median barriers, and other investments to improve safety. Examine impact of varying levels of investment on pavement and, bridge preservation and transit assets. Examine impact of packages of operations, capacity and other highway or transit investments on corridor travel time and/or reliability. Examine potential for reduction in crashes, injuries, and fatalities from a package of safety investments. Investment plan for pavement, bridge, transit asset, operations, expansion, safety, and other projects consistent with strategy evaluation, including specific projects and high level summary of expected investment levels. Expected future conditions of pavement and, bridge conditions, and transit assets. Expected future corridor travel times or reliability improvements given a package of investments. Expected range of crash, injury, and fatality reduction from a package of safety investments. S/TIP with specific projects identified in major program areas (pavement, bridge, transit assets, capital, operations, safety, etc.). Report on pavement, bridge, transit assets, reliability, safety, and other metrics presented to stakeholders, public and decision makers. Examine actual conditions relative to expected conditions for assets, reliability, safety, and other areas. Identify where tools produced inaccurate estimates or investments and policies were more or less successful than planned. ES-3
11 The white paper introduces performance-based planning and programming, describes its relationship to the planning process and potential goals, and provides an in depth description of the elements of the framework. It includes detailed descriptions of several best practice examples and identifies the common elements of performance-based planning and programming. While the process and framework described in this white paper is intended to improve decision making for States, MPOs and transit agencies, it is important to recognize that performance-based planning and programming will be impacted by factors such as local politics, funding availability, and changing economic or demographic conditions. ES-4
12 1.0 Introduction The purpose of this white paper is to continue a dialog among the Federal Highway Administration (FHWA), the Federal Transit Administration (FTA) and their planning partners and stakeholder associations on the elements of a performance-based planning and programming process. Planning partners include State Departments of Transportation (DOT), Metropolitan Planning Organizations (MPO), and transit agencies. Stakeholder representatives are participating from the American Association of State Highway and Transportation Officials (AASHTO), the Association of Metropolitan Planning Organizations (AMPO), the American Public Transit Association (APTA), and the National Association of Development Organizations (NADO). In response to recent economic, political, and social trends that have placed greater emphasis on public-sector accountability and cost-effectiveness, transportation agencies across the country have increasingly embraced performance management and performance-based planning and programming as a way to ensure that transportation resources are spent on projects and strategies that best serve communities needs. In September 2010, a large group of staff and executives from State DOTs, MPOs, regional planning organizations, and transit agencies got together to discuss performance-based planning. That effort, with over 140 participants, was a first of its kind effort to bring together transportation agencies of all different types and sizes to discuss facets of performance-based planning. A consistent message from the National Forum was that performance-based planning and programming represented best practice for the transportation agency and that additional work was needed both to define precisely what is meant by performance-based planning and programming and to identify the types of data and analysis tools to help agencies implement performance-based planning and programming within their own agencies. More recently, in September 2011, FHWA and FTA, in cooperation with AASHTO, AMPO, APTA, and NADO held a National Workshop in Chicago, IL to continue to advance best practice in performance-based planning and programming by identifying common elements and a framework for implementing these practices within transportation agencies. This white paper was initially developed to support the National Workshop; the current version reflects the extensive feedback that was received at that workshop. As with the previous effort, participants in the 2011 National Workshop agreed that performance-based planning and programming represented best practice for the transportation industry. But, many concerns were raised about how to implement these practices. Establishing a common framework for performancebased planning and programming will require collaboration across levels of 1-1
13 government, transportation modes, and other boundaries. The white paper developed here is intended to be a joint effort by FHWA and FTA in close collaboration with their planning partners and representatives. 1.1 KEY CONCEPTS This section describes the key concepts that will be discussed throughout this white paper. Performance Management Performance management is a strategic approach that uses system information to make investment and policy decisions to achieve performance goals. Performance management typically includes both the management of the transportation system and management of the organizations with responsibility for the transportation system. Performance-based Planning and Programming Performance-based planning and programming is an attempt to apply performance management principles to transportation system policy and investment decisions, providing a link between management and long range decisions about policies and investments that an agency makes in its transportation system. Performance-based planning and programming is a system-level, data-driven process to identify the strategies and investments. Products of the Planning Process Delivering a performance-based planning and programming process will require integrating performance management concepts into the existing process. The existing planning process includes a range of activities and products that take a transportation agency from broad goals and objectives to measurable indicators and then applies them in decision making regarding transportation investments and policy actions. These activities and products generally include: Long-range transportation plans. Required for both DOTs and MPOs, these documents vary significantly in terms of the material that is included and the depth of analysis used to create them, especially for DOTs. Some DOTs, MPOs, and local agencies also develop comprehensive visions that take into account transportation, land use, housing, environment, and other major issues that impact their communities, though these are not formally required. Federally required program area plans and processes. Currently, state DOTs are required to develop a Strategic Highway Safety Plan (SHSP) and MPOs in regions with over 200,000 residents are required to develop a Congestion Management Process (CMP). Air quality conformity analysis is also required for nonattainment areas. States with areas in nonattainment are required to develop State Implementation Plans (SIPs) that provide a source 1-2
14 of information for capturing performance in these areas. States DOTs, MPOs, and transit agencies also sometimes develop other program specific plans, such as asset management plans or multi-year capital programs. Corridor, regional, and modal plans. In addition to long-range and specific program plans, many DOTs, MPOs, and transit agencies develop a range of more detailed planning efforts to tackle transportation issues in a specific corridor, region, sub-region, mode, or other portion of the transportation system. For example, some transit agencies use transit development plans that help to identify needed transit investments. These modal, region, and other plans are developed using a variety of approaches and levels of detail but generally complement and expand the long range planning process. Short-range Transportation Improvement Programs (STIPs and TIPs). These documents identify the transportation investments to be made on the transportation system over the short-term (4-year). Currently, S/TIPs do not typically include analyses of system performance expectations. Unified Planning Work Program and State Planning and Research program. These documents describe the priority planning activities, such as studies, data collection, public engagement, etc., undertaken by MPOs, transit agencies, and State DOTs that are the means for implementing performance-based planning and programming, among other activities, in the planning processes they manage. Beyond these steps, project design, operations and ITS plans, and other processes carry projects from planning studies to implementation. 1.2 ORGANIZATION OF THE WHITE PAPER The white paper is organized as follows: Section 2.0 describes examples of agencies implementing performance-based planning and programming for State DOTs, MPOs, and transit agencies. Section 3.0 describes a set of common elements that emerge from the examples in Section 2.0, other examples of performance-based planning and programming in practice today, and the comments received from participants at the 2011 National Workshop. The result is a performancebased planning and programming framework for use by State, regional, transit, and other transportation agencies. Section 4.0 identifies critical next steps for advancing performance-based planning and programming at state and regional levels, drawing on feedback from the participants at both the 2010 National Forum and the 2011 National Workshop. 1-3
15 2.0 Performance-based Planning and Programming Examples Performance-based planning and programming and performance management are not new concepts for transportation agencies. Over the last decade or so, many transportation agencies have begun using performance measures to help them manage their organizations and their investments in and policies for their transportation systems. The intent of this white paper is to build on existing best practice being put in place by State DOTs, MPOs, and transit agencies. This section begins by describing an example of performance-based planning and programming from each of these agencies and then attempts to capture the common elements of these efforts. 2.1 MINNESOTA DOT The Minnesota DOT (Mn/DOT) has integrated performance-based decisionmaking into its planning, programming and project development processes through a family of plans (Figure 2.1), including: A performance-based Statewide Multimodal Transportation Plan with goals, measures, and targets. This plan provides overall policy direction and is updated every four to six years. System Investment Plans that use measures and targets to assess the status of the transportation system and identify needed and constrained system investment in each mode. These plans are also updated every four to six years; Capital Programs which guide the selection of projects for the annual highway construction program; and Incorporation of performance measures into the biennial legislative budget request. Mn/DOT s first performance-based Statewide Multimodal Transportation Plan, adopted in 2003, defined three strategic goals (in the areas of preservation, safety, and mobility), aligned 10 policies under these goals, identified outcomes for each policy, and established specific modal performance measures and targets. To support the Plan, Mn/DOT adopted several specific statewide performancebased modal plans, including Freight, Bicycle, Transit, Highway Systems Operations, Highway Safety, and Aeronautics. Together these plans provide the foundation for a performance-based resource allocation process. 2-1


16 Figure 2.1 Mn/DOT Family of Plans Updated Every 4-6 Years Updated Annually Policy Direction System/ Investment Plans Capital Programs/ Operating Plans Implementation Metropolitan, Regional, Tribal, and Local Plans and Programs Statewide Multimodal Transportation Plan (Includes Long- Range Vision) Highway Capital Investment Plan Freight and Passenger Rail Plan Bike and Pedestrian Plan Aviation System Plan Highway System Operations Plan Greater MN Transit Investment Plan Freight System Plan 10-Year Highway Investment Plan Rail Service Investment Plan Port Development Assistance Program Airports Capital Improvement Program 1-4 Years 4-Year Statewide Transportation Improvement Program Maintenance and Operations 4-Year Plan Construction Modal Programs Maintenance and Operations Special Studies, Research, and Initiatives Monitor Feedback (Annual Performance Report) Source: Mn/DOT Investment Planning The highway investment plan helps Mn/DOT understand overall system needs and identify preferred investment (Figure 2.2). 2-2

17 Figure 2.2 Step 1 Identify Investment Needs Mn/DOT Highway Investment Plan Approach Step 2 Project Future Revenues Step 3 Set Investment Goals Step 4 Develop Investment Plan Step 5 Prioritize Unfunded Investment Needs Investments to Meet Performance Targets Regional Community Improvement Priorities Revenue Outlook Investment Goals: Balanced Program 20-Year Highway Investment Plan STIP Mid-Range HIP Long-Range HIP Total Unfunded Statewide High Priority Legislative Direction (Chapter 152) System Performance Stakeholder Input Source: NCHRP Report 666, Target-Setting Methods and Data Management to Support Performance- Based Resource Allocation by Transportation Agencies, Transportation Research Board, 2011 Each year every Mn/DOT district, following uniform guidance, identifies investment priorities. These priorities are based on quantifiable performance measures and targets that establish an impartial statewide basis for identifying critical transportation improvements for the entire trunk highway system. The basic steps of the highway investment planning process include: 1. Identification of Investment Needs. Investment needs fall into two categories: those that address system performance and those that address regional or community priorities. A variety of analytic models and tools are used to identify needs in each policy area. 2. Project Future Revenue. Revenues are projected based on the trends in State and Federal revenue sources for state highway construction. 3. Set Goals: A Balanced Program of Investments. The current highway investment plan attempts to balance a program that supports the State s economy, optimizing investment in programs across goal areas, and achieves consistent investment across districts. 4. Develop Investment Plan. Given the needs, projected revenues and investment goals, each district developed investment plans for The investment plans are divided into three timeframes: short range ( ), mid range ( ), and long range ( ). 5. Prioritize Unfunded Needs. With a total estimated investment need exceeding $65 billion over 20 years and projected revenues of about $15 billion, the plan identifies almost $50 billion in unmet needs over this period. To generate just an additional $2.5 billion in revenue over 10 years would require the equivalent of a 12.5-cent increase in the State gas tax. To address this challenge, Mn/DOT has identified five percent of the unmet needs as high priority investment options should additional revenue be available during the next 10 years. 2-3
18 Once highway funding is approved by the State legislature, Mn/DOT s funds are distributed to the districts using a performance-based formula. The formula aligns with Mn/DOT s priorities: preservation, safety, and mobility, and is tied to measurable performance needs on the transportation system that reflect Mn/DOT s goals and policies. The statewide list of highway construction projects that emerge from this process constitute Mn/DOT s annual highway construction program. Performance Expectations and Target Setting Establishing realistic performance targets is key to Mn/DOT s performancebased planning process. Mn/DOT believes that targets should be realistic. Setting targets too high can lead to over-investment and non-attainment. Setting targets too low can lead to underinvestment and a system that does not meet customer expectations. Mn/DOT used trend-based projections to estimate levels of performance, based on an extrapolation of recent trends. Policy-based targets are set to achieve desired performance levels, based on policy or customer expectations. The long-term targets were not constrained by current funding levels, but were expected to be attainable under some reasonable achievable, increased future funding scenario. In combination, the targets establish a vision for the transportation system over the long term, based on Mn/DOT s understanding of system condition and customer preferences. The targets attempt to balance the needs in one area against the total set of needs in all areas and the degree of control or influence that it has over individual performance measures. For instance, Mn/DOT has direct control over the quality of pavement, but it can only influence transit service provided in the State through funding. In all instances, the level of influence that the department had over a particular measure affected the target that was eventually set. The effect of this approach is to drive improvement and drive proposals for acquisition of additional or reprioritized resources where they are necessary to meet targets. Mn/DOT presents its future performance expectations in qualitative fashion, using a combination of symbols and colors to describe what it expects to achieve with its overall package of investments. Figure 2.3 presents the current future performance expectations. 2-4

19 Figure 2.3 Mn/DOT Performance Expectations Note: This is a selection of measures used by Mn/DOT Source: Annual Minnesota Transportation Performance Report, Evaluation and Review Mn/DOT has institutionalized several steps to ensure that the highway planning and programming process remains consistent with department goals and 2-5
20 policies. The most important step includes the periodic assessment of the transportation system s performance with a regular review of the modal measures data by senior staff. This review has resulted in program adjustments in the 10-year capital investment program and in some cases the STIP. For example, in 2005, the senior staff remixed the projects in its highway construction program based upon data which indicated diminishing pavement conditions. Such actions are captured in the department s annual publication of a Snapshot comparing actual performance goals to targets. The information in the Mn/DOT Snapshot provides the base-level information for developing a biennial budget request for the Minnesota State Legislature. This request is performance-based showing the specific impact of funding requests on transportation system performance measure targets. For example, in its 2005 legislative budget proposal, Mn/DOT requested a shift in funds from highway construction to highway maintenance based on pavement performance. The legislature, persuaded by the logic of the performance-based approach, agreed that a greater investment in maintenance would yield long-term savings. Figure 2.4 captures the overall process of planning, programming, project delivery, and system monitoring, as it is practiced at Mn/DOT. Figure 2.4 Mn/DOT s Performance-based Highway Investment Process Planning Programming Project Delivery Performance-based statewide transportation plan Performance-based project selection reflected in the STIP Annual highway construction program System Monitoring Comparing actual performance to goals and targets 2.2 SOUTHEAST MICHIGAN COUNCIL OF GOVERNMENTS The Southeast Michigan Council of Governments (SEMCOG) is the MPO for the Detroit, Michigan metropolitan area. As part of its regional transportation planning efforts, SEMCOG has focused on providing information to decision makers to help them understand the consequences of different distributions of investment across key program areas in the region. SEMCOG s process, which focuses on trade-offs of investment in key program areas, includes the following steps: 2-6
21 1. Identifying key program areas and defining performance metrics for each; 2. Estimating the relationship between overall program investment and future expected performance; 3. Creating scenarios based on #2 that capture varying opportunities to invest in the region and presenting this information to decision makers; 4. Working with decision makers to select a preferred alternative; and 5. Monitoring the consistency of actual investment with the preferred alternative. The first step in SEMCOG s approach is to define performance metrics within key program areas. Table 2.1 identifies the measures used to evaluate expected future performance. Table 2.1 SEMCOG Performance Measures Program Area Pavement Preservation Highway Capacity Bridge Preservation Safety Transit Nonmotorized Roadway Operations Performance Measure Percent of pavement in good or fair condition Hours of delay per 1,000 vehicle miles Percent of bridges in good or fair condition Fatalities per 100 million vehicle miles Extent of transit network Population % within ½ mile of a facility Not currently addressed Source: Guerre and Evans, Applying System-Level Performance Measures and Targets in Detroit s Metropolitan Planning Process, Transportation Research Board Annual Conference, 2009 The key step in SEMCOG s approach is to then examine the relationship between investment levels and future performance. Several tools were used for this analysis, including SEMCOG s travel demand model and national tools such as the Highway Economic Requirements System State Version (HERS-ST) and the National Bridge Investment Analysis System (NBIAS). Figure 2.5 presents a set of graphs used by SEMCOG to describe the relationship between investment and performance for pavement, bridge, delay, safety, and nonmotorized investments. Each graph captures the level of performance expected per dollar of investment. A steeper slope indicates that investment is expected to bring greater returns in terms of future performance. The figures also indicate current performance. 2-7
22 Figure 2.5 SEMCOG Investment Analysis Percent Pavement in Good or Fair Condition in Pavement Annual Budget ($M) Percent Bridges in Percent in Good or Fair Condition in Bridge Annual Budget ($M) Hours of Congestion Delay per 100 M VMT in Delay Fatalities per 100M Vehicle Miles Traveled in Safety Annual Budget ($M) Annual Budget ($M) Percent Population and Employment within 1/2 mile of Facility in Non-motorized Annual Budget ($M) Key Current performance expectation Maximum performance Source: Guerre and Evans, Applying System-Level Performance Measures and Targets in Detroit s Metropolitan Planning Process, Transportation Research Board Annual Conference,
23 SEMCOG combined the investment analysis into a set of potential funding scenarios organized around several key themes, including: Current Allocation - Distributed funding to programs consistent with the way they were allocated previously; Public Opinion - Used information from public involvement sessions conducted as part of the regional plan update to distribute more funding to programs identified as preferred by the public; Preservation First - Distributed funding to maximize pavement and bridge performance, then distributed the remaining funds to other programs; and Transit First - Distributed funding to maximize transit performance, then distributed the remaining funds to other program areas. Table 2.2 summarizes these scenarios, including both the distribution of funding and expected future performance for each program area. These scenarios were presented to decision makers, who used this information to identify preferred funding levels for each program. Complete information was not available for this planning effort, but enough information was available to support the decision makers in their efforts to prioritize investments using performance measures. In particular, roadway operations were not directly integrated because performance information was not available. SEMCOG is working on updating their approach. To link their planning and programming efforts, SEMCOG tracks investment levels in the TIP against the investment level targets identified in the preferred scenario and posts this information to their website. Table 2.3 presents the current tracking of investment levels. 2-9
24 Table 2.2 SEMCOG Scenario Analysis Program Area Pavement Preservation Bridge Preservation Highway Capacity Safety Measure of Effectiveness Percent of pavement in good or fair condition Percent of bridges in good or fair condition Hours of delay per 1,000 vehicle miles Fatalities per 100 million vehicle miles Transit Extent of transit network Current system Nonmotorized Population % within ½ mile of a facility Roadway Operations Projected 2010 Current Allocation Public Opinion Preservation First Transit First Target Funding (%) Target Funding (%) Target Funding (%) Target Funding (%) 57% 57% 21 49% 18 85% 31 40% 14 85% 100% 6 100% 7 85% 3 80% N/A Current system 21 Reduced System 12 Current System 21 Transit Vision 41 13% 44% 1 100% 5 44% 1 0 N/A 41% Source: Guerre and Evans, Applying System-Level Performance Measures and Targets in Detroit s Metropolitan Planning Process, Transportation Research Board Annual Conference, Cambridge Systematics, Inc.
25 Table 2.3 SEMCOG Transportation Improvement Program Consistency with Long-Range Plan Project Type Estimated Funding (in millions) Share of Funding TIP Share of Funding Direction2035 Pavement $ % 24% Bridge $ % 5% Road Expansion $ % 8% Safety $ % 1% Transit Capital $ % 8% Nonmotorized Facilities $ % 1% Operating $2, % 53% Total $3, % 100.0% Source: Southeast Michigan Council of Governments, TIP_Consistency_Direction2035.aspx 2.3 WASHINGTON METROPOLITAN AREA TRANSIT AUTHORITY The Washington Metropolitan Area Transit Authority (WMATA), the public transit provider in the Washington, DC region, has taken several steps towards creating a more accountable and transparent approach to managing its organization. In 2010, the Office of Performance was created to expand the use of performance information to guide decisions, to promote WMATA s benefits in the region and to unify employees to accomplish agency goals.. The Office developed a range of performance products (Figure 2.6) that connect day-to-day work of WMATA s employees, from the General Manager to the front line workers, to performance outcomes. 2-1

26 Figure 2.6 WMATA s Performance Management Tools Source: Performance-Based Planning and Programming: A Transit Perspective, presentation by Patricia Hendren, September, 2011 The Public and Board of Directors receive frequent performance updates from WMATA through various reports. For example, the Vital Signs Report communicates WMATA s operational performance results in the strategic areas of safety, security, service reliability and customer satisfaction through a set of key performance indicators. The Vital Signs Report presents performance results, explains why performance has changed and identifies the actions that WMATA is taking to improve performance. The General Manager uses performance information documented in his Execution Plan as a management tool in 1-on-1 meetings with his executive team to keep focus on actions leading to results. Cascading downward, WMATA Departments also use Execution Plans (collection of measures and actions tied to agency goals) to focus staff and resources, make progress towards agency goals and argue for additional resources. WMATA has also used performance information to describe expected outcomes of capital investments. In 2009, WMATA used agency strategic goals and objectives to prioritize each capital project in the FY Capital Needs Inventory. This enabled WMATA to communicate to the Board of Directors the impact different funding levels would have on competing agency priorities (see Figure 2.7). WMATA presented three scenarios that vary the level of investment in two types of projects: 1. Performance projects. Projects that maintain and replace assets on a regular life cycle basis to deliver the same level of service. These include vehicle 2-2
.")
27 replacement, track rehabilitation, maintenance of facilities, system and technology upgrades, and other improvements. 2. Customer/demand projects. Projects that help meet growing ridership and improve rider s experience (e.g., fleet expansion, rail station enhancements, maintenance facility expansion). At a high level, the capital prioritization effort demonstrated how much of WMATA s capital needs could be met at different levels of investment and permitted potential consideration of trade-offs across priorities. Figure 2.7 WMATA Capital Program Investment Analysis Source: Performance-Based Planning and Programming: A Transit Perspective, presentation by Patricia Hendren, September, 2011 For WMATA, much of its operating budget is locked in due to union contracts and fuel and material costs. For discretionary operating initiatives, WMATA is attempting to link these new initiatives to agency goals using a set of performance measures/factors for the FY13 budget (Table 2.4). This recent effort was challenged due to the difficulty in quantifying the performance outcomes for the various initiatives and internal resistance to using data to drive funding decisions. 2-3
28 Table 2.4 WMATA Initiative Prioritization Factors WMATA Goal Safety and Security Deliver Quality Service Use Resources Wisely Prioritization Measures/Factors Customer injury rate Employee injury rate Crime rate On-time performance Mean distance between failure Escalator/elevator availability Customer comment rate Reduce operating cost or generate revenue Source: Performance-based Planning and Programming: A Transit Perspective, presentation by Patricia Hendren, September,
29 3.0 Performance-based Planning and Programming 3.1 COMMON ELEMENTS OF PERFORMANCE-BASED PLANNING AND PROGRAMMING While the three agencies described in Section 2.0 each have a unique approach to performance-based planning and programming, there are common elements from these and other examples that provide a framework for advancing performance-based planning and programming. The discussion below reflects these examples, the experience of other agencies in conducting performancebased planning and programming, and input from participants at the 2011 National Workshop held in Chicago, IL. This section describes the common elements of an analytic approach to transportation planning and programming that represents a performance-based approach. These elements are rooted in a system or program level analysis that asks a basic question: what are the expected impacts of a set of strategies on future system performance? This analysis is a vital part of long-range planning and mid-range investment planning that State DOTs, MPOs, and transit agencies are increasingly using in statewide and metropolitan transportation planning to help guide future investments. Setting Direction Each of the examples cited in Section 2.0 began by identifying a strategic direction that consists of goals and objectives, and is supported by performance measures: Goals and objectives. A fundamental concept in performance-based planning and programming is that it be based on an agency s strategic direction. Agencies first need to determine their priorities and use these to shape the decisions they make about policies and investments. Performance measures. Any performance-based planning effort will necessarily include measures. Each of the examples described above define performance measures within their goals and objectives. Long Range Planning Most agencies that conduct performance-based planning and programming also conduct some type of strategy evaluation, though the specifics vary from one agency to another. The purpose of planning is to guide investment and policy 3-1
30 decisions over a long time frame (10 to 20 years). For performance-based plans, there is an expectation that agencies describe expected performance outcomes for a package of strategies across several goal areas and use this information to help them determine how best to focus their resources. However, many agencies still struggle with quantifying future performance outcomes. The components of strategy evaluation include: Desired targets and trends. Before evaluating the package of strategies, many transportation agencies identify targets to provide direction to strategy evaluation. At this stage, targets and trends may be aspirational, though they would be expected to build on previous iterations of target setting and strategy analysis. The desired targets may include both specific numerical targets and/or desired trends. Targets help make individual goals and objectives concrete. Developing targets is a well known challenge and it may not be possible to develop realistic, achievable targets in all areas. Table 3.1 presents several targets Mn/DOT has established for its infrastructure preservation programs. Other agencies use combinations of arrows and colors or other qualitative methods to indicate the direction they are trying to achieve in a particular performance area. Table 3.1 Mn/DOT Targets for Infrastructure Preservation Infrastructure Preservation Category Performance Measure Target Method for Determining Needs PA > 70% good Pavement RQI (Ride Quality Index) Non- < 2% poor > 65% good Pavement Management System PA < 3% poor Bridge Structural Condition of Bridges over 20 ft and on Principal Arterials >84% in Good or Satisfactory condition, <2% in Poor condition Bridge Management System Other Infrastructure (signs, lighting, traffic signals, drainage, etc) Condition or Life Cycle Replacement Varies Inventory and condition assessment Estimate of assets/ replacement cost Source: Performance-Based Planning and Programming at Mn/DOT, presentation by Tim Henkel, September 2011 Strategy identification. Performance-based plans will need to indicate how State DOTs, MPOs, and transit agencies are working to improve performance in each goal including policies, strategies, and investments. This step is not specific to performance-based planning and programming, but it is common to all performance-based planning efforts. Many complementary planning processes (SHSP, CMP, etc.) already identify strategies and it is important for performance-based plans to be consistent with and build on these other 3-2
31 efforts. In addition, it is important to recognize that strategies may impact multiple goal areas and it will be important in reviewing strategies to ensure coordination across goals and programs. Strategy evaluation. Where possible, performance-based plans would evaluate expected future performance of packages of strategies at a system level, rather than at a project level. The Mn/DOT Highway Investment Plan described in Section 2.0 provides a detailed analysis of the expected performance outcomes. This information may be presented in quantitative or qualitative terms. In fact, Mn/DOT summarizes the performance expectations in qualitative terms (see Figure 2.3). Similarly, WMATA used a qualitative approach to present the impact different funding levels would have on competing agency priorities (see Figure 2.7). The purpose of the strategy evaluation is to relate how the set of strategies and investments proposed are expected to improve performance of each of the goal areas. One key aspect of the strategy evaluation conducted by many transportation agencies is an examination of system-level trade-offs. SEMCOG provides a clear example of this process, which looks at how performance is expected to change based on varying the distribution of funds to major program areas. Predicting specific performance outcomes based on a set of strategies currently remains outside of many agencies capabilities for a variety of reasons (e.g., externalities, data availability, modeling constraints). Programming Resource allocation is the process of selecting specific investments in the transportation system. These investments are typically listed in an agency capital plan and/or in a STIP or TIP, which are federally-mandated documents that enable receipt of Federal funds. The S/TIP development process varies widely from region to region. In a performance-based framework, the resource allocation step links the system-level analysis of strategies described above to the programming of specific projects. There are three key elements of resource allocation: Investment plan. Increasingly, transportation agencies or individual functional units are developing overall investment plans for specific program areas that identify the funding needs and likely overall focus of a program given funding constraints. These plans help describe the tradeoffs that must be made across program areas and provide a system level understanding of the size and mix of investment in a given area. Programming. Short range programming documents, like S/TIPs, serve as a means to document the specific commitments made by a transportation agency. In a performance-based planning and programming approach, the specific project decisions are explicitly linked, one way or another, to the system level investment plan. Resource constrained targets and trends. While targets and trends are often set up front as aspirations, they are also commonly used to communicate 3-3
32 what is possible and expected given the strategies and investments being made in the transportation system. At this stage, targets can present the expected future performance of the system. The agencies described in Section 2.0 use a variety of methods to make the linkage between system performance and project programming, including the step that translates system performance analysis into specific projects. This takes: Consistency of outcome. SEMCOG tracks the consistency of the projects in their TIP with the investment levels identified in their long range plan. The long range plan identifies preferred funding levels for each major program. Over the course of the plan, SEMCOG maintains a page on their website that tracks the consistency of actual projects programmed compared to the preferred levels. Consistency of measurement. WMATA has developed an analysis of proposed initiative that uses measures that are consistent with, though not exactly the same as, the measures used to evaluate the system in the Vital Signs report. Both sets of measures are based on WMATA s goals. Although WMATA s performance tools are used by different audiences (see Figure 2.6), the set of key performance indicators tracked in the Vital Signs Report permeate across all performance management efforts. In addition, all of the performance tools developed by WMATA are connected to agency goals. Hierarchical distribution. Mn/DOT first distributes funding to programs and districts using a performance-based formula and then prioritizes projects within those program areas. Corridor approach. Some agencies use a corridor-based approach that develops preferred investment strategies for major transportation corridors and then prioritizes and programs across those corridors based on various funding and other constraints. Optimization approach. Finally, some agencies use optimization techniques in some of their program areas to prioritize and program projects. These techniques identify not the best projects, but the projects that maximize performance of a full program of projects subject to a set of constraints (typically funding). These techniques are commonly used within bridge and pavement management systems to identify programs of projects that minimize the lifecycle cost of investments. Each of these methods has performance-based aspects and, in practice, hybrids of these approaches are likely to be used to support resource allocation. For example, pavement and bridge management programs typically use a system optimization approach within their individual programs, while a corridor approach may be well suited to examine the range of capacity, transit service, highway operations, and certain safety improvements. 3-4
33 Fundamental to a performance-based approach is the recognition that agencies should first identify projects that are consistent with their goals and performance targets, and then determine the appropriate funding source for those projects. Unlike a traditional programming and budgeting process that identifies funding sources first, this approach first identifies the set of projects that best help the agency meet its goals or targets. The second step, then, is to identify what potential funding sources can be used to fund the preferred set of projects. Many Federal and State funding sources have some flexibility and can be used for multiple purposes or can be combined on projects to meet multiple goals. Implementing While the previous sections describe how performance measures are used in preparing plans and programs of future investment, another key element of performance-based planning and programming is tracking actual performance through ongoing reporting. Two types of tracking are relevant: Tracking trends in performance. As transportation agencies implement their plans and programs, it is important to monitor how performance is changing, especially in relationship to forecasted performance described above. This step provides a means to address both the success of all types of strategies (investment, policy, resource allocation) and potentially identify gaps in tools and data that may improve forecasts in the future. For most measures, because strategy implementation and travel behavior change relatively slowly, performance is tracked as a trend over several years. Comparing performance with targets and expected levels. In addition to tracking the actual performance, part of performance-based planning and programming is tracking performance against a set of targets and/or expectations described above. Finally, any planning process includes evaluation of the types of information used and the elements of the process. This evaluation includes providing feedback to other elements of the overall process and improving how the planning process is used to make decisions. 3.2 PERFORMANCE-BASED PLANNING AND PROGRAMMING PROCESS Table 3.2 summarizes the elements described previously. This framework represents a vision for the future of planning and programming. This information would evolve over time as tools, data, and processes improve. 3-5
34 Table 3.2 Performance-based Planning and Programming Elements Elements Description Examples Strategic Direction (Where do we want to go?) Goals and objectives Performance measure Goals and objectives that capture an agency s strategic direction. Agreed on measures for goals and objectives. Long Range Planning (How are we going to get there?) Identify targets and trends Identify strategies Strategy evaluation Establish aspirational targets or preferred trends based on the an understanding of a desirable future for each goal area and measure. Strategies, policies, and investments that address transportation system needs within the identified goal areas. Evaluate strategies and define program level system performance expectations, may be qualitative. Programming (What will it take?) Investment plan Resource constrained targets and trends Identify the amount and mix of funding needed to achieve performance goals within individual program areas. Established quantitative or qualitative targets or desired trends for each goal/measure. Infrastructure condition, safety, mobility, reliability, and other goals established by an agency. Percent of bridges in good condition, travel time index, and other measures linked to agency goals. Desired conditions of pavement, bridge, and transit assets. Desired future corridor travel times or reliability levels. Desired future crash, injury, and fatality reductions. Resurfacing, rehabilitation, replacement and reconstruction to support infrastructure condition. Signal timing, vehicle maintenance, service patrols, additional capacity, (transit or highway), tolling, and other strategies/investments to improve mobility or reliability. Seat belt or drunk driving enforcement, graduated drivers licenses, rumble strips, training, median barriers, and other investments to improve safety. Examine impact of varying levels of investment on pavement and, bridge preservation and transit assets. Examine impact of packages of operations, capacity and other highway or transit investments on corridor travel time and/or reliability. Examine potential for reduction in crashes, injuries, and fatalities from a package of safety investments. Investment plan for pavement, bridge, transit asset, operations, expansion, safety, and other projects consistent with strategy evaluation, including specific projects and high level summary of expected investment levels. Expected future conditions of pavement and, bridge conditions, and transit assets. Expected future corridor travel times or reliability improvements given a package of investments. Expected range of crash, injury, and fatality reduction from a package of safety investments. 3-6
35 Elements Description Examples Program of projects Identify specific transportation projects for an agency capital plan, or S/TIP that are consistent with system performance expectations established in strategy evaluation. Implementation and Evaluation (How did we do?) Reporting and monitoring Evaluation Monitor progress on goals relative to targets and resource allocation efforts. Identify improvements in analytics, process, etc., to improve the planning process. S/TIP with specific projects identified in major program areas (pavement, bridge, transit assets, capital, operations, safety, etc.). Report on pavement, bridge, transit assets, reliability, safety, and other metrics presented to stakeholders, public and decision makers. Examine actual conditions relative to expected conditions for assets, reliability, safety, and other areas. Identify where tools produced inaccurate estimates or investments and policies were more or less successful than planned. Figure 3.1 presents how these elements are arrayed into the planning process. As suggested by participants at the 2011 National Workshop, the figure describes how performance management would enhance the established transportation planning and programming process. The figure builds off of the FHWA and FTA Transportation Planning Capacity Building Team s The Transportation Planning Process Key Issues: A Briefing Book for Transportation Decision Makers, Officials, and Staff. 1 The figure identifies the steps of the federally required planning process, including: Setting vision, goals, and objectives to guide all planning efforts. Deriving performance measures that capture the fundamental outcomes of the agency s goals and objectives. Identifying strategies that are consistent with those identified in other planning efforts, including the CMP, SHSP, and other required and voluntary planning efforts (corridor plans, modal plans, and others). Evaluating and prioritizing packages of strategies through trade-off or scenario analysis. Using the results of the scenario analysis to guide setting resource constrained targets or trends for these measures and to develop preferred program investment levels as part of a long range transportation plan for the State or region covered by the plan
36 Conducting resource allocation exercises that translate an overall investment plan into a specific set of projects for a short range S/TIP or an agency s capital program. Project delivery and system operations that provide feedback into the planning process and provide data and information for performance measurement. Feedback of the decisions made and information used into early elements of the overall process. Ongoing coordination and collaboration with stakeholders and the public throughout the process. Data and tools used to support all aspects of planning, including the evaluation of strategies, development of targets, and allocation of resources to specific projects. 3-8

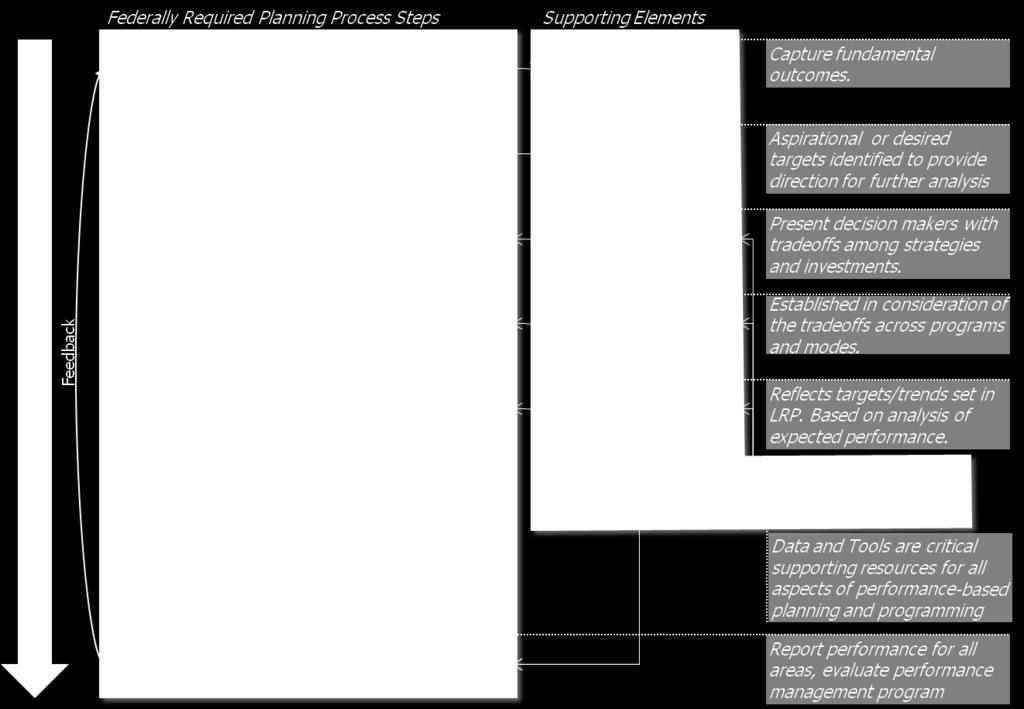
37 Figure 3.1 Performance-based Planning and Programming Process 3-9

38 Figure 3.2 graphically illustrates the types of information that might be included in a performance-based plan for a given performance measure. It includes: The performance trend (medium gray). This provides a basis for understanding how performance is changing over time using historic estimates of performance for a given measure. For some measures, State DOTs, MPOs, and transit agencies may have this information already; for others it would require multiple cycles to provide. A comparison of performance forecast to a target (dark gray). This would require being able to forecast the expected performance impacts of projects and/or investment levels. Is the gap between current performance and the projected target level closing? Or is current performance, assuming it meets a target, being sustained? Performance monitoring (light gray). Over time a State DOT, MPO, or transit agency would compare observed performance to forecasts provided in long range planning and to the performance target. Figure 3.2 Example of Information Expected in a Performance-based Planning and Programming Process For all of this information, it is anticipated that plans and programs would provide substantial narrative to explain the quantitative findings and document the policies and strategies being implemented in each area. 3-10
39 3.3 OTHER ISSUES This section summarizes several key issues that were identified in the development of the framework, including: Implementation; The resources needed to support the framework; The relationship of the framework to various planning analysis time frames; and The varying roles for State DOTs, MPOs, and transit agencies within this framework. Implementation In addition to the elements described above in the framework, important implementation steps include: Project delivery. As plans and programs are developed, it becomes important to ensure that they are delivered. Having as much quality information as possible about project costs, risks, and other information during planning and programming is important to ensure that the set of projects that is selected can actually be delivered. From a practical standpoint, changing circumstances (e.g., funding availability, commodity price fluctuations, political factors) frequently result in changes to plans and programs, impacting the ability to achieve targets. Evaluation. As agencies develop polices and make investments in the transportation system, they should examine how policies and investments impact system performance. At the same time, national organizations TRB, FHWA, FTA, AASHTO, AMPO, APTA, NADO, and others should examine policy and investments across a range of contexts to develop new approaches and share best practices for improving system performance. A strong evaluation process will help refine strategies and improve the tools used to analyze strategies. Today, post-project implementation evaluation is not common practice. Data and Tools While not a specific element in a planning process, data and analytic tools are critical resources for performance-based planning and programming. Conducting system or project analysis will require a suite of approaches, tools and methodologies to help DOTs, MPOs, and transit agencies both measure current performance and predict future performance, given a set of strategies and investments. Tools and data vary by performance area and agency type and size. Some performance areas have well established tools (e.g., pavement and bridge management systems) or significant data collection efforts (e.g., the Fatality Accident 3-11
40 Reporting System, or FARS) that can help in measuring and evaluating expected future performance. Transit agencies operate numerous modes (e.g., heavy rail, bus, light rail, streetcar) in diverse conditions, making data collection and analysis more complex and less comparable across transit agencies. For a performance-based planning and programming approach to work, it needs to build on the success and information that is currently available, such as State DOT pavement and bridge management systems or transit asset management systems and planning processes like the SHSP and CMP. The range of approaches that may be acceptable will vary by the level of maturity, size, and other differences among State DOTs, MPOs, and transit agencies. The ability to forecast future performance varies significantly depending on the type of strategy and investment. Additional capacity building will be needed to improve forecasting tools or to identify areas where a qualitative approach is more appropriate. In the previous version of this effort, tools and data were identified as elements of the overall framework. At the suggestion of participants in the 2011 National Workshop, these have been moved to be identified as critical supporting resources for the overall framework, but not separate elements. Data and tools are required throughout the planning process, but are not themselves an element of the process. Planning Analysis Time Frames Actual delivery of performance-based planning and programming will likely occur across the range of planning efforts and will apply to several analysis periods, including: Long range. Transportation agencies typically examine how the State and/or region will respond to the trends and challenges facing the transportation system over a 20 or more year period. At this stage, performance-based planning and programming is focused on defining goals, objectives, and measures, and targets to track overall performance. Current Federal regulations require State DOTs and MPOs to develop long range transportation plans with at least a 20-year horizon, though the specific requirements differ substantially for MPOs and State DOTs. Mid range. The framework presented above suggests the need to examine the expected performance of investment in major State and metropolitan transportation program areas over time. Several State DOTs, transit agencies, and MPOs have been developing these types of programs, which often examine performance over a 10-year period. Current Federal regulation does not require planning analysis over this time horizon, though some agencies have begun to use it to support their planning and programming efforts. Short range. Over the short range, often a four to five year time horizon, project evaluation and prioritization guides the selection of a program of projects. This program should be linked back to the long range and 3-12
41 investment planning steps described above. Current Federal regulations require State DOTs to develop STIPs and MPOs to develop TIPs. Ongoing. In addition to these three time frames, performance management programs generally include regular, likely annual, performance monitoring and reporting for tracking current system performance. How these planning horizons are addressed within specific planning documents will vary from one agency to another. Roles for State DOTs, MPOs, and Transit Agencies While the framework presented above is meant to apply broadly to transportation planning and programming, some aspects of the framework may apply more readily to certain types of agencies than others. Specifically: MPOs have traditionally not focused on infrastructure issues or even on safety, focusing their efforts on congestion management and other issues. Because most MPOs do not own or operate infrastructure, they rely on State DOTs and transit agencies to provide information about infrastructure condition and investment levels. An increasing number of MPOs have started to use Federal tools such as the Highway Economic Requirements System State (HERS-ST) and the National Bridge Investment Analysis System (NBIAS) to help examine scenarios for investment. Scenario analysis helps some MPOs plan for the long term and enables the evaluation of trade-offs across different types of investment (i.e., should more be invested in infrastructure condition or congestion mitigation?). MPOs play highly variable roles in regional planning depending in many cases on State statutory authority. In some regions, the State DOT, a regional transit agency or another entity may take the lead on scenario planning. Transit agencies traditionally participate in the metropolitan planning process through MPOs and in the statewide planning process through State DOTs, although significant planning efforts may occur at the transit agency or through another entity. FTA and others are actively developing tools and methods to improve how transit agencies track the condition of transit infrastructure (including rail, vehicles, facilities, etc.). Some specific goal areas touch multiple agencies that may not traditionally be included in the planning process. For example, safety investments and policy are managed by several agencies, including State DOTs, governors highway safety offices, and others. Transportation system operations includes State DOT and other transportation staff that are not typically involved in the planning process, as well as other groups (police, emergency response, tow truck operators, etc.) who are not regular participants in the planning process. For any given agency, it may be appropriate to begin development of a performance-based planning and programming process by focusing on a subset 3-13
42 of goals and expanding efforts over time. As described above, it will be important to coordinate with and build on work conducted through complementary planning processes (such as for strategic highway safety plans (SHSP)) because all units within a State DOT, MPO, or transit agency will have roles in the achievement of performance outcomes. 3-14
43 4.0 Next Steps Many transportation agencies have begun to implement performance-based planning and programming. An important next step related to the current effort is being conducted by the AASHTO Standing Committee on Planning in collaboration with the FHWA (NCHRP Project 8-36 (104)). Through NCHRP Project 8-36 (104), three performance-based planning and programming pilot studies are being conducted with a focus on collaboration across State DOTs, MPOs, rural planning organizations, and transit agencies. The pilot studies locations and focus areas include: Kansas City, including Kansas and Missouri DOTs; the Mid-America Regional Council, the MPO for the Kansas City region; and the Kansas City Area Transit Authority. The focus of this pilot study is on safety. Pennsylvania, including the Pennsylvania DOT and all of the MPOs and regional planning organizations in Pennsylvania. The focus of this pilot study is on infrastructure condition. Washington, D.C., including the Maryland DOT; the Metropolitan Washington Council of Governments, the MPO for the Washington metropolitan area; and the Washington Metropolitan Area Transit Authority, the transit provider for the region. The focus of this pilot study is on congestion, with an emphasis on integrating highway and transit considerations. Some additional next steps that may be relevant for this effort include: Support efforts by transportation agencies to implement a performance-based planning and programming process. Key activities within this area may include providing workshops and peer exchanges for practitioners to discuss and advance the concepts of performance-based planning and programming, supporting additional pilot studies, and providing technical assistance to these agencies. Clarifying how the application of the performance-based framework should vary by agency function (e.g., planning, operations, budgetary) will be critical to successful implementation. Improve availability and quality of data and tools to support performancebased planning and programming. Key activities within this area include researching and developing better methodologies for tradeoff analysis, identifying gaps in data and tools for common performance areas, compiling case studies of best practices on target setting, documenting the relationships between actions and performance outcomes and similar efforts. Increase collaboration on performance-based planning and programming. Key activities in this area may include improving how agencies communicate performance information to the public, developing review bodies or a performance council comprised of practitioners to provide feedback on individual 4-1
44 agency performance-based planning efforts, establishing benchmarking groups to share best-practices in a protected environment, investing in the development of visualization tools to support communication with the public and decision makers, and other similar efforts. 4-2
45 4-0
White Paper: Performance-Based Needs Assessment
 White Paper: Performance-Based Needs Assessment Prepared for: Meeting Federal Surface Transportation Requirements in Statewide and Metropolitan Transportation Planning: A Conference Requested by: American
Performance-Based Planning and Programming Why Is It Important? Northwest TTAP and BIA Symposium Portland, OR March 17, 2015
 Performance-Based Planning and Programming Why Is It Important? Northwest TTAP and BIA Symposium Portland, OR March 17, 2015 Transportation has two purposes & Mobility Access Quileute Reservation La Push,
House Bill 20 Implementation. House Select Committee on Transportation Planning Tuesday, August 30, 2016, 1:00 P.M. Capitol Extension E2.
 House Bill 20 Implementation Tuesday,, 1:00 P.M. Capitol Extension E2.020 INTRODUCTION In response to House Bill 20 (HB 20), 84 th Legislature, Regular Session, 2015, and as part of the implementation
FY Statewide Capital Investment Strategy... asset management, performance-based strategic direction
 FY 2009-2018 Statewide Capital Investment Strategy.. asset management, performance-based strategic direction March 31, 2008 Governor Jon S. Corzine Commissioner Kris Kolluri Table of Contents I. EXECUTIVE
Chapter 3: Regional Transportation Finance
 Chapter 3: Regional Transportation Finance This chapter examines the sources of funding for transportation investments in the coming years. It describes recent legislative actions that have changed the
2017 UNIFIED TRANSPORTATION PROGRAM AND HB 20 IMPLEMENTATION
 2017 UNIFIED TRANSPORTATION PROGRAM AND HB 20 IMPLEMENTATION TEMPO Meeting July 21, 2016 Current Initiatives On-going efforts to address performance-based planning and programming processes as required
2017 UNIFIED TRANSPORTATION PROGRAM AND HB 20 IMPLEMENTATION
 2017 UNIFIED TRANSPORTATION PROGRAM AND HB 20 IMPLEMENTATION HGAC Transportation Policy Council Meeting Current Initiatives On-going efforts to address performance-based planning and programming processes
Safety Target Meeting Summary 10/3/2017
 Safety Target Meeting Summary 10/3/2017 Recommendation: It was the recommendation of the committee that OTO support the statewide safety targets. Discussion: Natasha Longpine presented background information
10-Year Capital Highway Investment Plan DRAFT
 This document is made available electronically by the Minnesota Legislative Reference Library as part of an ongoing digital archiving project. http://www.leg.state.mn.us/lrl/lrl.asp 10-Year Capital Highway
INVESTMENT STRATEGIES
 3 INVESTMENT STRATEGIES 70 INVESTMENT STRATEGIES 71 A key role of Mobilizing Tomorrow is to outline a strategy for how the region will invest in transportation infrastructure over the next 35 years. This
10-Year Capital Highway Investment Plan DRAFT
 10-Year Capital Highway Investment Plan DRAFT 2018-2027 DRAFT AUGUST 2017 1 Table of Contents PURPOSE OF 10-YEAR CAPITAL HIGHWAY INVESTMENT PLAN... 1 This page intentionally left blank. SUMMARY OF INVESTMENT
Transportation Improvement Program and Incentives for Local Planning
 Capital District November 9, 2004 Transportation Committee Transportation Improvement Program and Incentives for Local Planning CDTC has been successful in funding 36 Linkage Program planning studies since
Project 06-06, Phase 2 June 2011
 ASSESSING AND INTERPRETING THE BENEFITS DERIVED FROM IMPLEMENTING AND USING ASSET MANAGEMENT SYSTEMS Project 06-06, Phase 2 June 2011 Midwest Regional University Transportation Center College of Engineering
GNC SWOT Analysis: Action Plan. Prepared by the Olsson Associates Team. Prepared for the Montana Department of Transportation.
 GNC SWOT Analysis: Action Plan Prepared by the Olsson Associates Team Prepared for the Montana Department of Transportation December 2014 TECHNICAL REPORT DOCUMENTATION PAGE 1. Report No. 7 (Action Plan)
Corridors of Commerce DRAFT Scoring and Prioritization Process. Patrick Weidemann Director of Capital Planning and Programming November 1, 2017
 Corridors of Commerce DRAFT Scoring and Prioritization Process Patrick Weidemann Director of Capital Planning and Programming November 1, 2017 Project Purpose To develop and implement a scoring and project
INVESTING STRATEGICALLY
 11 INVESTING STRATEGICALLY Federal transportation legislation (Fixing America s Surface Transportation Act FAST Act) requires that the 2040 RTP be based on a financial plan that demonstrates how the program
CHAPTER 5 INVESTMENT PLAN
 CHAPTER 5 INVESTMENT PLAN This chapter of the 2014 RTP/SCS plan illustrates the transportation investments for the Stanislaus region. Funding for transportation improvements is limited and has generally
Texas Department of Transportation Page 1 of 42 Planning and Development of Transportation Projects
 Texas Department of Transportation Page of Proposed Preamble The Texas Department of Transportation (department) proposes amendments to.,.,. -.,.0 -.0, new.0, and amendments to. -.,.,.0, and.0 -.0, all
Metropolitan Planning Organizations in North Carolina. Chris Lukasina NCAMPO
 Metropolitan Planning Organizations in North Carolina Chris Lukasina NCAMPO February 1, 2016 Items to Discuss What is an MPO/RPO? Why were they established? How are they structured? What areas do they
Chapter 10 Equity and Environmental Justice
 Chapter 10 Equity and Environmental Justice Introduction An important consideration for the 2040 Transportation Policy Plan is its impact on all populations in the Minneapolis-Saint Paul region, particularly
COMPONENT 4. programming may differ from what is included in this chapter.
 COMPONENT 4 PERFORMANCE- BASED PROGRAMMING This chapter provides assistance to transportation agencies with the Performance- Based Programming component of Transportation Performance Management (TPM).
Prepared by the South East Texas Regional Planning Commission-Metropolitan Planning Organization (SETRPC-MPO) December 6, 2013
 December 6, 2013") FY 2013 Annual Performance and Expenditure Report for the Jefferson-Orange-Hardin Regional Transportation Study (JOHRTS) Area October 1, 2012 September 30, 2013 Prepared by the South East Texas Regional
FY 2013 Annual Performance and Expenditure Report for the Jefferson-Orange-Hardin Regional Transportation Study (JOHRTS) Area October 1, 2012 September 30, 2013 Prepared by the South East Texas Regional
Additionally, the UPWP serves as a source for the following information:
 Executive Summary ES.1 WHAT IS THE UPWP? The Unified Planning Work Program (UPWP) produced by the Boston Region Metropolitan Planning Organization (MPO) explains how the Boston region s federal transportation
Transportation Trust Fund Overview
 Transportation Trust Fund Overview Created pursuant to New Jersey Transportation Trust Fund Authority Act of 1984 Established to finance the cost of planning, acquisition, engineering, construction, reconstruction,
Target Formula Re-evaluation
 Target Formula Re-evaluation Target Formula Background Target formula is used to distribute federal funding to the eight ATPs Current formula was developed in 1996 Reauthorization of federal transportation
Keep Wisconsin Moving Smart Investments Measurable Results
 Keep Wisconsin Moving Smart Investments Measurable Results Wisconsin Transportation Finance and Policy Commission January 2013 Investment in transportation Investment in our economy Investment in our quality
2040 Plan Update. Land Use Advisory Committee March 16, 2017
 2040 Plan Update Land Use Advisory Committee March 16, 2017 What is the TPP? Long-range transportation plan for the Twin Cities region Part of the federal 3C planning process cooperative, continuous, comprehensive
Developing a Transportation Asset Management Plan
 Developing a Transportation Asset Management Plan A Workshop for the NCDOT July 2, 2015 Conducted By: Katie Zimmerman, P.E., Applied Pavement Technology, Inc. (APTech) And Lacy Love, Volkert, Inc. Workshop
ALL Counties. ALL Districts
 TEXAS TRANSPORTATION COMMISSION ALL Counties rhnute ORDER Page of ALL Districts The Texas Transportation Commission (commission) finds it necessary to propose amendments to. and., relating to Transportation
GLOSSARY. At-Grade Crossing: Intersection of two roadways or a highway and a railroad at the same grade.
 Glossary GLOSSARY Advanced Construction (AC): Authorization of Advanced Construction (AC) is a procedure that allows the State to designate a project as eligible for future federal funds while proceeding
Re: Transit Asset Management; National Transit Database; Proposed Rule (Docket Number FTA )
") November 20, 2015 Honorable Therese McMillian Acting Administrator Federal Transit Administration United States Department of Transportation 1200 New Jersey Avenue SE Washington, DC 20590 Re: Transit Asset
November 20, 2015 Honorable Therese McMillian Acting Administrator Federal Transit Administration United States Department of Transportation 1200 New Jersey Avenue SE Washington, DC 20590 Re: Transit Asset
Transportation Funding in the Charlotte Region
 Transportation Funding in the Charlotte Region Andy Grzymski, Charlotte DOT August 21, 2007 Charlotte Region HOV/HOT/ Managed Lanes Study Workshop Background The Charlotte Region One of the South s s
MoDOT Dashboard. Measurements of Performance
 MoDOT Dashboard Measurements of Performance 1997 1998 1999 2000 2001 2002 MoDOT Dashboard Executive Summary Performance measurement is not new to MoDOT. In July 2001, MoDOT staff began completing quarterly
Review of the Federal Transit Administration s Transit Economic Requirements Model. Contents
 Review of the Federal Transit Administration s Transit Economic Requirements Model Contents Summary Introduction 1 TERM History: Legislative Requirement; Conditions and Performance Reports Committee Activities
2012 AASHTO Washington Briefing February 27, Jeff Paniati Jeff Paniati Executive Director Federal Highway Administration
 Moving Towards a Performance- Based Federal Highway Program 2012 AASHTO Washington Briefing February 27, 2012 Jeff Paniati Jeff Paniati Executive Director Federal Highway Administration Outline Comparison
Chapter 4: Regional Transportation Finance
 4.1 Chapter 4: Regional Transportation Finance 2040 4.2 CONTENTS Chapter 4: Transportation Finance Overview 4.3 Two Funding Scenarios 4.4 Current Revenue Scenario Assumptions 4.5 State Highway Revenues
Georgia Department of Audits and Accounts Performance Audit Division
 Special Examination Report No. 16-17 December 2016 Georgia Department of Audits and Accounts Performance Audit Division Greg S. Griffin, State Auditor Leslie McGuire, Director Why we did this review This
In addition to embarking on a new dialogue on Ohio s transportation priorities,
 Strategic Initiatives for 2008-2009 ODOT Action to Answer the Challenges of Today In addition to embarking on a new dialogue on Ohio s transportation priorities, the Strategic Initiatives set forth by
APPENDIX I REVENUE PROJECTION AND ASSUMPTIONS
 APPENDIX I REVENUE PROJECTION AND ASSUMPTIONS The 2018 StanCOG Regional Transportation Plan/Sustainable Communities Strategy (RTP/SCS) financial forecasts provide revenue projections for StanCOG member
JACKSONVILLE URBAN AREA METROPOLITAN PLANNING ORGANIZATION UNIFIED PLANNING WORK PROGRAM AMENDMENT 1 FISCAL YEAR 2018 TABLE OF CONTENTS
 JACKSONVILLE URBAN AREA METROPOLITAN PLANNING ORGANIZATION UNIFIED PLANNING WORK PROGRAM AMENDMENT 1 FISCAL YEAR 2018 TABLE OF CONTENTS Introduction 1 Five Year Planning Calendar 3 Budget Summary 4 Unified
2017 Educational Series FUNDING
 2017 Educational Series FUNDING TXDOT FUNDING INTRODUCTION Transportation projects take many years to develop and construct. In addition to the design, engineering, public involvement, right-of-way acquisition,
FY TRANSPORTATION IMPROVEMENT PROGRAM
 FY 2019 2022 TRANSPORTATION IMPROVEMENT PROGRAM Approved for Public Review and Comment: April 16, 2018 Approved by the Policy Board: May 21, 2018 Table of Contents Permian Basin MPO Membership and Structure...
Research: Research and Technology Transfer Office Sept. 1, 1996-Dec. 31, 1996 P.O. Box 5080
 1. Report No. 2. \.10vemment Accession No. 3. Recipient's Catalog No. FHWA/TX-99/1756-4 Technical Report Documentation Page 4. Title and Subtitle 5. ReportDate SUGGESTED GUIDELINES FOR REVIEWING PRIVATE
N A D O N A D O R E S E A R C H F O U N D AT I O N R P O A M E R I C A
 2009 NATIONAL SCAN: RURAL TRANSPORTATION PLANNING ORGANIZATIONS 2009 National Scan Results: Rural Transportation Planning Organizations Since the passage of ISTEA, an increasing number of states have turned
Contents. Alamo Area Metropolitan Planning Organization. Introduction S. St. Mary s Street San Antonio, Texas 78205
 Contents Introduction 1 Alamo Area Metropolitan Planning Organization Tel 210.227.8651 Fax 210.227.9321 825 S. St. Mary s Street San Antonio, Texas 78205 www.alamoareampo.org aampo@alamoareampo.org Pg.
OHIO MPO AND LARGE CITY CAPITAL PROGRAM SFY 2015 SUMMARY
 OHIO MPO AND LARGE CITY CAPITAL PROGRAM SFY 2015 SUMMARY TABLE OF CONTENTS MPO AND LARGE CITY PROGRAM OVERVIEW.. 3 MPO AND LARGE CITY SFY 2015 STP BUDGET SUMMARY......... 4 MPO AND LARGE CITY SFY 2015
FEDERAL FISCAL YEAR TRANSPORTATION IMPROVEMENT PROGRAM
 FEDERAL FISCAL YEAR 2019-2022 TRANSPORTATION IMPROVEMENT PROGRAM A regional program of surface transportation improvement projects to enhance the movement of goods and people along the greater Des Moines
Review and Update of Year 2035 Regional Transportation Plan
 Review and Update of Year 2035 Regional Transportation Plan #217752 1 Background Every four years, the Year 2035 Plan is reviewed Elements of review Validity of Plan Year 2035 forecasts Transportation
Prioritization and Programming Process. NCDOT Division of Planning and Programming November 16, 2016
 Prioritization and Programming Process NCDOT Division of Planning and Programming November 16, 2016 Today s Roadmap 1. Planning and Programming Division Overview 2. Strategic Investments (STI) Law 3. Prioritization
Chapter 6: Financial Resources
 Chapter 6: Financial Resources Introduction This chapter presents the project cost estimates, revenue assumptions and projected revenues for the Lake~Sumter MPO. The analysis reflects a multi-modal transportation
TAM ETG Webinar Series Webinar 5: Optimization and Cross-Asset Allocation
 TAM ETG Webinar Series Webinar 5: Optimization and Cross-Asset Allocation Sponsored by the TAM Expert Task Group Submit questions and comments using the webinar s Q&A feature Webinar 6 January 20, 2016
Economic Impact of Public Transportation Investment 2014 UPDATE
 Economic Impact of Public Transportation Investment 2014 UPDATE May 2014 Acknowledgements This study was conducted for the American Public Transportation Association (APTA) by Economic Development Research
10-Year Capital Highway Investment Plan
 10-Year Capital Highway Investment Plan 2017-2026 OCTOBER 2016 1 Table of Contents PURPOSE OF 10-YEAR CAPITAL HIGHWAY INVESTMENT PLAN...1 This page intentionally left blank. SUMMARY OF INVESTMENT PLANS...6
RIDOT The Ten Year Plan, Asset Management, and Innovation Moving Ahead in the 21 st Century
 RIDOT The Ten Year Plan, Asset Management, and Innovation Moving Ahead in the 21 st Century Accent image here Rhode Island Bar Association Environmental and Energy Law Committee (EELC) February 16, 2018
Draft. Amendment FY Unified Planning Work Program
 FY 2018 FY Unified Planning Work Program Kalamazoo Area Transportation Study 5220 Lovers Lane, Suite 110 Portage, MI 49002 (269) 343-0766 www.katsmpo.org Page 1 of 75 [This page intentionally left blank.]
NATIONAL LAND TRANSPORT PROGRAMME / INformation sheet / october 2012
 NATIONAL LAND TRANSPORT PROGRAMME 2012 15 / INformation sheet / october 2012 Creating transport solutions for a thriving New Zealand The NZ Transport Agency Board has adopted the 2012 15 National Land
Transportation Finance Overview. Presentation Contents
 Transportation Finance Overview Matt Burress House Research Department matt.burress@house.mn Andy Lee House Fiscal Analysis andrew.lee@house.mn January 5 th & 10 th, 2017 Presentation Contents 2 Part 1:
MPO Staff Report MPO EXECUTIVE BOARD: August 16, 2017
 MPO Staff Report MPO EXECUTIVE BOARD: August 16, 2017 RECOMMENDED ACTION: August 30 th Open House Matter of Kick-off for 2045 Street/Highway Element Background: The UPWP identifies that the major undertaking
Technical Report No. 4. Revenue and Costs
 Technical Report No. 4 Revenue and Costs Technical Report No. 4 REVENUE AND COSTS PASCO COUNTY METROPOLITAN PLANNING ORGANIZATION 8731 Citizens Drive New Port Richey, FL 34654 Ph (727) 847-8140, fax (727)
NCDOT Funding Overview
 NCDOT Funding Overview Joint Appropriations Subcommittee on Transportation Mark L. Foster, CFO H. Tasaico February 16, 2011 Transportation Outlook NCDOT Funding Sources Transportation Funding Equity Cash
Strategic Prioritization Office of Transportation Local Input Point Assignment Methodology
 Introduction Strategic Prioritization Office of Transportation Local Input Point Assignment Methodology The Down East Rural Planning Organization (DERPO), covering Carteret, Craven, Jones, Onslow and Pamlico
MADISON ATHENS-CLARKE OCONEE REGIONAL TRANSPORTATION STUDY UNIFIED PLANNING WORK PROGRAM FY
 MADISON ATHENS-CLARKE OCONEE REGIONAL TRANSPORTATION STUDY UNIFIED PLANNING WORK PROGRAM FY - 2018 Final April 12, 2017 Prepared by: Athens-Clarke County Planning Department In Cooperation with: The Georgia
Performance-Based Planning APTA Sustainability and Multimodal Planning Workshop August 9, Mark Kane, Community Planner
 Performance-Based Planning APTA Sustainability and Multimodal Planning Workshop August 9, 2017 Mark Kane, Community Planner MAP-21 Performance Management Framework To increase accountability and transparency
TESTIMONY. The Texas Transportation Challenge. Testimony Before the Study Commission on Transportation Financing
 TESTIMONY The Texas Transportation Challenge Testimony Before the Study Commission on Transportation Financing Ric Williamson Chairman Texas Transportation Commission April 19, 2006 Texas Department of
NCHRP Consequences of Delayed Maintenance
 NCHRP 14-20 Consequences of Delayed Maintenance Recommended Process for Bridges and Pavements prepared for NCHRP prepared by Cambridge Systematics, Inc. with Applied Research Associates, Inc. Spy Pond
10-Year Capital Highway Investment Plan
 10-Year Capital Highway Investment Plan 2016-2025 DECEMBER 2015 1 This page intentionally left blank. TABLE OF CONTENTS Purpose of 10-Year Capital Highway Investment Plan...1 Summary of 10 Year Plan Investments...5
Transportation Economics and Decision Making. Lecture-11
 Transportation Economics and Decision Making Lecture- Multicriteria Decision Making Decision criteria can have multiple dimensions Dollars Number of crashes Acres of land, etc. All criteria are not of
The Oregon Department of Transportation Budget
 19 20 The Oregon Department of Transportation Budget The Oregon Department of Transportation was established in 1969 to provide a safe, efficient transportation system that supports economic opportunity
Mn/DOT Scoping Process Narrative
 Table of Contents 1 Project Planning Phase...3 1.1 Identify Needs...4 1.2 Compile List of Needs = Needs List...4 1.3 Define Project Concept...5 1.4 Apply Fiscal/Other Constraints...5 1.5 Compile List of
HIGHWAY SAFETY IMPROVEMENT PROGRAM (HSIP)
") HSIP GUIDEBOOK & APPLICATION FORM HIGHWAY SAFETY IMPROVEMENT PROGRAM (HSIP) Greater Minnesota Solicitation for District Projects State Fiscal Years 2019, 2020, 2021 and 2022 September 2017 2017 HSIP Solicitation
HSIP GUIDEBOOK & APPLICATION FORM HIGHWAY SAFETY IMPROVEMENT PROGRAM (HSIP) Greater Minnesota Solicitation for District Projects State Fiscal Years 2019, 2020, 2021 and 2022 September 2017 2017 HSIP Solicitation
Transportation Budget Trends
 2018 2019 Transportation Budget Trends Transportation Budget Trends 2018 2019 Wisconsin Department of Transportation The report provides a comprehensive view of transportation budget information presented
Recommendations for On the Move Plan Elements -- DRAFT MAY 23 Funding Goal Group June 22, 2006 Page 1
 Funding Goal Group June 22, 2006 Page 1 Goal: Be successful in obtaining adequate funding for transportation facilities. Background: An efficient and well maintained transportation system is essential
FY TRANSPORTATION IMPROVEMENT PROGRAM
 FY 2017 2020 TRANSPORTATION IMPROVEMENT PROGRAM Approved for Public Review and Comment: April 18, 2016 Table of Contents Permian Basin MPO Membership and Structure... 3 Mission Statement... 3 Vision Statement...
SFY 2018 (July 1, 2017 to June 30, 2018) Annual Report
 Annual Report") SFY 2018 (July 1, 2017 to June 30, 2018) Annual Report Thurston Regional Planning Council UNIFIED PLANNING WORK PROGRAM Annual Report for second year of TRPC s UPWP State Fiscal Years 2017-2018 (July 1,
SFY 2018 (July 1, 2017 to June 30, 2018) Annual Report Thurston Regional Planning Council UNIFIED PLANNING WORK PROGRAM Annual Report for second year of TRPC s UPWP State Fiscal Years 2017-2018 (July 1,
Regional Transportation Plan 2040
 South Jersey Transportation Planning Organization Regional Transportation Plan 2040 Technical Appendix #6: Financial Plan SJTPO July 2012 Version: July 16, 2012 The FHWA and FTA developed and issued the
Act 89 of January 2014
 Act 89 of 2013 January 2014 Act 89 Basics Passed by the Legislature November 21, 2013 Signed by Governor into law November 25, 2013 Increase funding for transportation by $2.3 Billion annually Address
STATEWIDE AND UPPER MIDWEST SUMMARY OF DEER- VEHICLE CRASH AND RELATED DATA FROM 1993 TO 2003
 STATEWIDE AND UPPER MIDWEST SUMMARY OF DEER- VEHICLE CRASH AND RELATED DATA FROM 1993 TO 2003 Final Report Principal Investigator Keith K. Knapp, P.E., Ph.D. Engineering Professional Development Department
Initial Transportation Asset Management Plan
 Initial Transportation Asset Management Plan Table of Contents Acronym Table Introduction.................. 1 Act 51 Michigan Public Act 51 of 1951 Program Development Call For Projects Process...........5
Strengthening Vermont s Economy by Integrating Transportation and Smart Growth Policy
 Strengthening Vermont s Economy by Integrating Transportation and Smart Growth Policy Technical Memorandum #4: Short List of Recommended Alternatives May 21, 2013 Tech Memo #4: Short List of Recommended
5/3/2016. May 4, Item #1 CITIZENS PARTICIPATION
 May 4, 2016 Item #1 CITIZENS PARTICIPATION 1 Item #2 ELECT AN ACTING CHAIR Item #3 APPROVAL OF MINUTES 2 Item #4 OVERVIEW OF TRAC AGENDA Committee Goals Learn about the RTC including its roadway and transit
Northern Virginia Transportation Commission: 2018 Legislative and Policy Agenda
 Northern Virginia Transportation Commission: 2018 Legislative and Policy Agenda Northern Virginia s economic growth and global competitiveness are directly tied to the region s transit network. Transit
APPENDIX B HIGH PRIORITY INVESTMENT PROGRAM (HPP) ( )
 ( )") APPENDIX B HIGH PRIORITY INVESTMENT PROGRAM (HPP) (2017-2020) (replaces previous Transportation Improvement Program) ACCESS2040 APPENDIX B HIGH PRIORITY INVESTMENT PROGRAM The High Priority Investment
APPENDIX B HIGH PRIORITY INVESTMENT PROGRAM (HPP) (2017-2020) (replaces previous Transportation Improvement Program) ACCESS2040 APPENDIX B HIGH PRIORITY INVESTMENT PROGRAM The High Priority Investment
APPENDIX 5 FINANCIAL ANALYSIS
 APPENDIX 5 FINANCIAL ANALYSIS Background Starting with the Intermodal Surface Transportation Equity Act of 1991, it has been a consistent requirement of federal law and regulation that the projects included
Twin Cities Area Transportation Study (TwinCATS) Adopted:
 Adopted:") Introduction Twin Cities Area Transportation Study (TwinCATS) Transportation Improvement Program Administrative Modification & Amendment Policy Adopted: This document provides guidance that defines the
Introduction Twin Cities Area Transportation Study (TwinCATS) Transportation Improvement Program Administrative Modification & Amendment Policy Adopted: This document provides guidance that defines the
Chapter 5: Cost and Revenues Assumptions
 Chapter 5: Cost and Revenues Assumptions Chapter 5: Cost and Revenues Assumptions INTRODUCTION This chapter documents the assumptions that were used to develop unit costs and revenue estimates for the
Joint Appropriations Subcommittee on Transportation
 Joint Appropriations Subcommittee on Transportation Funding Overview February 21, 2013 H. Tasaico, PE 1 NCDOT Funding Overview - Agenda State Transportation Comparative Data Transportation Funding Sources
Chapter 12: Programming/Resource Allocation
 Chapter 12: Programming/Resource Allocation What is works programming? Works programming refers to the preparation of annual and multi-annual works programs in which road assets requiring treatment are
Arlington Transportation Demand Managment Strategic Plan FY FY2040
 Arlington Transportation Demand Managment Strategic Plan Arlington County Transportation Demand Management Strategic Plan, FY2013 - FY2040 FY2013 - FY2040 Arlington Transportation Partners The Commuter
Florida Department of Transportation INITIAL TRANSPORTATION ASSET MANAGEMENT PLAN
 Florida Department of Transportation INITIAL TRANSPORTATION ASSET MANAGEMENT PLAN April 30, 2018 (This page intentionally left blank) Table of Contents Chapter 1 Introduction... 1-1 Chapter 2 Asset Management
Transportation Planning in the Denver Region
 The Prospectus Transportation Planning in the Denver Region Draft Version August 2016 Approved December 2004 Revised November 2006 Revised August 2007 Revised March 2009 Revised September 2011 Revised
Transportation Funding
 Transportation Funding TABLE OF CONTENTS Introduction... 3 Background... 3 Current Transportation Funding... 4 Funding Sources... 4 Expenditures... 5 Case Studies... 6 Washington, D.C... 6 Chicago... 8
RIVERSIDE COUNTY TRANSPORTATION COMMISSION
 RIVERSIDE COUNTY TRANSPORTATION COMMISSION DATE: January 28, 2016 TO: Riverside County Transportation Commission FROM: Aaron Hake, Government Relations Manager THROUGH: Anne Mayer, Executive Director SUBJECT:
Chapter 8: Lifecycle Planning
 Chapter 8: Lifecycle Planning Objectives of lifecycle planning Identify long-term investment for highway infrastructure assets and develop an appropriate maintenance strategy Predict future performance
Regional Equity Analysis Of Current Funding (Highway STIP and CIP) Project Selection Advisory (PSA) Council
 Project Selection Advisory (PSA) Council") Regional Equity Analysis Of Current Funding (Highway STIP and CIP) Project Selection Advisory (PSA) Council TABLE OF CONTENTS 1 Introduction and Analysis Framework... 1-1 1.1 The Project Selection Advisory
Regional Equity Analysis Of Current Funding (Highway STIP and CIP) Project Selection Advisory (PSA) Council TABLE OF CONTENTS 1 Introduction and Analysis Framework... 1-1 1.1 The Project Selection Advisory
32 nd Street Corridor Improvements
 Benefit-Cost Analysis Supplementary Documentation TIGER Discretionary Grant Program 32 nd Corridor Improvements USDOT TIGER BCA Results City of Joplin, MO April 29, 2016 32nd Corridor Improvements Contents...
UNIFIED PLANNING WORK PROGRAM
 B O N N E V I L L E M E T R O P O L I T A N P L A N N I N G O R G A N I Z A T I O N Bonneville Metropolitan B O N N E V I L L E M E T R O P O L I T A N P L A N N I N G O R G A N I Z A T I O N Planning
State of Nevada Department of Transportation
 State of Nevada Department of Transportation 2011-2013 Biennial Budget Overview March 15, 2011 E - 1 The Nevada Department of Transportation Summary of Agency Operations: The Nevada Department of Transportation
CHAPTER 4 FINANCIAL STRATEGIES: PAYING OUR WAY
 The financial analysis of the recommended transportation improvements in the 2030 San Diego Regional Transportation Plan: Pathways for the Future (RTP or the Plan ) focuses on four components: Systems
Life-Cycle Cost Analysis: A Practitioner s Approach
 Life-Cycle Cost Analysis: A Practitioner s Approach FHWA Office of Performance Management 1 Topics Fundamentals of Economic Analysis Tools and resources What to do now 2 Learning Objectives By the end