Insights from the MACE Compensation & Operations Surveys LARRY DOWELL, DOWELL MANAGEMENT
|
|
|
- Kelley Ray
- 5 years ago
- Views:
Transcription
1 1 Insights from the MACE Compensation & Operations Surveys LARRY DOWELL, DOWELL MANAGEMENT


2 Compensation & Benefits Survey
3 About MACE 3 Founded in 1972, serves six-state region Iowa, Minnesota, Nebraska, North Dakota, South Dakota, Wisconsin Purpose is three-fold Provide continuing education opportunities Facilitate connection with industry peers Develop a regional ethic among chambers of commerce Expanded Product Line Annual Conference Biannual Compensation & Benefits Survey Biannual Operation Survey Membership Satisfaction Survey Newsline Advocacy Alliance
4 Larry Dowell, Executive Director - MACE 4 Former President/CEO of the Saint Paul Area Chamber of Commerce Founded Dowell Management in 2007 Nearly 40 years in organizational business management Products: o o o Full Association Management Strategic Planning Executive Search
5 Survey Background 5 Methodology Self reporting, sampling, corrupt data 700 Chambers of Commerce were sent the survey Who was surveyed Iowa, Illinois, Nebraska, Minnesota, North Dakota, South Dakota, Wisconsin Who participated 222 surveys were completed, approximately a 32% response rate

6 State Participation 6 WI 23% SD 6% IL 20% ND 3% NE 8% IA 16% MN 24% Trend Lines Overall, participation was steady from However, participation was more equally distributed among states.


7 Gender of Chief Paid Executive 7 32% 68% In 2012, 63% of chamber executives were female.
8 Gender by Income Group 8 >1m 750k-1m 500k-750k 300k-500k 200k-300k 100k-200k 50k-100k <50k 0% 10% 20% 30% 40% 50% 60% 70% 80% 90% 100% Female Male
9 Age of Chief Paid Executive 9 40% 35% 30% 25% 20% 15% 10% 5% 0% 5% 18 to 29 years 9% 30 to 37 years 17% 38 to 45 years 36% 46 to 55 years 33% 55+ years
10 Percentage of Chamber Executives older than <50k 50k-100k 100k-200k 200k-300k 300k-500k 500k-750k 750k-1m >1m

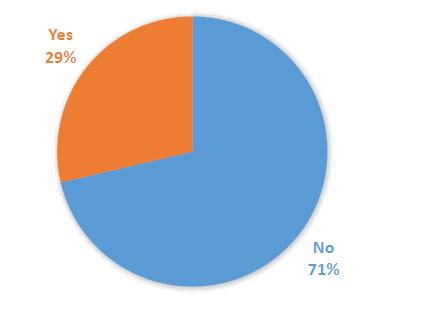
11 Does chamber directly contribute to cost of medical insurance? 11 44% 56% 2014 Yes No % 51% Medical Insurance Over 69% of chambers with budgets over $300,000 contribute to the cost of medical insurance (down from 95% in 2012).
12 Benefit Offerings for Chamber Executives 12 Benefit % of Chambers Offering Benefit Club (civic) membership 60% Qualified Retirement Plan 59% Medical Insurance (some portion) 44% Life Insurance 31% Personal Auto Allowance 24% Long-term Disability 23% Club (social) membership 23% Dental Insurance 22% Benefit % of Chambers Offering Benefit Paid Parking 20% Short-term Disability 20% Tuition Reimbursement 18% HSA 15% Cafeteria Plan Reimbursement 14% Furnished Auto 6%
13 Chamber Executive Bonuses 13 Income Group Bonus Paid Bonus Potential 50k-100k $ $ k-200k $1, $1, k-300k $2, $2, k-500k $1, $2, k-750k $5, $6, k-1m $3, $3, >1m $19, $23,954.73
14 Of these categories, which is the lowest average base salary for all chambers? 14 -Business Manager -Government Affairs Manager -Membership Manager -Communication Manager -Small Business Manager -CUB Manager -Special Projects Manager -ECO Development Manager
15 Average Base Salary 15 Position Base Salary Special Projects Manager $34,663 Membership Manager $36,244 Communication Manager $40,973 CUB Manager $43,879 Program Manager $45,583 Business Manager $46,106 Government Affairs Manager $62,784 ECO Development Manager $86,068


16 Organizational Structure & Function 16 Lost a Major Function 8% 40% of those are no longer the primary economic development organization U.S. Chamber Member 57% Have an adopted strategic plan 78%
17 Membership 17 Membership Dues Formula Membership Dues with Investor Packages Tiered Dues Other Membership Models 7% 15% 14% 64%
18 Average Chamber $50,000 and below 18 Executive Profile Age 36 Tenure at current chamber 1-3 years Salary $28, Bonus Potential $0.00 Vacation Days 9 days Chamber Profile Full-time Staff 1.3 Part-time Staff 0 Members 163
19 Average Chamber $50,001-$100, Executive Profile Age 43 Tenure at current chamber 1-3 years Salary $37, Bonus Potential $985 Vacation Days 13 days Chamber Profile Full-time Staff 1.5 Part-time Staff 1 Members 175
20 Average Chamber $100,001-$200, Executive Profile Age 42 Tenure at current chamber 1-3 years Salary $47, Bonus Potential $1,795 Vacation Days 17 days Chamber Profile Full-time Staff 2.2 Part-time Staff 1.8 Members 283
21 Average Chamber $200,001-$300, Executive Profile Age 46 Tenure at current chamber 1-3 years Salary $58, Bonus Potential $2,842 Vacation Days 21 days Chamber Profile Full-time Staff 2.5 Part-time Staff 1 Members 386
22 Average Chamber $300,001-$500, Executive Profile Age 47 Tenure at current chamber years Salary $68, Bonus Potential $2,788 Vacation Days 24 days Chamber Profile Full-time Staff 4.1 Part-time Staff 1.2 Members 439
23 Average Chamber $500,001-$750, Executive Profile Age 48 Tenure at current chamber years Salary $87, Bonus Potential $6, Vacation Days 22 days Chamber Profile Full-time Staff 4.8 Part-time Staff 1.5 Members 679
24 Average Chamber $750,001-$1,000, Executive Profile Age 44 Tenure at current chamber 7-10 years Salary $117, Bonus Potential $3, Vacation Days 19 days Chamber Profile Full-time Staff 10.3 Part-time Staff 2.0 Members 728
25 Average Chamber More than $1,000, Executive Profile Age 47 Tenure at current chamber More than 15 years Salary $154, Bonus Potential $23, Vacation Days 37 days Chamber Profile Full-time Staff 17.5 Part-time Staff 3.2 Members 1,178
26 Compensation and Benefits Survey Conclusion 26 Full survey report is posted on the MACE website right now Chambers who participated will receive a code for a complimentary copy. Those who did not participate can purchase the report for $45 Chambers desiring custom reports or specific data requests should be directed to: Jake Ganser, Dowell Management jake@dowellmgmt.com

27 27 Chamber Operations Survey 2015
28 Survey Categories 28 Organizational Structure and Function Governance Membership Communications Staffing & Continuing Education Events Public Policy and Political Action Financials *Information is organized by state, budget size, and year
29 State Participation 29 Methodology Self reporting, sampling, corrupt data WI 26%, 40 IA 18%, 28 Who was surveyed Iowa, Nebraska, Minnesota, South Dakota, Wisconsin SD 10%, 15 NE 15%, 23 MN 31%, 48
30 Organizational Structure & Function 30 Does your chamber have a foundation? 21% 4.5% of chambers in the $50-$100k category have foundations 79% 60% of chambers in the $1 million+ category have foundations Yes No
31 Organizational Structure & Function 31 Title of Chief Paid Executive 5% 38.00% 57.50% CEO/President Executive Director Other

32 Organizational Structure & Function 32
33 Governance 33 Does your chamber have a Board of Directors job description? 23% 77% Yes No
34 Single Slate Governance 34 During your last Board of Directors election, what was the election process? 22% 78%

35 Governance 35 What types of insurance does your chamber carry? 95% 92% 79% 79% 79% 67% 28% 34% 7% 9% Directors & Officers General Liability Insurance Property Insurance Product Liability Insurance Professional Liability Insurance
36 Yes No Membership 36 Will you be increasing the dues rate for existing members in 2015? 52% 48%
37 Communication 37 Frequency of member newsletters 51% 47.50% 33% 42% % 6% 7% 3.50% 0% 1% Weekly Bi-monthly Monthly Quarterly As needed
38 Staffing & Continuing Education 38 Average employee tenure is 6.5 years Regardless of size of chamber Average number of staff
39 Staffing & Continuing Education 39 What was your chamber s employee turnover rate in the last complete fiscal year? 7% 18%
40 Events & Programs 40 Which of these programs does your chamber currently offer? Young Professional Program 44% Leadership Program 58% Golf Tournament 82% Workforce Development 18% Chamber Bucks 78% Printed Directories 69% Certificates of Origin 62% 0% 10% 20% 30% 40% 50% 60% 70% 80% 90%
41 Events & Programs 41 Do you charge different member and nonmember rates for events? 19% Yes No 35% Average non-member event price increase 81%
42 0% 20% 40% 60% 80% 100% Public Policy & Political Action 42 None Local State Feder al At which levels of government does your organization advocate on behalf of members? 18% 24% 56% 80%
43 Profitability 43 77% 55% 71% 69% 75% Average dues vs. non-dues Revenue 47% Dues Revenue 0 49% Non-Dues Revenue
44 Financials 44 Compilation At the end of the last fiscal year, which of the following did your organization perform? 16% Review 45% Audit 29% None of the Above 10% 0% 10% 20% 30% 40% 50%
45 Operations Survey Conclusion 45 Chambers who participated will received a code for a complimentary copy. Those who did not participate can purchase the report for $45 Chambers desiring custom reports or specific data requests should be directed to: Jake Ganser, Dowell Management Jake@dowellmgmt.com


46 US Chamber National Advocacy Survey 46


47 Does your chamber have a public policy or government affairs program? 47
48 90% 80% 70% 60% 50% 40% 30% 20% 10% 0% Chamber activity involving candidates or other campaigns (check all that apply): Chambers with Public Policy Programs 48

49 Advocacy Alliance Policy Conference 49 For more information and to register, visit:
50 50 Thank you ANY QUESTIONS?
Mercer s Executive Benefits and Perquisites Survey for Tax-Exempt Organizations
 Mercer s Executive Benefits and Perquisites Survey for Tax-Exempt Organizations Welcome to the Mercer Executive Benefits and Perquisites Survey for Tax-Exempt Organizations. Thank you for agreeing to participate.
Copyright 2013 by the National Sporting Goods Association, Mt. Prospect,
 1 Copyright 2013 by the National Sporting Goods Association, Mt. Prospect, Welcome! Thank You for Attending! 2 Agenda Background / Purpose Survey Results Composition of the Outside Sales Team Compensation
MINNEAPOLIS ST. PAUL VISITOR COUNTS AND PROFILE. Kevin Hanstad April 28, 2016
 MINNEAPOLIS ST. PAUL VISITOR COUNTS AND PROFILE Kevin Hanstad April 28, 2016 SUMMARY 32 Million People Visited Minneapolis-St. Paul in 2015 and Spent $7.5 Billion Average Age: 46 Average Income: $95,000
Quality & Nondestructive Testing Industry. Salary Survey Your Path to the Perfect Job Starts Here.
 Quality & Nondestructive Testing Industry Salary Survey 2011 Your Path to the Perfect Job Starts Here. ABOUT PQNDT PQNDT (Personnel for Quality and Nondestructive Testing) is the leading personnel recruitment
Trends in Chamber Operations 2016 ACCE s 13 th Annual Edition. Produced in part through generous support from
 Trends in Chamber Operations 2016 ACCE s 13 th Annual Edition Produced in part through generous support from Chamber Operations Survey Report FY 2016 Thirteenth Annual Chamber Operations Survey ACCE Chamber
Clarity Tax Rate and WRS Rate Changes 2019
 Clarity Tax Rate and WRS Rate Changes 2019 Clarity Tax Rate and WRS Rate Changes 2019 Table of Contents Federal Tax Rates... 2 Step 1 Enter Changes for Social Security Limits... 3 Step 2 Enter Changes
2017 BIENNIAL SALARY SURVEY SUMMARY
 2017 BIENNIAL SALARY SURVEY SUMMARY TABLE OF CONTENTS Comments on Results... 3 Comparison of Findings.... 4 Salary Summary Data 5-9 Billable Summary Data. 10-13 Survey Summary 14 COMMENTS ON RESULTS This
Xcel Energy Minnesota 2012 Rate Case Overview (Docket No:12-961) November 15, 2012
 November 15, 2012") Xcel Energy Minnesota 2012 Rate Case Overview (Docket No:12-961) November 15, 2012 *All data is from: U.S. Department of Energy Energy Information Administration Minnesota Chamber of Commerce We represent
Xcel Energy Minnesota 2012 Rate Case Overview (Docket No:12-961) November 15, 2012 *All data is from: U.S. Department of Energy Energy Information Administration Minnesota Chamber of Commerce We represent
AcisTek Corporation Benefits Summary
 AcisTek Corporation Benefits Summary AcisTek understands that our people are the most important assets of company. Our approach to employee benefits offers great benefits across the company in a competitive
2013 Salary Survey. Market Research By: Kane Consulting Palatine, Illinois Institute of Packaging Professionals
 Market Research By: Kane Consulting Palatine, Illinois 60067 Copyright 2013 Institute of Packaging Professionals Table of Contents Introduction & Method...2 Results...3 Section I: Respondent Profile -
Health Insurance Price Index for October-December February 2014
 Health Insurance Price Index for October-December 2013 February 2014 ehealth 2.2014 Table of Contents Introduction... 3 Executive Summary and Highlights... 4 Nationwide Health Insurance Costs National
David P. Lind Benchmark University, Suite 202 Clive, IA
 14 th Annual Study David P. Lind Benchmark 13375 University, Suite 202 Clive, IA 50325 www.dplindbenchmark.com 515.868.0920 Copyright 2012 David P. Lind Benchmark. All Rights Reserved 100% 90% 80% 70%
Age of Insured Discount
 A discount may apply based on the age of the insured. The age of each insured shall be calculated as the policyholder s age as of the last day of the calendar year. The age of the named insured in the
NSPE Membership Report to the NSPE House of Delegates
 NSPE Membership Report to the NSPE House of Delegates Overall Membership Trends The total NSPE membership declined 4.32% over the period May 2012 May 2013.The decline was 4.68% for the prior 12 month period.
Quality & Nondestructive Testing Industry. Salary Survey Your Path to the Perfect Job Starts Here.
 Quality & Nondestructive Testing Industry Salary Survey 2006 Your Path to the Perfect Job Starts Here. ABOUT PQNDT PQNDT had a very simple beginning as a series of favors to employers in the NDT industry.
Update: 50-State Survey of Retiree Health Care Liabilities Most recent data show changes to benefits, funding policies could help manage rising costs
 A fact sheet from Dec 2018 Update: 50-State Survey of Retiree Health Care Liabilities Most recent data show changes to benefits, funding policies could help manage rising costs Getty Images Overview States
Net Operating Revenue (35,115) (14,520) 371 (1,661) (2,008) (2,679) (531) 1,501 (37,283) (17,359)
 (14,520) 371 (1,661) (2,008) (2,679) (531) 1,501 (37,283) (17,359)") GOOD SAMARITAN SOCIETY CONSOLIDATED STATEMENT OF OPERATIONS (UNAUDITED) 31, 2017 YTD (dollar amounts in thousands) Elimination Elimination Obligated Group Obligated Group GSS Insurance GSS Insurance Entities
GOOD SAMARITAN SOCIETY CONSOLIDATED STATEMENT OF OPERATIONS (UNAUDITED) 31, 2017 YTD (dollar amounts in thousands) Elimination Elimination Obligated Group Obligated Group GSS Insurance GSS Insurance Entities
Net Operating Revenue (21,913) (10,860) (678) (1,242) (1,461) (2,090) 558 1,122 (23,494) (13,070)
 (10,860) (678) (1,242) (1,461) (2,090) 558 1,122 (23,494) (13,070)") GOOD SAMARITAN SOCIETY CONSOLIDATED STATEMENT OF OPERATIONS (UNAUDITED) 30, 2017 YTD (dollar amounts in thousands) Elimination Elimination Obligated Group Obligated Group GSS Insurance GSS Insurance Entities
GOOD SAMARITAN SOCIETY CONSOLIDATED STATEMENT OF OPERATIONS (UNAUDITED) 30, 2017 YTD (dollar amounts in thousands) Elimination Elimination Obligated Group Obligated Group GSS Insurance GSS Insurance Entities
Net Operating Revenue (13,329) (7,201) (451) (823) (891) (1,294) (14,260) (8,535)
 (7,201) (451) (823) (891) (1,294) (14,260) (8,535)") GOOD SAMARITAN SOCIETY CONSOLIDATED STATEMENT OF OPERATIONS (UNAUDITED) 30, 2017 YTD (dollar amounts in thousands) Elimination Elimination Obligated Group Obligated Group GSS Insurance GSS Insurance Entities
GOOD SAMARITAN SOCIETY CONSOLIDATED STATEMENT OF OPERATIONS (UNAUDITED) 30, 2017 YTD (dollar amounts in thousands) Elimination Elimination Obligated Group Obligated Group GSS Insurance GSS Insurance Entities
Net Operating Revenue (23,938) 823 1,790 (1,120) 4,890 (1,036) (2,240) 670 (19,498) (663)
 823 1,790 (1,120) 4,890 (1,036) (2,240) 670 (19,498) (663)") GOOD SAMARITAN SOCIETY CONSOLIDATED STATEMENT OF OPERATIONS (UNAUDITED) 31, 2015 YTD (dollar amounts in thousands) Elimination Elimination Obligated Group Obligated Group GSS Insurance GSS Insurance Entities
GOOD SAMARITAN SOCIETY CONSOLIDATED STATEMENT OF OPERATIONS (UNAUDITED) 31, 2015 YTD (dollar amounts in thousands) Elimination Elimination Obligated Group Obligated Group GSS Insurance GSS Insurance Entities
2014 Salary Survey. Market Research By: Kane Consulting Palatine, Illinois Copyright 2014 Institute of Packaging Professionals
 Market Research By: Kane Consulting Palatine, Illinois 60067 Copyright 2014 Institute of Packaging Professionals Table of Contents Introduction & Method...2 Results...3 Section I: Respondent Profile -
Presented by: Daniel J. Prescott Regional Senior Vice President
 The Affordable Care Act: Who Wins and Who Loses? Presented by: Daniel J. Prescott Regional Senior Vice President Large Market Winners & Losers in the Affordable Care Act Employers Individuals Insurance
MARKET TRENDS: MEDICARE SUPPLEMENT. Gorman Health Group, LLC
 MARKET TRENDS: MEDICARE SUPPLEMENT Gorman Health Group, LLC Issued: December 1, 2016 TABLE OF CONTENTS EXECUTIVE SUMMARY... 3 OVERALL TRENDS IN MEDICARE SUPPLEMENT ENROLLMENT... 4 NATIONWIDE ENROLLMENT...
Legislative Updates. Corinne Tirone, JD, Manager, Employment Law Research
 Legislative Updates Corinne Tirone, JD, Manager, Employment Law Research Welcome Corinne Tirone, JD: 10+ years working in legal research, 5+ years in the payroll and human capital management industry Leads
medicaid a n d t h e How will the Medicaid Expansion for Adults Impact Eligibility and Coverage? Key Findings in Brief
 on medicaid a n d t h e uninsured July 2012 How will the Medicaid Expansion for Adults Impact Eligibility and Coverage? Key Findings in Brief Effective January 2014, the ACA establishes a new minimum Medicaid
FORM G-37. Name of Regulated Entity: Ascensus Broker Dealer Services, LLC. Report Period: First Quarter of 2018
 Name of Regulated Entity: Ascensus Broker Dealer Services, LLC Report Period: First Quarter of 2018 I. CONTRIBUTIONS made to officials of a municipal entity (list by state) RI Complete name, title (including
2010 Practice Profile Survey
 2010 Practice Profile Survey 2010 Practice Profile Survey The 2010 SPSSCS Practice Profile Survey was compiled, tabulated and analyzed by Industry Insights, Inc. and is intended for use by SPSSCS, its
Compensation Planning for 2019
 SILVERLINK SPECIAL BULLETIN Compensation Planning for 2019 September 2018 If you would like consulting advice regarding specific issues pertaining to jobs in your organization, or would like additional
AGENCY OWNERSHIP CHANGE: Merger, Sale or Acquisition
 Concorde General Agency Agency Application for Appointment Page 1 AGENCY OWNERSHIP CHANGE: Merger, Sale or Acquisition The following paperwork is designed to expedite the process of changing agency appointment
CAH Financial Indicators Report: Summary of Indicator Medians by State
 Flex Monitoring Team Data Summary Report No. 18: : Summary of Indicator Medians by State March 2016 The Flex Monitoring Team is a consortium of the Rural Health Research Centers located at the Universities
State Retiree Health Care Liabilities: An Update Increased obligations in 2015 mirrored rise in overall health care costs
 A brief from Sept 207 State Retiree Health Care Liabilities: An Update Increased obligations in 205 mirrored rise in overall health care costs Overview States paid a total of $20.8 billion in 205 for nonpension
NASRA Issue Brief: Employee Contributions to Public Pension Plans
 NASRA Issue Brief: Employee Contributions to Public Pension Plans September 2017 Unlike in the private sector, nearly all employees of state and local government are required to share in the cost of their
TOOLS TO ATTRACT & RETAIN TOP TRANSIT TALENT. Prepared by:
 TOOLS TO ATTRACT & RETAIN TOP TRANSIT TALENT Prepared by: Caitlin D Alton, AICP Senior Planner Capital Metro Austin, TX caitlin.d'alton@capmetro.org Matthew Hibbard Social Media Communications Manager
TABLE OF CONTENTS INTRODUCTION... 1
 TABLE OF CONTENTS INTRODUCTION... GENERAL WORKFORCE TRENDS... 3 General Workforce Trends and Comparisons Overview... 5 State Government Employees to State Population... 6 State Government Full-Time Equivalent
Data Note: What if Per Enrollee Medicaid Spending Growth Had Been Limited to CPI-M from ?
 Data Note: What if Per Enrollee Medicaid Spending Growth Had Been Limited to CPI-M from 2001-2011? Rachel Garfield, Robin Rudowitz, and Katherine Young Congress is currently debating the American Health
Dental: The current dental insurance carrier is HealthPartners Dental. Coverage levels include single (core) or family coverage.
 or family coverage.") Summary of Benefits Cafeteria Plan Association of Supervisory & Administrative Personnel - 2019 (Information as of 01/01/2019) Welcome to Saint Paul Public Schools. At 30 days of employment, you will be
Summary of Benefits Cafeteria Plan Association of Supervisory & Administrative Personnel - 2019 (Information as of 01/01/2019) Welcome to Saint Paul Public Schools. At 30 days of employment, you will be
Considerations for K-12 Finance Reform in Nebraska
 Craig S. Maher, Ph.D. Director, Nebraska State and Local Finance Lab School of Public Administration University of Nebraska at Omaha December 2015 Introduction The Nebraska Legislature has recently held
April Conducted by
 Conducted by Methodology: An email survey was sent to subscribers of Design News (both print and e newsletters) during the month of May, 2009. Results of the study were tabulated by Research Results, an
AIA 2019 Compensation Survey Survey Questions
 Contact Info page 1 AIA 2019 Compensation Survey Survey Questions Contact Info *1. Do you currently reside in a European Union member country? This survey does not apply if you currently reside in the
ADDENDUM TO THE DEPOSIT ACCOUNT DISCLOSURE AND SCHEDULE OF FEES AND CHARGES FOR PERSONAL DEPOSIT ACCOUNTS (All States*) Bank at Work Program
 Bank at Work Program") ADDENDUM TO THE DEPOSIT ACCOUNT DISCLOSURE AND SCHEDULE OF FEES AND CHARGES FOR PERSONAL DEPOSIT ACCOUNTS (All States*) Effective June 5, 2017 This Addendum, together with the applicable Schedule of Fees
ADDENDUM TO THE DEPOSIT ACCOUNT DISCLOSURE AND SCHEDULE OF FEES AND CHARGES FOR PERSONAL DEPOSIT ACCOUNTS (All States*) Effective June 5, 2017 This Addendum, together with the applicable Schedule of Fees
Colorado Nonprofit. Salary & Benefits. Survey. Sponsored by Colorado Nonprofit Association
 2014 Colorado Nonprofit Salary & Benefits Survey Sponsored by 2014 Colorado Nonprofit Association www.coloradononprofits.org Introduction 5 About the Survey / 5 How to Use the Survey / 5 Methodology /
Welcome to the annual Arizona School Boards Association Superintendent Salary & Benefits Survey.
 Welcome to the annual Arizona School Boards Association Superintendent Salary & Benefits Survey. Please coordinate the submittal of one survey per District between the Superintendent, HR, and/or the Superintendent's
MANUFACTURING INDUSTRY
 MANUFACTURING INDUSTRY From the 2018 Compensation Best Practices Report 675+ RESPONDENTS 1 PayScale s 2018 Compensation Best Practices Report gathered information from 7,000+ respondents across industries,
Committee on Ways and Means Democrats
 DRAFT Committee on Ways and Means Democrats Representative Sandy Levin - Ranking Member Report November 7, 2013 Millions of Unemployed Americans Will Lose Benefits Unless Congress Acts Over 3 Million Will
Compensation, Retirement, and Benefits Trends Report Findings and Benchmarking
 Compensation, Retirement, and Benefits Trends Report Findings and Benchmarking 2016/2017 Edition 1 newportgroup.com For informational use only. Introduction In today's economy, employee benefits remain
Systematic Distribution Form
 Systematic Distribution Form (To be used for all Qualified Plans, IRA s and Non-Qualified Plans) (This form is not applicable to a Required Minimum Distribution ( RMD ). If you are older than 70 ½, refer
2018 Benefits at a Glance FULL-TIME EMPLOYEES
 2018 Benefits at a Glance FULL-TIME EMPLOYEES Important Note CNA Benefits at a Glance provides highlights of the employee benefit programs available to you as a CNA employee. Neither this document nor
Montana State Planning Grant A Big Sky Opportunity to Expand Health Insurance Coverage. Interim Report
 Montana State Planning Grant A Big Sky Opportunity to Expand Health Insurance Coverage Interim Report Submitted to Health Resources and Services Administration (HRSA) U.S. Department of Health and Human
Agricultural Field Crops Pesticide Fees 13 MACA States Current as of February 29, 2012.
 Agricultural Field Crops Fees CO unless noted $165/product application. (8/30/09) es Restricted Use Dealer - $50/year/site. $75 must apply for license, plus $20 for manual and test fee. $350/year $50 Limited
Increase Profitability by Controlling Insurance Premiums
 Increase Profitability by Controlling Insurance Premiums Increase Profitability by Controlling Insurance Premiums Jeff Mount Senior Vice President Federated Insurance This session is eligible for 1.5 Continuing
2017 Dealership Insurance & Benefits TRUCK Survey Results Based on 58 responses
 2017 Dealership Insurance & Benefits TRUCK Survey Results Based on 58 responses 2017 Dealership Insurance & Benefits Survey Results Truck - 58 Responses The Pennsylvania Automotive Association (PAA) has
Financial Transaction Form for IRA and Non-Qualified Contracts Only
 Financial Transaction Form for IRA and Non-Qualified Contracts Only (Note: See Form ZA-8642 dealing with Financial Transactions for 403(b)/TSA s) Please Print All Information Below Zurich American Life
Aetna Individual Direct Pay Commissions Schedule
 Aetna Individual Direct Pay Commissions Schedule Cards Issued Broker Rate Broker Tier Per Year 1st Yr 2nd Yr 3+ Yrs Levels 11-Jan 4.00% 4.00% 3.00% Bronze 24-Dec 6.00% 4.00% 3.00% Silver 25-49 8.00% 4.00%
ACFAS Compensation and Benefits Survey Results Spring 2012
 ACFAS Compensation and Benefits Survey Results Spring 2012 The 2012 ACFAS Compensation and Benefits Survey was conducted in Spring 2012 as part of the College s triennial Practice Economics Survey. The
POLICY BRIEF. Unemployment Insurance Modernization: Good for Nebraska
 POLICY BRIEF Unemployment Insurance Modernization: Good for Nebraska LOW INCOME SELF SUFFICIENCY Child Welfare System Accountability Program Nebraska Appleseed Center for Law in the Public Interest December
New Employer Checklist
 THE ALLIANCE HEALTH PLAN New Employer Checklist OPEN ENROLLMENT 2017 Open Enrollment is November 14 December 9 This checklist is for employers who wish to enroll their employees in The Alliance Health
TAX LIABILITIES / DEPOSITS & DUE DATES 27
 Current Payroll Tax Liabilities *** To-Date Tax Liabilities (Please Read) *** Basic Company Information Payroll Dates The Sample Company 380 E. Lafayett Frontage Road, Ste. 110 (1) Period Start Date: 01/11/08
NONPROFIT SURVEY SUMMER 2018
 NONPROFIT SURVEY Introduction Focus Marks Paneth LLP s Summer 2018 Nonprofit Pulse survey is based on the opinions of 216 leaders and managers of nonprofit organizations. Current conditions in the nonprofit
Financial Firsts: When Do People Take Their First Financial Steps? Appendix: Annotated Questionnaire 1
 Financial Firsts: When Do People Take Their First Financial Steps? Appendix: Annotated Questionnaire 1 Conducted for AARP by at the University of Chicago through the Amerispeak Panel Interviews: 946 adults
Responding to the New Realities of Unemployment: Worker Priorities for the Unemployment Insurance Safety Net in 2005
 Responding to the New Realities of Unemployment: Worker Priorities for the Unemployment Insurance Safety Net in 2005 AFL-CIO Workers Voice State Legislative Issues Conference July 17, 2004 Salt Lake City,
The Pediatric Paycheck: Working Compensation Models. Chip Hart PCC UC 2017
 The Pediatric Paycheck: Working Compensation Models Chip Hart PCC UC 2017 chip@pcc.com Private Pediatric Compensation Models How can you ensure the fairest salary structure for your practice while upsetting
2017 WORKBOOK. Mandatory LTC Training
 2017 WORKBOOK Mandatory LTC Training ABOUT THE AUTHOR EDUCATION CREDIT AND YOUR CERTIFICATE OF COMPLETION LTC Connection specializes exclusively in LTC insurance training and education and has been working
Cooperative Advocacy in the National Health Care Reform Debate
 Cooperative Advocacy in the National Health Care Reform Debate 13 th Annual Farmer Cooperatives Conference December 6, 2010 Bill Oemichen, President and CEO Cooperative Network Trade association for more
SCEDA 2017 Compensation Survey Summary
 SCEDA 2017 Compensation Survey Summary Methodology SCEDA conducted a compensation survey among its economic developer members in Fall 2017, beginning with an emailed invitation linking to a survey sent
TEXAS TRUCKING INDUSTRY Compensation and Benefits Study
 2017 TEXAS TRUCKING INDUSTRY Compensation and Benefits Study 2 EXECUTIVE SUMMARY Introduction & Company Profiles 13 Staff Profiles, Staffing Changes,& Evaluations 14 Cash Compensation & Insurance Benefits
Comparison of 501(c)(3) and 501(c)(4) and 501(c)(6) Compiled from multiple publicly available web and printed resources**
(3) and 501(c)(4) and 501(c)(6) Compiled from multiple publicly available web and printed resources**") Comparison of 501(c)(3) and 501(c)(4) and 501(c)(6) Compiled from multiple publicly available web and printed resources** Purposes 501(c)(3) 501(c)(4) 501(c)(6) Social Welfare: An organization must be
Comparison of 501(c)(3) and 501(c)(4) and 501(c)(6) Compiled from multiple publicly available web and printed resources** Purposes 501(c)(3) 501(c)(4) 501(c)(6) Social Welfare: An organization must be
ACORD Forms Updated in AMS R1
 ACORD Forms Updated in AMS360 2017 R1 The following forms will use the ACORD form viewer, also new in this release. Forms with an indicate they were added because of requests in the Product Enhancement
REPORT ON THE 2017 SALARY SURVEY
 REPORT ON THE 2017 SALARY SURVEY BOARD OF CANADIAN REGISTERED SAFETY PROFESSIONALS CONSEIL CANADIEN DES PROFESSIONNELS EN SÉCURITÉ AGRÉÉS Prepared by: December 2017 TABLE OF CONTENTS 1. OVERVIEW... 1 2.
Utility Tax Guide
 2015-2016 Depend on our people. Count on our advice. SM Member - American Institute of Certified Public Accountants UTILITY TAX GUIDE 2015-2016 Olsen Thielen & Co., Ltd. Certified Public Accountants &
TABLE OF CONTENTS INTRODUCTION... 1
 TABLE OF CONTENTS INTRODUCTION... GENERAL WORKFORCE TRENDS... 3 General Workforce Trends and Comparisons Overview... 5 State Government Employees to State Population... 6 State Government Full-Time Equivalent
FULL-TIME PAID POSITIONS ONLY
 ALL LOCAL ARTS AGENCIES ALL LOCAL ARTS AGENCIES PUBLIC ART Staff members who report that their primary role or responsibility most closely matches the Public Art category are typically involved in the
HSA BANK HEALTH & WEALTH INDEX SM. HSA-Based Plans Drive Engagement Among Consumers
 HSA BANK HEALTH & WEALTH INDEX SM HSA-Based Plans Drive Engagement Among Consumers 2018 TABLE OF CONTENTS Introduction... 1 Overview... 1 Outcomes... 2 Key Findings... 7 1: Consumers can improve their
36 Million Without Health Insurance in 2014; Decreases in Uninsurance Between 2013 and 2014 Varied by State
 36 Million Without Health Insurance in 2014; Decreases in Uninsurance Between 2013 and 2014 Varied by State An estimated 36 million people in the United States had no health insurance in 2014, approximately
TABLE OF CONTENTS INTRODUCTION... 1
 TABLE OF CONTENTS INTRODUCTION... GENERAL WORKFORCE TRENDS... 3 General Workforce Trends and Comparisons Overview... 5 State Government Employees to State Population... 6 State Government Full-Time Equivalent
Clarity Tax Rate and WRS Rate Changes 2018
 Clarity Tax Rate and WRS Rate Changes 2018 Clarity Tax Rate and WRS Rate Changes 2018 Table of Contents Federal Tax Rates... 2 Step 1 Enter Changes for Social Security Limits... 3 Step 2 Enter Changes
CAH Financial Indicators Report: Summary of Indicator Medians by State
 Flex Monitoring Team Data Summary Report No. 26: CAH Financial Indicators Report: Summary of Indicator Medians by State March 2018 The Flex Monitoring Team is a consortium of the Rural Health Research
ima The Association of Accountants and Financial Professionals in Business
 ima The Association of Accountants and Financial Professionals in Business IMA United Arab Emirates Salary Survey for 2016 IMA United Arab Emirates Salary Survey for 2016 About IMA IMA, the association
2017 Compensation and Benefits Survey - Final Report
 2017 Compensation and Benefits Survey - Final Report Prepared For: Alberta Professional Planners Institute Prepared By: Bramm Research Inc. Better Information. Better Solutions www.brammresearch.com May
W A G E A N D B E N E F I T S R E P O R T
 W A G E A N D R E P O R T 2 0 0 8 2 0 0 9 W A G E R E P O R T 2 0 0 8 2 0 0 9 Benefits By Zones: Section 1-A............. 4 Benefit Demographics................... 5 Zone 1......................................
THRIVENT HEALTH PRODUCT PORTFOLIO
 2018 THRIVENT HEALTH PRODUCT PORTFOLIO Welcome to LeClair Group. We are pleased to be Thrivent s preferred third-party brokerage for health insurance products, giving Thrivent FRs the opportunity to bring
To Compete, Indiana Must be Aggressive
 To Compete, Indiana Must be Aggressive Adjustment to Venture Capital Tax Credit Program Could Lead to Big Results: Transferable Tax Credits Many states have recognized and are tracking the beneficial impact
Laying the Groundwork for Growth and Engagement: Trends and Insights from the 2015 Research Study
 Laying the Groundwork for Growth and Engagement: Trends and Insights from the 2015 Research Study Research Goals Understand why some members join while others do not. Identify member needs, interests and
2018 Operating Plan and Budget
 2018 Operating Plan and Budget Presented to Governing Council September 2017 Page 1 Table of Contents Page 3 Page 5 Page 11 Page 14 Page 16 Page 18 Page 23 Page 26 Page 29 Page 32 Page 35 Page 38 Page
Poll Positions: Americans Views on Employee Benefits. Results from the Council s National Poll, November 5-9, 2017
 Poll Positions: Americans Views on Employee Benefits Results from the Council s National Poll, November 5-9, 2017 Methodology Public Opinion Strategies conducted a survey of N=800 registered voters for
About this report Executive summary The Retail Team Salaries Top Level Manager salary... 5
 Salaries 06 Contents About this report... Executive summary... 3 The Retail Team... 4 Salaries... 5 Top Level salary... 5 Performance related bonuses for Top Level s... 5 Salary tables... 6 Impact of the
MEMO #4. Strategies for Structuring. Pensions ns and Benefits USA. Caution! Business reimbursements must be included on Form W-2 as taxable income
 MEMO #4 Pensions ns and Benefits USA Strategies for Structuring Ministerial Compensationn Caution! Business reimbursements must be included on Form W-2 as taxable income unless s they are paid through
AHP SALARY REPORT C A N A D A,
 AHP SALARY REPORT CANADA, 2018 TABLE OF CONTENTS EXECUTIVE SUMMARY... 3 INTRODUCTION... 4 METHODOLOGY... 4 RESPONDENT PROFILE... 5 ANNUAL SALARY... 10 COMPENSATION AND BENEFITS... 18 EMPLOYEE PERCEPTIONS...
State Budget Cuts Presentation to the Pennsylvania Senate Government Management & Cost Study Commission March 22,2010
 State Budget Cuts Presentation to the Pennsylvania Senate Government Management & Cost Study Commission March 22,2010 Luke Martel Fiscal Affairs Program Overview The state revenue nightmare continues.
2017 Number of Contracts. Weighted by Enrollment
 Fact Sheet - 2019 Part C and D Star Ratings Note: The information included in this Fact Sheet is based on the 2019 Star Ratings published on Medicare Plan Finder (MPF) on October 10, 2018. For details
About the Wisconsin Policy Forum. Preface and Acknowledgments
 About the Wisconsin Policy Forum The Wisconsin Policy Forum was created on January 1, 2018, by the merger of the Milwaukee-based Public Policy Forum and the Madison-based Wisconsin Taxpayers Alliance.
Financing Unemployment Benefits in Today s Tough Economic Times
 Financing Unemployment Benefits in Today s Tough Economic Times Maurice Emsellem 7 th Annual Workers Voice State Legislative Issues Conference July 19, 2003. Today s Funding Situation The Good, the Bad
EMPLOYEE BENEFITS AND SERVICES
 Learning Objectives: LESSON: 28 EMPLOYEE BENEFITS AND SERVICES 1. To know the various types of Employee Benefits. 2. To know the categories of Fringe Benefits. 3. To know about the various kinds of services
Number of Ministers 2,895 2,870 2,758 Average Salary $56,286 $56,423 $56,311
 October 2015 To: Conference Ministers of the United Church of Christ Dear Friends: Enclosed is our salary study for 2015 for ordained ministers whose salary was reported to the Pension Boards. This report
Life Insurance (core): Basic and additional life insurance coverage is provided by SPPS in the amount of $50,000 coverage.
: Basic and additional life insurance coverage is provided by SPPS in the amount of $50,000 coverage.") Summary of Benefits Cafeteria Plan Teachers 2019 (Information as of 01/01/19) Welcome to Saint Paul Public Schools. At 30 days of employment, you will be eligible to participate in Choices the benefit
Summary of Benefits Cafeteria Plan Teachers 2019 (Information as of 01/01/19) Welcome to Saint Paul Public Schools. At 30 days of employment, you will be eligible to participate in Choices the benefit
Key to Profitability
 Key to Profitability Understanding Indirect Cost Allocation Rates Sam Davidson President, GovConConsulting2013, LLC govconconsulting2013@gmail.com/703-303-2701 Do you REALLY know what your products or
ACORD Forms in ebixasp (03/2004)
") ACORD Forms in ebixasp (03/2004) Form number Form Name Edition Date 1 Property Loss Notice 2002/1 2 Automobile Loss Notice 2002/1 3 General Liability Notice of Occurrence/Claim 2002/1 4 Workers Compensation
ACORD Forms in ebixasp (03/2004) Form number Form Name Edition Date 1 Property Loss Notice 2002/1 2 Automobile Loss Notice 2002/1 3 General Liability Notice of Occurrence/Claim 2002/1 4 Workers Compensation
Gender Pay Gap Report 2017
 Gender Pay Gap Report 2017 Pay And The Bonus Gap Pay difference between men and women HOURLY PAY BONUS PAID Mean * 14.1% 29.1% Median * 5.3% 48.8% Fig. 1. The table above shows our overall mean and median
October 25, 2018 Pattie Bradley Senior Research Economist Center for Economic Development and Business Research
 October 25, 2018 Pattie Bradley Senior Research Economist Center for Economic Development and Business Research Kansas Economic Trends Per Capita Personal Income Inflation Labor Force Unemployment Participation
Installment Loans CHARTS. No cap other than unconscionability:
 NCLC NATIONAL CONSUMER LAW CENTER Installment Loans WILL STATES PROTECT BORROWERS FROM A NEW WAVE OF PREDATORY LENDING? Copyright 2015, National Consumer Law Center, Inc. CHARTS CHART 1 Full APRs Allowed
The State of Employee Benefits: Findings From the 2018 Health and Workplace Benefits Survey
 January 10, 2019 No. 470 The State of Employee Benefits: Findings From the 2018 Health and Workplace Benefits Survey By Lisa Greenwald, Greenwald & Associates, and Paul Fronstin, Ph.D., Employee Benefit