Slovakia in Figures
|
|
|
- Rafe Holmes
- 6 years ago
- Views:
Transcription


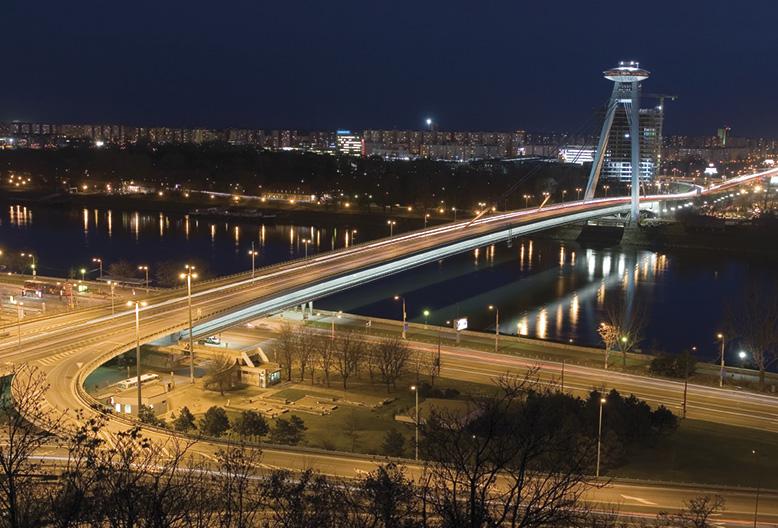


1 Slovakia in Figures Developed Infrastructure Productive and Modern Industry Beautiful Nature Petržalka in - The most dense urban area in Central Europe Kia in Slovakia - State-of-the art production facility Tatras - View from Štrbské pleso The Best Deal in the Eurozone = Slovakia The Largest Economy in the World GEO BIH MDA GDP in 2012: EU: 12.9 trillion USA: 11.8 trillion MNE AZE MKD RUS ARM SRB ALB UKR The Council of Europe pop: 820 mil. 47 countries European Economic Area pop: 500 mil. EU Customs Union European Union BUL Eurozone pop: 330 mil. 17 countries IRL CYP AND ROU UK European Free Trade Association AUT BEL EST FIN FRA GER GRE ITA NED POR DEN SMR LIE ISL LUX SUI CZE TUR MLT HUN CRO NOR SVK SLO ESP MON POL Schengen Area VAT Population: 5.4 mil. Unemployment: 14,5% Avg. monthly salary: 826 Avg. labor cost: 1,200 Currency: Euro ( ) SLOVAKIA SWE Agreement with EU to mint Euros LAT LTU SLOVAKIA Eurozone countries Euro adopted unilaterally ISBN The fastest desktop Internet; the 10th fastest mobile Internet - excellent IT infrastructure The most productive labor force in OECD - the highest return on labor investment The lowest labor cost in Eurozone Achieve outstanding results. We help companies become and stay leaders in their markets. Tel.: +(421) , Fax: +(421) , info@ecenter.net 19 Years in Slovakia 20 Percentage of Slovakia s GDP produced by AmCham members 320 Number of members 100,000 Number of employees in AmCham membership 15,500,000,000 Turnover in EUR of our top 100 companies Crowne C ro rown wne e Plaza, H Hodžovo námestie , Slovak Republic T T:: ((+421-2) E: of ce@amcham.sk E: W W: PROVIDING FULL SERVICE LEGAL ADVICE IN SLOVAKIA AND ACROSS THE GLOBE Advokátska kancelária Squire Sanders s.r.o. Zochova 5, Office in 19 Countries squiresanders.com 2013, ECENTER and The American Chamber of Commerce in the Slovak Republic, All Rights Reserved
 Košice 430 000 70 000 The Largest Cities in Slovakia (population) 85 000")

 Hungarians 9% Slovaks 81% Total Area: 49,000 sq km / 18,933 sq mi Slightly larger than Denmark(43,000 sq km), Netherlands (42,000 sq")


 Prime Minister Róbert Fico (2012 - spring 2016) Smer-SD Type: Parliamentary")
 Independence: The Slovak Republic was established January 1, 1993 MOODY S&P FITCH (former Czechoslovak")
, Prime Minister (head of government), PL A2 A - A - cabinet.")
[55%]; KDH (16); OLaNO (16);")

2 Population 5.4 mil. (Similar to Denmark, Finland, Singapore, Minnesota, or New Zealand) Košice The Largest Cities in Slovakia (population) Martin Poprad Spišská n. Ves Prievidza Košice Michalovce Ukraine B Nové Zámky Komárno Zvolen Other 7% Rusyns 0.6% Czechs 0.6% Ethnicity 2 Literacy: 99%. Roma* 2% Life Expectancy: 80 yrs. females; 72 yrs. males. (2011) Hungarians 9% Slovaks 81% Total Area: 49,000 sq km / 18,933 sq mi Slightly larger than Denmark(43,000 sq km), Netherlands (42,000 sq km), or Switzerland (41,000 sq km); slightly smaller than Costa Rica (51,000 sq km). *Unofficial estimates place the Roma population between 6%-10%. Source: Slovakia census 2011 No religion 13,4% Not specified 10.6% Evangelical Methodist 0.2% Jehovah's Witnesses 0.3% Orthodox 0.9% Reformed Christian 1.8% Greek Catholic 3.8% Evangelical of the Augsburg Confession 5.9% Religions Roman Catholic 62% Politics & Ratings Government The 2nd highest rating in V4 region V4 - Visegrad countries:,, and Slovakia President Ivan Gašparovič ( ; spring 2014) Prime Minister Róbert Fico ( spring 2016) Smer-SD Type: Parliamentary democracy. Countries Ratings (Oct 1, 2013) Independence: The Slovak Republic was established January 1, 1993 MOODY S&P FITCH (former Czechoslovak Republic established 1918). SK A2 A A+ Branches: CZ A1 AA- A+ Executive - President (head of state), Prime Minister (head of government), PL A2 A - A - cabinet. HU BA1 BB BB+ Legislative - National Council of the Slovak Republic (150 seats). Judicial - Supreme Court, Constitutional Court. Highest rating Source: Slovenská Sporiteľňa, 2013 Political parties: 150 parliamentary seats: Smer-SD (83)[55%]; KDH (16); OLaNO (16); Most-Hid (13); SDKU-DS (11); SaS (11) Next parliamentary elections: 2016 Suffrage: Universal at 18 years. Administrative divisions: 8 administrative regions, 79 districts. Economy, R&D and Knowledge Centers High Quality Labor: a hub for ICT and shared service centers Main Slovak Academic and Research Clusters Higher end services Page 2 [19 000], (9.8%) [74 000], (6.2%) [10 000], (11.1%) [23 000], (14%) [19 000], (12.6%) Zvolen [18 000], (19.5%) Poprad Lower end production [12 000], (20.1%) Košice [29 000], (18.7%) Ukraine Top 8 ICT companies: Employees At The Year End # Company IBM AT&T n/a n/a 3 T-systems Dell HP n/a 6 Accenture Lenovo First Data n/a n/a [number of students at universities and colleges] (unemployment in regions) Total Total nunber of college and university students Y/Y Growth 15% 14% 17% n/a Source: Slovak Statistics Office, 2013 Source: TREND, 2013
 Slovakia 2007 2008 2009 2010 2011 2012 2013 2014 Source: OECD, 2013 Estimates Slovak Republic Korea Estonia United States OECD - Total Japan Euro")
3 Labor Productivity and Export/Import SLOVAKIA: The world leader in vehicles produced per capita Labor Productivity of the Total Economy (Index) Slovakia Source: OECD, 2013 Estimates Slovak Republic Korea Estonia United States OECD - Total Japan Euro area (15 countries) 1.04 Switzerland Export/Import by countries in 2012 # Export % Import % 1 21,3 16,4 2 14,1 Russia 11,5 3 8,1 10,6 4 7,2 South Korea 6,4 5 6,7 China 6 6 5,4 4,1 7 4,7 4,1 8 Russia 4,2 3,4 9 3,9 3,4 10 Netherland 2,3 2,3 Others 22,33 Others 31,8 Source: Ministry of Economy, August 2013 Year Import (mil. ) Export (mil. ) Trade Balance Change Source: Ministry of Economy, August 2013 Labor Market The most productive and the lowest cost labor in Eurozone Unemployment rate and number of unemployed people in regions (June 2013) 12.6% = % = % = % = Košice Ukraine 9.8% = % = % = % = ppl National Holidays: 15 days lowest highest Source: Central Office of Labour, Social Affairs and Family Labor Cost Structure (simplified) Employee Employer Social Security 9,40% 25,20% Healthcare Insurance 4,00% 10,00% The fees are derived from employees gross salaries Slovak labor is the most productive in the Eurozone. Labor costs are the lowest. Skilled workers are readily available. Labor laws allow more flexibility for employers than those in the other Eurozone countries. Ireland Netherlands Belgium Denmark Sweden Norway Slovakia offers the lowest labor cost in Eurozone (2012 in /hour) Slovakia 8.3 Estonia 8.4 Greece 14.9 Spain x Slovakia 3x Slovakia 4x Slovakia 5x Slovakia Source: EUROSTAT, April 2013; Selected countries only Logistics & ICT Infrastructure Modern and developed infrastructure Easily accessible from Western Europe - only 70km from Vienna, Prague 260km Page 3 Vienna 70km Budapest 50km Zvolen Krakow 100km Internet: Warsaw 450km Poprad Košice Existing highway Highway in construction Planned highway Expressway Planned expressway Main railway Airport Fastest desktop Internet in the world 10th fastest mobile Internet in the world source: Google, Inc., 2012 Kiev 815km Mobile service operators: Orange, T-Mobile and O2 Mobile Network coverage: Orange: 99.6% of population / 90% of the country Slovak Telekom: 99% of population O2: 96% of population Mobile Data Connection: Orange: 42.2 Mbps download / 5.8 upload (72% of population) FTTH (Fiber To The home) 100Mbps download / 100Mbps upload: available in 17 cities to 15.9% of population. Slovak Telekom: 42 Mbps download / 5.8 upload Internet optik: 80 Mbps download / 8 upload available in 22 cities to 368,000 households. O2: 14.4 Mbps download / 2 upload 100 Mbps download / 20 upload (pilot LTE technology) Various options of high-speed Internet are available through landlines and satellite operators. Source: Orange, Slovak Telekom, O2
4 Stable and Sustainable Economy Debt: Only 53.3% of GDP; Labor cost of producing $100 is only $29.6 Slovakia Netherlands Spain Cyprus Belgium Portugal Greece General Government Debt (% of GDP) Labor cost of producing $100 GDP in Source: EUROSTAT, Selected countries only Slovakia Estonia Portugal Slovenia Ireland Spain Greece Luxembourg Netherlands Norway Belgium Finland Denmark Sweden x Slovakia % $ 3x Slovakia USD Sources: GDP per hour worked: OECD. Labor cost per hour worked: Eurostat. Exchange rate USD/EUR used was the average of Calculations: ECENTER. All countries with data available are presented Top Slovak Companies Largest companies: 14,500 employees, 6.6 bil. in sales # Rank in TOP 200 # The Largest Nonfinancial Companies (Slovak Headquarter Location) Total sales (EUR 1,000) Change (%) Value added/ total sales (%) After - tax profit (EUR 000) Average number of employees / Volkswagen Slovakia, a.s., ,9 8,5 7, Automotive 2. Slovnaft, a.s., ,2 6,5 5, Petroleum ref. 3. Kia Motors, s.r.o., ,7 12,2 10, Automotive 4. Samsung Electronics Slovakia, s.r.o., Galanta ,7 5,6 9, Electronics 5. Slovenské elektrárne, a.s., ,9 19, Energy 6. U.S. Steel Košice, s.r.o., Košice ,4 16,6 15, Metallurgy 7. Slovenský plynárenský priemysel, a.s., ,5 11,8 17, Energy 8. PCA Slovakia, s.r.o., , ,8 n Automotive 9. Tesco Stores SR, a.s., ,4 n n n Retail 10. Západoslovenská energetika, a.s., ,5 24,3 26, Energy Source: Trend, Top 200, July 2013 The Largest Employers in Slovakia (Slovak Headquarter Location) Average number of employees Change (%) Increase (decrease) in number of employees Personal costs (EUR 1,000) Profit per employee (EUR) Sales per employee (EUR) / Železnice SR, , Slovenská pošta, a.s., , n n U.S. Steel Košice, s.r.o., Košice , Tesco Stores SR, a.s., , n n n Volkswagen Slovakia, a.s., , Železničná spoločnosť Cargo Slovakia, a.s., , Železničná spoločnosť Slovensko, a.s., , Slovenské elektrárne, a.s., , INA Skalica, s.r.o., Skalica , Kaufland Slovenská republika, v.o.s., , n n n Source: Trend, Top 200, July 2013 Sector Page 4
5 Economic Forecast 2013: GDP + 0.8%; Inflation + 1.6% Taxes, State Aid, Subsidies, and Support The tax system is compliant with the tax systems of the EU Corporate income tax: 23% (planned to decrease to 22%, since ) Capital Gains tax: 23% Withholding tax: Interest: 19%, Royalties: 19% Dividends: Not subject to tax VAT (Value Added Tax or Sales Tax): 20% - almost all products and services 10% - textbooks and most healthcare related products and services 0% - certain financial and insurance services Personal Income tax and Capital Gains tax: 19%. It is 25% when the tax base is over EUR 34, Foreign persons can be subject to Slovak taxation if they spend more than 183 days of the specific year in Slovakia. Excise tax: imposed on certain types of goods: mineral oils, liqueurs, beer, wine, tobacco products, electricity, coal and natural gas. Page 5 Indicator (Slovakia, if not mentioned otherwise) in Real GDP in current prices bil.eur Real GDP growth % GDP in the Czech republic (real growth) % GDP in (real growth) % GDP in Eurozone (real growth) % Household consumption real growth % Household consumption nominal growth % Average monthly salary growth % Average monthly salary real growth % Salaries as % of GDP % Average Nominal Monthly Salary Average Nominal Monthly Salary Growth ( 805 in 2012) % Private Sector ( 804 in 2012) % Public Sector ( 810 in 2012) % Labor Productivity % Unit labour cost % Employment: average growth % Unemployment rate (%) % Real disposable income growth % CPI Growth (Consumer Price Index - Inflation) % Harmonized Index Of Consumer Prices (HICP) % Account Balance (as a % of GDP) % Consumption of Public Administration (real growth) % Creation of Gross fixed capital (real growth) % Export /products and services/ (real growth) % Import /products and services/ (real growth) % International Trade Balance bil. EUR Exchange rate (Eur/USD) EUR/USD Euribor (3 month average) % Yield of Slovak 10 year bonds % Net Inflation (average) % Deflators Growth - GDP % Foreign Direct investment (net inflow to Slovakia - capital and reinvested profit) mil. USD Crude oil (average price) USD/bl Foreign Direct investment (net inflow to Slovakia / GDP) % Slovakia's bond Yield - 10 year (average) % Source: Ministry of Finance of the Slovak Republic, September 26, There are three Real Estate Property taxes: 1) land tax and 2) tax on apartments and non-residential premises within apartment buildings 3) tax on buildings. Tax on land is levied at 0.25% of the tax base which would be assessed by the municipality. Rates vary depending on the type of land and its location. Real Property tax: Tax on buildings - depending on the municipality, it is usually between Eur 0.03 to Eur 0.33 per sq. m. of the floor area. Real Estate tax: Transfer tax was abolished in 2005; Capital gains are taxable as regular income tax. VAT registration is obligatory for entities with revenues exceeding EUR within 12 consecutive months. There are special taxes imposed on certain assets (i.e. vehicle road tax). Some adjustments are expected to be introduced in Real 2011 Real 2012 Simple tax system; Available state aid The Largest State Aid Projects # Company/Project State Aid (Eur) Year 1 KIA Motors, s. r. o. (Project 1) 135,225, PCA Slovakia, s.r.o 120,543, Mobis Slovakia, s. r. o. 35,581, AU Optronics Slovakia 34,900, KIA Motors, s. r. o. (Project 2) 34,134, SONY SLOVAKIA, spol. s r.o. 31,381, Samsung Electronics Slovakia s.r.o. 29,438, Universal Media Corporation /Slovakia/ s.r.o. 21,038, KIA Motors, s. r. o. (Project 3) 15,070, Johnson Controls Lučenec, s. r. o. 13,333, Source: SARIO, Ministry of Finance of the Slovak Republic Stimulus laws: - Act no. 561/ Act no. 231/ Act no. 56/ Act no. 481/ Act no. 231/ Act no. 5/ Act no. 595/ Regional National Map ( ) Forecast State aid in regions: : 0% Western Slovakia: 40% Central Slovakia: 50% Eastern Slovakia: 50% (Percent value represents maximum level of state aid contribution per project in a specific region.)

6 PROVIDING FULL SERVICE LEGAL ADVICE IN SLOVAKIA AND ACROSS THE GLOBE Squire Sanders can provide your business with tailored solutions to all of your commercial legal needs. As one of the biggest law firms in the world, we provide legal advice across 140 jurisdictions and in more than 40 languages meaning we can be as global or as local as you need. Contact us to find out how we can help your business succeed. Julian Juhasz Partner T E julian.juhasz@squiresanders.com Tatiana Prokopová Partner T E tatiana.prokopova@squiresanders.com Jana Pagáčová Partner T E jana.pagacova@squiresanders.com 39 Office in 19 Countries squiresanders.com
Slovakia in Figures
 Slovakia in Figures 2012-13 Developed Infrastructure Productive and Modern Industry Beautiful Nature Petržalka in - The most dense urban area in Central Europe Kia in Slovakia - State-of-the art production
Slovakia in Figures
 Developed Infrastructure Productive and Modern Industry Beautiful Nature The 14 th out of 15 fully integrated EU countries The Council of Europe ALB ARM pop: 820 mil. 47 countries AZE BIH European Economic
MDA GEO MNE AZE. European. Union. pop: 500 mil. 27 countries BUL. ROU IRL CYP European Free Trade Association EST LTU SVK SLO POR.
 2015 Slovakia in Figures Developed Infrastructure Productive and Modern Industry Talented People Beautiful Nature and Towns Petržalka in Bratislava - The most dense urban area in Central Europe Kia in
Slovakia in Figures
 Slovakia in Figures 2013-14 Developed Infrastructure Productive and Modern Industry Beautiful Nature Petržalka rža žallkka ka in in B rraati tislav ssllavva - Th The he mo m most stt ddense e se en urban
Slovakia - The Best Deal in Europe MEMBER OF NATO (SINCE 2004) AND A FULLY INTEGRATED EUROPEAN COUNTRY (SINCE 2009) MDA. European.
 AND A FULLY INTEGRATED EUROPEAN COUNTRY (SINCE 2009) MDA. European.") 2018 Slovakia in Figures Developed Infrastructure Productive and Modern Industry Talented People Beautiful Nature Petržalka in Bratislava - The most dense urban area in Central Europe Automotive - State-of-the-art
2018 Slovakia in Figures Developed Infrastructure Productive and Modern Industry Talented People Beautiful Nature Petržalka in Bratislava - The most dense urban area in Central Europe Automotive - State-of-the-art
Slovakia in Figures 2010
 Slovakia in Figures 2010 The American Chamber of Commerce in the Slovak Republic One of the first 14 fully integrated EU countries MDA GEO BIH MNE MKD AZE RUS CRO SRB ALB UKR The Council of Europe European
Slovakia - The Best Deal in Europe MDA. European. Union. pop: 510 mil. 28 countries BUL CRO IRL CYP EST LTU SVK SLO POR
 2017 Slovakia in Figures Developed Infrastructure Productive and Modern Industry Talented People Beautiful Nature Petržalka in Bratislava - The most dense urban area in Central Europe Automotive - State-of-the-art
Pensions at a Glance: Europe and Central Asia
 Pensions at a Glance: Europe and Central Asia Edward Whitehouse Head of Pension-Policy Analysis Social Policy division OECD European Commission/ World Bank conference Reforming Pension Systems in Europe
State Involvement and Economic Growth
 State Involvement and Economic Growth (The Future of the European Economy: Over to the State, or to the Market?) 27th Economic Forum Krynica, Poland September 2017 Bas B. Bakker Senior Regional Resident
SEE macroeconomic outlook Recovery gains traction, fiscal discipline improving. Alen Kovac, Chief Economist EBC May 2016 Ljubljana
 SEE macroeconomic outlook Recovery gains traction, fiscal discipline improving Alen Kovac, Chief Economist EBC May 216 Ljubljana Real economy highlights Recent GDP track record reveals more favorable footprint
Plenary Meeting of the Sectoral Social Dialogue Sector on Professional Football
 BRUSSELS, 20 NOVEMBER 2014 Plenary Meeting of the Sectoral Social Dialogue Sector on Professional Football BRUSSELS, 20 NOVEMBER 2014 Welcome by the Chair 1 BRUSSELS, 20 NOVEMBER 2014 1. Adoption of agenda
Public Pension Spending Trends and Outlook in Emerging Europe. Benedict Clements Fiscal Affairs Department International Monetary Fund March 2013
 Public Pension Spending Trends and Outlook in Emerging Europe Benedict Clements Fiscal Affairs Department International Monetary Fund March 13 Plan of Presentation I. Trends and drivers of public pension
The Challenge of Public Pension Reform in Advanced and Emerging Economies
 The Challenge of Public Pension Reform in Advanced and Emerging Economies Mauricio Soto Fiscal Affairs Department International Monetary Fund January 212 The views expressed herein are those of the author
Revenue Statistics Tax revenue trends in the OECD
 Revenue Statistics 2017 Tax revenue trends in the OECD OECD 2017 The OECD freely authorises the use of this material for non-commercial purposes, provided that suitable acknowledgment of the source and
THE TAX SYSTEM IN BELGIUM COMPARED TO OTHER OECD COUNTRIES
 THE TAX SYSTEM IN BELGIUM COMPARED TO OTHER OECD COUNTRIES TOWARDS A WELL-BALANCED FUNDAMENTAL TAX REFORM IN BELGIUM Bert Brys, Ph.D. 14 October 2013 Senior Tax Economist Centre for Tax Policy and Administration
Business Friendly Slovakia. Slovak Ukrainian Forum, Košice April 20-23, 2015
 Business Friendly Slovakia Slovak Ukrainian Forum, Košice April 20-23, 2015 CONTENT OF THE PRESENTATION SARIO INTRODUCTION TO SLOVAKIA KEY SECTORS INVESTMENT AID SARIO BUSINESS EVENTS SARIO INVESTMENT
Regional Economic Issues in CESEE
 Regional Economic Issues in CESEE JVI Lecture, Vienna, February 8, 2017 Bas B. Bakker Senior Regional Resident Representative for Central and Eastern Europe Outlook for CESEE 2 Within CESEE dichotomy:
The Challenge of Public Pension Reform
 The Challenge of Public Pension Reform Baoping Shang Fiscal Affairs Department International Monetary Fund May 4, 212 This presentation represents the views of the author and should not be attributed to
Capital Access Index 2006 Gauging Entrepreneurial Access to Capital
 Capital Access Index 2006 Gauging Entrepreneurial Access to Capital Max = 10 9.0 Hong Kong 8.5 8.0 7.5 7.0 6.5 6.0 5.5 5.0 4.5 40 Source: Milken Institute United Kingdom U.S. India China Brazil Russia
Why Have Some CESEE Countries Done Better Than Others since Early Transition?
 Why Have Some CESEE Countries Done Better Than Others since Early Transition? IMF Macroeconomic Policy Seminar Vienna, June 13, 2018 Bas B. Bakker Senior Regional Resident Representative for Central, Eastern
COVERAGE OF PRIVATE PENSION SYSTEMS AND MAIN TRENDS IN THE PENSIONS INDUSTRY IN THE OECD
 COVERAGE OF PRIVATE PENSION SYSTEMS AND MAIN TRENDS IN THE PENSIONS INDUSTRY IN THE OECD Fafo Pension Forum Oslo, 16 November 2012 Stéphanie Payet OECD Financial Affairs Division Structure of the Presentation
Recovery at risk? - CEE external vulnerability and Poland Article IV preliminary conclusions
 Central, Eastern and Southeastern Europe (CESEE) Recovery at risk? - CEE external vulnerability and Poland Article IV preliminary conclusions CASE, Warsaw - May 27, 214 James Roaf Senior Resident Representative
education (captured by the school leaving age), household income (measured on a ten-point
, household income (measured on a ten-point") A Web-Appendix A.1 Information on data sources Individual level responses on benefit morale, tax morale, age, sex, marital status, children, education (captured by the school leaving age), household income
A Web-Appendix A.1 Information on data sources Individual level responses on benefit morale, tax morale, age, sex, marital status, children, education (captured by the school leaving age), household income
Slovak Competitiveness: Fundamentals, Indicators and Challenges
 Copyright rests with the author Slovak Competitiveness: Fundamentals, Indicators and Challenges Presentation by Mark De Broeck European Department, IMF Seminar Organized by the European Commission November
EMPLOYMENT RATE Employed/Working age population (15-64 years)
") 1 EMPLOYMENT RATE 1980-2003 Employed/Working age population (15-64 years 80 % Finland (Com 75 70 65 60 EU-15 Finland (Stat. Fin. 55 50 80 82 84 86 88 90 92 94 96 98 00 02 9.9.2002/SAK /TL Source: European
1 EMPLOYMENT RATE 1980-2003 Employed/Working age population (15-64 years 80 % Finland (Com 75 70 65 60 EU-15 Finland (Stat. Fin. 55 50 80 82 84 86 88 90 92 94 96 98 00 02 9.9.2002/SAK /TL Source: European
RESILIENCE IN A TIME OF HIGH DEBT
 RESILIENCE IN A TIME OF HIGH DEBT PRE-RELEASE OF THE SPECIAL CHAPTER OF THE OECD ECONOMIC OUTLOOK (To Be Released on 28th November at 11.00am CET) Paris, 23th November 2017 www.oecd.org/economy/economicoutlook.htm
Growth, competitiveness and jobs: priorities for the European Semester 2013 Presentation of J.M. Barroso,
 Growth, competitiveness and jobs: priorities for the European Semester 213 Presentation of J.M. Barroso, President of the European Commission, to the European Council of 14-1 March 213 Economic recovery
Slovak Republic. Investor Presentation March 2011
 Slovak Republic Investor Presentation March 2011 1 Agenda 1. Slovak Republic at a Glance 2. Low Indebtedness and Solid Macro Fundamentals 3. Public Finance Consolidation Strategy 4. Prudent Debt Management
Macroprudential indicators of the financial sector
 Macroprudential indicators of the financial sector June 8 Macroeconomic risk indicators... Manufacturing Purchasing Managers Index (PMI) in selected economies... Services Purchasing Managers Index (PMI)
MINIMUM WAGES ACROSS OECD COUNTRIES: BACK TO THE FUTURE?
 Paris, 20 October 2017 MINIMUM WAGES ACROSS OECD COUNTRIES: BACK TO THE FUTURE? Andrea Garnero Economist Employment, Labour and Social Affairs OECD A widespread (but heterogenous) wage setting institution
Can employment be increased only at the cost of more inequality?
 Can employment be increased only at the cost of more inequality? Engines for More and Better Jobs in Europe ZEW Conference, Mannheim April 2013 Torben M Andersen Aarhus University Policy questions How
Manufacturing in Slovak Republic. Machinery. Sami Humala & Petr Hornicky Finpro Czech Republic February Finpro 1
 Manufacturing in Slovak Republic Machinery Sami Humala & Petr Hornicky Finpro Czech Republic February 2011 20.2.2011 Finpro 1 Slovak Republic Introduction Quick facts: - Population 5.5 mio - Labour force
Current Challenges in Revenue Mobilization: Improving Tax Compliance. CEPAL Regional Tax Seminar March 10, 2015
 Current Challenges in Revenue Mobilization: Improving Tax Compliance CEPAL Regional Tax Seminar March 10, 2015 Outline Recent trends in tax compliance Understanding and addressing noncompliance The hard-to-tax
Corrigendum. Page 41, Table 1.A1.1. Details of pension reforms, September 2013-September 2015 : Columns on Portugal should read as follows:
 Pensions at a Glance: OECD and G Indicators DOI: http://dx.doi.org/.787/pension_glance-5-en ISBN 9789644636 (print) ISBN 97896444443 (PDF) OECD 5 Corrigendum Page 4, Table.A.. Details of pension reforms,
Insurance Markets in Figures
 Insurance Markets in Figures June 2018 Most countries experienced a positive premium growth in life and/or non-life insurance in 2017 Preliminary data for 2017 show an increase in life and/or non-life
Taxation trends in the European Union EU27 tax ratio at 39.8% of GDP in 2007 Steady decline in top personal and corporate income tax rates since 2000
 DG TAXUD STAT/09/92 22 June 2009 Taxation trends in the European Union EU27 tax ratio at 39.8% of GDP in 2007 Steady decline in top personal and corporate income tax rates since 2000 The overall tax-to-gdp
Income support for older persons in the Republic of Korea : a perspective of older persons
 ESCAP Regional Consultation Incheon, Republic of Korea Income support for older persons in the Republic of Korea : a perspective of older persons Soo-Wan Kim (Kangnam University) 1 I. Introduction This
REPUBLIC OF TURKEY PRIME MINISTRY
 REPUBLIC OF TURKEY PRIME MINISTRY Investment Support and Promotion Agency of Turkey (ISPAT) Investment Climate and Doing Business in Turkey Murat OZDEMIR Country Advisor Canada ozdemir.murat@invest.gov.tr
Stronger growth, but risks loom large
 OECD ECONOMIC OUTLOOK Stronger growth, but risks loom large Ángel Gurría OECD Secretary-General Álvaro S. Pereira OECD Chief Economist ad interim Paris, 3 May Global growth will be around 4% Investment
Market Insights MUTUAL AND COOPERATIVE INSURERS INTERNATIONAL COOPERATIVE AND MUTUAL INSURANCE FEDERATION
 Market Insights EUROPE 2011 THE EUROPEAN INSURANCE MARKET SHARE AS HELD BY MUTUAL AND COOPERATIVE INSURERS INTERNATIONAL COOPERATIVE AND MUTUAL INSURANCE FEDERATION N o 4/2013 Euopean Mutual Premiums and
Earnings related schemes: Design, options and experience. Edward Whitehouse
 Earnings related schemes: Design, options and experience Edward Whitehouse Retirement-income systems: goal Primary objective ensuring older people have a decent standard of living in retirement Two interpretations
NATIONAL COMMUNICATIONS FROM PARTIES INCLUDED IN ANNEX I TO THE CONVENTION
 UNITED NATIONS Distr. GENERAL FCCC/SBI/2002/3 3 April 2002 Original: ENGLISH SUBSIDIARY BODY FOR IMPLEMENTATION Sixteenth session Bonn, 10 14 June 2002 Item 3 (a) of the provisional agenda NATIONAL COMMUNICATIONS
FOREWORD. Slovak Republic
 FOREWORD A country's tax regime is always a key factor for any business considering moving into new markets. What is the corporate tax rate? Are there any incentives for overseas businesses? Are there
Chapter 8.C Agricultural Production Targeting
 Chapter 8.C Agricultural Production Targeting Zekarias Hussein, Robert A. McDougall, Badri Narayanan G., Iman Haqiqi 8.C.1 Background Agricultural production targeting is a procedure applied to certain
Macroprudential indicators of the financial sector
 Macroprudential indicators of the financial sector June 7 Macroeconomic risk indicators... Manufacturing Purchasing Managers Index (PMI) in selected economies... Services Purchasing Managers Index (PMI)
FDI drops 18% in 2017 as corporate restructurings decline
 FDI IN FIGURES April 2018 FDI drops 18% in 2017 as corporate restructurings decline Global FDI flows decreased by 18% to USD 1 411 billion in 2017 compared to 2016. In the fourth quarter of 2017, FDI flows
Macroprudential indicators of the financial sector
 Macroprudential indicators of the financial sector June 6 Macroeconomic risk indicators... Manufacturing Purchasing Managers Index (PMI) in selected economies... Services Purchasing Managers Index (PMI)
Entrepreneurship at a Glance 2018 Highlights
 Entrepreneurship at a Glance 218 Highlights OECD Entrepreneurship at a Glance Highlights 218 SDD 1 October 218 List of figures ENTREPRENEURSHIP AND BUSINESS STATISTICS DATABASES 218 UPDATE 2 1. New enterprise
Macroeconomic overview SEE and Macedonia
 Macroeconomic overview SEE and Macedonia Zoltan Arokszallasi Chief Analyst, Macro & FX/FI Research Erste Group Bank Erste Investors Breakfast, 29 September, Skopje 02. Oktober SEE shows mixed performance
October 2010 Euro area unemployment rate at 10.1% EU27 at 9.6%
 STAT//180 30 November 20 October 20 Euro area unemployment rate at.1% EU27 at 9.6% The euro area 1 (EA16) seasonally-adjusted 2 unemployment rate 3 was.1% in October 20, compared with.0% in September 4.
FOREWORD. Estonia. Services provided by member firms include:
 2016/17 FOREWORD A country's tax regime is always a key factor for any business considering moving into new markets. What is the corporate tax rate? Are there any incentives for overseas businesses? Are
EMPLOYMENT RATE IN EU-COUNTRIES 2000 Employed/Working age population (15-64 years)
") EMPLOYMENT RATE IN EU-COUNTRIES 2 Employed/Working age population (15-64 years EU-15 Denmark Netherlands Great Britain Sweden Portugal Finland Austria Germany Ireland Luxembourg France Belgium Greece Spain
EMPLOYMENT RATE IN EU-COUNTRIES 2 Employed/Working age population (15-64 years EU-15 Denmark Netherlands Great Britain Sweden Portugal Finland Austria Germany Ireland Luxembourg France Belgium Greece Spain
2018 TAX GUIDELINE. Poland.
 2018 TAX GUIDELINE Poland poland@accace.com www.accace.com www.accace.pl Contents General information about Poland 4 Legal forms of business 5 General rules on purchasing real estate by foreigners 5 Legal
Fiscal sustainability challenges in Romania
 Preliminary Draft For discussion only Fiscal sustainability challenges in Romania Bucharest, May 10, 2011 Ionut Dumitru Anca Paliu Agenda 1. Main fiscal sustainability challenges 2. Tax collection issues
January 2010 Euro area unemployment rate at 9.9% EU27 at 9.5%
 STAT//29 1 March 20 January 20 Euro area unemployment rate at 9.9% EU27 at 9.5% The euro area 1 (EA16) seasonally-adjusted 2 unemployment rate 3 was 9.9% in January 20, the same as in December 2009 4.
Burden of Taxation: International Comparisons
 Burden of Taxation: International Comparisons Standard Note: SN/EP/3235 Last updated: 15 October 2008 Author: Bryn Morgan Economic Policy & Statistics Section This note presents data comparing the national
Recovery and Challenges in Eastern Europe
 Recovery and Challenges in Eastern Europe OECD - 7th annual meeting of Senior Budget Officials from Central, Eastern and South-Eastern European countries (CESEE) Zagreb, Croatia, 3 June - 1 July 211 Franziska
LA SOSTENIBILITÀ E L ADEGUATEZZA DEI SISTEMI PENSIONISTICI NEI PAESI OCSE
 LA SOSTENIBILITÀ E L ADEGUATEZZA DEI SISTEMI PENSIONISTICI NEI PAESI OCSE Anna Cristina D ADDIO Social Policy Division, OECD http://www.oecd.org/els/social/pensions CONFERENZA FINALE del progetto IESS
Managing Public Wealth
 Managing Public Wealth Jason Harris IMF Fiscal Monitor October 218 November 218 Managing Public Wealth Overview I. The Public Sector Balance Sheet II. Why Does it Matter? III. Policy Implications Risk
The IMF, CESEE and Banking
 The IMF, CESEE and Banking 34 th BACEE Regional Banking Conference Budapest, April 1-11, 217 Bas B. Bakker Senior Regional Resident Representative for Central and Eastern Europe The IMF has had close involvement
No. 1. Key Economic Indicators. Bank Austria Economics & Market Analysis Austria
 No. 0 Key Economic Indicators Bank Austria Economics & Market Analysis Austria Key Economic Indicators Issue /0 Economic Forecasts for Austria Percentage change over previous year 009 00 0 0 GDP (real).9.9.0.8
Financial wealth of private households worldwide
 Economic Research Financial wealth of private households worldwide Munich, October 217 Recovery in turbulent times Assets and liabilities of private households worldwide in EUR trillion and annualrate
ECONOMIC POLICY CHALLENGES FOR DENMARK FROM AN INTERNATIONAL PERSPECTIVE
 ECONOMIC POLICY CHALLENGES FOR DENMARK FROM AN INTERNATIONAL PERSPECTIVE Ludger Schuknecht OECD Deputy Secretary General Danish Economic Society Copenhagen 15 January, 219 http://www.oecd.org/eco/surveys/economic-survey-denmark.htm
Outlook Overview: OECD Countries UN LINK Conference, Bangkok October, 2009
 Outlook Overview: OECD Countries UN LINK Conference, Bangkok 26 28 October, 2009 Dave Turner OECD, Economics Department OECD Outlook: Outline 1. Recovery underway but will probably be slow 2. Risks and
Economic Stimulus Packages and Steel: A Summary
 Economic Stimulus Packages and Steel: A Summary Steel Committee Meeting 8-9 June 2009 Sources of information on stimulus packages Questionnaire to Steel Committee members, full participants and observers
Ways to increase employment
 Ways to increase employment Iceland Luxembourg Spain Canada Italy Norway Denmark Germany Portugal Ireland Japan Belgium Switzerland Austria Slovenia United States New Zealand Finland France Netherlands
MIND THE CREDIT GAP. Spring 2015 Regional Economic Issues Report on Central, Eastern and Southeastern Europe (CESEE) recovery. repair.
 recovery. repair.") Spring 215 Regional Economic Issues Report on Central, Eastern and Southeastern Europe (CESEE) repair recovery MIND THE CREDIT GAP downturn expansion May, 215 Growth Divergence in 214 Quarterly GDP Growth,
Spring 215 Regional Economic Issues Report on Central, Eastern and Southeastern Europe (CESEE) repair recovery MIND THE CREDIT GAP downturn expansion May, 215 Growth Divergence in 214 Quarterly GDP Growth,
May 2009 Euro area external trade surplus 1.9 bn euro 6.8 bn euro deficit for EU27
 STAT/09/106 17 July 2009 May 2009 Euro area external trade surplus 1.9 6.8 deficit for EU27 The first estimate for the euro area 1 (EA16) trade balance with the rest of the world in May 2009 gave a 1.9
COMMISSION OF THE EUROPEAN COMMUNITIES COMMISSION STAFF WORKING DOCUMENT. Annexes to the
 COMMISSION OF THE EUROPEAN COMMUNITIES Brussels, 16.5.2006 SEC(2006) 579 COMMISSION STAFF WORKING DOCUMENT Annexes to the REPORT FROM THE COMMISSION TO THE COUNCIL, THE EUROPEAN PARLIAMENT AND THE EUROPEAN
No. 2. Key Economic Indicators. Bank Austria Economics & Market Analysis Austria
 No. 0 Key Economic Indicators Bank Austria Economics & Market Analysis Austria Key Economic Indicators Issue /0 Economic Forecasts for Austria Percentage change over previous year 00 0 0 0 GDP (real)..0
5th Capital Markets Day 21 September 2007, Bratislava
 5th Capital Markets Day, Bratislava Regina Ovesny-Straka, CEO, Slovenská sporiteľňa Disclaimer Cautionary note regarding forward-looking statements THE INFORMATION CONTAINED IN THIS DOCUMENT HAS NOT BEEN
DG TAXUD. STAT/11/100 1 July 2011
 DG TAXUD STAT/11/100 1 July 2011 Taxation trends in the European Union Recession drove EU27 overall tax revenue down to 38.4% of GDP in 2009 Half of the Member States hiked the standard rate of VAT since
Lithuania: in a wind of change. Robertas Dargis President of the Lithuanian Confederation of Industrialists
 Lithuania: in a wind of change Robertas Dargis President of the Lithuanian Confederation of Industrialists 2017 06 15 Lithuanian Confederation of Industrialists - the largest business organisation in Lithuania
axia Axia Economics Civil-service pension schemes Edward Whitehouse Civil-Service World Bank core course Washington DC, April 2016
 Public Disclosure Authorized Civil-Service Civil-service pension schemes Public Disclosure Authorized Edward Whitehouse Public Disclosure Authorized World Bank core course Washington DC, April 2016 axia
EFFICIENCY OF EDUCATION EXPENDITURE IN OECD COUNTRIES
 EFFICIENCY OF EDUCATION EXPENDITURE IN OECD COUNTRIES MIROSLAV HUŽVÁR, ZUZANA RIGOVÁ Matej Bel University in Banská Bystrica, Faculty of Economics, Department of Quantitative Methods and Information Systems,
PENSIONS IN OECD COUNTRIES: INDICATORS AND DEVELOPMENTS
 PENSIONS IN OECD COUNTRIES: INDICATORS AND DEVELOPMENTS Marius Lüske Directorate for Employment, Labour and Social Affairs, OECD Lisbon, 28.09.2018 Marius.LUSKE@oecd.org www.oecd.org/els OUTLINE Talk based
Challenges for tomorrow: the Greek economy and the health care sector
 1 Challenges for tomorrow: the Greek economy and the health care sector Nikos Vettas Professor, Athens University of Economics and Business General Director of IOBE www.iobe.gr vettas@iobe.gr, http://www.aueb.gr/users/vettas
FOREWORD. Slovak Republic
 2016/17 FOREWORD A country's tax regime is always a key factor for any business considering moving into new markets. What is the corporate tax rate? Are there any incentives for overseas businesses? Are
Chapter 6 Macroeconomic Data
 Chapter 6 Macroeconomic Data Angel H. Aguiar and Betina V. Dimaranan 6.1 Uses of Macroeconomic Data During the Data Base construction process, macroeconomic data are used in various stages. The primary
Central, Eastern, and Southeastern Europe: The Past and Future of Convergence
 Central, Eastern, and Southeastern Europe: The Past and Future of Convergence LSE SU Emerging Markets Forum London, March 1, 218 Bas B. Bakker Senior Regional Resident Representative for Central, Eastern
Promoting Industrialisation in SADC through Quality Infrastructure SADC Industrialisation Week 2017
 Promoting Industrialisation in SADC through Quality Infrastructure SADC Industrialisation Week 2017 Iza Lejárraga, Head of Investment Policy Linkages Unit Directorate for Financial and Enterprise Affairs
IMPROVING TAX COMPLIANCE. 6th IMF-Japan High-Level Tax Conference For Asian Countries Tokyo; April 7, 2015
 IMPROVING TAX COMPLIANCE 6th IMF-Japan High-Level Tax Conference For Asian Countries Tokyo; April 7, 2015 Outline Measurement and trends Some key methods and issues Managing compliance Supporting compliance
Economic outlook in the Western Balkans
 Economic outlook in the Western Balkans Holger Muent, Regional Head Western Balkans June 217 The Western Balkans convergence challenge: decades or centuries? FullconvergencewithEUlivingstandardscanrangefrom4yearsinanoptimisticscenariotomorethan2
No. 1. Key Economic Indicators. Bank Austria Economics & Market Analysis Austria
 No. 00 Key Economic Indicators Bank Austria Economics & Market Analysis Austria Key Economic Indicators Issue /00 Economic Forecasts for Austria Percentage change over previous year 008 009 00 0 GDP (real).0.8..4
Primary Health Care Needs-Based Resource Allocation through Financing of Health Regions
 Primary Health Care Needs-Based Resource Allocation through Financing of Health Regions 26th PCSI Conference 17 th September 2010 A Lourenço, A Bicó, S Olim, M Reis, A Ferreira www.acss.min-saude.pt Ref::ACSS\GGV\AOE
EMPLOYMENT RATE Employed/Working age population (15 64 years)
") EMPLOYMENT RATE 198 26 Employed/Working age population (15 64 years 8 % Finland 75 EU 15 EU 25 7 65 6 55 5 8 82 84 86 88 9 92 94 96 98 2 4** 6** 14.4.25/SAK /TL Source: European Commission 1 UNEMPLOYMENT
EMPLOYMENT RATE 198 26 Employed/Working age population (15 64 years 8 % Finland 75 EU 15 EU 25 7 65 6 55 5 8 82 84 86 88 9 92 94 96 98 2 4** 6** 14.4.25/SAK /TL Source: European Commission 1 UNEMPLOYMENT
January 2009 Euro area external trade deficit 10.5 bn euro 26.3 bn euro deficit for EU27
 STAT/09/40 23 March 2009 January 2009 Euro area external trade deficit 10.5 26.3 deficit for EU27 The first estimate for the euro area 1 (EA16) trade balance with the rest of the world in January 2009
Slovakia Country Profile
 Slovakia Country Profile EU Tax Centre July 2016 Key tax factors for efficient cross-border business and investment involving Slovakia EU Member State Double Tax Treaties Yes With: Australia Austria Belarus
GESUNDHEITLICHE VERSORGUNG
 GESUNDHEITLICHE VERSORGUNG UND SOZIALE ABSICHERUNG IM INTERNATIONALEN VERGLEICH Maria M. Hofmarcher-Holzhacker 3. Symposium: Migration: epidemiologische und medizinische Aspekte Wien, February 26, 20 http://www.healthsystemintelligence.eu
Plan: Reform Strategy - Bermuda Experience. Caribbean Conference on Health lhfinancing Initiatives
 National Health Plan: Evidence & Reform Strategy - Bermuda Experience Caribbean Conference on Health lhfinancing i Initiatives J Attride-Stirling, PhD Chief Executive Officer 23 rd November 2011 Overview
Library statistical spotlight
 /9/2 Library of the European Parliament 6 4 2 This document aims to provide a picture of the, in particular by looking at car production trends since 2, at the number of enterprises and the turnover they
EUROPA - Press Releases - Taxation trends in the European Union EU27 tax...of GDP in 2008 Steady decline in top corporate income tax rate since 2000
 DG TAXUD STAT/10/95 28 June 2010 Taxation trends in the European Union EU27 tax ratio fell to 39.3% of GDP in 2008 Steady decline in top corporate income tax rate since 2000 The overall tax-to-gdp ratio1
TAX REFORM TRENDS IN OECD COUNTRIES
 TAX REFORM TRENDS IN OECD COUNTRIES INTRODUCTION Over the last two decades almost all OECD countries have made major structural changes to their tax systems. In the case of the personal and corporate income
How to Get Back on the Fast Track?
 REGIONAL ECONOMIC ISSUES REPORT ON CENTRAL, EASTERN AND SOUTHEASTERN EUROPE How to Get Back on the Fast Track? MAY, 216 EUROPEAN DEPARTMENT Map of Central, Eastern, and South-Eastern Europe Baltics CEE
Macroeconomics Graphs. David L. Kelly. Department of Economics University of Miami Box Coral Gables, FL
 Macroeconomics Graphs David L. Kelly Department of Economics University of Miami Box 248126 Coral Gables, FL 33134 dkelly@miami.edu Current Version: Summer 213 I Introduction A US GDP/Unemployment 14 12
January 2005 Euro-zone external trade deficit 2.2 bn euro 14.0 bn euro deficit for EU25
 42/2005-23 March 2005 January 2005 Euro-zone external trade deficit 2.2 14.0 deficit for EU25 The first estimate for euro-zone 1 trade with the rest of the world in January 2005 was a 2.2 billion euro
The Norwegian Economy
 The Norwegian Economy NORINT0500 - Norwegian Life and Society Spring 2018 Hilde Karoline Midsem 19.03.2018 Outline of today s lecture 1. Some facts 2. Production, trade and the history of oil 3. The labor
December 2010 Euro area annual inflation up to 2.2% EU up to 2.6%
 STAT/11/9 14 January 2011 December 2010 Euro area annual inflation up to 2.2% EU up to 2.6% Euro area 1 annual inflation was 2.2% in December 2010 2, up from 1.9% in November. A year earlier the rate was
International Statistical Release
 International Statistical Release This release and additional tables of international statistics are available on efama s website (www.efama.org). wide Regulated Open-ended Fund Assets and Flows Trends
EU BUDGET AND NATIONAL BUDGETS
 DIRECTORATE GENERAL FOR INTERNAL POLICIES POLICY DEPARTMENT ON BUDGETARY AFFAIRS EU BUDGET AND NATIONAL BUDGETS 1999-2009 October 2010 INDEX Foreward 3 Table 1. EU and National budgets 1999-2009; EU-27