New Mexico Continues to Struggle: Las Cruces doing better
|
|
|
- Dwight Rich
- 5 years ago
- Views:
Transcription
1 New Mexico Continues to Struggle: Las Cruces doing better Christopher A. Erickson, Ph.D. Department of Economics and International Business College of Business New Mexico State University
2 Economic Recovery Business Cycles associated with financial crisis, on average, last twice as long as typical cycles Recovery from a financial crisis is also slow, as we are experiencing National recovery right on track
3 National Recovery Latest quarter saw a small raise in Real GDP of.1% Probably reflects harsh winter Employment was up 288,000 in April Unemployment was 6.3% Industrial production is up 2.5% compared to pre-recession
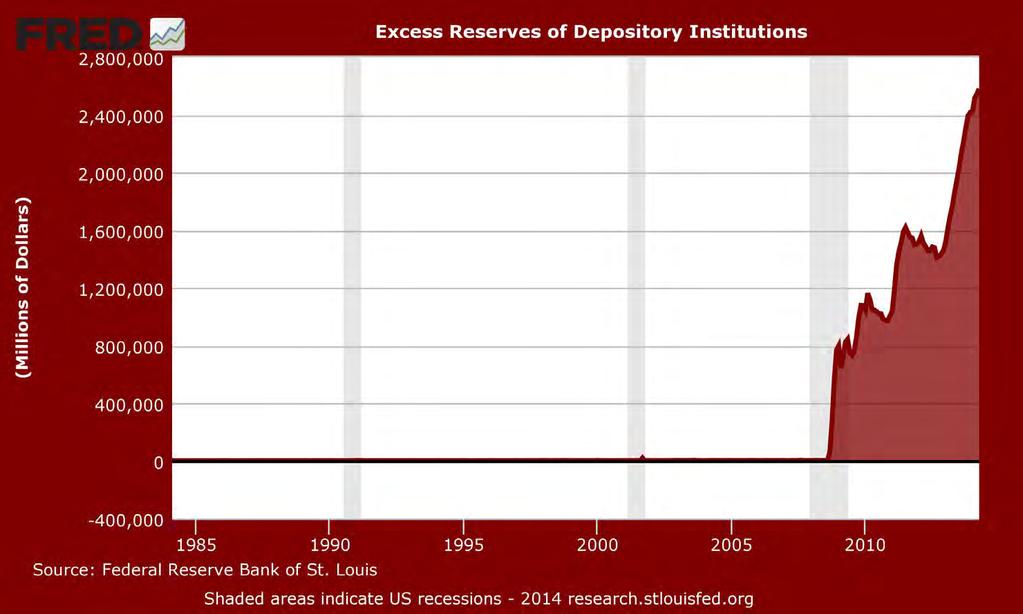
4 National Recovery There remains considerable slack in the economy Capacity utilization is a tepid 79.2 Total employment is still slightly below previous peak Excess reserves are $2.6 trillion
5 NM Recovery Recovery is shakier in NM Albuquerque is seeing problems in particular Las Cruces never really suffered from the deep recession experienced elsewhere Thanks to federal employment
6 Employment since the Recession December 2007 = Nov 2007 Apr 2008 Sep 2008 Feb 2009 Jul 2009 Dec 2009 May 2010 Oct 2010 United States New Mexico Albuqurque Las Cruces Mar 2011 Aug 2011 Jan 2012 Jun 2012 Nov 2012 Apr 2013 Sep 2013 Feb 2014
7 Employment Growth Since the Recession Las Cruces 1.6% -7.0% Albuqurque -4.6% New Mexico United States -0.3% -8.0% -7.0% -6.0% -5.0% -4.0% -3.0% -2.0% -1.0% 0.0% 1.0% 2.0% 3.0%

8 Employment Growth Last Twelve Months April 2013 to April 2014 Las Cruces 0.6% -0.7% Albuqurque New Mexico -0.2% United States 1.7% -1.0% -0.5% 0.0% 0.5% 1.0% 1.5% 2.0%
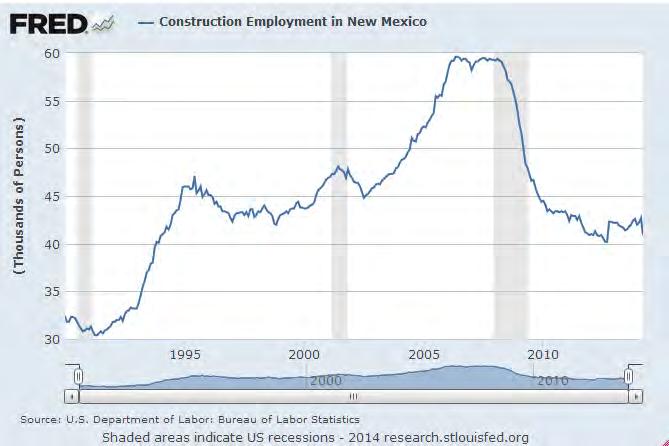
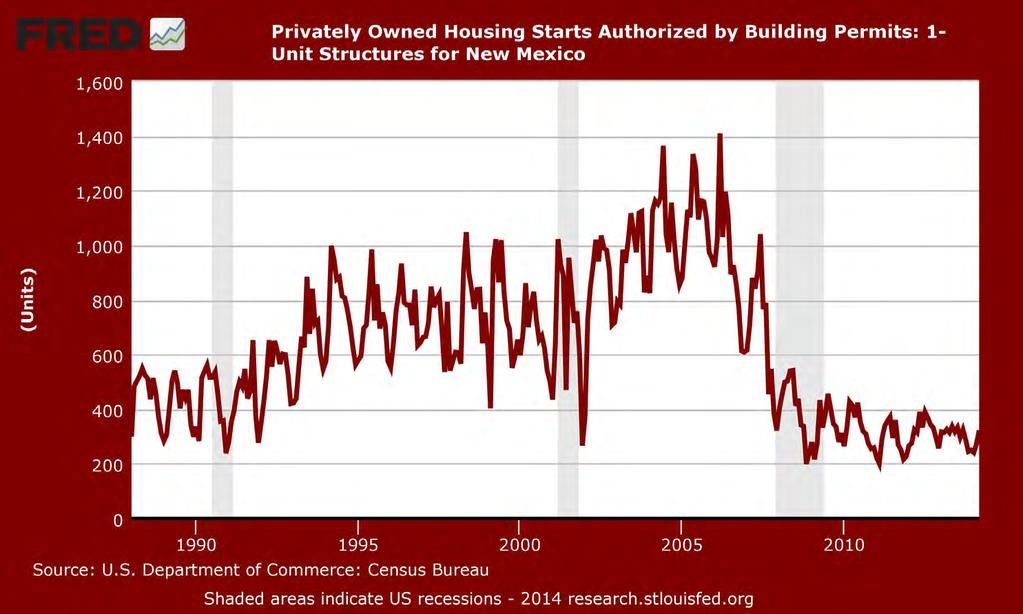
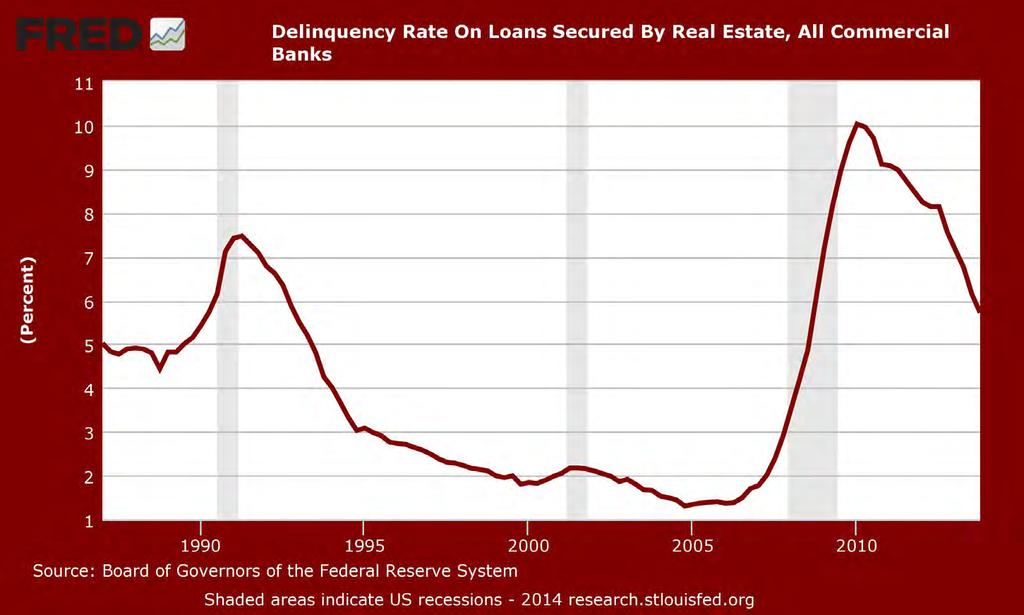
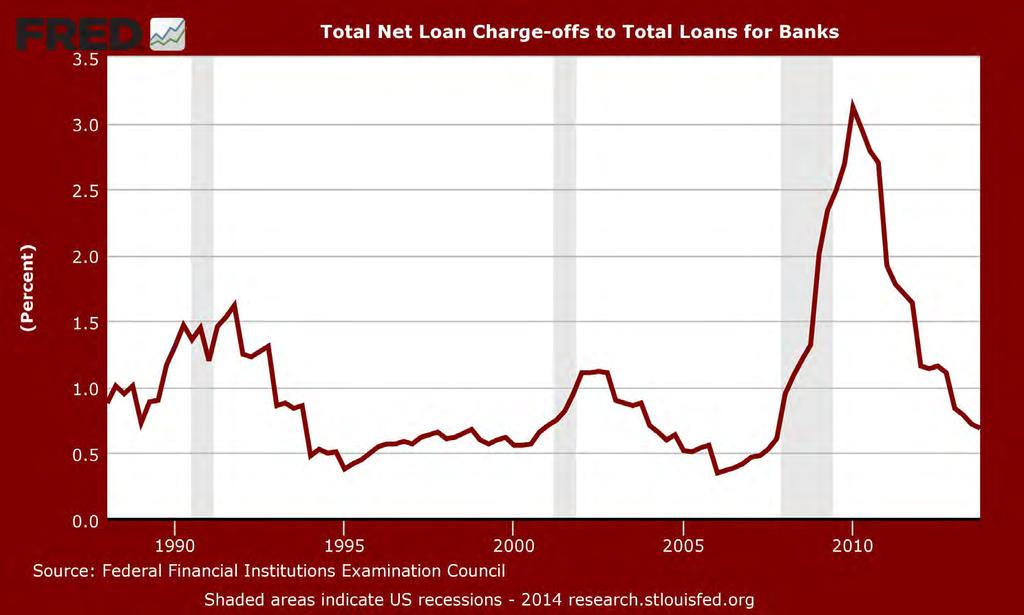
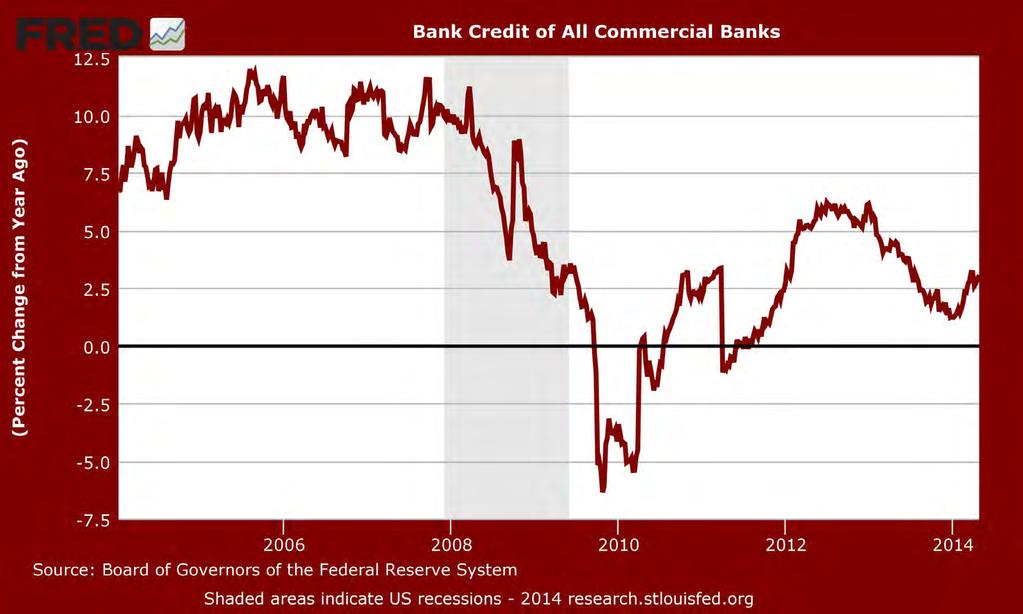
9 Construction and Real Estate Construction and real estate continues a weak sector The bursting of the housing bubble, of course, is what caused the recession Recovery is slow in coming
10
11 20.0% Changes in Housing Prices Year-over-Year 15.0% 10.0% 5.0% 0.0% -5.0% -10.0% LC NM USA

12 Decline in Housing Prices Since 2007 Q1-12.4% USA -11.8% NM -17.1% LC -18.0% -16.0% -14.0% -12.0% -10.0% -8.0% -6.0% -4.0% -2.0% 0.0%

13
14

15 United States: 1 in 1121

16 New Mexico: 1 in 1668

17 Dona Ana: 1 in 1852

18 Las Cruces 1 in 1458
19
20
21
22
23 Current New Mexico Regular Wage: $7.50 Minimum wage Tipped Wage: $2.13, but if tips fall short of the minimum wage, the employer has to make up the difference National Regular Wage: $7.25 Tipped Wage: $2.13
24 Minimum Wage Comunidades en Accion y de Fe (CAFé) is proposing an increase in the minimum wage within the borders of Las Cruces As of now, it would not apply to the county
25 Proposal Regular Wage: $10.10 effective Jan 1, 2017 Phase in: $8.40 Jan 1, 2015; $9.20 Jan 1, 2016 Indexed to inflation after starting Jan Tipped Wage: $6.06 effective Jan 1, 2017 Phase in: $3.36 Jan 1, 2015; $4.60 Jan 1, 2016 Indexed to inflation after starting Jan
26
27 Likely impact of proposed minimum wage Employment effect likely will be small High: 2% less growth over five years Low: No effect Small businesses that can t afford higher wages will lose market share Large business (Target, Walmart) will gain market share
28 Likely impact of proposed minimum wage Impact of minimum wage on the standard of living of the working poor also likely to be small Working poor will receive less in SNAP, EITC, etc. Reduced subsidy to businesses
29 Graduation Rate Public Schools Only 63% of high school students graduated in NM in 2011 NM ranked 3 rd from the bottom ahead only of Nevada (62%) and DC (59%) About in the middle for English learners; third from the bottom for economically disadvantaged
30 Public Schools 4-Year Graduation Rates 2012 Cohort Statewide 70.3% of high school students graduated in 4 years LCPS 66.8% of high school students graduated in 4 years
31 Public Schools Eighth grade reading standardized tests (2012) Reading: New Mexico ranked third from the bottom (ahead of Mississippi and DC) Math: New Mexico ranked fifth from the bottom
32 Comparison of Forecasts: Real GDP Organization Release Date CY2014 CY 2015 Conference Board 9-Apr Philadelphia Federal Reserve 14-Feb Congressional Budget Office 4-Feb Federal Open Market Committee 19-Mar to to 3.2 International Monetary Fund 21-Jan Organization for Economic Cooperation 1-Apr Average
33 Comparison of Forecasts: Inflation Organization Release Date CY2014 CY 2015 Conference Board 9-Apr-14 na na Philadelphia Federal Reserve 14-Feb Congressional Budget Office 4-Feb Federal Open Market Committee 19-Mar to to 2.0 International Monetary Fund 21-Jan Organization for Economic Cooperation 1-Apr Average
34 Questions Christopher A. Erickson, Ph.D. Department of Economics and International Business College of Business New Mexico State University
U.S. and New England Economic Conditions and Outlook
 U.S. and New England Economic Conditions and Outlook Yolanda Kodrzycki Senior Economist and Policy Advisor charts prepared by Ana Patricia Muñoz presented to New England Board of Higher Education conference
CBER Economic Indexes for Nevada and Southern Nevada
 CBER Economic Indexes for Nevada and Southern Nevada Published December 19, 2017 Stephen M. Miller, PhD, Director Nicolas Prada, M.A., Graduate Research Assistant Summary of CBER s Nevada Indexes Coincident
Department of Public Welfare (DPW)
") Department of Public Welfare (DPW) Office of Income Maintenance Electronic Benefits Transfer Card Risk Management Report Out-of-State Residency Review FISCAL YEAR 2014-2015 September 2014 (June, July and
Department of Public Welfare (DPW) Office of Income Maintenance Electronic Benefits Transfer Card Risk Management Report Out-of-State Residency Review FISCAL YEAR 2014-2015 September 2014 (June, July and
CBER Indexes for Nevada and Southern Nevada
 CBER Indexes for Nevada and Southern Nevada Published June 23, 2017 Stephen M. Miller, PhD, Director Nicolas Prada, Graduate Research Assistant Summary of CBER s Nevada Indexes Coincident Index (March)
GIMA Pulse Date of Report: 04/12/2017 a monthly snapshot of the UK Economy from
 GIMA Pulse Date of Report: 04/12/2017 a monthly snapshot of the UK Economy from www.barometeroftrade.com Summary Inflation has slowed after reaching a 5-year-high last month, largely due to the weak performance
CBER Economic Indexes for Nevada and Southern Nevada
 CBER Economic Indexes for Nevada and Southern Nevada Published November 14, 2018 Stephen M. Miller, PhD, Director Hasara Rathnasekara, Graduate Research Assistant Summary of CBER s Nevada Indexes Coincident
XML Publisher Balance Sheet Vision Operations (USA) Feb-02
 Feb-02") Page:1 Apr-01 May-01 Jun-01 Jul-01 ASSETS Current Assets Cash and Short Term Investments 15,862,304 51,998,607 9,198,226 Accounts Receivable - Net of Allowance 2,560,786
Page:1 Apr-01 May-01 Jun-01 Jul-01 ASSETS Current Assets Cash and Short Term Investments 15,862,304 51,998,607 9,198,226 Accounts Receivable - Net of Allowance 2,560,786
CBER Indexes for Nevada and Southern Nevada
 CBER Indexes for Nevada and Southern Nevada Published March 24, 2016 Stephen M. Miller, PhD, Director Jinju Lee, Economic Analyst Summary of CBER s Nevada Indexes Coincident Index Leading Index Mo. to
If the Economy s so Bad, Why Is the Unemployment Rate so Low?
 If the Economy s so Bad, Why Is the Unemployment Rate so Low? Testimony to the Joint Economic Committee March 7, 2008 Rebecca M. Blank University of Michigan and Brookings Institution Rebecca Blank is
Spheria Australian Smaller Companies Fund
 29-Jun-18 $ 2.7686 $ 2.7603 $ 2.7520 28-Jun-18 $ 2.7764 $ 2.7681 $ 2.7598 27-Jun-18 $ 2.7804 $ 2.7721 $ 2.7638 26-Jun-18 $ 2.7857 $ 2.7774 $ 2.7690 25-Jun-18 $ 2.7931 $ 2.7848 $ 2.7764 22-Jun-18 $ 2.7771
Business & Financial Services December 2017
 Business & Financial Services December 217 Completed Procurement Transactions by Month 2 4 175 15 125 1 75 5 2 1 Business Days to Complete 25 Jan Feb Mar Apr May Jun Jul Aug Sep Oct Nov Dec 217 Procurement
Key IRS Interest Rates After PPA
 Key IRS Rates - After PPA - thru 2011 Page 1 of 10 Key IRS Interest Rates After PPA (updated upon release of figures in IRS Notice usually by the end of the first full business week of the month) Below
Executive Summary. July 17, 2015
 Executive Summary July 17, 2015 The Revenue Estimating Conference adopted interest rates for use in the state budgeting process. The adopted interest rates take into consideration current benchmark rates
After the Rate Increase, What Then?
 After the Rate Increase, What Then? Robert Eisenbeis, Ph.D. Vice Chairman & Chief Monetary Economist Bob.Eisenbeis@Cumber.com What the FOMC Did At Dec Meeting The Fed made the first step towards normalization
Consumer Price Index (Base year 2014) Consumer Price Index
 Consumer Price Index") Consumer Price Index December 2017 (Base year 2014) Consumer Price Index 1 Release Date: January 2018 Detailed by: Expenditure groups Household welfare levels Household type Regions Briefing This publication
Consumer Price Index December 2017 (Base year 2014) Consumer Price Index 1 Release Date: January 2018 Detailed by: Expenditure groups Household welfare levels Household type Regions Briefing This publication
Consumer Price Index (Base year 2014) Consumer Price Index
 Consumer Price Index") Consumer Price Index December 2016 (Base year 2014) Consumer Price Index 1 Release Date: January 2017 Detailed by: Expenditure groups Household welfare levels Household type Regions Briefing This publication
Consumer Price Index December 2016 (Base year 2014) Consumer Price Index 1 Release Date: January 2017 Detailed by: Expenditure groups Household welfare levels Household type Regions Briefing This publication
Business Cycle Index July 2010
 Business Cycle Index July 2010 Bureau of Trade and Economic Indices, Ministry of Commerce, Tel. 0 2507 5805, Fax. 0 2507 5806, www.price.moc.go.th Thailand economic still expansion. Medium-run Leading
Research & Policy Brief Number 4 December 2009
 Institute for Research on Labor and Employment Research & Policy Brief Number 4 December 2009 California Crisis: A Portrait of Unemployed Workers By Lauren D. Appelbaum, Ph.D. Research Director The United
Capturing equity gains whilst protecting portfolios
 Capturing equity gains whilst protecting portfolios Edward Park Q2 2018 MSCI North America Total Return in USD (2017 Discrete Calendar Months) 4.00% 3.50% 3.00% 2.50% 2.00% 1.50% 1.00% 0% 0.00% Jan-17
How Long Will Wage Restraint Persist?
 How Long Will Wage Restraint Persist? Prospects For Wage Inflation in Advanced Economies Jacob Funk Kirkegaard Senior Fellow 4/4/2018 Peterson Institute for International Economics 1750 Massachusetts Ave.,
CBER Economic Indexes for Nevada and Southern Nevada
 CBER Economic Indexes for Nevada and Southern Nevada Published February 9, 2018 Stephen M. Miller, PhD, Director Marshall Krakauer, Graduate Research Assistant Summary of CBER s Nevada Indexes Coincident
Slow and Low: The Economic and Financial Outlook
 Southern Legislative Conference 7th Annual Meeting Slow and Low: The Economic and Financial Outlook July, William R. Emmons Federal Reserve Bank of St. Louis William.R.Emmons@stls.frb.org These comments
The next recession will not be. The Great Recession. Damon Runberg, Economist Oregon Employment Department
 The next recession will not be The Great Recession Damon Runberg, Economist Oregon Employment Department Why the fears? Simplified Business Cycle Peak 2 consecutive quarters of GDP declines Wages Rise
Isle Of Wight half year business confidence report
 half year business confidence report half year report contents new company registrations closed companies (dissolved) net company growth uk company share director age director gender naming trends sic
11 May Report.xls Office of Budget & Fiscal Planning
 Education and General Fund Actual Revenues and s by Month MTD YTD Change Revenue Jul Aug Sep Oct Nov Dec Jan Feb Mar Apr May Jun Per 14 Total over FY06 Enrollment Fees $ 8,211 $ 219 $ 41,952 ($ 818) $
Key IRS Interest Rates After PPA
 Key IRS Interest After PPA (updated upon release of figures in IRS Notice usually by the end of the first full business week of the month) Below are Tables I, II, and III showing official interest rates
Review of Registered Charites Compliance Rates with Annual Reporting Requirements 2016
 Review of Registered Charites Compliance Rates with Annual Reporting Requirements 2016 October 2017 The Charities Regulator, in accordance with the provisions of section 14 of the Charities Act 2009, carried
Growth. Total non-farm Positive Nation , ,008,000
 Employment May 2007 Jun 2007 Growth Number of Growth Last 12 months Number of Jobs Total non-farm June 2007 employment Rate % Jobs Rate % Positive Nation +0.10 +132,000 +1.48 +2,008,000 RMW* +0.11 +21,300-0.03-6,400
Arkansas Works Overview. Work And Community Engagement Requirement
 1 Arkansas Works Overview Work And Community Engagement Requirement Arkansas Works Populations & Work and Community Engagement Requirement 2 Arkansas Works enrollees will fall into three categories for
HUD NSP-1 Reporting Apr 2010 Grantee Report - New Mexico State Program
 HUD NSP-1 Reporting Apr 2010 Grantee Report - State Program State Program NSP-1 Grant Amount is $19,600,000 $9,355,381 (47.7%) has been committed $4,010,874 (20.5%) has been expended Grant Number HUD Region
Status of the Unemployment Trust Fund and Related Issues. Commission on Unemployment Compensation. Ellen Marie Hess, Commissioner.
 Status of the Unemployment Trust Fund and Related Issues Commission on Unemployment Compensation August 8, 2018 Ellen Marie Hess, Commissioner 2 Trust Fund Data Standard Forecast (Millions of Dollars)
NIESR Monthly Estimates of GDP 10 November, GDP growth of 0.5 per cent in the 3 months to October FOR IMMEDIATE RELEASE
 Press Release GDP growth of 0.5 per cent in the 3 months to October FOR IMMEDIATE RELEASE Our monthly estimates of GDP suggest that output expanded by 0.5 per cent in the three months to October, slightly
Global Economic Prospects and the Developing Countries William Shaw December 1999
 Global Economic Prospects and the Developing Countries 2000 William Shaw December 1999 Prospects for Growth and Poverty Reduction in Developing Countries Recovery from financial crisis uneven International
Choosing a Cell Phone Plan-Verizon Investigating Linear Equations
 Choosing a Cell Phone Plan-Verizon Investigating Linear Equations I n 2008, Verizon offered the following cell phone plans to consumers. (Source: www.verizon.com) Verizon: Nationwide Basic Monthly Anytime
Financial & Business Highlights For the Year Ended June 30, 2017
 Financial & Business Highlights For the Year Ended June, 17 17 16 15 14 13 12 Profit and Loss Account Operating Revenue 858 590 648 415 172 174 Investment gains net 5 162 909 825 322 516 Other 262 146
Welcome to a Post-FICO World!
 Welcome to a Post-FICO World! Consumer credit modeling relies on data and analytics that haven t changed in decades A smarter prime lender could approve almost twice as many borrowers and yet have fewer
Key Labor Market and Economic Metrics
 Key Labor Market and Economic Metrics May Update Incorporates Data Available on May 27 th, 2016 This reference is the result of a collaboration between the Bureau of Labor Market Information and Strategic
Current Economic Review April 16, 2014
 Current Economic Review April 16, 2014 Brian Bonnenfant Project Manager Center for Regional Studies University of Nevada, Reno 784-1771 bonnen@unr.edu 230,000 225,000 **Peak = 228,100 Emp **Start of Great
Asset Manager Performance Comparison
 Cape Peninsula University of Technology Retirement Fund August 2017 DISCLAIMER AND WARNINGS: Towers Watson (Pty) Ltd, a Willis Towers Watson company, is an authorised financial services provider. Although
Consumer Price Index (Base year 2014) Consumer Price Index
 Consumer Price Index") Consumer Price Index July 207 (Base year 204) Consumer Price Index Release Date: Augest 207 Detailed by: Expenditure groups Household welfare levels Household type Regions Briefing This publication provides
Consumer Price Index July 207 (Base year 204) Consumer Price Index Release Date: Augest 207 Detailed by: Expenditure groups Household welfare levels Household type Regions Briefing This publication provides
Big Walnut Local School District
 Big Walnut Local School District Monthly Financial Report for the month ended September 30, 2013 Prepared By: Felicia Drummey Treasurer BIG WALNUT LOCAL SCHOOL DISTRICT SUMMARY OF YEAR TO DATE FINANCIAL
U.S. and Montana Economic Outlook
 U.S. and Montana Economic Outlook Patrick M. Barkey, Director Bureau of Business and Economic Research University of Montana Is the Story of the U.S. Economy Changing? Old Story Better growth next year
Asset Manager Performance Comparison
 Cape Peninsula University of Technology Retirement Fund September 2017 DISCLAIMER AND WARNINGS: Towers Watson (Pty) Ltd, a Willis Towers Watson company, is an authorised financial services provider. Although
Economic Indicators December 2017
 Economic Indicators December 2017 General Economy GDP % Change U.S. GDP Growth First two consecutive quarters over 3% in 3 years 6.0% 4.0% 2.0% 0.0% -2.0% -4.0% -6.0% Last 3 quarters: 3Q17: 3.2% 2Q17:
Economic Outlook. School Board Meeting April 26, 2016
 Economic Outlook School Board Meeting April 26, 2016 Global Economy 2 Global Economy International Monetary Fund (IMF) cut global economic growth outlook to 3.2% Decrease of 0.2% from outlook issued in
U.S. and Regional Economic Conditions and Outlook
 U.S. and Regional Economic Conditions and Outlook CFA Society of Nebraska Omaha, NE January 14, 215 Kelly D. Edmiston Federal Reserve Bank of Kansas City Outline Structure and Role of the Federal Reserve
WESTWOOD LUTHERAN CHURCH Summary Financial Statement YEAR TO DATE - February 28, Over(Under) Budget WECC Fund Actual Budget
 Budget WECC Fund Actual Budget") WESTWOOD LUTHERAN CHURCH Summary Financial Statement YEAR TO DATE - February 28, 2018 General Fund Actual A B C D E F WECC Fund Actual Revenue Revenue - Faith Giving 1 $ 213 $ 234 $ (22) - Tuition $ 226
WESTWOOD LUTHERAN CHURCH Summary Financial Statement YEAR TO DATE - February 28, 2018 General Fund Actual A B C D E F WECC Fund Actual Revenue Revenue - Faith Giving 1 $ 213 $ 234 $ (22) - Tuition $ 226
Economic and Fiscal Update. Ben Rosenfield, Controller Ted Egan, Ph.D., Chief Economist City and County of San Francisco January 23, 2018
 Economic and Fiscal Update Ben Rosenfield, Controller Ted Egan, Ph.D., Chief Economist City and County of San Francisco January 23, 2018 San Francisco Unemployment Rate Continues to Find New Lows Now Down
Macroeconomic Outlook: Implications for Agriculture. It has been 26 years since we have experienced a significant recession
 Macroeconomic Outlook: Implications for Agriculture John B. Penson, Jr. Regents Professor and Stiles Professor of Agriculture Texas A&M University Our Recession History September 1902 August1904 23 May
Economic Outlook 2011: Non-profits at the nexus of changing private and public markets
 Economic Outlook 2011: Non-profits at the nexus of changing private and public markets Santa Rosa, CA June 8, 2011 Robert Eyler, Ph.D. Chair, Economics Department Frank Howard Allen Research Fellow Director,
FOR RELEASE: MONDAY, MARCH 21 AT 4 PM
 Interviews with 1,012 adult Americans conducted by telephone by Opinion Research Corporation on March 18-20, 2011. The margin of sampling error for results based on the total sample is plus or minus 3
Monthly Labour Force Survey Statistics December 2018
 800 Monthly Labour Force Survey Statistics CALGARY CMA Table 282-0135 Labour force survey estimates (LFS), by census metropolitan area based on 2011 census boundaries, 3-month moving average, seasonally
Monthly Labour Force Survey Statistics November 2018
 800 Monthly Labour Force Survey Statistics CALGARY CMA Table 282-0135 Labour force survey estimates (LFS), by census metropolitan area based on 2011 census boundaries, 3-month moving average, seasonally
TERMS OF REFERENCE FOR THE INVESTMENT COMMITTEE
 I. PURPOSE The purpose of the Investment Committee (the Committee ) is to recommend to the Board the investment policy, including the asset mix policy and the appropriate benchmark for both ICBC and any
Real Estate Market. Lawrence Yun, Ph.D. Presentation to New England REALTORS Conference. February 2, 2010 NATIONAL ASSOCIATION OF REALTORS
 Real Estate Market Trends & Outlook Lawrence Yun, Ph.D. Chief Economist NATIONAL ASSOCIATION OF REALTORS Presentation to New England REALTORS Conference February 2, 2010 Housing Stimulus Impact Tax Credit
City of Joliet 2014 Revenue Review. October 2013
 City of Joliet 2014 Revenue Review October 2013 General Fund 2014 Est. Revenues = $163.6 M Licenses, Permits, Fees Gaming Taxes 5% 12% Sales Taxes 27% Income Taxes 9% Charges for Services 14% Other Taxes
THE ECONOMIC OUTLOOK RECESSION AND RECOVERY. Paul Darby Executive Director & Deuty Chief Economist Twitter hashtag: #psforum
 THE ECONOMIC OUTLOOK RECESSION AND RECOVERY Paul Darby Executive Director & Deuty Chief Economist Darby@conferenceboard.ca US OUTLOOK US recession is coming to an end Q3 likely to be positive due to inventory
Historical Pricing PJM COMED, Around the Clock. Cal '15 Cal '16 Cal '17 Cal '18 Cal '19 Cal '20 Cal '21 Cal '22
 $50 Historical Pricing PJM COMED, Around the Clock $48 $46 $44 $42 $40 $38 $36 $34 $32 $30 $28 $26 Cal '15 Cal '16 Cal '17 Cal '18 Cal '19 Cal '20 Cal '21 Cal '22 The information presented above was gathered
Leading Economic Indicator Nebraska
 Nebraska Monthly Economic Indicators: December 20, 2017 Prepared by the UNL College of Business Administration, Bureau of Business Research Author: Dr. Eric Thompson Leading Economic Indicator...1 Coincident
Figure 1: Change in LEI-N August 2018
 Nebraska Monthly Economic Indicators: September 26, 2018 Prepared by the UNL College of Business, Bureau of Business Research Author: Dr. Eric Thompson Leading Economic Indicator...1 Coincident Economic
Mortgage Trends Update
 Mortgage Trends Update UK Finance: Mortgage Trends Update December 218 of first-time reaches 12-year high in 218 Key data highlights: There were 37, new first-time buyer mortgages completed in 218, some
The Impact of the Recession on Employment-Based Health Coverage
 May 2010 No. 342 The Impact of the Recession on Employment-Based Health Coverage By Paul Fronstin, Employee Benefit Research Institute E X E C U T I V E S U M M A R Y HEALTH COVERAGE AND THE RECESSION:
Leading Economic Indicator Nebraska
 Nebraska Monthly Economic Indicators: August 15, 2014 Prepared by the UNL College of Business Administration, Department of Economics Authors: Dr. Eric Thompson, Dr. William Walstad Graduate Research Assistants:
Economic and Revenue Update
 Economic and Revenue Update A Briefing for the Money Committees Aubrey L. Layne, Jr. Secretary of Finance Commonwealth of Virginia www.finance.virginia.gov January 2018 Topics for Discussion National and
Cost Estimation of a Manufacturing Company
 Cost Estimation of a Manufacturing Company Name: Business: Date: Economics of One Unit: Manufacturing Company (Only complete if you are making a product, such as a bracelet or beauty product) Economics
Development of Economy and Financial Markets of Kazakhstan
 Development of Economy and Financial Markets of Kazakhstan National Bank of Kazakhstan Macroeconomic development GDP, real growth, % 116 112 18 14 1 113,5 11,7 216,7223,8226,5 19,8 19,8 19,3 19,619,7 199,
Use of State Coincident Indexes
 Use of State Coincident Indexes Federal Tax Administrators Revenue Estimating and Tax Research Conference October 17, 2016 Paul R. Flora* Senior Economic Analyst, Research & Policy Support Manager FEDERAL
Introduction to the UK Economy
 Introduction to the UK Economy What are the key objectives of macroeconomic policy? Price Stability (CPI Inflation of 2%) Growth of Real GDP (National Output) Falling Unemployment / Raising Employment
NIESR Monthly Estimates of GDP 9 March, GDP growth of 0.3 per cent in three months to February 2018 *For Immediate release*
 Press Release GDP growth of 0.3 per cent in three months to February 2018 *For Immediate release* Our monthly estimates of GDP suggest that output growth slowed to 0.3 per cent in the 3 months to February
Leading Economic Indicator Nebraska
 Nebraska Monthly Economic Indicators: September 20, 2017 Prepared by the UNL College of Business Administration, Bureau of Business Research Author: Dr. Eric Thompson Leading Economic Indicator...1 Coincident
NIESR Monthly Estimates of GDP 11 April, GDP growth of 0.2 per cent for the first quarter of 2018 *For Immediate release*
 Press Release GDP growth of 0.2 per cent for the first quarter of 2018 *For Immediate release* Our monthly estimates of GDP suggest that output growth slowed to 0.2 per cent in the first quarter of 2018
MACRO Report: Review of Wyoming s Economy
 MACRO Report: Review of Wyoming s Economy Economic Update as of December 31, 2017 The MACRO Report is a quarterly publication comprised of charts focusing on energy, employment, state revenues, and other
Mitchell Electric Charitable Fund PO Box 409 Camilla, GA (229) or FAX:
 or FAX:") Mitchell Electric Charitable Fund PO Box 409 Camilla, GA 31730 (229) 336-5221 or 1-800-479-6034 FAX: 229-336-7088 For Office use only: Agency / Organization Application All attached sheets, including financial
Mitchell Electric Charitable Fund PO Box 409 Camilla, GA 31730 (229) 336-5221 or 1-800-479-6034 FAX: 229-336-7088 For Office use only: Agency / Organization Application All attached sheets, including financial
200 Years Of The U.S. Stock Market
 200 Years Of The U.S. Stock Market Professor John McConnell Krannert School of Management Purdue University September 25, 2018 1 200 Years Of The U.S. Stock Market Market Overview The long term The averages
Foreclosure Filings in the Atlanta Region
 Foreclosure Filings in the Atlanta Region Atlanta Regional Commission Regional Snapshot: October 2013 For more information contact: mcarnathan@atlantaregional.com 25 Largest Metros: Percent of Seriously
Algo Trading System RTM
 Year Return 2016 15,17% 2015 29,57% 2014 18,57% 2013 15,64% 2012 13,97% 2011 55,41% 2010 50,98% 2009 48,29% Algo Trading System RTM 89000 79000 69000 59000 49000 39000 29000 19000 9000 2-Jan-09 2-Jan-10
44 states offer film tax incentives to lure big productions with big out-of-state money. Nevada is one of six that does not.
 The Motion Picture Jobs Creation Act (AB506) Executive Summary 44 states offer film tax incentives to lure big productions with big out-of-state money. Nevada is one of six that does not. Incentives create
Historical Pricing PJM PSEG, Around the Clock. Cal '15 Cal '16 Cal '17 Cal '18 Cal '19 Cal '20 Cal '21 Cal '22
 $70 Historical Pricing PJM PSEG, Around the Clock $65 $60 $55 $50 $45 $40 $35 $30 $25 Cal '15 Cal '16 Cal '17 Cal '18 Cal '19 Cal '20 Cal '21 Cal '22 The information presented above was gathered and compiled
What is Monetary Policy?
 What is Monetary Policy? Monetary stability means stable prices and confidence in the currency. Stable prices are defined by the Government's inflation target, which the Bank seeks to meet through the
Common stock prices 1. New York Stock Exchange indexes (Dec. 31,1965=50)2. Transportation. Utility 3. Finance
2. Transportation. Utility 3. Finance") Digitized for FRASER http://fraser.stlouisfed.org/ Federal Reserve Bank of St. Louis 000 97 98 99 I90 9 9 9 9 9 9 97 98 99 970 97 97 ""..".'..'.."... 97 97 97 97 977 978 979 980 98 98 98 98 98 98 987 988
Digitized for FRASER http://fraser.stlouisfed.org/ Federal Reserve Bank of St. Louis 000 97 98 99 I90 9 9 9 9 9 9 97 98 99 970 97 97 ""..".'..'.."... 97 97 97 97 977 978 979 980 98 98 98 98 98 98 987 988
Illinois Job Index Note: BLS revised its estimates for the number of jobs and seasonal adjustment method at the beginning of 2010.
 Illinois Job Index Release Data Issue 4/21/2010 Jan 1990 / Mar 2010 Note: BLS revised its estimates for the number of jobs and seasonal adjustment method at the beginning of 2010. For April Illinois Job
February 8, 2012 Robert Johnson Director of Economic Analysis
 Positive Surprises in Store for 2012? Macro Overview February 8, 2012 Robert Johnson Director of Economic Analysis 1 U.S. Economic Data 2011: Soft, but no recession, Growth Accelerated Through the Year
C I T Y O F B O I S E
 C I T Y O F B O I S E D E P A R T M E N T O F F I N A N C E A N D A D M I N I S T R A T I O N Office of Budget Development & Monitoring Economic Brief Mike Sherack, Senior Budget Analyst & Brent Davis,
PHOENIX ENERGY MARKETING CONSULTANTS INC. HISTORICAL NATURAL GAS & CRUDE OIL PRICES UPDATED TO July, 2018
 Jan-01 $12.9112 $10.4754 $9.7870 $1.5032 $29.2595 $275.39 $43.78 $159.32 $25.33 Feb-01 $10.4670 $7.8378 $6.9397 $1.5218 $29.6447 $279.78 $44.48 $165.68 $26.34 Mar-01 $7.6303 $7.3271 $5.0903 $1.5585 $27.2714
Fixed Income Update: June 2017
 Fixed Income Update: June 2017 James Kochan Chief Fixed-Income Strategist Overview Political turmoil may obscure but does not usually overwhelm the economic fundamentals that drive the bond markets.. Those
5.9 Percent 4.4 Percent 10.2 Percent 9.7 Percent. autonomous federated state Head of Government Angela Merkel Horst Seehofer José Manuel Barroso 3,7%
 Economic Outlook Germany, Bavaria, Eurozone, and EU-27 General Information Germany Bavaria Eurozone EU-27 Area 357.022 km² 70.552 km² 4.324.782 km² Population 81.796.000 12.583.538 327.054.866 502.489.100
Factor Leave Accruals. Accruing Vacation and Sick Leave
 Factor Leave Accruals Accruing Vacation and Sick Leave Factor Leave Accruals As part of the transition of non-exempt employees to biweekly pay, the UC Office of the President also requires standardization
Leading Economic Indicator Nebraska
 Nebraska Monthly Economic Indicators: July 29, 2016 Prepared by the UNL College of Business Administration, Department of Economics Authors: Dr. Eric Thompson, Dr. William Walstad Leading Economic Indicator...1
SOUTHWEST. The Fleet and Family Support Center. Transition GPS (Goals, Plans, Success) Schedule
 Schedule") The SOUTHWEST Transition GPS (Goals, Plans, Success) Schedule The Transition Assistance Program (TAP) provides information and training to ensure Service Members leaving active duty are prepared for their
The SOUTHWEST Transition GPS (Goals, Plans, Success) Schedule The Transition Assistance Program (TAP) provides information and training to ensure Service Members leaving active duty are prepared for their
Nonfarm Payroll Employment
 PRESIDENT'S REPORT TO THE BOARD OF DIRECTORS, FEDERAL RESERVE BANK OF BOSTON Current Economic Developments - June 10, 2004 Data released since your last Directors' meeting show the economy continues to
Constructing a Cash Flow Forecast
 Constructing a Cash Flow Forecast Method and Worked Example A cash flow forecast shows the estimates of the timing and amounts of cash inflows and outflows over a period of time. The sections of a cash
World Economy Geopolitics Investment Strategy. The Impact of EU s Sovereign Risks on Turkish Economy. Presentation given by
 World Economy Geopolitics Investment Strategy OUTLOOK FOR WORLD S MAJOR FINANCIAL MARKETS The Impact of EU s Sovereign Risks on Turkish Economy Presentation given by Dr. Michael Ivanovitch, President MSI
Emerging Trends in the Regional Economy
 Emerging Trends in the Regional Economy Alison Felix Economist & Branch Executive Federal Reserve Bank of Kansas City Denver Branch The views expressed are those of the presenter and do not necessarily
OTHER DEPOSITS FINANCIAL INSTITUTIONS DEPOSIT BARKAT SAVING ACCOUNT
 WEIGHTAGES JAN FEB MAR APR MAY JUN JUL AUG SEPT OCT NOV DEC ANNOUNCEMENT DATE 19.Dez.14 27.Jän.15 24.Feb.15 26.Mär.15 27.Apr.15 26.Mai.15 25.Jun.15 28.Jul.15 26.Aug.15 23.Sep.15 27.Okt.15 25.Nov.15 MUDARIB
State of the Economy: US, New Mexico
 University of New Mexico Bureau of Business and Economic Research State of the Economy: US, New Mexico New Mexico Women s Agenda Lobbying Workshop Advocates Working Session on Economic Security and Women
+9.1% year-over-year -11.4% month-over-month. ARMLS STAT - September 22, 2015 MONTHLY SALES
 ARMLS STAT - September 22, 2015 MONTHLY SALES +9.1% year-over-year -11.4% month-over-month Permission is granted only to ARMLS Subscribers for reproduction and to prepare derivative works with attribution
NIESR Monthly Estimates of GDP 8 September, GDP growth of 0.4 per cent in the 3 months to August *For Immediate Release*
 Press Release GDP growth of 0.4 per cent in the 3 months to August 2017 *For Immediate Release* Our monthly estimates of GDP suggest that output grew by 0.4 per cent in the three months ending in August
First Quarter. January March 2016
 First Quarter January March 2016 Highlights First quarter showed positive momentum for design industry. Design firms in March reported strong and accelerating business after a weak January and February.
THE CONFERENCE BOARD LEADING ECONOMIC INDEX (LEI) FOR FRANCE AND RELATED COMPOSITE ECONOMIC INDEXES FOR JANUARY
 FOR FRANCE AND RELATED COMPOSITE ECONOMIC INDEXES FOR JANUARY") FOR RELEASE: 10:00 A.M. CET, TUESDAY, MARCH 17, 2009 The Conference Board France Business Cycle Indicators SM THE CONFERENCE BOARD LEADING ECONOMIC INDEX (LEI) FOR FRANCE AND RELATED COMPOSITE ECONOMIC
FOR RELEASE: 10:00 A.M. CET, TUESDAY, MARCH 17, 2009 The Conference Board France Business Cycle Indicators SM THE CONFERENCE BOARD LEADING ECONOMIC INDEX (LEI) FOR FRANCE AND RELATED COMPOSITE ECONOMIC
HKU announces 2015 Q3 HK Macroeconomic Forecast
 Press Release HKU announces 2015 Q3 HK Macroeconomic Forecast July 7, 2015 1 Overview The APEC Studies Programme of the Hong Kong Institute of Economics and Business Strategy at the University of Hong