Foreclosure Filings in the Atlanta Region
|
|
|
- Annabelle McDonald
- 6 years ago
- Views:
Transcription

1 Foreclosure Filings in the Atlanta Region Atlanta Regional Commission Regional Snapshot: October 2013 For more information contact:
2 25 Largest Metros: Percent of Seriously Delinquent Mortgages, March % 20.0% 15.0% Of the 25 largest metro areas, metro Atlanta still has a relatively high rate of mortgages that are considered to be seriously delinquent those that are at least 90 days overdue. Overall, however, metro Atlanta ranks 38th out of 100 metros on this measure. 10.0% 5.0% 0.0%
3 25 Largest Metros: Change in Seriously Delinquent Rate, December March % 2.0% 1.0% While metro Atlanta has a relatively high rate of seriously delinquent mortgages when compared to other large metros, metro Atlanta also has among the highest rates of DECLINE in seriously delinquencies since December As you can see, the serious delinquency rate in metro Atlanta has declined 2.5 percentage points since December 2010, the 7 th best rate of change among the top 25 metros. 0.0% -1.0% -2.0% -3.0% -4.0% -5.0%

4 Map: Percent of Seriously Delinquent Mortgages for All Metro Areas, March 2013 Metro Atlanta When compared to ALL metros in the nation, metro Atlanta falls in the middle range of serious delinquent rates. As the map below shows, the housing markets in several metro areas in Florida still are struggling with high delinquency rates and high foreclosure rates. But to foreclose in Florida requires court action, which could take a couple of years. In Georgia a bank can foreclose on a property without legal action, which speeds up the entire process.
5 20-County Region: Foreclosure Filings, Current 18,000 16,000 Looking more locally at the 20-county area, the number of foreclosure filings has dropped steadily since ,000 12,000 10,000 8,000 6,000 4,000 2,000 0
6 Jan-00 Jun-00 Nov-00 Apr-01 Sep-01 Feb-02 Jul-02 Dec-02 May-03 Oct-03 Mar-04 Aug-04 Jan-05 Jun-05 Nov-05 Apr-06 Sep-06 Feb-07 Jul-07 Dec-07 May-08 Oct-08 Mar-09 Aug-09 Jan-10 Jun-10 Nov-10 Apr-11 Sep-11 Feb-12 Jul-12 Dec-12 May County Region: Foreclosure Filings, Current 14,000 12,000 10,000 8,000 In looking back even further back to 2000 we see that with the recent declines, foreclosure filings are back to pre-recession levels. But they are still higher than they were in the early 2000s. Please note that these are for the 10-county region, as we don t have the data going back to 2000 for all 20 counties. 6,000 4,000 2,000 0
7 Jan-00 Jul-00 Jan-01 Jul-01 Jan-02 Jul-02 Jan-03 Jul-03 Jan-04 Jul-04 Jan-05 Jul-05 Jan-06 Jul-06 Jan-07 Jul-07 Jan-08 Jul-08 Jan-09 Jul-09 Jan-10 Jul-10 Jan-11 Jul-11 Jan-12 Jul-12 Jan-13 Jul-13 Building Permits and Foreclosure Filings: 10-County Region, Current 14,000 12,000 Here we can see the effect a high number of foreclosure filings can have on homebuilding. When foreclosure filings are high (left-axis, orange bars), building permits suffer (right-axis, green line). 7,000 6,000 10,000 5,000 8,000 4,000 6,000 3,000 4,000 2,000 2,000 1,
8 20-County Region: Declining Foreclosure Filings, Change from 2010 to 2011 Change from 2011 to 2012 Although the housing market decline began along with the Great Recession in 2007, foreclosure filings kept increasing every year through Since then, however, every county in the region has seen dramatic declines in the number of foreclosure filings. Walton Spalding Rockdale Paulding Newton Henry Hall Gwinnett Fulton Forsyth Fayette Douglas DeKalb Coweta Cobb Clayton Cherokee Carroll Bartow Barrow -10,000-9,000-8,000-7,000-6,000-5,000-4,000-3,000-2,000-1,000 0
9 Foreclosure Filings by County, 2010-Current (through September) 25,000 20,000 15,000 As the chart shows, foreclosure filings have continued their precipitous decline in Note that these data compare filings through September of each year. 10,000 5,
, 2007 In 2007, foreclosure filings were mostly")
10 Foreclosure Filings (per sq. mile), 2007 In 2007, foreclosure filings were mostly contained within the region s core
11 Foreclosure Filings (per sq. mile), 2008 By 2008, foreclosure filings began moving further out
12 Foreclosure Filings (per sq. mile), 2009 By 2009, significant foreclosure filing hot spots arose in Gwinnett and Cobb
13 Foreclosure Filings (per sq. mile), 2010 By 2010, Gwinnett County, as a whole, led the region in foreclosure filings
14 Foreclosure Filings (per sq. mile), 2011 By 2011, foreclosure filing hot spots began to recede slightly
15 Foreclosure Filings (per sq. mile), 2012 And, finally in 2012, foreclosure filing hot spots are dissipating, but some areas, like those in Gwinnett, DeKalb and Atlanta, have remained hot throughout
16

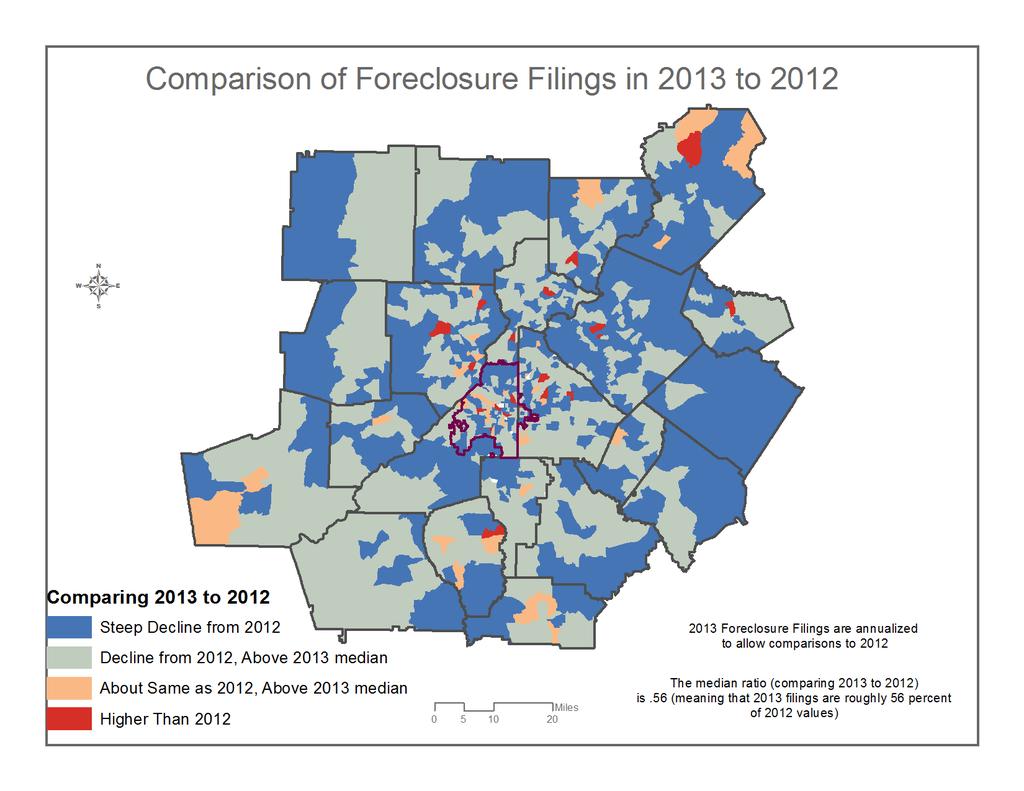
17 Map: Foreclosure Filings Comparison, 2013 to 2012 This map looks at small-area foreclosure trends. It annualizes the 2013 data to allows comparisons to 2012 (since we don t have all of 2013 data yet). The areas in blue represent greatest declines in the region. These areas are well below 2012 levels AND are below the regional median for The light blue areas represent declines from 2012, but are slightly above the 2013 average. The pinks and reds which there are very little of are areas where foreclosures are on par with or exceeding last year s levels in other words, these areas aren t improving like the blue areas. Fortunately, the pink and red areas are few and relatively scattered throughout the region, with no one area having a heavy concentration.
Income Changes in Metro Atlanta: Meandering Through The Research
 Income Changes in Metro Atlanta: Meandering Through The Research Atlanta Regional Commission For more information, contact: mcarnathan@atlantaregional.com The Highlights Per Capita Income in metro Atlanta
A Review of Per Capita County Taxes and Spending in 10-County ARC-Metro Atlanta Region
 A Review of Per Capita County Taxes and Spending in 10-County ARC-Metro Atlanta Region Written By: Jerry W. Cooper, County Manager June 21, 2011 Abstract: June 2011 Which Metro-Atlanta Counties has the
RBC Centura. Looking back. Kel Landis Chief Executive Officer. Presentation to Analysts & Institutional Investors. October 22, 2001 Toronto
 RBC Centura Kel Landis Chief Executive Officer Presentation to Analysts & Institutional Investors October 22, 2001 Toronto Looking back 1 Looking back Centura Was a Leader In: Sales Culture Evolution Started
Department of Public Welfare (DPW)
") Department of Public Welfare (DPW) Office of Income Maintenance Electronic Benefits Transfer Card Risk Management Report Out-of-State Residency Review FISCAL YEAR 2014-2015 September 2014 (June, July and
Department of Public Welfare (DPW) Office of Income Maintenance Electronic Benefits Transfer Card Risk Management Report Out-of-State Residency Review FISCAL YEAR 2014-2015 September 2014 (June, July and
Income in Georgia. Employment. John. Matthews
 An Analysis of the Relative Decline in Income in Georgia John Matthews Fiscal Research Center Andrew Young School of Policy Studies Georgia State University Atlanta, GA FRC Report No. 205 December 2009
May 2016 MLS Statistical ReportREALTORS
 May 216 MLS Statistical ReportREALTORS 3 Year over Year Sales Comparison - Total Sales 25 2 15 1 5 213 214 215 216 Jan Feb Mar Apr May Jun Jul Aug Sep Oct Nov Dec Summary Overall Since the beginning of
PRESS RELEASE. Securities issued by Hungarian residents and breakdown by holding sectors. October 2018
 PRESS RELEASE 10 December 2018 Securities issued by Hungarian residents and breakdown by holding sectors October 2018 According to securities statistics, the amount outstanding of equity securities and
City Income Inequality
 CSLF REPORT #1 JUNE 17, 2014 City Income Inequality Lakshmi Pandey David L. Sjoquist Laura Wheeler 2 Introduction A recent report from the Brookings Institution (Berube 2014) explored the income inequality
XML Publisher Balance Sheet Vision Operations (USA) Feb-02
 Feb-02") Page:1 Apr-01 May-01 Jun-01 Jul-01 ASSETS Current Assets Cash and Short Term Investments 15,862,304 51,998,607 9,198,226 Accounts Receivable - Net of Allowance 2,560,786
Page:1 Apr-01 May-01 Jun-01 Jul-01 ASSETS Current Assets Cash and Short Term Investments 15,862,304 51,998,607 9,198,226 Accounts Receivable - Net of Allowance 2,560,786
PRESS RELEASE. Securities issued by Hungarian residents and breakdown by holding sectors. January 2019
 7 March 2019 PRESS RELEASE Securities issued by Hungarian residents and breakdown by holding sectors January 2019 According to securities statistics, the amount outstanding of equity securities and debt
Spheria Australian Smaller Companies Fund
 29-Jun-18 $ 2.7686 $ 2.7603 $ 2.7520 28-Jun-18 $ 2.7764 $ 2.7681 $ 2.7598 27-Jun-18 $ 2.7804 $ 2.7721 $ 2.7638 26-Jun-18 $ 2.7857 $ 2.7774 $ 2.7690 25-Jun-18 $ 2.7931 $ 2.7848 $ 2.7764 22-Jun-18 $ 2.7771
PRESS RELEASE. Securities issued by Hungarian residents and breakdown by holding sectors. April 2016
 10 June 2016 PRESS RELEASE Securities issued by Hungarian residents and breakdown by holding sectors April 2016 According to securities statistics data, the amount outstanding of equity securities and
Mortgage Delinquency and Foreclosure Trends Georgia Fourth Quarter 2011
 Mortgage Delinquency and Foreclosure Trends Georgia Fourth Quarter 2011 This report for Georgia is part of the Mortgage Delinquency and Foreclosure Trends series, released quarterly, which provides information
Mortgage Delinquency and Foreclosure Trends Georgia First Quarter 2011
 Mortgage Delinquency and Foreclosure Trends Georgia First Quarter 2011 This report for Georgia is part of the Mortgage Delinquency and Foreclosure Trends series, released quarterly, which provides information
$ FACTS ABOUT GEORGIA: WAGE STATE FACTS HOUSING MOST EXPENSIVE AREAS WAGE RANKING
 STATE #27 * RANKING In Georgia, the Fair Market Rent () for a two-bedroom apartment is $911. In order this level of and utilities without paying more than 30% of income on housing a household must earn
THE. ATLANTA REGION S Transit Programs Of Projects
 THE ATLANTA REGION S Transit Programs Of Projects Table of Contents Introduction... 1 Transit Routes... 2 Fixing America s Surface Transportation Act (FAST Act)... 3 Transit Operators and Recipients of
February 2016 MLS Statistical Report
 February 216 MLS Statistical Report 3 Year over Year Sales Comparison - Total Sales 2 1 213 214 21 216 Jan Feb Mar Apr May Jun Jul Aug Sep Oct Nov Dec Summary Overall Sales have slowed during February
THE. ATLANTA REGION S Transit Programs Of Projects
 THE ATLANTA REGION S Transit Programs Of Projects Table of Contents Introduction... 1 Transit Routes... 2 Fixing America s Surface Transportation Act (FAST Act)... 3 Transit Operators and Recipients of
PRESS RELEASE. Securities issued by Hungarian residents and breakdown by holding sectors. October 2017
 11 December 2017 PRESS RELEASE Securities issued by Hungarian residents and breakdown by holding sectors October 2017 According to securities statistics, the amount outstanding of equity securities and
HOPE NOW. Snapshot Industry Extrapolations and HAMP Metrics
 Snapshot Industry Extrapolations and HAMP Metrics Three Month Q2-215 Q3-215 Q4-215 Q1-216 Q2-216 Jun-16 Jul-16 Aug-16 Total Completed Modifications 119,658 97,773 84,798 86,167 1,198 41,872 34,815 36,6
WESTWOOD LUTHERAN CHURCH Summary Financial Statement YEAR TO DATE - February 28, Over(Under) Budget WECC Fund Actual Budget
 Budget WECC Fund Actual Budget") WESTWOOD LUTHERAN CHURCH Summary Financial Statement YEAR TO DATE - February 28, 2018 General Fund Actual A B C D E F WECC Fund Actual Revenue Revenue - Faith Giving 1 $ 213 $ 234 $ (22) - Tuition $ 226
WESTWOOD LUTHERAN CHURCH Summary Financial Statement YEAR TO DATE - February 28, 2018 General Fund Actual A B C D E F WECC Fund Actual Revenue Revenue - Faith Giving 1 $ 213 $ 234 $ (22) - Tuition $ 226
Focus: Reducing Class Size
 CHEROKEE COUNTY SCHOOL DISTRICT May 2015 Dr. Frank R. Petruzielo, Superintendent of Schools 2015-16 Focus: Reducing The School Board approved a resolution at its May 7, 2015 meeting supporting Exemptions
THE B E A CH TO WN S O F P ALM B EA CH
 THE B E A CH TO WN S O F P ALM B EA CH C OU N T Y F LO R I D A August www.luxuryhomemarketing.com PALM BEACH TOWNS SINGLE-FAMILY HOMES LUXURY INVENTORY VS. SALES JULY Sales Luxury Benchmark Price : 7,
Mortgage Delinquency and Foreclosure Trends Georgia Third Quarter 2010
 Mortgage Delinquency and Foreclosure Trends Georgia Third Quarter 2010 This report for Georgia is part of the Mortgage Delinquency and Foreclosure Trends series, released quarterly, which provides information
TO: State and Local Government Clients DATE: June 18, IRS Guidance on Recovery Zone Economic Development Bonds and Recovery Zone Facility Bonds
 MEMORANDUM TO: State and Local Government Clients DATE: June 18, 2009 FROM: Douglass P. Selby, Esq. Caryl Greenberg Smith, Esq. FILE: 99999.000502 IRS Guidance on Recovery Zone Economic Development Bonds
Cost Estimation of a Manufacturing Company
 Cost Estimation of a Manufacturing Company Name: Business: Date: Economics of One Unit: Manufacturing Company (Only complete if you are making a product, such as a bracelet or beauty product) Economics
June 2018 MLS Statistical Report
 Jan Feb Mar Apr May Jun Jul Aug Sep Oct Nov Dec June 218 MLS Statistical Report Total Sales The Month to Month Unit Sales graph shows that sales have started their seasonal decline. For the year, residential
HUD NSP-1 Reporting Apr 2010 Grantee Report - New Mexico State Program
 HUD NSP-1 Reporting Apr 2010 Grantee Report - State Program State Program NSP-1 Grant Amount is $19,600,000 $9,355,381 (47.7%) has been committed $4,010,874 (20.5%) has been expended Grant Number HUD Region
Review of Registered Charites Compliance Rates with Annual Reporting Requirements 2016
 Review of Registered Charites Compliance Rates with Annual Reporting Requirements 2016 October 2017 The Charities Regulator, in accordance with the provisions of section 14 of the Charities Act 2009, carried
PHOENIX ENERGY MARKETING CONSULTANTS INC. HISTORICAL NATURAL GAS & CRUDE OIL PRICES UPDATED TO July, 2018
 Jan-01 $12.9112 $10.4754 $9.7870 $1.5032 $29.2595 $275.39 $43.78 $159.32 $25.33 Feb-01 $10.4670 $7.8378 $6.9397 $1.5218 $29.6447 $279.78 $44.48 $165.68 $26.34 Mar-01 $7.6303 $7.3271 $5.0903 $1.5585 $27.2714
Credit Suisse Swiss Pension Fund Index Q1 2017
 Credit Suisse Swiss Pension Fund Index Q1 217 YTD 217: 2.76% Q1 217: 2.76% Credit Suisse Pension Fund Index starts year at all-time high Allocation to foreign equities at all-time high; allocation to Swiss
Executive Summary. July 17, 2015
 Executive Summary July 17, 2015 The Revenue Estimating Conference adopted interest rates for use in the state budgeting process. The adopted interest rates take into consideration current benchmark rates
Financial & Business Highlights For the Year Ended June 30, 2017
 Financial & Business Highlights For the Year Ended June, 17 17 16 15 14 13 12 Profit and Loss Account Operating Revenue 858 590 648 415 172 174 Investment gains net 5 162 909 825 322 516 Other 262 146
Current Economic Review April 16, 2014
 Current Economic Review April 16, 2014 Brian Bonnenfant Project Manager Center for Regional Studies University of Nevada, Reno 784-1771 bonnen@unr.edu 230,000 225,000 **Peak = 228,100 Emp **Start of Great
Communities Count Data Updates for October Bankruptcies Home Foreclosures Unemployment
 Communities Count 2008 Data Updates for October 2009 Bankruptcies Home Foreclosures Unemployment HTUwww.communitiescount.orgUTH Page 1 of 8 Communities Count reports on a set of social and health indicators
HOPE NOW. Snapshot Industry Extrapolations and HAMP Metrics
 Snapshot Industry Extrapolations and HAMP Metrics Three Month Q4-2016 Q1-2017 Q2-2017 Q3-2017 Q4-2017 Oct-17 Nov-17 Dec-17 Total Completed Modifications 85,357 89,213 78,302 54,318 56,355 19,400 18,819
for you. Put us to work Revenue recovery experts for contractors.
 . Put us to work for you. Revenue recovery experts for contractors. tel 770.926.2790 fax 770.926.2512 5655 Lake Acworth Drive, Suite 310, Acworth GA 30101 www.lienfilers.com Stop spinning your wheels and
(Internet version) Financial & Statistical Report September 2017
 Financial & Statistical Report September 2017") (Internet version) Financial & Statistical Report September 2017 10/23/2017 Statement of Operations For the Period Ended September 30, 2017 (in millions) Current Month Year-to-Date Operating Revenue &
(Internet version) Financial & Statistical Report September 2017 10/23/2017 Statement of Operations For the Period Ended September 30, 2017 (in millions) Current Month Year-to-Date Operating Revenue &
(Internet version) Financial & Statistical Report December 2017
 Financial & Statistical Report December 2017") (Internet version) Financial & Statistical Report December 2017 01/22/2018 Statement of Operations For the Period Ended December 31, 2017 (in millions) Current Month Year-to-Date Operating Revenue & Patronage
(Internet version) Financial & Statistical Report December 2017 01/22/2018 Statement of Operations For the Period Ended December 31, 2017 (in millions) Current Month Year-to-Date Operating Revenue & Patronage
(Internet version) Financial & Statistical Report December 2016
 Financial & Statistical Report December 2016") (Internet version) Financial & Statistical Report December 2016 1/23/2017 Statement of Operations For the Period Ended December 31, 2016 (in millions) Current Month Year-to-Date Operating Revenue & Patronage
(Internet version) Financial & Statistical Report December 2016 1/23/2017 Statement of Operations For the Period Ended December 31, 2016 (in millions) Current Month Year-to-Date Operating Revenue & Patronage
Big Walnut Local School District
 Big Walnut Local School District Monthly Financial Report for the month ended September 30, 2013 Prepared By: Felicia Drummey Treasurer BIG WALNUT LOCAL SCHOOL DISTRICT SUMMARY OF YEAR TO DATE FINANCIAL
Business & Financial Services December 2017
 Business & Financial Services December 217 Completed Procurement Transactions by Month 2 4 175 15 125 1 75 5 2 1 Business Days to Complete 25 Jan Feb Mar Apr May Jun Jul Aug Sep Oct Nov Dec 217 Procurement
Credit Suisse Swiss Pension Fund Index Q2 2017
 Credit Suisse Swiss Pension Fund Index Q2 217 YTD 217: 3.94% Q2 217: 1.15% Positive second quarter, with slowdown in June Significant positive contribution from Swiss equities in reporting quarter Sharp
GIMA Pulse Date of Report: 04/07/2017 a monthly snapshot of the UK Economy from
 GIMA Pulse Date of Report: 04/07/2017 a monthly snapshot of the UK Economy from www.barometeroftrade.com Summary The factor with the largest percentage change over the last month is crude oil prices. Having
When Dashboards are Stupid Presented by John Alber and Chris Emerson #ORG4
 When Dashboards are Stupid Presented by John Alber and Chris Emerson #ORG4 Jan-11 Feb-11 Mar-11 Apr-11 May-11 Jun-11 Jul-11 Aug-11 Sep-11 Oct-11 Nov-11 Dec-11 Jan-12
September 2016 MLS Statistical Report
 September 216 MLS Statistical Report Year over Year Sales Comparison - Total Sales 3 2 1 Jan Feb Mar Apr May Jun Jul Aug Sep 216 215 214 213 Oct Nov Dec Summary Overall When looking at the sales figures
TERMS OF REFERENCE FOR THE INVESTMENT COMMITTEE
 I. PURPOSE The purpose of the Investment Committee (the Committee ) is to recommend to the Board the investment policy, including the asset mix policy and the appropriate benchmark for both ICBC and any
Memphis Area Home Sales Report March 2016
 1,083 1,033 956 987 934 1040 1,025 1,086 1,197 1,270 1,352 1,297 1,268 1,229 1,384 1,557 1,663 1,466 1,685 1,293 1,483 1,552 1,424 1,371 1,336 1,317 1,367 March Total Sales Sales Summary Memphis Area Home
April 2017 MLS Statistical Report Year to Year Unit Sales Comparison - Total Sales
 April 217 MLS Statistical Report Year to Year Unit Sales Comparison - Total Sales 2 2 1 1 Jan Feb Mar Apr May Jun Jul Aug Sep Oct Nov Dec 214 21 216 217 Summary Total Existing-Home Sales: Existing home
Truth Verses Fiction
 Truth Verses Fiction ARE WE BEING SOLD A (TAX) BILL OF GOODS Government does not tax to get the money it needs; government always finds a need for the money it gets. Ronald Reagan How We Got Here Did
Credit Suisse Swiss Pension Fund Index Q1 2016
 Credit Suisse Swiss Pension Fund Index Q1 216 Q1 216:.49% Disappointing start to the year with a glimmer of light in March Swiss equity quota at a new low real estate continues at a new high Significant
Isle Of Wight half year business confidence report
 half year business confidence report half year report contents new company registrations closed companies (dissolved) net company growth uk company share director age director gender naming trends sic
Emerging Trends in the U.S. and Colorado Economies
 Emerging Trends in the U.S. and Colorado Economies Alison Felix Economist and Branch Executive Federal Reserve Bank of Kansas City Denver Branch The views expressed are those of the presenter and do not
ECONOMIC CURRENTS. Vol. 2, Issue 1 THE SOUTH FLORIDA ECONOMIC QUARTERLY. Introduction. In this Issue:
 ECONOMIC CURRENTS THE SOUTH FLORIDA ECONOMIC QUARTERLY Vol. 2, Issue 1 Introduction Economic Currents provides an overview of the South Florida regional economy. The report combines current employment,
MBA Forecast Commentary Joel Kan
 MBA Forecast Commentary Joel Kan Economy & Labor Markets Strong Enough, First Rate Hike Expected in December MBA Economic and Mortgage Finance Commentary: November 2015 This month s outlook largely mirrors
Real Estate Market. Lawrence Yun, Ph.D. Presentation to New England REALTORS Conference. February 2, 2010 NATIONAL ASSOCIATION OF REALTORS
 Real Estate Market Trends & Outlook Lawrence Yun, Ph.D. Chief Economist NATIONAL ASSOCIATION OF REALTORS Presentation to New England REALTORS Conference February 2, 2010 Housing Stimulus Impact Tax Credit
BANK OF GUYANA. BANKING SYSTEM STATISTICAL ABSTRACT Website:
 BANK OF GUYANA BANKING SYSTEM STATISTICAL ABSTRACT Website: www.bankofguyana.org.gy RESEARCH DEPARTMENT March 2010 STATISTICAL ABSTRACT TABLES CONTENTS 1. MONETARY AUTHORITY 1.1 Bank of Guyana: Assets
Annual Report FY2009
 February 2010 February 2010 Georgia Department of Revenue Georgia Georgia Department Department of of Revenue Revenue Property Tax Administration Statistical Report FY2009 Property Annual Report Tax FY2009
M onthly arket. May Table of Contents. Monthly Highlights
 Table of Contents Market Inventory...2 www.gaar.com Monthly Highlights The median sales price for single-family, detached homes held at $165,000 for the second consecutive month. The number of properties
The next recession will not be. The Great Recession. Damon Runberg, Economist Oregon Employment Department
 The next recession will not be The Great Recession Damon Runberg, Economist Oregon Employment Department Why the fears? Simplified Business Cycle Peak 2 consecutive quarters of GDP declines Wages Rise
Cash & Liquidity The chart below highlights CTA s cash position at December 2017 compared to December 2016.
 To: Chicago Transit Authority Board From: Jeremy Fine, Chief Financial Officer Re: Financial Results for December 2017 Date: February 14, 2018 I. Summary CTA s financial results are $4.7 million favorable
AJC Celebrating Teachers Awards CONTEST OFFICIAL RULES
 AJC Celebrating Teachers Awards CONTEST OFFICIAL RULES 1. NO PURCHASE NECESSARY TO ENTER OR TO WIN. ALL FEDERAL, STATE, LOCAL AND MUNICIPAL LAWS AND REGULATIONS APPLY. VOID WHERE PROHIBITED. 2. Eligibility.
Board of Directors October 2018 and YTD Financial Report
 Board of Directors October 2018 and YTD Financial Report Consolidated Financial Results Operating Margin October ($30,262) $129,301 ($159,563) Year-to-date $292,283 $931,358 ($639,076) Excess of Revenue
Cash & Liquidity The chart below highlights CTA s cash position at March 2017 compared to March 2016.
 To: Chicago Transit Authority Board From: Jeremy Fine, Chief Financial Officer Re: Financial Results for March 2017 Date: May 10, 2017 I. Summary CTA s financial results are $0.6 million favorable to budget
Review of Regional Market Conditions in the Greater Piedmont Area
 Review of Regional Market Conditions in the Greater Piedmont Area Greater Piedmont Area Association of Realtors June 7, 2010 Virginia Housing Development Authority Overview of Current Market Conditions
Mechanics of Cash Flow Forecasting
 Texas Association Of State Senior College & University Business Officers July 13, 2015 Mechanics of Cash Flow Forecasting Susan K. Anderson, CEO Anderson Financial Management, L.L.C. 130 Pecan Creek Drive
Factor Leave Accruals. Accruing Vacation and Sick Leave
 Factor Leave Accruals Accruing Vacation and Sick Leave Factor Leave Accruals As part of the transition of non-exempt employees to biweekly pay, the UC Office of the President also requires standardization
GIMA Pulse Date of Report: 04/12/2017 a monthly snapshot of the UK Economy from
 GIMA Pulse Date of Report: 04/12/2017 a monthly snapshot of the UK Economy from www.barometeroftrade.com Summary Inflation has slowed after reaching a 5-year-high last month, largely due to the weak performance
QUARTERLY REPORT AND CERTIFICATION OF THE COUNTY TREASURER For Quarter Ending June 30, 2009 COMPLIANCE CERTIFICATION
 QUARTERLY REPORT AND CERTIFICATION OF THE COUNTY TREASURER For Quarter Ending June 30, 2009 The Government Code requires the County Treasurer to render a Quarterly Report to the County Administrator, the
METROPOLITAN NORTH GEORGIA WATER PLANNING DISTRICT ATLANTA, GEORGIA FINANCIAL STATEMENTS
 METROPOLITAN NORTH GEORGIA WATER PLANNING DISTRICT ATLANTA, GEORGIA FINANCIAL STATEMENTS For the Year Ending December 31, 2017 METROPOLITAN NORTH GEORGIA WATER PLANNING DISTRICT TABLE OF CONTENTS Page(s)
Cash & Liquidity The chart below highlights CTA s cash position at September 2017 compared to September 2016.
 To: Chicago Transit Authority Board From: Jeremy Fine, Chief Financial Officer Re: Financial Results for September 2017 Date: November 15, 2017 I. Summary CTA s financial results are $7.7 million favorable
Constructing a Cash Flow Forecast
 Constructing a Cash Flow Forecast Method and Worked Example A cash flow forecast shows the estimates of the timing and amounts of cash inflows and outflows over a period of time. The sections of a cash
Common stock prices 1. New York Stock Exchange indexes (Dec. 31,1965=50)2. Transportation. Utility 3. Finance
2. Transportation. Utility 3. Finance") Digitized for FRASER http://fraser.stlouisfed.org/ Federal Reserve Bank of St. Louis 000 97 98 99 I90 9 9 9 9 9 9 97 98 99 970 97 97 ""..".'..'.."... 97 97 97 97 977 978 979 980 98 98 98 98 98 98 987 988
Digitized for FRASER http://fraser.stlouisfed.org/ Federal Reserve Bank of St. Louis 000 97 98 99 I90 9 9 9 9 9 9 97 98 99 970 97 97 ""..".'..'.."... 97 97 97 97 977 978 979 980 98 98 98 98 98 98 987 988
Consumer Price Index (Base year 2014) Consumer Price Index
 Consumer Price Index") Consumer Price Index December 2017 (Base year 2014) Consumer Price Index 1 Release Date: January 2018 Detailed by: Expenditure groups Household welfare levels Household type Regions Briefing This publication
Consumer Price Index December 2017 (Base year 2014) Consumer Price Index 1 Release Date: January 2018 Detailed by: Expenditure groups Household welfare levels Household type Regions Briefing This publication
Economic Outlook: Grand Strand Economy
 Economic Outlook: Grand Strand Economy 20 th Annual Economic Growth and Real Estate Summit Pine Lakes Country Club, September 29, 2017 Robert F. Salvino, Ph.D. E. Craig Wall Sr. College of Business Coastal
OTHER DEPOSITS FINANCIAL INSTITUTIONS DEPOSIT BARKAT SAVING ACCOUNT
 WEIGHTAGES JAN FEB MAR APR MAY JUN JUL AUG SEPT OCT NOV DEC ANNOUNCEMENT DATE 19.Dez.14 27.Jän.15 24.Feb.15 26.Mär.15 27.Apr.15 26.Mai.15 25.Jun.15 28.Jul.15 26.Aug.15 23.Sep.15 27.Okt.15 25.Nov.15 MUDARIB
Consumer Price Index (Base year 2014) Consumer Price Index
 Consumer Price Index") Consumer Price Index December 2016 (Base year 2014) Consumer Price Index 1 Release Date: January 2017 Detailed by: Expenditure groups Household welfare levels Household type Regions Briefing This publication
Consumer Price Index December 2016 (Base year 2014) Consumer Price Index 1 Release Date: January 2017 Detailed by: Expenditure groups Household welfare levels Household type Regions Briefing This publication
FY18 Federal Special Education Preliminary Estimates District FY18 IDEA 611 IDEA 619 Preschool Parent Mentors TOTAL FY18 TOTAL FY17 District Name
 601 Appling County $ 713,431 $ 31,784 $ 12,500 $ 757,715 $ 759,745 602 Atkinson County $ 349,156 $ 19,746 $ - $ 368,902 $ 368,943 603 Bacon County $ 407,773 $ 17,970 $ - $ 425,743 $ 433,200 604 Baker County
New Mexico Continues to Struggle: Las Cruces doing better
 New Mexico Continues to Struggle: Las Cruces doing better Christopher A. Erickson, Ph.D. Department of Economics and International Business College of Business New Mexico State University Chrerick@nmsu.edu
Small Group Plan Guide. New Plan Designs: a streamlined product portfolio offering flexible plan pairings to meet the needs of small business
 Small Group Plan Guide New Plan Designs: a streamlined product portfolio offering flexible plan pairings to meet the needs of small business EFFECTIVE AS OF APRIL 1, 2012 different is good nlike your other
THDA STIMULUS SECOND MORTGAGE PROGRAM REPORT
 January, 2011 STIMULUS SECOND MORTGE PROAM REPORT Hulya Arik, Ph.D., Research Coordinator DIVISION OF RESEARCH, PLANNING & TECHNICAL SERVICES Tennessee Housing Development Agency 404 James Robertson Parkway,
MARIETTA DAILY JOURNAL CHEROKEE TRIBUNE NEIGHBOR NEWSPAPERS
 2015 Media Guide PERSONNEL Otis A. Brumby III Publisher otis3@mdjonline.com Lee Garrett General Manager lgarrett@mdjonline.com Editorial Board Otis A. Brumby III Publisher Lee Garrett General Manager Joe
BUDGET UPDATE September 2009 Volume 1, Issue 1
 BUDGET UPDATE September 2009 Volume 1, Issue 1 Cobb County School District, Financial Services Division http://www.cobbk12.org/centraloffice/finance/budget.htm About the Budget Process The development
Performance Report October 2018
 Structured Investments Indicative Report October 2018 This report illustrates the indicative performance of all Structured Investment Strategies from inception to 31 October 2018 Matured Investment Strategies
GIMA Pulse Date of Report: 05/07/2018 a monthly snapshot of the UK Economy from
 GIMA Pulse Date of Report: 05/07/2018 a monthly snapshot of the UK Economy from www.barometeroftrade.com Summary Oil prices have risen to even greater heights than the previous month following Donald Trump's
Investit Software Inc. INVESTOR PRO CANADA 20 UNIT CONDOMINIUM DEVELOPMENT EXAMPLE
 INVESTOR PRO CANADA 20 UNIT CONDOMINIUM DEVELOPMENT EXAMPLE INTRODUCTION This example uses the Development Condominium template. This practice example consists of two Sections; 1. The input information
Data current as of: June 3, ,000, , , , , , , , , , , , , ,000
 Forecast current as of: Spring 214 Economic Indicators The unemployment rate fell by a large margin (.4 percentage points) in April. Total employment rose by 288, jobs. There were 32, construction jobs
CoreLogic S&P Case-Shiller Home Price Index Update A Compass Report for the San Francisco Metro Area, January 29, 2019
 CoreLogic S&P Case-Shiller Home Price Index Update A Compass Report for the San Francisco Metro Area, January 29, 2019 The CoreLogic S&P Case-Shiller Home Price Index does not evaluate median sales price
Voya Indexed Universal Life-Protector
 calculation examples Values as of 07/28/2018 Voya ed Universal Life-Protector Issued by Security Life of Denver Insurance Company Required training! VFA Registered Representatives must review the Required
FY19 Title I Allocation and Set Asides
 (FY19 601 Appling County $ 1,229,713 $ 5,816 $ 49,085 $ 1,284,614 $49,340 $12,846 3.75 $46,431 602 Atkinson County $ 786,161 $ 3,972 $ 31,171 $ 821,304 $0 $8,213 4.12 $32,498 603 Bacon County $ 758,895
August 2017 MLS Statistical Report. Median Sale Price
 August 217 MLS Statistical Report Median Sale Price $4, $3, $2, $1, $ 212 213 214 2 216 217 Summary Median Home Price: Over the last years, median home prices have risen by 23%; however, much of the increase
HIPIOWA - IOWA COMPREHENSIVE HEALTH ASSOCIATION Unaudited Balance Sheet As of July 31
 Unaudited Balance Sheet As of July 31 Total Enrollment: 407 Assets: Cash $ 9,541,661 $ 1,237,950 Invested Cash 781,689 8,630,624 Premiums Receivable 16,445 299,134 Prepaid 32,930 34,403 Assessments Receivable
HIPIOWA - IOWA COMPREHENSIVE HEALTH ASSOCIATION Unaudited Balance Sheet As of January 31
 Unaudited Balance Sheet As of January 31 Total Enrollment: 371 Assets: Cash $ 1,408,868 $ 1,375,117 Invested Cash 4,664,286 4,136,167 Premiums Receivable 94,152 91,261 Prepaid 32,270 33,421 Assessments
City of Justin NOVEMBER
 City of Justin MONTHLY FINANCIAL REPORT NOVEMBER - 2018 1 Revenues: Sales tax revenue is up 14.5% from this time prior year and November s sales tax collections increased 2.4% from November 2017. The City
The equity derivatives market: The state of the art
 The equity derivatives market: The state of the art Susan Thomas susant@igidr.ac.in http://www.igidr.ac.in/~susant August 11, 2001 Turnover Page 1 of 19 Goals Index futures Index options Stock options
Asset Manager Performance Comparison
 Cape Peninsula University of Technology Retirement Fund August 2017 DISCLAIMER AND WARNINGS: Towers Watson (Pty) Ltd, a Willis Towers Watson company, is an authorised financial services provider. Although
Consumer Price Index (Base year 2014) Consumer Price Index
 Consumer Price Index") Consumer Price Index July 207 (Base year 204) Consumer Price Index Release Date: Augest 207 Detailed by: Expenditure groups Household welfare levels Household type Regions Briefing This publication provides
Consumer Price Index July 207 (Base year 204) Consumer Price Index Release Date: Augest 207 Detailed by: Expenditure groups Household welfare levels Household type Regions Briefing This publication provides
HART Financial Snapshot. HART Finance and Audit Committee January 23, 2017
 HART Financial Snapshot HART Finance and Audit Committee January 23, 2017 1 Requested January 3, 2017 Cash flow management overview Fund balance update including year end fund balance reported in the past
Asset Manager Performance Comparison
 Cape Peninsula University of Technology Retirement Fund September 2017 DISCLAIMER AND WARNINGS: Towers Watson (Pty) Ltd, a Willis Towers Watson company, is an authorised financial services provider. Although
Mortgage Trends Update
 Mortgage Trends Update UK Finance: Mortgage Trends Update December 218 of first-time reaches 12-year high in 218 Key data highlights: There were 37, new first-time buyer mortgages completed in 218, some