September With regularly updated data and charts downloadable here. September 2014 I 1. Social Europe I Quarterly Review
|
|
|
- Alexia Owen
- 5 years ago
- Views:
Transcription


1 With supplements on: - Human capital availability across the EU skills perspective - Towards a better measurement of welfare and inequalities With regularly updated data and charts downloadable here September 2014 September 2014 I 1
2 This Quarterly Review provides in-depth analysis of recent labour market and social developments. It is prepared by the Employment Analysis and Social Analysis Units in DG EMPL. This review was prepared under the supervision of G. Fischer (Director), R. Strauss (Head of Unit) and R. Maly (Head of Unit). The main contributors were: D. Arranz, L. de Dominicis, M. Grzegorzewska, E. Joseph, G. Lejeune, and E. Meyermans. The box on Main messages on regional labour markets from the 6 th Report on economic, social and territorial cohesion was a special contribution by Lewis Dijkstra and Domenico Gullo (DG Regio, Unit B.1). The supplement on Human capital availability across the EU- skills perspectives was a special contribution by P. Badea, P. Pasimeni, J. Peschner, L. Rathe and M. Velikonja; the supplement Towards a better measurement of welfare and inequalities was a special contribution by M. Grzegorzewska. The Annex on selected research was coordinated by B. Paul. General reviewing support was provided by I. Maquet-Engsted and A. Xavier. Editorial support was provided by A. Ujj. A wide combination of information sources have been used to produce this report, including Eurostat statistics (see [codes] mentioned under the charts, to be used with the Eurostat data search engine: reports and survey data from the Commission s Directorate-General for Economic and Financial Affairs, and Eurofound. Underlying data and charts are available at: Employment and social analysis portal: Contact: empl-analysis@ec.europa.eu Neither the European Commission nor any person acting on behalf of the Commission may be held responsible for the use that may be made of the information contained in this publication. Europe Direct is a service to help you find answers to your questions about the European Union Freephone number (*): (*) Certain mobile telephone operators do not allow access to numbers or these calls may be billed. More information on the European Union is available on the Internet ( Cataloguing data as well as an abstract can be found at the end of this publication. Luxembourg: Publications Office of the European Union, 2014 ISBN ISSN doi: /39856 European Union, 2014 Reproduction is authorised provided the source is acknowledged. September 2014 I 2
3 Table of Contents 1. Macroeconomic and employment developments and outlook Employment in the EU and its Member States Unemployment in the EU and in Member States Long-term unemployment, additional potential labour force and underemployment Household income and financial situation Productivity, wages and hours worked Labour demand: vacancies, labour shortages and hiring activity Labour market and social situation for youth Supplement: Human capital availability across the EU skills perspective Supplement 2: Towards a better measurement of welfare and inequalities Annex 1: Real GDP growth, real GDHI growth and its main components for selected Member States Annex 2: Real GDP growth, employment growth and unemployment rates in the EU Member States Annex 3: Contribution to employment change in the EU Annex 4: Employment growth by sectors in the euro area and by EU Member States 86 Annex 5: Beveridge curves, by Member State Annex 6: Selected research September 2014 I 3
4 List of country codes EU Member States AT: Austria BE: Belgium BG: Bulgaria CY: Cyprus CZ: Czech Republic DE: Germany DK: Denmark EE: Estonia EL: Greece ES: Spain FI: Finland FR: France HR: Croatia HU: Hungary IE: Ireland IT: Italy LT: Lithuania LU: Luxembourg LV: Latvia MT: Malta NL: The Netherlands PL: Poland PT: Portugal RO: Romania SE: Sweden SI: Slovenia SK: Slovakia UK: United Kingdom Further afield: AUT: Australia CA: Canada JP: Japan KO: South Korea NO: Norway RF: Russian Federation US: United States September 2014 I 4
5 September 2014 I 5
6 Executive summary Employment in the European Union (EU) has continued to grow at a steady pace and in most sectors. There has been an increase in the average number of hours worked and, for the first time since the third quarter of 2011, there was a small increase in the number of full-time contracts. Youth unemployment rates have decreased in most EU Member States and financial distress is continuing to ease, now also for the lowest income groups. In contrast, the gradual fall in unemployment rates observed since mid may have halted, as of June, and unemployment rates still remain close to historically high levels. Addressing long-term and very long-term unemployment is a major challenge in the context of the EU labour market recovery. The long-term unemployed make-up a significant share of total unemployment in the EU and although stable at the EU level the long-term unemployment rate is increasing in those Member States where it is already very high. It remains the case that much of the job creation is associated with the continuous increase in part-time and temporary contracts. The EU's tentative recovery appears to have lost some momentum and, therefore, future developments in employment remain uncertain. This highlights the importance of continued policy intervention to support the macro-economic and employment recovery in the EU and to improve the social situation of the population. The economic recovery which started in the EU in the spring of 2013 remains fragile and appears to have lost some momentum. Forecasts for 2014 and 2015 have recently been revised downwards, in particular for the euro area (EA). In the second quarter of 2014 GDP remained stable in the EA and increased moderately (+0.2%) in the EU. Output growth in the EA in particular, was pulled down by the weak performance of the three main economies: Germany, France and Italy. Employment has grown steadily in the EU since mid-2013, increasing by 0.2 % in the first quarter and 0.3 % in the second quarter of In the second quarter of 2014, employment increased in the large majority of EU Member States, including in countries with very high unemployment rates such as Spain and Portugal. The employment situation appears to have stabilised in Greece. In the year to the second quarter of 2014 employment increased by 0.7% in the EU, although developments at the EU level hide marked differences between Member States. Employment has improved across the large majority of the sectors, with a significant increase in the services sectors. Importantly, employment is growing in those sectors which employ the majority (around 65%) of the workers in the EU, namely wholesale, public administration, health care and social services and industry. Employment in the construction sector also registered a moderate increase in the second quarter of 2014, but was nonetheless at a lower level than a year earlier (-0.5% year-on-year change). The increase in EU employment observed in the year to the first quarter of 2014 (+0.6%) could be seen as the combined outcome of three main factors. First, more than half of the annual increase was attributable to an increase in temporary contracts (+2.6%). Second, parttime work, which never declined throughout the crisis, had, continued to increase (+0.9%). Finally, and for the first time in the EU since the third quarter of 2011, there was an increase in the number of people working full time (+0.3%), equivalent to around more people (mainly women aged 40-64) working full time. The trend of falling unemployment rates appears to have lost pace and nearly stabilised. The EU unemployment rate was 10.2% in August 2014 (or 24.6 million people), the lowest value since February It was stable in the euro area at 11.5%, with million people out of work and actively seeking a job. It is likely to be quite some time before unemployment returns to the pre-crisis level, especially given the weak economic growth and the increasing labour market participation currently seen in Europe. In the first quarter of 2014, the activity rate for people aged in the EU was 72.1%, a rate 0.5 percent points (pp) higher than one year ago, and 1.8 pp higher than in In the year to the first quarter of September 2014 I 6
7 2014 there was a moderate increase in the activity rate in the EU among all groups (by age, gender and skill level), with the exception of young people and the low-skilled. Long-term unemployment is a growing problem in the EU. Addressing long-term unemployment is an increasingly difficult challenge. Being out of work for an extended period reduces individuals' general and sector-specific skills and increases the probability of their becoming discouraged and looking less actively for jobs. In the first quarter of 2014, a total of 12.9 million people (5.3% of the labour force) had been unemployed for at least one year and more than half of these had been unemployed for more than two years. Long-term unemployment rates have reached historic highs in Greece and Spain and worryingly they are not decreasing. It is therefore a priority to ensure that the long-term unemployed do not become detached from the labour market and are swiftly brought back into employment. Labour market developments in the EU paint a mixed picture. The latest developments in the labour market have brought some good news: the ratio of people unemployed to the job hiring has fallen in the year to the first quarter of 2014, indicating improving job prospects overall, but there is still evidence of poor job opportunities in some Member States. The job vacancy rate also increased moderately over the year to the second quarter of 2014 (+0.1 pp), with a higher rate recorded for services (2.1%) than for industry and construction (1.1%). Nevertheless, recent data indicate both positive and negative developments in the matching process in the EU labour market. The recent fall in unemployment and increase in the indicator of labour shortage is equivalent to the usual move along the Beveridge curve and confirms the development suggested by the higher job vacancy rate. At the same time, however, the Beveridge curve has shifted upwards, compared to its typical position up to the start of 2010, suggesting that the matching process has worsened in the EU labour market. The unemployment rate of young people shows a significant fall in most EU Member States. At 21.6%, in August 2014, the EU unemployment rate for those aged 15 to 24 was more than twice the overall unemployment rate in the EU. Several of the Member States with very high youth unemployment rates recorded significantly lower levels compared to a year ago. Nevertheless, youth unemployment is very high and increasing in Italy. Youth unemployment rates in the EU range from around 10% or less in Member States less affected by labour market deterioration (e.g. Austria and Germany) to more than half of the young people active in the labour market in countries such as Greece and Spain, where youth unemployment is now nearly three times higher than in The employment rate of young people nevertheless declined from 37% in 2008 to 32% in the first quarter of More than 40% of young employees were on a temporary contract, 3.5 times more than amongst prime-age adults (25-54 years old), and nearly a quarter of young people work part-time, up from less than 20% in It should be noted that the decline in employment cannot be explained by more young people going into education, as the rate of young people not in education, employment or training (NEET) increased from 11% in 2008 to nearly 13% in The growth in gross disposable household income (GDHI) in the EU has also slowed in the first quarter of 2014, with a year-on-year increase for this quarter of 0.4%. Recent growth in GDHI has been driven by increases in income from work resulting from the growth in employment. In contrast, income from property has stagnated, taxes and social contributions have increased and social benefits have remained stable (as it usually happens in periods of increasing employment). Among large Member States, household income continued to rise in Germany and the UK, while it fell in Italy, Poland and Spain, contributing to the overall more moderated overall growth in GDHI in real terms. Financial distress continued to ease in the EU in the second quarter of 2014, falling below the levels seen in mid More importantly, financial distress has finally eased for lowincome households. This reflects a fall in the share of the population reporting the need to run into debt, while the share of households reporting that they had to draw on their savings remained stable. Growth in labour productivity slowed in the EU in the second quarter of 2014, mainly as a result of weak output growth. Growth in nominal unit labour cost, which affects domestic prices and international competitiveness, remained subdued in the euro area as a whole, primarily reflecting weak growth in compensation per employee. Nevertheless, notable differences between Member States in the euro area remain, with Cyprus and Greece recording September 2014 I 7
8 sharp contractions and Estonia a significant increase. Growth in real unit labour cost (which is also a measure of the labour income share) regained growth momentum in the euro area and in the EU as a whole, with Spain showing some increase after several years of persistent decreases. Overall, while recent data continue to show some positive and very welcome labour market developments, the economic recovery remains fragile, giving grounds for caution for the future. Two supplements accompany this issue of the Quarterly Review. The first supplement gives an overview of the level of human capital endowment in the EU from the skills perspective and provides information about the skills proficiency of various socio-demographic groups across EU Member States. Developing relevant skills, activating the existing skills supply and putting skills to effective use are essential in order for economies to be able to increase productivity, improve international competitiveness and generate sustainable and inclusive economic growth. The results show that the best performing countries in the EU (Finland, Sweden and the Netherlands) are too few in number and too small to improve overall EU results. The average scores of the six largest EU countries, representing more than two thirds of the total EU population, are behind those of some of the EU's main competitors (Japan, Canada, Korea and even the US in literacy). Recent research by the OECD 1 and the European Commission 2 shows that not only formal education, but also training received and skills acquired during the working life improve an individual s chances of having a job and influence the quality of the job itself. Skills proficiency, beyond that acquired through initial education, is positively and independently associated with the individual s probability of participating in the labour market, being employed, having higher wages and showing better social outcomes. 1 Work history also has a particularly strong impact on person s level of skills. Those who have been in paid work for most of their working life perform better in tests than those who have been unemployed for considerable periods of time. 2 The second supplement reviews and discusses a set of indicators of welfare and inequalities, in order to provide a more comprehensive measure of societies' growth that encompasses not only economic performance but also progress in other important dimensions of sustainable and inclusive growth. Specifically, the supplement examines developments in GDP per capita, average household income, median household income, as well as inequality and inequality-adjusted GDP per capita growth across the EU. Income indicators improved across the EU during the pre-crisis period of economic expansion. Nonetheless, economic growth did not benefit all households equally and did not contribute to the reduction of inequality in all Member States. The economic crisis then saw GDP per capita and household incomes decline across the EU, and in many Member States they have not yet returned to the pre-crisis levels. In view of the increasing complexity of the information presented by these indicators and the increasingly divergent situation seen across the EU, analysis for selected Member States has also been included in the supplement. A tool is provided to facilitate access to regularly updated underlying data, charts and tables. Files in the Excel format, which are now available online, make it easy to access data and import charts and tables. Data will be refreshed shortly after their release by Eurostat - for instance unemployment will be updated at the beginning of each month, figures based on the Labour Force Survey LFS will be updated in mid-april, July, October, and January. Data used in the current document are available at: 1 Quintini, G. (2014), Skills at Work: How Skills and their Use Matter in the Labour Market, OECD Social, Employment and Migration Working Papers, No. 158, OECD Publishing. 2 "Employment and Social Developments in Europe 2014" (Annual ESDE Review, forthcoming 2014) September 2014 I 8
9 Latest labour markets and social trends in the EU28 (EA18) Real GDP 2013Q2 2013Q3 2013Q4 2014Q1 2014Q2 (% change on previous quarter, SA) 0.4 (0.3) 0.3 (0.1) 0.4 (0.3) 0.3 (0.2) 0.2 (0.0) (% change on previous year, NSA) 0.1 (-0.5) 0.6 (0.1) 0.8 (0.5) 1.5 (0.9) 1.3 (0.5) Employment growth (% change on previous quarter, SA) 0.0 (-0.1) 0.1 (0.0) 0.2 (0.1) 0.2 (0.1) 0.3 (0.2) (% change on previous year, NSA) -0.5 (-1.0) -0.3 (-0.7) 0.0 (-0.4) 0.6 (0.1) 0.7 (0.4) Employment rate (15-64) (% of working-age population, NSA) 64.1 (63.6) 64.6 (63.9) 64.4 (63.7) 64.1 (63.2) NA (% change on previous year, NSA) -0.1 (-0.4) 0.1 (-0.2) 0.3 (0.0) 0.7 (0.2) NA Employment rate (20-64) (% change on previous quarter, SA) 68.4 (67.8) 68.8 (68.1) 68.7 (67.9) 68.4 (67.5) NA (% change on previous year, NSA) -0.2 (-0.2) 0.0(-0.2) 0.3 (0.0) 0.8 (0.3) NA Gross disposable households income (% change on previous year, NSA) -0.8 (-1.1) -0.1 (-0.3) 0.8 (0.8) 0.4 (0.2) NA Labour productivity (% change on previous year, SA) 0.4 (0.5) 0.5 (0.5) 1.1 (0.9) 0.9 (0.8) 0.4 (0.2) Nominal unit labour cost (% change on previous year, SA) 0.7 (1.2) -0.3 (1.2) -0.3 (0.7) 1.0 (0.4) 1.1 (0.9) Long-term unemployment rate (% labour force, NSA) 5.1 (5.9) 5.0 (5.8) 5.3 (6.2) 5.3 (6.3) NA (% change on previous year, NSA) 0.5 (0.7) 0.1 (0.6) 0.1 (0.6) 0.2 (0.3) NA 2013 Aug 2014 May 2014 Jun 2014 Jul 2014 Aug Unemployment rate (SA) Total (% labour force) 10.8 (12.0) 10.3 (11.6) 10.2 (11.5) 10.2 (11.5) 10.1 (11.5) Men 10.8 (11.9) 10.2 (11.5) 10.1 (11.4) 10.1 (11.4) 10.0 (11.2) Women 10.8 (12.0) 10.4 (11.8) 10.3 (11.7) 10.3 (11.7) 10.3 (11.7) Youth (% labour force aged 15-24) 23.5 (23.9) 22.0 (23.3) 21.9 (23.2) 21.7 (23.2) 21.6 (23.3) Source: Eurostat, DG EMPL own calculations. Note: SA = seasonally adjusted NSA = non-seasonally adjusted; NA: not available. September 2014 I 9
10 1. Macroeconomic and employment developments and outlook The tentative recovery in the EU comes to a halt The tentative recovery that began in the EU in the spring of 2013 appears to have lost some momentum. In the second quarter of 2014 GDP remained stable in the euro area (EA) and increased only moderately (+0.2%) in the European Union (EU) as a whole. Economic activity in the EA was pulled down by the weak performance of the three largest economies: Germany, France and Italy. In the year to the second quarter of 2014, GDP rose by 1.2% in the EU and by 0.7% in the EA. A growing divergence is emerging between the major world economies. Whilst the solid recovery continues in the United States (US), growth remained subdued in the EU, particularly in the euro area. 3 Europe is still failing to make significant progress in closing the economic divide with the US. In the second quarter of 2014, GDP increased in the US by 1.0% on the previous quarter, and by 2.5% compared with the same quarter of 2013 (Chart 1). Chart 1: Real GDP in the EU, euro area and US (left axis), and percentage changes over the previous quarter (right axis) Weak growth in Europe could undermine the weak recovery in the labour market, as growth in household income also slows. Contrary to the previous quarter where for the first time since 2011 GDP, household income and employment all saw steady growth, data for the second quarter of 2014 paint a less optimistic picture. While the upward trend in employment continued, with the number of people employed growing at an increasing pace, GDP growth has decelerated, 4 as has the growth in the gross disposable household income (GDHI). GDHI growth weakened in real terms in the first quarter of The growth rate over the year to the first quarter of 2014 was 0.4% (compared to a year-on-year change of 0.8% in the previous quarter). Chart 2: Real GDP growth, real GDHI growth and employment growth (number of persons employed) in the EU, year-on-year change. Source: Eurostat, National Accounts, data nonseasonally adjusted [namq_gdp_k, namq_aux_pem, nasq_nf_tr and namq_fcs_p] (DG EMPL calculations for GDHI) Click here to download chart. Source: Eurostat, National Accounts, data seasonally adjusted [namq_gdp_k] Click here to download chart. Positive GDP growth in the large majority of EU Member States was not enough to offset the weak performance in some of the largest EU economies GDP growth in the second quarter of 2014 was again positive in the large majority of EU Member States. Among the largest EU economies, the UK (+0.8%), the Netherlands (+0.5%) and Spain (+0.6%) experienced relatively significant growth compared to the first quarter of For more details see: OECD Interim Economic Assessment, available at: 4 The real GDHI growth for the EU is DG EMPL estimation, and it does not include Member States for which quarterly data are missing (11 Member States). The nominal GDHI is converted into real GDHI by deflating with the deflator (price index) of household final consumption expenditure. The real GDHI growth is a weighted average of real GDHI growth in Member States. September 2014 I 10
11 However, the growth in GDP in most EU Member States was not enough to offset the weak economic performance of their larger peers. Chart 3: Real GDP growth in the second quarter of 2014 or according to the latest data available, by EU Member State The fall in GDP in Germany (-0.2%), the first quarterly contraction in over a year, was mostly driven by foreign trade, and a decline in investments in construction. No growth was seen in the French economy for the second quarter in a row, whilst in Italy GDP fell by 0.2%, following a decline of 0.1% in the first quarter of Of the Member States for which data are available for the second quarter of 2014, Malta (+1.3%), Latvia, Slovenia (both +1.0%), Lithuania, Hungary and the UK (all +0.8%) recorded the highest GDP growth compared with the previous quarter. Romania (-1.0%), Denmark and Cyprus (both -0.3%), Germany and Italy (both -0.2%) registered the largest decreases. 5 Source: Eurostat, National Accounts, data seasonally adjusted [namq_gdp_k] Notes: Data are consistent with the EUROSTAT press release of the 5 th of September 2014, available here For IE and LU data refer to the first quarter of 2014; for HR no recent data available for quarter changes. The trend of falling unemployment that began in summer 2013 in the EU and in autumn 2013 in the euro area also appears to have lost pace and nearly stabilised. The EU unemployment rate was 10.1% in August 2014, the lowest value since February It was stable in the euro area at the same level of June and July 2014, i.e. 11.5%. At this pace, it is likely to be some time before we see a return to the pre-crisis levels, especially given that recent GDP figures confirm a weak growth for the second quarter of Instead, in the US the unemployment rate was 6.2% in July 2014, down from 7.3% (-1.1 pp) in July We have not commented on data for Greece as they are non-seasonally adjusted or for Ireland as they refer to 2014Q1. September 2014 I 11
12 Chart 4: Unemployment rates in the EU, euro area, and the US. Table 1: Recent forecasts for growth and unemployment in the EU and euro area. EU-28 Institute date gr. '14 gr. '15 UR '14 UR '15 IMF 24-Jul NA NA NA NA Commission 05-May OECD 15-Sep NA NA NA NA ECB 05-Sep NA NA NA NA euro area Institute date gr. '14 gr. '15 UR '14 UR '15 IMF 24-Jul NA NA Commission 05-May OECD 15-Sep NA NA ECB 05-Sep Source: Eurostat, series on unemployment, data seasonally adjusted [une_rt_m] Click here to download chart. Outlook Third-quarter setback in confidence indicators and Purchasing Managers Index The Commission's economic sentiment indicator fell in the third quarter of 2014, returning (in August) to the level seen in January of this year. This fall was broadbased across sectors, except for construction, where sentiment continued its steady recovery from a low level. Similarly, the euro-area Purchasing Managers Index (PMI) composite output index fell to its lowest level of the year, but remained clearly above the level which separates growth from contraction. As was the case for the sentiment indicators, the drop in PMI was more marked in manufacturing than in the service sector, probably due to the greater vulnerability of the former to the uncertainty linked to increasing geopolitical tensions in the Ukraine and the Middle East. Disappointing second-quarter data affect GDP outlook for the remainder of 2014, but the outlook for unemployment remains unchanged Table 1 shows the most recent forecasts issued for the EU and the euro area by the European Commission and three international institutions: the Organisation for Economic Co-operation and Development (OECD), the European Central Bank (ECB), and the International Monetary Fund (IMF). Source: Diverse forecast documents; "gr." is real GDP growth in %; "UR" is the unemployment rate, in % of the active population. Forecasts were published on 5 May (Commission), 15 September (OECD), 25 July (IMF) and 5 September (ECB). Of the most recent forecasts, those issued by the ECB and the OECD take into account the disappointing second-quarter GDP data and this is reflected in the lower projected GDP growth for the euro-area for 2014 and The OECD significantly downgraded its growth outlook for the euro area for both 2014 (by 0.4 pp) and 2015 (by 0.6 pp). The ECB is, however, slightly more optimistic than the Commission on the euro-area unemployment outlook. According to EU Business Surveys, in the second quarter of 2014, employment prospects in the different sectors (manufacturing, services and construction) improved compared to the previous quarter. Monthly developments in employment prospects have however been quite erratic, which could again be linked to increasing geopolitical tensions. European consumers unsure about the pace of the fall in unemployment The improvement previously seen in consumers expectations for unemployment at EU level has slightly reversed since June, in line with the movement in overall economic sentiment (Chart 5). September 2014 I 12

13 Chart 5: EU consumers expectations for unemployment over the next 12 months and the unemployment rate (the scale varies) Source: European Commission, Business and Consumer Surveys and Eurostat, LFS, data seasonally-adjusted [ei_bosco_m, une_rt_m] Click here to download chart. 2. Employment in the EU and its Member States Employment in the EU has been increasing since mid-2013 The growth in employment seen in the EU since mid-2013 continued with an increase of 0.3% in the second quarter of This follows growth of 0.2% in the first quarter, and brings the increase over the year to the second quarter of 2014 to 0.7%. Despite the recent improvements, employment in the EU remains 2.1 % lower than the level seen in the second quarter of 2008 (Chart 6). In the euro area, employment increased by 0.2 % in the second quarter of 2014, following an increase of +0.1 % in the previous quarter. Euro-area employment in the second quarter of 2014 was 0.4 % higher than a year earlier, but is nonetheless 3.3 % lower than in the second quarter of Chart 6: Employment in the EU28 and the euro area, 2006Q1 to 2014Q2 Employment increased in a large majority of Member States in the second quarter of 2014 In the second quarter of 2014 employment increased in the large majority of EU Member States. A total of 20 Member States saw a positive change over the quarter (compared to 16 in the previous quarter), three saw no change, and two Member States experienced a fall in employment levels (data were available for 25 Member States). In the year to the second quarter of 2014, employment increased in 20 Member States, with particularly strong growth seen in Hungary (+3.1 %), the UK (+2.7 %) and Malta (+2.6 %). Of the larger Member States, the change in employment in the second quarter of 2014 was positive in Spain (+0.7 %), the UK (+0.5 %), Poland (+0.5%), and Italy (+0.2 %), but France saw a third consecutive quarter of stagnation (+0.0%). Estonia (+1.2%) and Portugal (+0.9%) recorded the largest quarter-on-quarter changes (Chart 7). Over the year to the second quarter of 2014, employment decreased in Cyprus (-1.4%), Estonia (-1.2%), Italy (-0.9%), Finland (-0.7%) and Greece (-0.5%). Nevertheless, recent developments are more positive, as in all these countries, with the exception of Cyprus, employment in the second quarter of 2014 has increased compared to a quarter earlier (Chart 7). Source: Eurostat, National Accounts, data seasonally - adjusted [namq_aux_pem] Click here to download chart. September 2014 I 13
14 Chart 7: Employment change in the second quarter of 2014 (year-on-year change and quarterly change) in the EU28, the Euro area and the Member States Industry (+0.3%, year-on-year). Annex 4 reports change in employment, by 10 NACE branches and by Member State. Chart 8: Change in employment in the second quarter of 2014 (top axis) and number of people employed (bottom axis), by 10 NACE branches, in the EU Source: Eurostat, National Accounts [namq_aux_pem]. Notes: Data are consistent with the EUROSTAT press release of 12th September 2014, available here. No recent data for RO, due to ongoing revisions following changes in the census. Quarterly change: For LU and LT data refer to 2014 q1; no data for HR, and SI. Yearly change: For IT, LU and LT data refer to 2014 q1; no data for HR. Click here to download chart. Employment increases in the majority of the sectors Employment improved in all sectors of the economy in the second quarter of 2014, with the exception of financial services and agriculture, with the largest increases seen in the wholesale and retail sector (+0.5%), in the scientific and professional sector (+0.5%) and in industry (+0.4%). In the year to the first quarter of 2014, employment increased particularly strongly in the service sectors. Furthermore, employment is increasing in those sectors which employ the majority (around 65%) of workers in the EU, such as wholesale and retail (+1.2% year-on-year), public administration, health care and social services (+1.0%, year-on-year), and Source: Eurostat, National Accounts, data seasonally adjusted (q-o-q) and non-seasonally adjusted (y-o-y) [namq_nace10_e] Click here to download chart. The number of people starting a new job in the first quarter of 2014 was 3.1 % higher than in the same quarter of a year earlier. Over the year, the number of people starting a new job increased in manufacturing (+13 %), administrative and support service activities (+11.4%), construction (+5.3 %), education (+4.5 %) and accommodation and food service activities (+1.6 %). In the year to the first quarter of 2014 the number of people starting a new job declined in the human health and social work activities sector (-1.9%) (Chart 9). September 2014 I 14
 Click here to download chart.")
15 Chart 9: Number of persons starting a new job in the first quarter of 2014, by NACE economic activity, and year-on-year change. Source: Eurostat, LFS, data non-seasonally adjusted [lfsq_egdn2] (DG EMPL calculations) Click here to download chart. Employment rate 6 in the EU and its Member States EU employment rate increases in the first quarter of 2014 The EU employment rate for the years age group increased by 0.8 pp over the year to the first quarter of 2014, to reach 68.6% (compared to the year-onyear change of +0.2 pp in the previous quarter). The employment rate was 1.8 pp lower than in The employment rate has also increased in the EA, but at a slower pace (+0.3 pp over the year to the first quarter of 2013) to reach a level of 67.8% (Chart 10). Chart 10: Employment rate in the EU28, the euro area and in Member States, first quarter 2014 Source: Eurostat, LFS, data non-seasonally adjusted [lfsi_emp_q] Click here to download chart. 6 For the employment rate section, results for the quarter described are the average of the quarter in question and the three previous ones in order to smooth the seasonality effect. Employment rate has increased in three fourth of the EU Member States In the year to the first quarter of 2014, the employment rate increased in 21 Member States and decreased in six. The largest September 2014 I 15
16 increases were recorded in Croatia (+4.9 pp), Hungary (+4.5 pp) and Portugal (+2.2 pp), while the most significant falls occurred in Cyprus (-1.2 pp) and the Netherlands (-1.0 pp) (Chart 11). Chart 11: Change (pp) in the employment rate (20-64) between Q1 and 2013 Q Q1 in the EU, the euro area and in the Member State but remains below the 2008 level and Europe 2020 target in three quarters of the Member States Despite the recent increases, the employment rate is still below the levels seen in 2008 in three quarters of EU Member States. Spain, Cyprus and Greece have been particularly affected, with falls in their respective employment rates of 9.8 pp, 10.3 pp and 14.0 pp between 2008 and the first quarter of During the same period, the employment rate increased significantly in Germany (+2.9 pp), Hungary (+3.9pp) and Malta (+6.0 pp) (Chart 11). There is a gap of around 27 pp between the highest employment rate in Sweden (79.8%) and the lowest in Greece (53.1%). Source: Eurostat, LFS, data non-seasonally adjusted [lfsi_emp_q] Click here to download chart. Falling employment rates among the youngest and male workers stabilised in the first quarter of 2014 The year-on-year increase in the EU employment rate of 0.8 pp reflects a various developments for different population. The fall in the employment rate amongst young people aged stabilised (+0.0 pp), whilst the employment rate for the prime-age group (aged 25-54, +0.5 pp), and especially for older age groups (aged 55-64, +1.9 pp), increased. The employment rate of those aged (31.5%) remains the lowest among all population groups in the first quarter of When only those aged are considered it rises to 47%. The employment rate amongst men recorded a positive evolution (+0.7 %) in the year to the first quarter of The employment rate of low-skilled people decreased (-0.5 pp, year-on-year) while that of the mediumskilled increased (+0.6 pp) over the year to the first quarter of 2014 (Chart 12). September 2014 I 16
![Chart 12: EU employment rate in 2008, 2013 Q1 and 2014 Q1 by age group, gender and education level Source: Eurostat, LFS, data non-seasonally adjusted [lfsq_ergaed] Click here to download chart.](/docs-images/93/113109975/images/17-0.jpg "Over half of the growth in employment attributable to the increasing use of temporary contracts In the year to the first quarter of 2014, temporary employment increased by 2.")

17 Chart 12: EU employment rate in 2008, 2013 Q1 and 2014 Q1 by age group, gender and education level Source: Eurostat, LFS, data non-seasonally adjusted [lfsq_ergaed] Click here to download chart. Over half of the growth in employment attributable to the increasing use of temporary contracts In the year to the first quarter of 2014, temporary employment increased by 2.6 %, equivalent to workers. Temporary contracts outnumbered permanent contracts, the latter recording an increase of 0.2 % over the year to the first quarter 2014, equivalent to more workers on permanent contracts. Self-employment also increased, with a year-on-year increase of 0.9 % or self-employed workers (Chart 13). Full-time work increases for the first time since 2011 For the first time since 2011 the number of full-time workers (on permanent or temporary contract) in the EU increased by +0.3% in the year to the first quarter of 2014, equivalent to new full-time workers. The number of employees working part-time also increased (+0.9 % in the year to the first quarter of 2014, equivalent to new part-timer workers). Parttime work in the EU has increased by 8.8 % since 2008, while full-time employment decreased by 3.5 % (Chart 14). Chart 13: Employees in permanent and temporary work in the EU, self-employment and total employment (15-64 years) (1 000 employees), , year-on-year change Chart 14: Part-time and full-time employment in the EU (1000 employees), , year-on-year change Source: Eurostat, LFS, data non-seasonally adjusted (DG EMPL calculations) Click here to download chart. Source: Eurostat, LFS, data non-seasonally adjusted (DG EMPL calculations). Click here to download chart. September 2014 I 17
18 3. Unemployment in the EU and in Member States Chart 16: Unemployment rates in the EU Member States in August 2014 and August 2013 The unemployment rate in the EU is gradually falling from a high level and may have stabilised in the euro area The EU unemployment rate has been gradually decreasing since mid-2013, to reach a level of 10.1 % in August The fall in unemployment was larger in the EU (-0.7 pp in August 2014 compared to the same month of previous year) than in the EA (-0.2 pp over the same period). It was 11.5% in the euro area, so at the same level as June and July 2014, which represents 1.75 million fewer unemployed people in the EA as compared to a year earlier (Chart 15). With 24.6 million people out of work and actively seeking a job in the EU, including 18.3 million in the euro area, the level of unemployment remains high, despite the recent positive developments. Chart 15: Total unemployment rate in the EU and euro area (left axis) and youth unemployment rate (right axis): Jan 2007 Aug 2014 Source: Eurostat, series on unemployment, data seasonally adjusted [une_rt_m]. Note: EE,HU (2014M07) EL, UK,LV (2014M06) Click here to download chart. Chart 17: Unemployment rates in the EU Member States in August 2014 and the highest and lowest rates since Source: Eurostat, series on unemployment, data seasonally adjusted [une_rt_m]. Note: EE, HU: July 2014; EL, UK: June 2014; LV: 2014Q2. Click here to download chart. Source: Eurostat, series on unemployment, data seasonally adjusted [une_rt_m] Click here to download chart. Unemployment rates falling in 22 Member States over the year to August 2014 Over the year to August 2014, the unemployment rate fell in 22 Member States and increased in four. The most significant decreases were seen in Hungary (7.8 %, -2.4 pp), Portugal (14%, -2.1 pp) and Spain (24.4%, -1.7 pp). The unemployment rate increased in France (10.7%, +0.3 pp) and Finland (9.2%, +0.5 pp). Over the past three months unemployment has decreased in 21 Member States (Chart 16 and Chart 17). The unemployment rate has fallen for all population groups In the year to August 2014 unemployment decreased among all population sub-groups, with the rate for young people (aged 15-24) falling by 1.9 pp and that for people over 25 by 0.6 pp. A larger decrease was seen in the unemployment rate for men (-0.8 pp) than for women (-0.6 pp). Nonetheless, this recent changes are not enough to compensate for the increase seen since 2008 (Chart 18). September 2014 I 18
 and very long-term unemployment rate (left axis) and the long-term unemployment as a share of total unemployment in the EU, first quarter of 2006 to first quarter of")
19 Chart 18: Change in the unemployment rate in the EU in August 2014, since August 2013 (year-on-year change) and since 2008 change, by age and gender Chart 19: Unemployment rate (left axis), long-term unemployment rate (left axis) and very long-term unemployment rate (left axis) and the long-term unemployment as a share of total unemployment in the EU, first quarter of 2006 to first quarter of 2014 Source: Eurostat, series on unemployment, data seasonally adjusted [une_rt_m]. Click here to download chart. Source: Eurostat, LFS; data seasonally adjusted (unemployment rate) and non-seasonally adjusted (long-term unemployment rates) [une_rt_q and une_ltu_q]. Click here to download chart. 4. Long-term unemployment, additional potential labour force and underemployment 7 Long-term unemployment shows signs of stabilisation in the EU In the first quarter of 2014, long-term unemployment in the EU remains at the same level as in the last quarter of 2013, i.e. 5.3% of the labour force (+0.1 pp compared to the first quarter of 2013). Around 12.9 million people have been unemployed for at least one year. The very long-term unemployment rate (people in unemployment for at least two consecutive years) also remained stable over the quarter (at 3.1% of the labour force, an increase of 0.2 pp on the first quarter of 2013). The very long-term unemployment thus represented around 60% of total longterm unemployment (Chart 19). Long-term unemployment rate stable in most of the Member States Long-term unemployment rates appear to have stabilised in the majority of EU Member States but continue to increase in countries where they are already high, such as Greece, Spain, Italy and Cyprus. In the year to the first quarter of 2014, Cyprus saw the largest increase (+2.0 pp), while long-term unemployment rates are at historically high levels in Greece (19.6%, year-on-year change of +1.9) and Spain (13.6%, +0.9 pp). In contrast, long-term unemployment fell in Latvia (-1.8 pp), Croatia (-1.2 pp) and Ireland (-1.1 pp). 7 Underemployment and additional potential labour force cover the three EUROSTAT supplementary indicators to unemployment: [1] underemployed part-time workers, [2] persons seeking work but not immediately available and [3] persons available for work but not seeking it (i.e. discouraged). See: dex.php/underemployment_and_potential_additional_la bour_force_statistics September 2014 I 19
 data from 2013Q4 Click here to download chart.")

, Hungary (+2.4 pp) and Luxembourg (+1.8 pp). Only Estonia and Denmark, both countries with activity rates well above the EU average, recorded significant decreases (around 1.0 pp).")
20 Chart 20: Long-term unemployment rates and change in long-term unemployment rates in the EU and by Member State associated with low female activity rates - the lowest activity rates in the EU. Chart 21: The activity rate and its evolution, by EU Member State Source: Eurostat, LFS, data non-seasonally adjusted [une_ltu_q] Note: (*) data from 2013Q4 Click here to download chart. Activity rate is increasing in the EU and converging among Member States In the first quarter of 2014, the activity rate in the EU stood at 72.1% for the 15 to 64 year-old population, representing a total of million people. This represents an increase of 0.5 pp over the year from the first quarter of 2013 and of 1.8 pp since the first quarter of Over the year to the first quarter of 2014, the activity rate remained stable in most Member States, with significant increases seen in Croatia (+6.9 pp), Hungary (+2.4 pp) and Luxembourg (+1.8 pp). Only Estonia and Denmark, both countries with activity rates well above the EU average, recorded significant decreases (around 1.0 pp). In Italy, Romania and Malta the activity rate remains below 65% and significantly below that of other Member States. It is interesting to note that the low overall activity rates in these three countries are Source: Eurostat, LFS, data non-seasonally adjusted [lfsi_act_q] Click here to download chart. Activity rate decreasing for low-skilled and young people In the period between the first quarter of 2008 and the first quarter of 2014, the activity rate increased only slightly for men (to 77.9%, +0.4 pp), but more significantly for women (to 66.3%, +3.1 pp). In the year to the first quarter of 2014, the activity rate has slightly increased among all age and skill groups, with the exception of young people and the low-skilled (Chart 22). The participation of these two groups in the labour market has fallen since the beginning of the crisis (with the exception of low-skilled women, for whom it has increased by 0.5 pp). The participation rate has increased especially for older workers, probably as a consequence of the pension reforms and increases in statutory retirement ages introduced in many EU Member States. The total activity rate is peaking well above the pre-crisis level, especially for women (+9.8 pp for women and +6.2 pp for men). September 2014 I 20
![Chart 22: Activity rate in selected groups by gender in the EU Source: Eurostat, LFS, data non-seasonally adjusted [lfsq_argaed] Click here to download chart.](/docs-images/93/113109975/images/21-0.jpg "Discouragement in the EU increased last year In the first quarter of 2014 'discouraged workers' in the EU (people available to work but not looking for a job) represented 4.")

21 Chart 22: Activity rate in selected groups by gender in the EU Source: Eurostat, LFS, data non-seasonally adjusted [lfsq_argaed] Click here to download chart. Discouragement in the EU increased last year In the first quarter of 2014 'discouraged workers' in the EU (people available to work but not looking for a job) represented 4.0% of the EU labour force (0.1 pp more than in the last quarter of 2013 and 0.2 pp more than in the first quarter of 2013). The constant increase in long-term unemployment since the start of the crisis in 2008 may have contributed to this phenomenon. Given that long-term unemployed people typically find it more difficult to re-enter the labour market, they have a higher probability of remaining on the margins of the labour force when the economy picks up again. The potential additional labour force consists of both discouraged workers and those who would like to work full-time, but cannot find a full-time job for economic reasons (underemployed), and those who are temporally not available to work. Both underemployed (4.1% of labour force) and people looking for a job but not available (1% of labour force), remained stable over the year to the first quarter of Chart 23: Unemployment rate, potential labour force and underemployment in the EU (the scale varies) Source: Eurostat, LFS, data seasonally adjusted (unemployment rate) and non-seasonally adjusted (other indicators), [une_rt_q and lfsi_sup_age_q] (DG EMPL calculations] Click here to download chart. Italy (16.1% of labour force) and Cyprus (14.1%) are the Member States with the highest aggregate shares of discouraged workers, underemployed and job seekers temporally not available for work. Cyprus saw the largest increase in the aggregate share over the year to the first quarter of 2014 (+3.1 pp). Meanwhile, Croatia (-3.0 pp) and Hungary (-2.3 pp) recorded the largest decreases over the same period. Hungary in particular has been able to combine this improvement with a significant reduction in the unemployment rate (-3.0 pp) (Chart 24). September 2014 I 21

![Chart 25: Labour underutilisation in EU Member State in the first quarter of 2014 Source: Eurostat, LFS, data non-seasonally adjusted [une_rt_q and lfsi_sup_age_q] (DG EMPL calculations).](/docs-images/93/113109975/images/22-2.jpg "(*) FR \"Discouraged\" from 2012Q4. (**) LV \"Looking but not available\" from 2013Q3 Click here to download chart.")
22 Chart 24: Unemployment and the three supplementary indicators of unemployment by Member State in the first quarter of 2014, in the EU and by Member State are discouraged or underemployed. Exceptions to this are Sweden and Finland where they represented 2.4% and 4.5% of the labour force respectively in the first quarter Chart 25: Labour underutilisation in EU Member State in the first quarter of 2014 Source: Eurostat, LFS, data non-seasonally adjusted [une_rt_q and lfsi_sup_age_q] (DG EMPL calculations). (*) FR "Discouraged" from 2012Q4. (**) LV "Looking but not available" from 2013Q3 Click here to download chart. The division of Member States into those of discouraged and those where it consists mainly of underemployed people has remained fairly stable in the first quarter of 2014, compared to the previous one (Chart 25). Italy is still the country with the highest percentage of discouraged workers and the most recent developments are not encouraging (12.8% in the first quarter of 2014, +1.0 pp compared to the first quarter of 2013). Slovenia also saw a significant increase in discouragement, with its rate doubling over the year to the first quarter of 2014 (from 1.7% to 3.5%), although it continues to have one of the lowest rates in the EU. The highest rate of underemployment is found in Cyprus, with the worst rate among Member States (8.1% in the first quarter of 2014), where there has been a marked recent increase (+2.3 pp over the last year, and +1.1 pp only over the last quarter). People seeking but not available to work is a small group in most of the countries, compared with the number of those who Source: Eurostat, LFS, data non-seasonally adjusted [une_rt_q],[lfsi_sup_age_q] (DG EMPL calcuations). Click here to download chart. Discouragement increased among the youngest but underemployment decreased Young female workers (aged 15-2) are particularly affected by underemployment and discouragement. Discouragement is increasing in all age groups with the exception of workers aged 55-64, with a notable increase seen in the rate among young women (+0.5 pp over the last year). On the other hand, young workers are suffering less from underemployment. September 2014 I 22

23 Chart 26: Underemployment and potential labour force in the EU in 2014Q1, by age and sex Source: Eurostat, LFS, [lfsi_sup_age_q] Click here to download chart. September 2014 I 23
24 Main messages on regional labour markets from the 6th Report on economic, social and territorial cohesion The crisis has heavily affected labour markets across the EU and increased regional disparities. The employment rate grew by about 4.0 pp between 2000 and 2008 for the age group 20-64, but dropped by 2.0 pp between 2008 and 2013 (see table below). Less developed and transition regions were more affected by the crisis: their employment rates dropped by 3.0 pp between 2008 and More developed regions were more resilient, their employment rate decreased by only 1.4 pp The employment rate is significantly higher in more developed and transition regions than in less developed regions, respectively 72% and 65% of the population aged against the 61 % in less developed regions. The regions of Åland (FI), Stockholm (SE) and Freiburg (DE), registered in 2013 the highest employment rate in Europe, with 86%, 83% and 82%, well above the 75% Europe 2020 target (map in Chart 27). One in three of the more developed regions have reached their national 2020 employment target, compared to one in six transition regions and only one in sixty less developed regions. Not all regions, however, need to reach the national target as a strong performance in one region can compensate for lower performance in another. Big disparities in employment opportunities however do create pressure for people to move from its own region to another region or country. The unemployment rate has grown dramatically since the crisis in many regions (map in Chart 28). Unemployment rates increased by more than 10 pp in regions in Northern Greece and Southern Spain. Increases were also high in the regions of Italy, Portugal and Bulgaria. On the other hand, regional labour markets have performed well in all of Germany. The number of unemployed has dropped in all German regions. For more analysis of regional labour market, poverty and migration, please read the new 6th report on economic, social and territorial cohesion. Published in July 2014 it is available in a paper copy, pdf and e-book. It is available in 6 languages and all other EU languages will follow in before the end of the year. Employment rate of those aged 20-64, EU-28 regions, More developed Transition Less developed EU-28 Employment rate population aged 20-64, % point change % point change a More Developed regions (GDP > 90% of EU-27 average); Transition regions (GDP 75% to 90% of EU-27 average); Less Developed regions (GDP < 75% of EU-27 average). September 2014 I 24
25 EU Employment and Social Situation September 2014 I 25
26 5. Household income and financial situation Growth in household income in the EU weakened On average in the EU 8, growth in the gross disposable household income (GDHI) in real terms weakened by the first quarter of 2014 (+0.4% year-on-year), suspending hopes that the recovery seen as of late 2013 would be sustained (Chart 29). A similar slowdown in the growth of real GDHI was also recorded in the euro area. The first quarter of 2014 saw the trend in household income deviating from that of the general economic recovery. GDHI grew much less than GDP. despite increases in income from work as taxes and social contributions increased and social benefits stagnated Over the year to the first quarter of 2014, growth in GDHI was driven mainly by income from work. The compensation of both employees and self-employed increased, in line with the recent trends in the labour markets. Employment has started to increase notably in service sectors and there was a slowdown in job destruction in the sectors worst hit by the crisis, e.g. industry (Chart 8 in Section 2). Meanwhile, taxes and social contributions further increased and social benefits remained stable, in line with the improved situation in the labour market. Income from property stagnated. All of this contributed to the slowdown in the growth of GDHI. Indeed, the increase in income from work is still weak (low compared to rises seen before 2008) and therefore cannot fully compensate for the negative impact of the tax-benefit system and the stagnation of income from property. With the economic recovery having lost momentum in the second quarter of 2014, there is some uncertainty as to whether the recent modest improvements in household income will be sustained. The EU aggregate GDHI was supported by Germany and the UK, but household income stagnated or worsened in many other Member States For the EU as a whole, GDHI increased only marginally in real terms over the year to the first quarter of Of the larger Member States, Germany and the UK continued to see improvements in household income, while declines in Italy, Poland and Spain contributed negatively to the moderation of the EU growth in GDHI in real terms. With the exception of the Czech Republic and Sweden, where increases in GDHI were recorded, household income mainly fell or remained stable in the remaining Member States. GDHI continued to decline in Portugal, remained stable in Finland, declined for the first time in Romania, after a year of growth, and declined or stabilised in Finland, Italy, Slovenia and Spain after having previously shown signs of improvement (Chart 29 for the EU and charts in Annex 1 for the euro area and selected Member States). 8 The real GDHI growth for the EU is DG EMPL estimation, and it does not include Member States for which quarterly data are missing (11 Member States). The nominal GDHI is converted into real GDHI by deflating with the deflator (price index) of household final consumption expenditure. The real GDHI growth is a weighted average of real GDHI growth in Member States. September 2014 I 26
27 Q1 Q2 Q3 Q4 Q1 Q2 Q3 Q4 Q1 Q2 Q3 Q4 Q1 Q2 Q3 Q4 Q1 Q2 Q3 Q4 Q1 Q2 Q3 Q4 Q1 Q2 Q3 Q4 Q1 Q2 Q3 Q4 Q1 Q2 Q3 Q4 Q1 Q2 % change on previous year EU Employment and Social Situation Chart 29: Growth in household income in the EU weakened despite increased income from work as social benefits stagnated Real GDP growth, real GDHI growth and its main components, EU, EU Compensation of employees Compensestion of selfemployed Net property income Net social benefits Net social contributions Net other current transfers Taxes on income, wealth (negative) Real GDHI Real GDP Source: Eurostat, National Accounts, data non-seasonally adjusted [namq_gdp_k, nasq_nf_tr and namq_fcs_p] (DG EMPL calculations) Note: GDHI EU aggregate for Member States for which data are available, GDP for EU28. Click here to download chart. Households' financial distress has eased in the EU after peaking at the end of 2013 Financial distress 9, or the need to draw on savings or to run into debt, continued to ease in the second quarter of 2014, reaching a level below that seen in mid This change was driven by a fall in the share of the population reporting that they needed to run into debt, while the share reporting that their households had to draw on their savings remained stable. It is still not clear whether the share of households suffering financial distress will continue to fall. Financial distress remains near to historically high levels, well above the levels seen in the previous decade, and currently affects around 15% of the population. The higher rates seen in recent years have primarily been driven by the increasing reliance on savings, especially since mid-2010 (Chart 30). Low-income households appear to have benefitted from recent easing of financial distress, but they remain in the most strained financial situation Financial distress has finally eased for lowincome households, while it remained stable or slightly deteriorated for higher income groups. As a result, the gap in financial distress between low-income households and other households has narrowed in the first half of Nevertheless, around 9% of adults in lowincome households are forced to run into debt and a further 15% must draw on savings to cover current expenditure, compared to 4% and 11%, respectively for the total population. This level of financial distress, because of the worsening between mid-2010 and end of 2013, is far above the long-term average. Financial distress has also increased since mid-2010 in other household income quartiles, reaching levels above long-term averages but has returned to near the long-term average for the top quartile. 9 See previous editions of this report. For details on Business and Consumer Surveys, including consumer survey's question on the current financial situation of the households, see: veys/index_en.htm September 2014 I 27
28 % of population in respective group EU Employment and Social Situation Chart 30: Signs of easing of financial distress in the EU continue, including for low-income households Reported financial distress by income quartile, and components of reported financial distress (share of adults reporting having to draw on savings and having to run into debt), EU28, Financial distress by income quartile lowest quartile second quartile TOTAL third quartile highest quartile Financial distress - TOTAL % need to draw on savings % need to run into debt Source: European Commission DG ECFIN, Business and Consumer Surveys (DG EMPL calculations), data non-seasonally adjusted. Note: Three-months moving averages. Horizontal lines show the long-term averages for financial distress for the population as a whole and for households in the four income quartiles. The overall share of adults reporting having to draw on savings and having to run into debt are shown respectively by the light grey and dark grey, which together represent total financial distress. Click here to download chart. Financial distress has eased in most Member States, but variations persist The level of financial distress for households in all quartiles combined fell over the year to the second quarter of 2014 in the majority of the Member States. In most, however, it remains higher than in 2007, ranging from less than 5% in Germany, Luxembourg and Sweden to over 25% in Croatia, Greece, Italy and Portugal. Financial distress declined or remained stable among households in the lowest income quartile in most Member States, but rose markedly in Luxembourg and Spain. Financial distress increased for the poorest households in all Member States after 2007, and currently affects from around 10% of households in the lowest income quartile in Austria, Germany and Luxembourg to 40% in Italy, Romania and Slovakia and Spain (Chart 31). September 2014 I 28
29 EE BE IE LV EL FR SK AT FI LT CZ HU NL PT PL DE SE MT SI BG EU RO DK UK CY HR IT LU ES % of population in 1 quartile EU Employment and Social Situation Chart 31: Financial distress eased in most Member States, but variations persist Reported financial distress in lowest income quartile households, EU Member States, 2007, 2013Q2 and 2014Q Previous year Q2 Latest Q average strong decrease on previous year decrease stable increase/ strong increase Source: European Commission DG ECFIN, Business and Consumer Surveys (DG EMPL calculations). Note: Three-months moving averages Click here to download chart. September 2014 I 29
30 6. Productivity, wages and hours worked Labour productivity growth slowed down across the EU, especially in the euro area Labour productivity grew by 0.6% in the EU as a whole in the second quarter of 2014 (if compared with the same quarter in 2013 and not seasonally adjusted) down from about 0.9% in the previous three months. Meanwhile, labour productivity growth stalled in the euro area, i.e. down from about 0.9% in the previous three months to 0.0% in the second quarter of In general, these developments reflect the slower growth in output than in employment growth (Chart 32). In the euro area (for the Member States for which data are available at the time of writing), Estonia showed by far the strongest growth, with an increase in labour productivity of 3.9% compared to 1.0% in the first quarter of Labour productivity continued to contract in Cyprus, down by -0.8% (compared to -0.4% in the previous quarter), as well as in Austria, down by -0.5% (compared to -1.0% in the previous quarter). In Greece productivity growth rebounded to 0.2% after having contracted by -0.6% the previous quarter. In Spain, France and Sweden productivity growth slowed down to 0.1% (all down from 0.8% in the first quarter of 2014). Outside the euro area, there was also notable variation in growth across Member States. In the Czech Republic (+2.6%), Lithuania (+2.4%) and Romania (with a provisional estimate of +4.5%) productivity growth was fairly robust. Denmark, however, recorded a significant decrease in the growth rate, with yearly growth falling to -0.9% (compared to a year-on-year increase of 0.4% in the first quarter of 2014). Chart 32: Labour productivity, nominal compensation per employee and nominal unit labour cost Source: Eurostat (namq_aux-ulc) Note: Data not seasonally adjusted Growth in compensation per employee remained subdued in the euro area In the EU as a whole, compensation per employee grew by 2.6% over the year to the second quarter of 2014 (not seasonally adjusted) - up from 1.7% in the first quarter of In the EA, however, growth in compensation per employee remained weak, at 1.1% compared to 1.2% the previous quarter (Chart 32). Amongst euro-area Member States, Greece (-4.8%) and Cyprus (-5.1%) continued to see sharp decreases in compensation per employee, while Spain (+0.2%) recorded a modest increase. Estonia (+8.8%) recorded by far the strongest increase in compensation per employee, followed by Slovakia (+4.1%) and Malta (+3.9%). In contrast, in Belgium (+1.1%) and France (1.7%), growth remained modest. Outside the euro area, Lithuania (+6.5%) saw very strong growth in compensation per employee over the year to the second quarter of 2014, followed by Romania (+3.5%), the Czech Republic (3.5%), Sweden (+2.9%), and Hungary (2.7%). Nominal unit labour cost regained growth momentum in the European Union, but remained subdued in the euro area Nominal unit labour cost (which measures compensation per employee adjusted for productivity and thus affects both domestic prices and international competitiveness) increased by 2.0% in the EU as a whole over the year to the second quarter of 2014 (non-seasonally adjusted), and by 1.1% in the euro area over the same time period. The slower growth seen in the euro area is the result of weak growth in compensation September 2014 I 30
31 per employee without any growth in productivity (Chart 32). Growth in nominal unit labour cost continues to vary across the euro-area Member States. Estonia (+4.7% over the year to the second quarter of 2014) recorded a fairly large increase, while growth also accelerated in Malta (3.6% year-on-year growth in the second quarter up from 0.9% the previous quarter), and Slovakia (3.0% year-on-year growth in the second quarter up from 1.8% in the first quarter), while it slowed in Austria (at 2.7% in the second quarter, down from 3.4% in the first quarter). At the same time, nominal unit labour cost continued to decrease rapidly in Greece (-5.0%) and Cyprus (-4.3%), while in Spain nominal unit labour cost growth began to rise again albeit at a modest +0.1%. Amongst the other euro-area Member States, nominal unit labour cost growth was especially weak in Belgium (0.3%). These asymmetric developments in nominal unit labour cost may help to correct competitiveness and external imbalances, but may also pose risks of triggering deflationary pressures, both at the individual Member States level and for the euro area as a whole. Outside the euro area, Lithuania (+4.0% over the year to the second quarter of 2014) and Sweden (+2.8%) saw the strongest growth in nominal unit labour cost, followed by Hungary (+1.9%) and Denmark (+1.8%), while Bulgaria (+0.8%) and the Czech Republic (+0.9%) recorded more moderate growth. Nominal unit labour cost fell by 1.0% in Romania, reflecting strong productivity growth. Real unit labour cost After four quarters of successive decreases, real unit labour cost (which measures real wages relative to productivity or the labour income share) started to increase again in the EU as a whole (+0.5% over the year to the second quarter of 2014) and the euro area (+0.3% over the same period) primarily reflecting a stronger increase in nominal unit labour costs than in prices (Chart 33). Lithuania (+3.8%) and Slovakia (+3.7%) recorded the largest increases, followed by Estonia (+2.8%) and Malta (+2.3%). Modest increases were seen in Hungary (+0.3%) and Sweden (+0.9%). In Spain, where real unit labour cost had been on a declining trend since the first quarter of 2010 (with the exception of the fourth quarter of 2013), there was a return to growth with an increase of 0.5% over the year to the second quarter of Real unit labour cost, continued to fall in Romania (provisionally estimated at -4.8%), Greece (-2.8%), Cyprus (-2.9%) the Czech Republic (-1.5%) and Belgium (-0.4%). Chart 33: Real unit labour cost Second quarter of 2014 (year-on-year change) Source: Eurostat (namq_aux-ulc) Note: Not seasonable adjusted data The number of hours worked remained fairly stable on average In the first quarter of 2014 (the latest quarter for which data are available for all Member States), full-time workers in Greece worked the most hours a week on average in their main job (41.9 hours), followed by workers in the Portugal (41.6 hours), Austria (41.5 hours), Germany (41.4 hours) and the United Kingdom (41.3 hours). The least hours worked by full time workers is recorded in Finland (38.4 hours), followed by Sweden (39.6 hours) and Denmark (39.3 hours). Amongst part-time workers, those in Sweden and Belgium worked the longest hours, both on average working 23.4 hours a week, closely followed by workers in Romania (23.3 hours) and France (22.3 hours). The least hours worked by part-time workers is recorded in Portugal (15.1 hours), followed by Cyprus (17.9 hours), and Spain (18.2 hours) (Chart 34). Most Member States for which the data are available recorded a fall in the number of hours worked by full-time workers over the year to the second quarter of 2014, with the exception of Ireland and the Netherlands. For part-time workers the picture is more mixed, with the largest decrease in hours seen in Denmark and the largest increase in Germany. September 2014 I 31

.")
32 Chart 34: Hours worked Full- and parttime first quarter of 2014 Source: Eurostat (lfsq_ewhais) Note: Not seasonable adjusted data 7. Labour demand: vacancies, labour shortages and hiring activity The ratio of unemployed to job hiring has fallen, but still shows low job opportunities in some Member States The ratio of unemployed to job hiring 10 has fallen by 0.2 pp over the year to the first quarter of 2014, indicating improving job prospects overall. This ratio continues to vary between Member States ranging from 1.2 in Denmark to 19.0 in Greece in the first quarter 2014 (Chart 35). Chart 35: Ratio of unemployed to job hiring in the EU and euro area and by Member states, 2013Q1 and 2014Q1 The EU job vacancy rate moderately increased over the year to the second quarter of 2014 The EU s job vacancy rate 11 (JVR) was 1.6% 12 in the second quarter of 2014, an increase of 0.1 pp on the rate recorded for the second quarter of The rate in the EA increased by 0.2 pp to 1.7 %. The job vacancy rate was higher in the second quarter of 2014 than a year earlier in 15 Member states, remained stable in four and was lower in seven (data available for 26 Member states 13 ). Germany (2.8%), Belgium (2.4%) and the UK (2.3%) had the highest JVR in the second quarter of 2014, while Latvia (0.4%) had the lowest (Chart 36). At the EU level, the JVR remains higher in services (2.1%) than in industry and construction (1.1%). Over the year to the second quarter 2014, the JVR in both services and industry-construction rose by 0.2 pp. Chart 36: Job Vacancy Rates in the EU, NACE Rev. 2 sections B to S, 2014Q2 Source: Eurostat, Job Vacancy Statistics, data nonseasonally adjusted [jvs_q_nace2] DK: Only sections B to N covered. FR, IT: Section O not included, FR, IT, MT: Only business units with 10 or more employees covered, EL: 2013Q2 figures. PL: 2013Q3 figures. Click here to download chart. Source: Eurostat (lfsq_egdn2) LFS, data non-seasonally adjusted (DG EMPL calculations) while the job matching process in the EU is still subdued The upward shift in the EU Beveridge curve, which has occurred in the EU since 2008 (with a higher indicator for labour shortage for a given unemployment rate) suggests increasing mismatches in the EU labour markets. Recent data suggest both positive 10 The ratio of unemployed to job hiring indicates the relative ease of hiring, or relative competition for jobs among unemployed jobseekers. For more details see the February 2014 issue of the European Vacancy Monitor. 11 JVR = number of job vacancies / (number of occupied posts + number of job vacancies) * * 2006Q1 to 2008Q4: JVR for total of NACE Rev From 2009Q1: JVR for sections B to S of NACE Rev2 - Industry, construction and services. 13 Data not available in 2014 q2 for Greece and Poland. September 2014 I 32
33 and negative developments in relation to the labour market matching process in the EU. The recent developments of lower unemployment and higher labour shortage are equivalent to the usual move along the Beveridge curve and confirm the recent improvements in the job vacancy rate. At the same time and up to the start of 2010, the Beveridge curve has shifted upwards relative to its general position, suggesting a structurally worse matching process in the EU (Chart 37). Annex 4 reports the Beveridge curves for all EU Member States. 14 Chart 37: Beveridge curve for the EU Source: Eurostat [ei_bsin_q_r2, une_rt_q, une_rt_m]. Note: UR = unemployment rate (%); LSI = labour shortage indicator, derived from EU business survey results (% of manufacturing firms pointing to labour shortage as a factor limiting production). 14 With the exception of Ireland for which the Labour Shortage Indicator is not available. September 2014 I 33
34 8. Labour market and social situation for youth This issue of the quarterly review describes in more detail the labour market and social situation for young people. The labour market situation of young people in the EU continues to improve Monthly developments since mid-2013 indicate a fall in unemployment amongst the age group (see also section 3, Chart 18). Other labour market indicators have also continued to stabilise by the first quarter of 2014 (Chart 40). In the year to August 2014 the youth unemployment rate fell to 21.6% in the EU (-1.9 pp) and to 23.3% in the EA (-0.6 pp). It decreased in most EU Member States (year-on-year) but increased significantly in Italy (+3.6 pp) (Table 2). In August 2014, unemployment affected 5.0 million women and men aged in the EU (including 3.3 million in the EA). However, disparities among Member States are large Youth unemployment continues to vary widely between Member States. The youth unemployment rate ranges from less than 10% in countries little affected by labour market deterioration (i.e. Austria and Germany), to more than half of the active population aged in Greece and Spain, where it has almost tripled since In the large majority of Member States it is still very close to historically high levels (Chart 38). Chart 38: Youth unemployment rates in the EU Member States in August 2014 and the highest and lowest rates since Table 2: Youth unemployment rates in Europe in August 2014 and year-on-year changes. Youth unemployment rate Percentage points change (year-on-year) ES EL IT HR CY PT SK IE RO FR BE EA PL BG LV SE EU LT HU FI SI CZ UK LU EE MT DK NL AT DE Source: Eurostat, series on unemployment. Data seasonally adjusted. Note: see note Chart 38 Source: Eurostat, LFS. Data seasonally adjusted. Note: EE HU June 2014; UK May 2014; CY HR LV SI RO 2014Q2 Click here to download chart. September 2014 I 34
 in the EU had a job, down from 37% five years earlier.")
35 Chart 39: Youth unemployment rates in Europe, August 2014 Source: Eurostat, series on unemployment; Data seasonally adjusted. Note: See note chart 38 Young people, face many challenges in the labour market By the first quarter of 2014, 15 32% of young people (aged 15-24) in the EU had a job, down from 37% five years earlier. Among young people aged 20-24, this share fell from 54% to 48% over the same period (Chart 40). Overall, the change in employment of young people continues to contribute negatively to the change in total employment (Chart A3.3 in Annex 3). Moreover, young people often hold jobs on temporary or part-time basis. Over 40% of young employees have temporary jobs, 3.5 times more than amongst prime-age adults. Nearly 25% of young people work parttime, up from less than 20% in with high unemployment and NEET also among young persons aged By the first quarter of 2014, 16 unemployment affected 10% of all young people aged in the EU (unemployment-to-population ratio), up from 7% five years earlier, but unchanged compared to the previous year. Overall, 13% of young people were neither in employment nor in education or training (NEET) in People aged who often enter the labour market after graduation also suffer from a similar lack of job opportunities. In 2013, their unemployment ratio was 12%, and the NEET rate was 20%. Differences between the unemployment rates and the unemployment ratios reflect disparities in the activity levels of young people in different Member States. At EU level, 58 % of those aged were inactive by the first quarter of , with variations among Member States of between 30 % and nearly 75 %. In nine out of 10 cases (88%) this was because of enrolment in education. High unemployment rates of young people in Spain and especially in Greece and Croatia, and low rates in Austria, Germany and the Netherlands partially reflect differences in labour market participation (higher in the latter group), including in the employment of young people. Consequently, the disparities between the unemployment rate and the unemployment-to-population ratio are the highest in the first group and lowest in the second one. This results in there being less variation among Member States in the unemployment-to-population ratio than in the unemployment rate (Chart 41). 15 Average of four quarters 2013q1-2014q1 16 Average of four quarters 2013q1-2014q1 17 Average of four quarters 2013q1-2014q1 September 2014 I 35
36 Employment rate Employment rate Inactivity rate Unemployment ratio Unemployment rate NEET EU Employment and Social Situation Chart 40: The labour market for youth has stabilised, but it remains much weaker than prior to the downturn Employment rate (% of pop 20-24), employment rate, unemployment ratio and NEET rate (% of pop 15-24) and unemployment rate (% of labour force 15-24) in the EU, % of pop Source: Eurostat, EU LFS, (DG EMPL calculations, average of 4 quarters to quarters to Q1) % of pop % of active pop % of pop Chart 41: Inactivity contributes to divergence in youth unemployment measures among Member States Unemployment rate and unemployment ratio for the EU, EA and Member States, 2013 Q1 and 2014 Q1 Unemployment ratio 2013 Q1 Unemployment rate 2013 Q1 EL ES HR IT CY PT SK BG PL IE HU BE RO FR SE EU28 LV SI LT FI UK CZ EE LU MT DK NL AT DE Unemployment rate 2014 Q1 Unemployment rate 2014 Q Source: Eurostat, EU LFS, (DG EMPL calculations, average of 4 quarters to quarters to Q1) % of young people are not in employment, education or training (NEET) Nearly 70% of young people in the EU were in education in the first quarter of Nonetheless, the share of young people not in employment, education, or training increased from around 11% in 2008, to nearly 13% in 2010, and has since has stabilised around this level. There are considerable disparities among Member States, with rates ranging from less than 5% in Luxembourg and the Netherlands to over 20% in southern Europe. The NEET rate is falling in the Baltic States and Ireland (Chart 42). 18 Average of four quarters 2013q1-2014q1 September 2014 I 36
37 LU NL DK DE AT SE CZ SI FI EE MT LT FR PL BE LV EU28 SK UK PT HU IE ES CY RO HR EL BG IT % of population EU Employment and Social Situation Chart 42: The share of young people not in education or employment varies among Member States and remains higher than before the downturn in most of them NEET rate for the EU and Member States, 2014Q1 and lowest and highest values since Q1 Lowest rate since 2008 Highest rate since Source: Eurostat, EU LFS, data non-seasonally adjusted (DG EMPL calculations, average of 4 quarters to quarters to Q1) September 2014 I 37
38 Supplements to the EU Employment and Social Situation Quarterly Review S1. Human capital availability across the EU skills perspective S2. Towards a better measurement of welfare and inequalities September 2014 I 38
39 Supplement: Human capital availability across the EU skills perspective Developing relevant skills, activating the existing skills supply and using skills effectively are crucial for making economies more productive and internationally competitive and for stimulating sustainable, inclusive economic growth. 19 International competitiveness country rankings show that the most competitive countries tend to have a better educated and more skilled population/workforce than less competitive ones. 20 This supplement will focus [i] on the impact of skills beyond those acquired through initial education on individual's outcomes in the labour market and [ii] on the impact of work history on person's level of skill. The latter will be extensively analysed in the forthcoming (2014) Employment and Social Developments in Europe Direct ways of measuring skills, like the OECD s Programme for the International Assessment of Adult Competencies (PIAAC), also known as the Survey of Adult Skills, 21 complement the indirect ways of doing so based on educational attainment. 22 PIAAC provides comparable and valuable information on skills which was not previously available. This information sheds some light on the differences in human capital availability across the EU and its main partners. Although an important one, education is not the only way of acquiring skills. They are also acquired by working and doing other activities throughout the course of one s life. 23 This article gives an overview of the availability of human capital 24 in the EU from the skills perspective by providing information about skills proficiency across various socio-demographic groups. Skills proficiency, beyond the skills acquired through initial education, is shown to be positively and independently associated with the individual s probability of participating in the labour market, being employed and having higher wages and better social outcomes. 25 An individual who had 46 more score points than another in literacy proficiency, was on average 20% more likely to be active and 10% more likely to be employed and could expect on average a 7% increase in his hourly wage. 26 Improving the skills proficiency of poorly skilled groups should allow them obtain some of those benefits. 19 See OECD (2012). 20 See for example The Global Competitiveness Report by the World Economic Forum: or the IMD World Competitiveness Yearbook Skills can improve competitiveness and contribute to economic growth and productivity per capita, but countries with higher per capita income have more resources to invest in developing them. 21 See box for a short explanation of the survey. 22 OECD (2013a). 23 The 2014 edition of the Commission s Employment and Social Developments (Chapter 2, ESDE 2014 forthcoming) in Europe Report contains a regression analysis of PIAAC microdata showing how work intensity, exposure to ICT work and the regular exercise of relevant skills tend to improve proficiency in key cognitive skills. Simple correlations confirm the importance of exposure to several relevant tasks. For example, the numeracy and literacy scores tend to correlate positively in all countries with Skill use at work variables like the frequency of ICT use for mail, for spreadsheets, for Word, to solve complex problems at work, or to use or calculate fractions or percentages. The results for the use of skills in everyday life are similar. For example, the frequency of reading newspapers or magazines or reading books correlates positively with the literacy and numeracy score. 24 Human capital can be defined in overall terms as the knowledge, skills, competencies and attributes embodied in individuals that facilitate the creation of personal, social and economic well-being. (OECD 2001). See also short summary on the concept of human capital in the forthcoming Chapter 2 of 2014 ESDE report. 25 OECD (2013b), Hanushek et al (2013), Quintini (2014), Dinis da Costa et al (2014) score points represent an increase of one standard deviation in an individual's literacy proficiency. Results for labour activity were adjusted for gender, age, marital status and foreign-born status and refered to adults not in formal education. The link between proficiency in literacy and labour market participation was not statistically significant in the Czech Republic, the Netherlands, Italy, Spain, Cyprus, Korea and Japan. In estimating wage impacts, the wage distribution was trimmed to eliminate the 1 st and 99 th percentiles and the data sample included only employees. Results were adjusted for gender, age, marital status, foreign-born status and tenure. Years of education/level of qualification are still important, independent and more stronger determinant of wages than skills proficiency. For more details see OECD (2013b). September 2014 I 39
40 PIAAC Measuring key cognitive and various generic skills and competencies The Survey of Adult Skills measures the key cognitive and various generic skills and competencies needed for individuals to participate in society and contribute to economic growth. It directly tests proficiency in broadly transferable (generic) literacy, numeracy and problem-solving skills in technology-rich environments. a Literacy refers to the reading of written texts b and the ability to understand evaluate and use them in various life situations. Numeracy is the ability to access, use, interpret and communicate mathematical information and ideas. Problem solving in technology-rich environments is defined as the ability to use digital technology, communication tools and networks for completing practical tasks, getting information or communicating with others. The results are measured on a scale from 0 to 500 points, divided into different proficiency levels. The more proficient they are, the more easily respondents deal with complex textual and mathematical information and master a broader range of technologies; the more successfully they complete tasks in different contexts (e.g. work-related, personal) and apply various strategies (e.g. not only accessing and identifying but also interpreting, evaluating, analysing or communicating). Six proficiency levels are defined for literacy and numeracy (levels 1 (lowest performance) to 5 (highest performance), plus levels below level 1). The results for problem solving in technology-rich environments are divided in four levels for respondents participating in computer-based (levels 1 to 3, plus levels below level 1). There are two extra groups for those with no previous computer experience and for those who failed the core ICT test. The survey also collects information on the use of information and communication technologies at work and in everyday life, and on the exercise of several generic skills individuals need in their work. Respondents were also asked if their skills and qualifications match their work requirements. The first part of the survey assessed the skills of about adults aged in 24 countries. Of these, 17 are EU Member States (EU-17 in this supplement), representing about 83 % of the EU-28 population. c a The survey did not directly assess inter- and intra-personal skills, personal attitudes or subject-specific skills (e.g. specific vocational or professional skills, company-specific skills and knowledge) or competencies. For more information about the survey methodology and definitions, see OECD (2013a) and OECD (2013b). b The survey did not test speaking, listening or writing. c The first round of data collection covered 22 OECD countries: Australia, Austria, Belgium (Flanders), Canada, the Czech Republic, Denmark, Estonia, Finland, France, Germany, Ireland, Italy, Japan, Korea, the Netherlands, Norway, Poland, the Slovak Republic, Spain, Sweden, the United Kingdom (England and Northern Ireland) and the United States, plus two partner countries, Cyprus and the Russian Federation. The data collection took place between August 2011 and March The second round covered nine additional countries: Greece, Slovenia, Lithuania, New Zealand, Chile, Indonesia, Israel, Singapore and Turkey. Data are being collected in 2014 and the results are expected in May Many Member States have a poorly skilled population The EU is falling behind its competitors with regard to the skills proficiency of its adult population. Mean average scores for six large EU countries (Germany, the UK (England/Northern Ireland), Poland, France, Italy and Spain), representing more than two thirds of the total EU population (70 %), show that EU skills and competencies levels in the age group fall far short of those of its large competitors (Chart 1). 27 The population of the three EU countries with the highest average literacy scores (Finland, the Netherlands, Sweden) represented only 6 % of the total EU population in 2013, while the population of the countries with the lowest average scores (Poland, France, Italy, Spain) represented around one third of the total population. 27 See Table A1 in the annex for a detailed overview of each country and age group. September2014 I 40

41 Chart 1: The top-ranking EU countries are too few and too small to improve overall EU results compared to those of other world economies Mean literacy proficiency scores, for age groups and groups of countries Notes: a Top- and bottom-ranking EU countries based on the mean score of year olds being statistically significantly different from the EU average. b Top-ranking EU: FI, NL, SE (only three countries with around 10 points above the EU average). c EU-17 average. d Big six EU: DE, UK (England/Northern Ireland), PL, FR, IT, ES. e Bottom-ranking EU: PL, FR, IT, ES all countries scored statistically significantly below the EU average. f Countries are ranked according to the descending mean score of the age group. g Data for the Russian Federation (RF) do not cover the Moscow municipal area. Source: Survey of Adult Skills 2012 (PIAAC). The skills proficiency of the younger generation (16-24) is in general higher, with some exceptions like the UK (England/Northern Ireland) and Cyprus within the EU and Norway outside it. In contrast, the skills proficiency of young people in Korea was improved a lot by increasing the educational attainment rate over a relatively short period of time. This has resulted in agerelated differences in skills proficiency. The skills proficiency of young people in the bottomranking EU countries is higher, but there are still major differences between countries in the EU. The results for numeracy and problem-solving skills, given in the annex (Chart A1 and Chart A2), are relatively similar. On average, top-ranking EU countries have a lower proportion of poorly skilled, and a higher proportion of highly skilled, adults. The opposite is the case in the bottom-ranking EU countries (Chart 2). For example, in Italy and Spain almost 30 % of adults (25-65 years old) perform at or below the lowest level of proficiency in literacy and numeracy. Less than 5 % of Italian and Spanish adults are at the top literacy and numeracy levels (levels 4 and 5). Many of the countries in the bottom-ranking EU group had high proportion of early school leavers in previous decades. In 1996 the proportion of early school leavers was around 31 % in Spain and Italy and 19 % in Ireland, while it was below 8 % in Sweden and around 11 % in Finland, two of the topranking EU countries. Outside the EU, the US also scored poorly. Nevertheless, even topranking EU countries have significant skills weaknesses, with around 10 % of adults proficient only at or below level 1 in literacy or numeracy. 28 The proportion of poorly skilled young people is lower in comparison to adults, with the exception of Norway, the Russian Federation and the UK (England/Northern Ireland). This shows that there has been an improvement in equipping young people with basic skills, but there are similar differences in proficiency between countries to those in the case of adults. 28 See Chart A3 in the annex for numeracy results. September2014 I 41

. Computer and ICT skills in general are more important than ever for labour market activity and social inclusion.")
. Around 20 % or more of the adult population in Italy, Poland, Slovakia and Spain have no ICT experience, or lack the basic skills needed to use such technology for many everyday tasks.")
42 Chart 2: Better performing countries have on average a lower proportion of poorly skilled, and a higher proportion of highly skilled, adults Percentage of population by proficiency levels in literacy, for each age group and country Note: a Data presented according to the ascending proportion of year olds at level 1 and below it. b The EU-17 average is weighted according to population. c Data for the Russian Federation (RF) do not cover the Moscow municipal area. d The difference to 100 % is literacy-related non-response. Source: Survey of Adult Skills 2012 (PIAAC). Computer and ICT skills in general are more important than ever for labour market activity and social inclusion. Results show that in the great majority of all countries at least 10 % of adults lack the most elementary computer skills (proportion of adults in the failed ICT/no computer experience group on Chart 3). Around 20 % or more of the adult population in Italy, Poland, Slovakia and Spain have no ICT experience, or lack the basic skills needed to use such technology for many everyday tasks. These countries also have the highest proportion of young people lacking basic computer and ICT skills (more than 5 %). This is also the case in Japan and Korea. The Nordic countries, Netherlands and the UK (England/Northern Ireland) have been more successful than other countries in creating an environment in which most adults have computer experience. As a result, only a small proportion of adults in these countries score poorly in this area (less than 5 %). Chart 3: Need to strengthen computer and ICT skills across the EU Percentage of population by proficiency levels in problem solving in technology-rich environments, for each age group and country Note: a Data presented according to the ascending proportion of year olds in the failed/no experience category. The no computer experience group includes adults who reported having no previous computer experience, while failed core ICT includes those who had previous computer experience but failed the core ICT test. Both groups did the paper-based version of the test, which did not include problem solving in a technology-rich environment. b Opted out of doing the computer-based test includes adults who chose to do the paper-based test which did not include problem solving in a technology-rich environment despite having some previous computer experience. c Differences to 100 % are missing because test was not taken. This module was not used in Spain, France, Cyprus and Italy. d The EU-13 average is weighted according to population. It includes EU countries participating in the survey, except for Spain, France, Cyprus and Italy where module was not used. e Data for the Russian Federation (RF) do not cover the Moscow municipal area. Source: Survey of Adult Skills 2012 (PIAAC). September2014 I 42
, compared to 17 % of the most skilled individuals (4 % unemployed).")
43 Many of those with poor computer or general ICT skills are inactive. Of those who have no computer experience or failed the core ICT test, 42 % are inactive (8 % unemployed), compared to 17 % of the most skilled individuals (4 % unemployed). In Finland, Belgium (Flanders) and the Czech Republic every second person with no core computer skills is inactive. Adults with no computer experience also have lower mean literacy and numeracy scores than those with computer experience. They are also more often among groups at a disadvantage on the labour market (older people, immigrants, poorly educated people) or they do less skilled work. 29 This increases their inactivity. At the same time, their inactivity diminishes their opportunities for developing skills in all areas, including ICT. 30 Groups with poor skills: who are they and how do they differ across the Member States? Skills proficiency is on average lower among groups usually at a disadvantage on the labour market, like older people, immigrants, poorly educated people or people from disadvantaged social backgrounds. Skills proficiency varies greatly among them across countries however. This suggests that the national situation has a major impact on the skills proficiency of disadvantaged groups. This is because it determines the quantity and quality of initial education and the possibilities of maintaining and using the skills acquired throughout one s life by investing in training, lifelong learning and the use of skills at work. Proficiency in literacy, numeracy and problem solving in technology-rich environments is closely related to age. Younger age groups tend to have higher levels of proficiency than older ones, with considerable variety in the results across the EU Member States (Chart 4). Chart 4: Literacy proficiency decreases with age but is affected by more than just biological ageing Literacy proficiency by age, adjusted according to socio-demographic characteristics Notes: Data are based on a multiple linear regression model that takes account of differences associated with the following variables: age, gender, education, immigration and language background, socio-economic background and type of occupation. Source of data: Table B3.17 in OECD (2013b). 29 Differences in computer experience between different categories are striking. For example, almost two thirds of adults without upper secondary education have no computer experience. Only around one third of those with upper secondary education have no computer experience and only 4 % of those with tertiary education have no computer experience. The proportion of adults with no computer experience is the highest among those with semi-skilled blue-collar jobs and those born in the country in question, whose language of origin is the same as that of the survey assessment. Similar patterns can be observed across a large majority of countries (OECD 2013b). 30 The survey shows that prime-age and older workers spend more time using ICT at work than outside work. The opposite is the case for younger workers. September2014 I 43

44 A proficiency gap between younger and older groups, in favour of younger groups, can indicate an increase in the quantity and quality of education over time. Biological ageing and training and working opportunities to maintain and use skills acquired throughout one s life also play a part. Some countries have wider skills proficiency gaps than others. The literacy proficiency gap can be wide in countries with a high average mean score (e.g. Finland) and in countries with a low average mean score (e.g. Germany and France). A narrow proficiency gap in countries with a mean score below the EU average is probably related more to the lack of improvement in the quantity and quality of education than to the availability of good lifelong learning opportunities and training (e.g. Italy). The gap between the old and the young is especially marked in problem solving in technologyrich environments. On average, 51 % of people aged scored at level 2 or higher on problem solving in technology-rich environments. Very few adults aged in any country scored at level 2 or 3 in this area. Young people aged who are not in education, employment or training (NEET) are at risk of poor skills development. On average, this group s odds of scoring at level 2 or below on the literacy scale are nearly three times those of young people who remain in education. Their probability of scoring at low levels ranges from five times higher than in Germany and Italy, to three times higher in Poland and two times higher in Estonia (Chart 5). Young people who participated in education and training in the recent past and those who work are at less risk of poor skills development, but are still more likely to score at low levels than those who are in education. Chart 5: High risk of poor skills development for young people not in education, employment or training Adjusted odds ratios of year olds scoring at or below proficiency level 2 on the literacy scale, according to education and work status, with the reference group in education only Note: a The chart shows only estimates based on a sample of more than 30 or one statistically different from the reference group. There are no significant odds ratios for Austria, Denmark, Ireland, Belgium (Flanders), Finland, Sweden and Cyprus. b Odds ratios are adjusted depending on age, gender, type of occupation and immigrant status. c Sample smaller than 30 for the Netherlands. d Sample smaller than 30 for Italy and the Netherlands, results not statistically significantly different from those for the reference group for Estonia, Spain and Poland. c Results not statistically significantly different from those for the reference group for Italy and Slovakia. Source of data: Table A3.11 (L) in OECD (2013b). On average, immigrants are less proficient in literacy, numeracy and problem solving in technology-rich environments than adults born in the country in question. The mean literacy proficiency of immigrant adults is lowest in Belgium (Flanders), France and Denmark, and highest in Slovakia, the Czech Republic and the Netherlands, and immigrant women are more likely to be less proficient than men The results for numeracy are quite similar to those for literacy. This could be because good language skills are required to understand and answer the questions in the survey. Scores are based on a multiple linear regression model that takes account of differences associated with the following variables: age, gender, education, immigration and language background, socio-economic background and type of occupation (OECD 2013b). September2014 I 44
45 An OECD study on migrants, supported by the Commission, 32 compared the skills proficiency of immigrants from EU and non-eu countries. The results show that on average, the literacy and numeracy scores of EU immigrants are closer to those of people born in the country in question, in particular in Austria, Ireland and the UK (England/Northern Ireland) (Chart 6). Differences between natives and EU immigrants are bigger in the Netherlands and Sweden. This can be due to the composition of the EU migrant groups, the complexity of the host country s language and the small proportion of migrants who speak it when migrating. 33 Chart 6: Immigrants are a heterogeneous group - so are their skills Differences in literacy proficiency between migrants and natives, by EU/non-EU origin, score point difference Note: a Data presented according to the descending difference between EU-immigrants and natives. b The sample includes people aged The coefficients presented are from separate regressions including controls for age, gender, level of education and level of parental education. c Difference between EU immigrants and natives in the US and AT is not statistically significant (at 10 % level). Source: Bonfanti and Xenogiani (2014). Adults familiarity with, and ease in using, the language most widely used in the society in question explains a lot about differences in proficiency. PIAAC results can be low for immigrants because they are not tested in their own language. The mean proficiency scores of adults born outside the country in question, who have a good knowledge of the assessment language, 34 are on average higher than those of foreign-language immigrants. In the case of most countries the length of time spent living in the host country makes a significant difference, because it takes time to integrate. In general, adults who have lived over five years in the host country score significantly higher than those who have lived in the same country for less time. Differences in skills (literacy) proficiency between immigrants and natives are smaller in the case of immigrants who have a host-country qualification. These have a lot to do with differences in the quality of education across countries. The PIAAC survey showed that educational attainment is an imperfect measure of skills, especially for immigrants. While proficiency in the language of the host country is important for labour market integration, this may not always be the case. For example, an ICT engineer who speaks English can work in a highly skilled job in Sweden, the Netherlands or Germany without having a good knowledge of the host country language. The results show the difference between skills and qualifications and that more education alone is no guarantee of a better skilled workforce. Skills proficiency on average increases with higher educational attainment, but the level of skills varies considerably among individuals within and across education levels. In and across countries, many people with secondary education as their highest level of educational attainment outperform adults with a university degree. The literacy proficiency gap between those with tertiary education and those whose 32 Bonfanti and Xenogiani (2014). 33 Bonfanti and Xenogiani (2014). 34 Called the foreign-born and native language group. September2014 I 45

46 education level is lower than upper secondary is high in Belgian (Flanders), France and Ireland (more than 40 points). It is low in Cyprus, Estonia and Italy (less than 30 points). 35 The extent to which the skills proficiency of graduates with similar educational qualifications varies between countries is striking. For example, adults with upper secondary education in Japan and the Netherlands scored 40 more points than those in Poland. There are similar differences at tertiary level. Adults who have completed high school in Finland, the Netherlands, Sweden, Japan and Australia scored higher in literacy proficiency on average than university graduates in Estonia, France, Italy, Poland, Slovakia, Spain, Cyprus, Korea, the USA and Canada. Adults whose education level is lower than upper secondary in Finland, the Netherlands, Sweden, Australia and Japan scored better than those with upper secondary education in Estonia, France, Italy, Poland, Cyprus, Spain, Germany, Korea, Canada and the US. 36 There are also such differences among subgroups, such as young people (16-29 year olds). The reasons for this include differences in the quality of education and the possibilities for adults to continue developing their skills after completing formal (initial) education. The literacy gap between adults from socio-economically disadvantaged backgrounds 37 and adults with more educated parents (Chart 7) is very wide in the UK (England/Northern Ireland), Slovakia and Poland. It is narrower in Estonia and Cyprus. Chart 7: The education level of parents can have a major effect on the skills proficiency of children Literacy proficiency of year olds by socio-economic background and by country, adjusted according to socio-demographic characteristics Notes: a Data are based on a multiple linear regression model that takes account of differences associated with the following variables: age, gender, education, immigration and language background, socio-economic background and type of occupation. b All differences are statistically significant. Source of data: Table B3.17 in OECD (2013b). 35 Results adjusted according to socio-demographic characteristics. Table B3.17(L) in OECD (2013b). 36 Data adjusted to take into account socio-demographic characteristics: age, gender, immigration and language background, socio-economic background and type of occupation. 37 In the survey, socio-economic background is determined in terms of parents educational attainment. If both parents have low levels of educational attainment, adults are regarded as coming from socio-economically disadvantaged backgrounds. September2014 I 46
47 Comparing the and age groups, the link between socio-economic background and literacy proficiency is weaker for the younger group in Slovakia, Poland, Germany, France, Sweden, Spain, Ireland, the Netherlands, the USA, Canada and Korea. It is stronger in Finland, Denmark, Estonia, Belgium (Flanders) and Australia (Chart 8). One reason for this could be that the proficiency levels of adults from a disadvantaged background can improve over time. Another reason could be that in countries with a higher socio-economic gradient for younger adults than for prime-age adults, opportunities for young people from disadvantaged families to get a good education and acquire useful skills have diminished over time. 38 Cyprus, the Netherlands, Ireland, Spain, Sweden, Japan and Korea have the weakest link between socioeconomic background and literacy proficiency among young people (16-24). The link is strongest in Slovakia, the UK (England/Northern Ireland), Poland, the Czech Republic and Germany. Chart 8: and the impact varies across age groups The slope of the socio-economic gradient for literacy proficiency, by age groups and by country Note: The slope of the socio-economic gradient is based on the trend line connecting mean scores for each level of parents educational attainment. High values show that there is a strong link between socio-economic background measured in terms of parents educational attainment and literacy proficiency. Source of data: Table A3.8L in OECD (2013b). Cumulative disadvantages The combination of poor initial education and the lack of opportunities to further improve skills can become a vicious circle in which poor proficiency leads to fewer opportunities to further develop proficiency. 39 Foreign-language immigrants from disadvantaged backgrounds are nearly seven times more likely than non-immigrants from advantaged backgrounds to score at level 2 or below on the literacy scale. Non-immigrants from disadvantaged backgrounds are about 1.5 times more likely than non-immigrants from advantaged backgrounds to score at level 2. On average about 40 % of foreign-language immigrants come from a socio-economically disadvantaged background, but the proportion varies from low proportions in some countries with few immigrants to as much as 60 % in Spain. Adults who have low levels of education, whose parents also have low levels of education (below upper secondary education), are on average nearly five times as likely to get low literacy 38 This is worth exploring in more detail, but it is beyond the scope of this article to do so. 39 The data sources are Table A3.12 (L) and Table A3.17 in OECD (2013b). September2014 I 47
48 scores as adults with parents who have higher levels of education. This is most likely in the US and the UK (England/Northern Ireland) and least likely in Estonia and Finland. These adults are the least likely to participate in any form of adult education and training. Adults from socio-economically disadvantaged backgrounds with at least upper secondary education are still about twice as likely to get low literacy scores as adults from advantaged backgrounds with at least upper secondary education. Another important transmission channel of cumulative disadvantages is explained by the impact of work intensity and the use of skills on skills proficiency. A more elaborated analysis performed in the ESDE Report 2014 (Chapter 2) shows that work history has a particularly strong impact on the level of skills. Those who have been in paid work for most of their working life perform better than those who have been unemployed for considerable periods of time. The longer individuals have been in paid work, the higher their relative performance in numeracy, literacy and, to a lesser extent, problem solving. One more year of paid work per year of age produces a PIAAC score between one and two points higher, in all dimensions of skills proficiency. This holds true after controlling for age, sex, country of origin, and educational attainment level. Moreover, this is also controlled for variables which describe the relevant individual work environment (having specific ICTexperience, being exposed to tasks which involve complex problem solving). 40 This analysis confirms the strong link between people's work history and their skills proficiency. At any level of educational attainment, the possibility of using skills at work is associated with a higher performance. This, in turn, has strong implications for future labour market prospects of individuals, generating cumulative (dis)advantages. References Bonfanti, S. and Xenogiani, T. (2014), Migrants skills: Use, mismatch and labour market outcomes A first exploration of the International Survey of Adult Skills (PIAAC), in OECD/European Union (2014), Matching Economic Migration with Labour Market Needs, OECD Publishing. forthcoming. Dinis da Costa, P., Rodrigues, M., Vera-Toscano, E. and Weber, A. (2014), Education, Adult Skills and Social Outcomes. Empirical evidence from the Survey on Adult Skills (PIAAC 2013), Luxembourg: Publications Office of the European Union. doi: / European Commission (2013), The Survey of Adult Skills (PIAAC): Implications for education and training policies in Europe. Hanushek, E. A., Schwerdt, G., Wiederhold, S. and Woessmann, L. (2013), Returns to Skills around the World: Evidence from PIAAC, NBER Working Paper No 19762, December 2013, OECD (2001), The Well-being of Nations, The role of human and social capital, OECD Publishing. DOI: / en. OECD (2012), Better Skills, Better Jobs, Better Lives: A Strategic Approach to Skills Policies, OECD Publishing, doi: / en. OECD (2013a), The Survey of Adult Skills: Reader s Companion, OECD Publishing. OECD (2013b), OECD Skills Outlook 2013: First Results from the Survey of Adult Skills, OECD Publishing. doi: / en. Quintini, G. (2014), Skills at Work: How Skills and their Use Matter in the Labour Market, OECD Social, Employment and Migration Working Papers, No 158, OECD Publishing Forthcoming ESDE Report 2014, Chapter 2. September2014 I 48
49 Annex Table A1: Summary for each country of proficiency scores in key information-processing skills, 2012 Mean proficiency scores of and year olds in literacy, numeracy and problem solving in technology-rich environments EU-17 (Literacy and numeracy)/ EU-13 (problem solving) Literacy Numeracy Problem solving b AT BE(FL) CY CZ DK EE FI FR DE IE IT NL PL SK ES SE UK(England/No rthern Ireland) CA JP KO NO RF c US Notes: a Mean score statistically significantly different from EU-17 average (EU-13 for problem solving (above average in green, below average in red)). b Problem solving was not tested in Spain, France, Cyprus and Italy. c Data for the Russian Federation (RF) do not cover the Moscow municipal area. Source: Survey of Adult Skills 2012 (PIAAC). September2014 I 49
, DK (only five countries with around 10 points more than the EU average).")
50 Chart A1: Mean numeracy proficiency scores, by age group and group of countries Notes: a Top- and bottom-ranking EU countries based on the mean score of year olds being statistically significantly different from the EU average. b Top-ranking EU: FI, NL, SE, BE (Flanders), DK (only five countries with around 10 points more than the EU average). c Big six EU: DE, UK (England/Northern Ireland), PL, FR, IT, ES. d Bottom-ranking EU: IE, PL, FR, IT, ES, UK (England/Northern Ireland) all countries scored statistically significantly below the EU average. e Countries are ranked according to the descending mean score of the age group. f Data for the Russian Federation (RF) do not cover the Moscow municipal area. Source: Survey of Adult Skills 2012 (PIAAC). September2014 I 50
 are missing.")
.")
51 Chart A2: Mean problem-solving proficiency scores, by age group and group of countries Notes: a Top- and bottom-ranking EU countries based on the mean score of year olds being statistically significantly different from the EU average. b Top-ranking EU: FI, NL, SE. c EU average without FR, IT, ES, CY. d No average for big six EU countries because three (FR, ES, IT) are missing. e Bottom-ranking EU: IE, PL, EE. f Countries are ranked according to the descending mean score of the age group. f Data for the Russian Federation (RF) do not cover the Moscow municipal area. g The EU-13 EU countries participating in the survey, except for Spain, France, Cyprus and Italy where module was not used. Source: Survey of Adult Skills 2012 (PIAAC). Chart A3: Percentage of population by proficiency levels in numeracy, for each age group and each country Note: a Data presented according to the ascending proportion of year olds at level 1 and below it. b The EU-17 average is weighted according to population. c Data for the Russian Federation (RF) do not cover the Moscow municipal area. d The difference to 100 % is literacy-related non-response. Source: Survey of Adult Skills 2012 (PIAAC). September2014 I 51
52 September 2014 I 52
53 Supplement 2: Towards a better measurement of welfare and inequalities 1. Introduction This supplement briefly reviews a set of indicators that complement Gross Domestic Product (GDP) growth. They provide a more comprehensive measure of growth in society, encompassing not only macro-economic performance but also progress in other important aspects of sustainable and inclusive growth. Building on the chapter on Indicators of inclusive growth to complement GDP growth of ESDE 2013, 41 which contributed to the Beyond GDP debate, 42 this supplement updates some of the ESDE analysis and examines social aspects and distributional trends since the first half of the 2000s. First, it sketches the situation across the EU and then looks at selected Member States. GDP is the most widespread measure of macro-economic performance. In order to reflect progress in our societies more broadly, it needs to be complemented by measures of environmental sustainability and social progress. The limitations of GDP as a measure of key societal goals such as well-being and sustainable development are widely recognised, 43 notably in the report by Stiglitz et al. (2009). 44 At political level, the Europe 2020 strategy, which is based on a vision of smart, sustainable and inclusive growth 45, acknowledges that improvements brought about by economic growth ought to be distributed widely and fairly to all individuals in society. In the global arena, discussion is now underway to set up a new post framework for sustainable development, where goals that are supported by indicators other than GDP, including a focus on social cohesion, would help direct policies towards more inclusive and sustainable growth. 46 A set of indicators is reviewed here which complement GDP per capita growth as a measure of the socio-economic progress of societies. They focus on distributional measures in particular. These indicators cover growth in average and median household income, including for specific income quintiles, as well as inequality indicators and inequality-adjusted growth in GDP per capita. 2. Developments across the EU The EU is undergoing a rather fragile economic recovery. The economy expanded in all Member States from 2000 until the pre-crisis peaks in 2007/ The effects of the double-dip crisis have sometimes been severe, and economic activity remains below peak levels in many Member States GDP per capita as a measure of the standard of living in a society Growth in real GDP per capita is often used to measure improvements in average living standards in a society, the rationale being that all citizens benefit from their country s increased output (or bear its losses). It shows the extent to which the total growth in the production of 41 European Commission (2013), Employment and Social Developments in Europe 2013, Chapter 7: Indicators of inclusive growth to complement GDP growth 42 European Commission (2009), GDP and beyond: Measuring progress in a changing world, Communication from the Commission to the Council and the European Parliament, COM(2009) 433 final. 43 For review, see van den Bergh, J. (2009), The GDP Paradox, Journal of Economic Psychology, 30: pp Stiglitz, J., Sen, A., Fitoussi, J-P. (2009), Report by the Commission on the Measurement of Economic Performance and Social Progress. 45 The European 2020 Strategy is about delivering growth that is: smart, through more effective investments in education, research and innovation; sustainable, thanks to a decisive move towards a low-carbon economy; and inclusive, with a strong emphasis on job creation and poverty reduction. The strategy is focused on five ambitious goals in the areas of employment, innovation, education, poverty reduction and climate/energy. See 46 See Millennium Development Goals at 47 Member States reached a pre-crisis peak in 2007 (DK EE EL ES FI FR IE IT LU LV PT SE UK) or 2008 (AT BE BG CY CZ DE HR HU LT MT NL PL RO SI SK). 48 See the recurrent part of the ESSQR for latest developments in GDP. September 2014 I 53
54 goods and services (additional wealth) is shared by the population, and the potential for improving each individual s well-being through an increase in GDP. Real GDP per capita is calculated as the ratio of real GDP to the average population of a specific year (as reflected by the European system of National Accounts). Real GDP is the result of removing price changes from one year to another, thus allowing for comparisons based on the volume, rather than the nominal value, of goods and services produced. Real GDP per capita gives a measure of average real income in the country. It is not, however, a comprehensive measure of economic welfare. For example, it does not include most unpaid household work and does not take account of the negative effects of economic activity, such as environmental degradation. GDP per capita does not measure the effective distribution of the existing wealth a country is able to generate. Real GDP and real GDP per capita improved in all EU Member States between 2000 and , when the crisis began. Real GDP per capita growth was particularly high in some of the new Member States (BG, EE, LT, LV, RO and SK) between 2000 and 2007/2008 (Chart 1). As a result of the economic crisis, real GDP dropped (-5 % in 2009 in the EU) and kept declining for many EU Member States up until 2013 and 2014, with particularly negative impact on the living standards of the EU population. 49 In , the GDP per capita for most Member States was still lower than in These were the countries that suffered from the double-dip recession or where the initial recession was extremely severe. In particular, GDP per capita has continually declined since the beginning of the crisis in Cyprus and, most markedly, in Greece (Chart 2). 2.2 (Adjusted) gross disposable household income per capita as a measure of the welfare of households GDP per capita mainly reflects the level of economic activity, but it does not measure what individuals actually accrue, since not all the wealth created in a country accrues to households. 51 In this context, household disposable income can better describe the welfare situation of households. Gross 52 disposable household income (GDHI) mainly comprises income from work, social transfers, property income and other transfers, and is net of taxes. In addition to GDHI, populations benefit from in-kind services that governments provide (e.g. education, health and social security services). GHDI is then adjusted to include these items to produce adjusted GDHI. Adjusted GDHI can be considered as a more extensive measure of the welfare of households. Real gross disposable household income per capita (measured by National Accounts) is calculated as the ratio of real gross disposable income of households and non-profit institutions serving households (NPISH) to the average population of a specific year. (Gross) disposable household income (GDHI) comprises payments to employees, revenues of the self-employed, net property income, net social benefits, net social contributions, and net other current transfers; it is net of current taxes on income and wealth. Gross means that income is calculated before deducting the consumption of fixed capital. Real GDHI is deflated by the price index of household final consumption expenditure, measured in national currency. Adjusted GDHI includes in-kind services that the government provides, i.e. education, health and social security services. 49 The population has grown in the post crisis-period in most Member States, except BG, DE, EE, EL, HR, HU, LT, LV, PT, RO and SK is selected due to GDHI availability. See the recurrent part of the ESSQR for latest developments in GDP. 51 In the EU around 65 % of the national income accrues to households and non-profit institutions serving the household sector, and this share varies over time. The rest of the income accrues to non-financial corporations, financial corporations and general government. 52 In National Accounts, gross refers to items calculated before deducting the consumption of fixed capital and net refers to items calculated after this deduction. September2014 I 54
55 Economic growth had contributed to improvements in the economic situation and welfare of households in all Member States between 2000 and However, growth in both real GDHI per capita and real adjusted GDHI per capita was slower than in real GDP per capita in one third of Member States. In general, social transfers in kind (included in adjusted GDHI) made some contribution to the growth in GHDI with the exception of Latvia (Chart 1). The size of the adjustment of household income to the economic shock varied across countries depending on the size of the economic crisis, its impact on employment and on the adjustment of taxes and transfers. The functioning of automatic stabilisers and the impact of stimulus packages protected household income during the early phase of the crisis, but these were eroded in the second phase of the crisis. 53 By 2012, many of the Member States that had registered a decline still had a household disposable income level that was lower than that of Real GDHI per capita (and real adjusted GDHI per capita) sometimes declined more strongly than real GDP per capita after the onset of the crisis, with large differences observed in EL, ES, HU, LV and RO. Conversely, in some countries, such as DK, FI and LU, household incomes were maintained during the crisis in spite of significant declines in GDP per capita. The contribution of in-kind services to household income during the crisis varied across the EU. They were generally similar Among Members States with growing or stable household income, GDHI and adjusted GDHI per capita growth were generally similar. In some Member States (notably EE, IE, NL and SI), the provision of in-kind services appears to have limited the decline in household income. By contrast, expenditure on in-kind services declined in some other Member States (notably in HU, LV and PT) compounding the decline in GDHI (Chart 2). 53 European Commission (2013), Employment and Social Developments in Europe 2013, Chapter 6: Efficiency and effectiveness of social expenditure in the crisis. September2014 I 55
56 % change (pre-crisis peak (2007/2008) ) PL SK DE LT BG SE AT FI DK LU BE FR CZ EU28 EE NL PT UK ES SI HR IE CY RO HU LV IT EL LV LT RO EE EL FI SE CY ES DK FR UK EU28 NL BE IT PT BG SK HR CZ PL SI HU IE AT DE % change ( pre-crisis peak (2007/2008) ) EU Employment and Social Situation Chart 1: Growth in GDP per capita, GDHI per capita and adjusted (incl. in-kind services) GDHI per capita in EU Member States before the onset of the crisis, 2000 to 2007/2008 GDP, GDHI and adjusted GDHI per capita grew in real terms until 2007/2008 in all Member States. In one third of Member States, growth in GDHI/adjusted GDHI was slower than in GDP. Growth in adjusted GDHI was similar to or higher than GDHI (except for LV) GDP per capita GDHI per capita Adjusted GDHI per capita growth GDHI > GDP growth GDHI ~ GDP growth GDHI < GDP Source: Eurostat, National Accounts (DG EMPL calculations). Note: Pre-crisis peak: 2007 (DK EE EL ES FI FR IE IT LU LV PT SE UK), 2008 (AT BE BG CY CZ DE HR HU LT MT NL PL RO SI SK). Countries grouped by difference in GDHI-GDP, and sorted by GDP within the group. GDHI/adjusted GDHI: deflated by price index of household final consumption expenditure; BG, HR, IE and EU instead of 2000, no data for MT and LU. Chart 2: Growth in GDP per capita, GDHI per capita and adjusted (incl. in-kind services) GDHI per capita in EU Member States after the onset of the crisis, 2007/ In 2012, GDP per capita and GDHI per capita have not returned to pre-crisis levels in most Member States. GDHI per capita deteriorated more than GDP per capita in some countries GDP per capita GDHI per capita Adjusted GDHI per capita GDHI up GHDI stable/down less/ down similar GHDI down more GDP up or stable GDP down Source: Eurostat, National Accounts (DG EMPL calculations). Note: Pre-crisis peak: 2007 (DK EE EL ES FI FR IE IT LU LV PT SE UK), 2008 (AT BE BG CY CZ DE HR HU LT MT NL PL RO SI SK). GDP data available but 2012 selected to compare with GDHI. Countries grouped by difference in GDHI- GDP, and sorted by GDP within the group. GDHI/adjusted GDHI: deflated by price index of household final consumption expenditure; RO 2011 instead of 2012, no data for MT. September 2014 I 56
57 2.3 Median equivalised disposable household income as a measure of the living standards of a typical individual While providing a better view of households welfare, the GDHI per capita indicator (just as the GDP per capita) still refers to average incomes and therefore masks distributional differences. The first step in overcoming this and analysing how available resources are distributed across individuals or households is to look at the disposable income of the median individual, 54 as this is not affected by extreme values at the top of the income distribution. The disposable income of households includes income from work, social transfers, property income and other transfers, and is net of taxes. It is equivalised to take into account household size and structure. Median disposable equivalised household income better reflects progress in the middle of the income distribution. Real median equivalised disposable household income is a measure based on the EU- SILC survey. Disposable household income is the total income of all household members (income of employees and the self-employed and the social benefits of all individuals, plus household s investments and social benefits, after tax and other deductions) that is available for spending or saving. These components are broadly similar to the components of GDHI; however differences in income exist in National Accounts in EU-SILC. It is equivalised in following way: total disposable income is divided by the number of equivalent adults (sum of weights of each member according to their age, using the modified OECD equivalence scale 1.0 for the first adult, 0.5 for the second and each subsequent person aged 14 and over, 0.3 for each child aged under 14), and then attributed equally to each member of the household. Median is the amount of income that divides the equivalised disposable household income distribution into two equal groups, half having income above that amount, and half having income below that amount. Real median equalised disposable household income is adjusted by inflation (HICP). Real median equivalised disposable household income is a measure of the living standards of a typical member of society, but it does not take account of income in kind. Real median equivalised disposable household income for each income quintile measures living standards at different parts of distribution, including at the bottom and the top. In line with economic developments, the real median disposable equivalised household income expanded in all Member States between 2005 and This was especially the case in some of the new Member States (BG, EE LV, LT, PL SK), where the cumulative growth in median income exceeded the already very high cumulative growth in GDP per capita in that period (Chart 3). As a result of economic deterioration and employment losses, increases in unemployment and long-term unemployment, equivalised median income has declined in nearly all Member States at some point since the onset of the crisis. By 2011 it had still not reached the level of in most countries. In particular, real median income declined significantly in EL, IE, LT, LV and ES, exceeding by far the decline in GDP per capita (Chart 4) Median equivalised disposable household income per quintile, including measures of living standards at the bottom and top It is also important to examine developments in the different parts of the income distribution, in particular at the bottom and at the top of the distribution, in order to have a better picture of the sharing of the benefits of economic growth (and likewise the distributional impact of a recession). The comparative analysis across the EU is complex. Section 3 will analyse real growth in median income per quintile for selected Member States. 54 An income level where half of all individuals are above it, and half below is selected due to SILC data availability, which differs for EU Member States. September2014 I 57
58 % change (pre-crisis peak (2007/2008) ) PL DE SK MT BG SE AT CZ FR HU FI DK SI CY LU BE EU28 NL RO IT HR PT LT ES UK EE IE LV EL LT SK LV BG PL EE SE UK IE ES PT CZ MT NL EU28 HU BE DK IT RO SI FI DE EL LU AT CY % change ( pre-crisis peak (2007/2008) ) EU Employment and Social Situation Chart 3: Growth in GDP per capita and median income in EU Member States before the onset of the crisis, 2005 to 2007/2008 GDP per capita and median income grew in real terms until 2007/2008 in all Member States; however in some Member States growth in median income was slower than in GDP GDP per capita Median income growth Median Income > GDP growth Median Income ~ GDP growth Median Income < GDP Source: Eurostat, EU-SILC (DG EMPL calculations). Note: Pre-crisis peak: 2007 (DK EE EL ES FI FR IE IT LU LV PT SE UK), 2008 (AT BE BG CY CZ DE HR HU LT MT NL PL RO SI SK). Countries grouped by difference in median-gdp and sorted by GDP within the group. Median income: deflated by inflation (HICP); years refer to income years not survey years; EU27 instead of EU28 for , DE and RO 2006 instead of 2005, no data for FR and HR. Chart 4: Growth in GDP per capita and median income in EU Member States after the onset of the crisis, 2007/2008 to 2011 In 2011, GDP per capita and median income have not returned to pre-crisis levels in most Member States. Median income deteriorated more than GDP per capita in some countries GDP per capita Median income Median Income up/down less Median Income down silmilar Median Income down more GDP up/stable GDP down Source: Eurostat, EU-SILC (DG EMPL calculations). Note: Pre-crisis peak: 2007 (DK EE EL ES FI FR IE IT LU LV PT SE UK), 2008 (AT BE BG CY CZ DE HR HU LT MT NL PL RO SI SK). GDP available but 2011 selected to compare with median income. Countries grouped by difference in median-gdp, sorted by GDP within the group. Median income: deflated by inflation (HICP); years refer to income years not survey years; AT and UK 2010 instead of September2014 I 58
59 2.4 Standard indicators of income inequality Inequality in income distribution is captured by several well-established measures. 56 Deciding which indicator to use depends on which particular aspects of the differences in the income distribution are considered the most important, e.g. the gap between the income received by the top quintile compared to that received by the bottom quintile (S80/S20), or that of the top 10 % compared to that of the bottom 40 % (Palma ratio), or the extent to which the distribution of income among individuals differs from a perfectly equal distribution (Gini coefficient). Section 3 will analyse some of the inequality measures for selected Member States. The Gini coefficient measures the extent to which the distribution of equivalised disposable income of individuals deviates from a perfectly equal distribution. A Gini index of zero represents perfect equality and 1 (or 100 %), perfect inequality. It is relatively insensitive to the tails of the income distribution, being more sensitive to changes around the mode, making it relatively robust as regards problems associated with the reliability of extreme values. The S80/S20 ratio (or the income quintile share ratio) is the ratio of total income received by the 20 % of the population with the highest income (the top quintile) to that received by the 20 % of the population with the lowest income (the bottom quintile). If S80/S20 is equal to x, the implication is that the average income of the richest 20 % of the population is x times higher than the average income of the poorest 20 %. This ratio represents an effective way to measure the distance between the extremes of a distribution. However, it ignores the information on income and income dispersion between the 20th and the 80th percentiles, which constitutes the majority of the population. The presence of extreme income values, belonging to either the upper or the lower tail of the income distribution, could produce a high value of the ratio even if the inter-quintile range 80/20 is fairly equitable. The Palma ratio (top 10 %/bottom 40 %) is the ratio of the top 10 % of the population s share of income divided by the poorest 40 % of the population s share of income. It is based on the observation that, in countries at quite different income levels, the five middle deciles (5 to 9) tend to capture around 50 % of national income. However, the other half of national income is shared between the richest 10 % and the poorest 40 %, but the share held by each varies considerably across countries. It may be a more relevant measure of inequality for poverty reduction policy as it is intuitively easier to understand than the Gini. For a given, high Palma value, it is clear that raising the share of national income of the poorest 40 % and/or reducing the share of the top 10 % narrows the gap Gap between the top quintile compared to the bottom quintile S80/S20 ratio Country income inequality is commonly measured by the distance between the extremes of the income distribution the income quintile share ratio S80/S20 (see box). Analysis of the S80/S20 shows a very mixed picture concerning recent developments in inequality across EU Member States between 2005 and Some countries (BE, DE, HU, LT, LV, PL, PT, RO and SK) experienced a trend toward greater equality of the income distribution; however the S80/S20 has increased since 2008 in HU. By contrast, in some countries (BG, CY, DK, EL and ES) the S80/S20 has increased since 2005, though it has been stable in DK since In a few others (SI, IE, EE, IT) inequality appears to have increased since 2008 after decreasing between 2005 and For the remaining countries there was little change in the income ratio or no decline below the 2005 level. 56 Se Chapter 7 of ESDE September2014 I 59
60 RO HU SK LV PL EE SI DE EL LU SE IE BE PT IT LT CZ MT AT CY EU28 DK ES UK NL FI BG % change ( pre-crisis peak (2007/2008) ) point change EU Employment and Social Situation Chart 5: Income quintile S80/S20 ratio in 2005, 2008 and 2011 S80/S20 shows a mixed picture of recent developments in inequality across the EU SK BE DE PL LT PT RO LV HU CZ NL FI SE AT MT LU FR HR UK SI IE EE IT DK CY BG EL ES up on 2008 up on 2008 up on 2008 decrease on 2005 stable increase on 2005 Source: Eurostat, EU-SILC (DG EMPL calculations). Note: Years refer to income years not survey years. Countries grouped by difference , and sorted by S80/S20 within the group. EU27 instead of EU28 for 2005 and 2008, DE and RO 2006 instead of 2005, FR 2007 instead of 2005, AT and UK 2010 instead of Chart 6: Growth in GDP per capita and S80/S20 in EU Member States before the onset of the crisis, 2005 to 2007/2008 GDP per capita grew in real terms until 2007/2008 in all Member States. S80/S20 declined or remained unchanged in most Member States, and increased in a few countries GDP per capita (lhs) S80/S20 (rhs) S80/S20 down S80/S20 stable S80/S20 up Source: Eurostat, EU-SILC (DG EMPL calculations). Note: Pre-crisis peak: 2007 (DK EE EL ES FI FR IE IT LU LV PT SE UK), 2008 (AT BE BG CY CZ DE HR HU LT MT NL PL RO SI SK). Countries grouped by difference in S80/S20-GDP, and sorted by GDP within the group. S80/S20: deflated by inflation (HICP); years refer to income years not survey years; EU27 instead of EU28 for , DE and RO 2006 instead of 2005, no data for FR and HR. September2014 I 60
61 % change (pre-crisis peak (2007/2008) ) DE MT PL AT SK BG SE LV UK RO LT NL PT LU HRFI EU28 FR BE CZ SI CY IE IT EE HU EL DK ES point change EU Employment and Social Situation Chart 7: Growth in GDP per capita and in the S80/S20 in EU Member States after the onset of the crisis, 2007/2008 to 2011 In 2011, GDP per capita has not returned to pre-crisis levels in most Member States. The S80/S20 increased significantly in some Member States GDP per capita (lhs) S80/S20 (rhs) GDP up/stable S80/S20 down S80/S20 stable S80/S20 up GDP down Source: Eurostat, EU-SILC (DG EMPL calculations). Note: Pre-crisis peak: 2007 (DK EE EL ES FI FR IE IT LU LV PT SE UK), 2008 (AT BE BG CY CZ DE HR HU LT MT NL PL RO SI SK). GDP available but 2011 selected to compare with S80/S20. Countries grouped by difference in S80/S20- GDP, and sorted by GDP within the group. S80/S20: years refer to income years not survey years; AT and UK 2010 instead of Inequality-adjusted growth Distributional variations in income across the population can be taken into account by adjusting GDP per capita data, or any other income variable. The most commonly used distributionallysensitive measures of national income are those developed by Sen, Atkinson and Jenkins. 57 For instance, inequality-adjusted GDP per capita (i.e. adjusted by the factor 1-Gini) enables a comparison to be made across countries in terms of the real per capita incomes of the first 70 % of the population. Inequality-adjusted (1-Gini) GDP per capita is adjusted by the Sen index with the factor (1 Gini). Since a higher inequality implies a lower (1-Gini), this penalises regions or countries with higher inequalities, i.e. income is adjusted downwards if inequality measured by the Gini is high. The inequality-discounted GDP per capita (i.e. adjusted by the factor 1- Gini) can be interpreted as a measure of the relative per capita income of the first 70 % of a nation s population, and as such is a measure of the income of the vast majority of the population. Both real GDP per capita and inequality-adjusted GDP per capita grew between 2005 and 2007/2008 in all Member States. In some Member States, however, inequality-adjusted GDP per capita grew faster, in some slower and in some at a similar pace (Chart 8). By 2011, most Member States still had an inequality-adjusted GDP per capita that was lower than that of , in response to the economic shock. However, the gap in growth between GDP per capita and inequality-adjusted GDP per capita varied across the EU. The largest differences in the decline in real inequality-adjusted GDP per capita and real GDP per capita were registered in HR and ES. Interestingly, some countries (LV, NL, PT and RO) managed to decrease inequality (Chart 9). 57 See Chapter 7 of ESDE September2014 I 61
62 % change (pre-crisis peak (2007/2008) ) PL DE SK MT BG SE AT LT LV RO NL PT UK CZ FI IE BE LU EU28 FR EL IT SI CY EE HU DK ES SK LV PL EE SI EL HU IE BE PT IT CZ MT FI LU AT SE EU28 ES RO LT BG DE NL CY UK DK % change ( pre-crisis peak (2007/2008) ) EU Employment and Social Situation Chart 8: Growth in GDP per capita and inequality (1-Gini)-adjusted GDP per capita growth in EU Member States before the onset of the crisis, 2005 to 2007/2008 GDP per capita and inequality-adjusted GDP per capita grew in real terms before 2007/2008 in all Member States; however in some Member States, growth in inequality-adjusted GDP per capita was slower GDP per capita GDP per capita (1-GINI) adjusted 0 growth GDP-adj > GDP growth GDP-adj ~ GDP growth GDP-adj < GDP Source: Eurostat, National Accounts and EU-SILC (DG EMPL calculations). Note: Pre-crisis peak: 2007 (DK EE EL ES FI FR IE IT LU LV PT SE UK), 2008 (AT BE BG CY CZ DE HR HU LT MT NL PL RO SI SK). GDP (1-Gini) adjusted: years refer to income years not survey years; EU27 instead of EU28 for , DE and RO 2006 instead of 2005, no data for FR and HR. Chart 9: Growth in GDP per capita and inequality (1-Gini)-adjusted GDP per capita in EU Member States after the onset of the crisis, 2007/2008 to 2011 In 2011, GDP per capita and inequality-adjusted GDP per capita have not returned to pre-crisis levels in most Member States. Deterioration in inequality-adjusted GDP per capita was greater than in some countries GDP per capita GDP per capita (1-GINI) adjusted GDP-adj up/down less GDP-adj down silmilar GDP-adj down more GDP up/stable GDP down Source: Eurostat, National Accounts (DG EMPL calculations). Note: Pre-crisis peak: 2007 (DK EE EL ES FI FR IE IT LU LV PT SE UK), 2008 (AT BE BG CY CZ DE HR HU LT MT NL PL RO SI SK). GDP available but 2011 selected to compare with GDP (1-Gini) adjusted. GDP (1-Gini) adjusted: years refer to income years not survey years; AT and UK 2010 instead of September2014 I 62
63 3. Developments in selected Member States Overall, the analysis of beyond GDP indicators reveals a mixed picture across the EU and across indicators. The relationship between economic growth, household income and inequality is a complex one, given different country features. In particular, the timing and depth of the recession, and subsequent adjustments in total household income and changes in income distribution, vary across Member States. This section examines the situation in selected Member States, while the annex contains charts for the remaining ones. September 2014 I 63
64 France The French economy contracted strongly in 2009, has not recovered. and GDP stagnated in the first half of Real GDP per capita has been in decline due partly to population growth, and remains below the pre-crisis level. The effect of the economic shock on household income was initially well contained. Real GDHI per capita has been increasing (even in 2009 when employment contracted but social benefits and wages increased and taxes decreased 58 ), only declining sharply in Social transfers in kind (included in adjusted GDHI) have also been increasing over the years and have added to household income (panel a). Median individual income improved slightly, following an improvement in disposable household income in 2009 despite the recession. Real median equivalised disposable household income remains slightly higher than in 2007, despite a large decline in However, the incomes of poorer individuals have deteriorated considerably. Incomes 59 in the first and second quintiles have declined in real terms, and incomes in the bottom quintile in particular remain much lower than in By contrast, real incomes of wealthier individuals have remained above (for the fourth income quintile) or around the 2007 (the fifth top income quintile) level (panel b). Inequalities increased slightly in 2010, but less compared to other Member States. The Gini rose above 30 %, the S80/S20 reached 4.6, and the Palma ratio exceeded (panel c). Inequalityadjusted (1-Gini) real growth for GDP per capita had a similar pattern to real GDP per capita growth until 2009, but fell below it in 2010 (panel d). Nevertheless, the changes in GDHI per capita, median income and inequality indicators for France are low compared to changes in other Member States. Chart 10: Indicators for France a) Economic growth and income growth - cumulative growth in real terms b) Median income growth within quintiles - cumulative growth in real terms GDP per capita GDHI per capita Adjusted (incl in-kind serv.) GDHI per capita Median Income st (bottom) quintile 2nd quintile 3rd quintile - Median 4th quintile 5th (top) quintile c) Income inequality d) Growth and inequality adjusted growth - cumulative growth in real terms GINI (lhs) S80/S20 (rhs) GDP per capita Palma ratio (rhs) GDP per capita (1- GINI) adjusted Source: Eurostat, National Accounts, EU-SILC; OECD (DG EMPL calculations) =100 as a reference year for the analysis, because of EU-SILC data availability. SILC income years not survey years. GDHI deflated by price index of household final consumption expenditure; median incomes deflated by inflation (HICP). 58 See the annex in the recurrent part of the ESSQR for quarterly developments in GDHI. 59 More precisely, median incomes of each quintile are analysed. 60 OECD estimates of GINI and S80/S20 are lower than Eurostat ones for but higher for September 2014 I 64
65 Germany The German economy contracted very strongly in 2009 wiping out the progress made since mid It had recovered well by 2011 but economic output recently saw a decline. GDP per capita has followed the same path (since changes in population have been negligible) it recovered and remained higher than in 2006, only stagnating since the beginning of The effect of the economic shock in 2009 on household income was well contained. Real GDHI per capita has almost constantly been on an upward trend (remaining stable in 2009 due to limited employment redundancies and an increase in social benefits 61 ). Social transfers in kind (included in real adjusted GDHI) have been increasing continuously, gaining especially in 2009, and have added to household income (panel a). The evolution of median individual income has been more modest than that of the economy. Real median equivalised disposable household income remains very close to the level observed in Looking at the distribution tails, Germany has seen some cumulative improvement in the incomes of the poorest individuals measured by real income 62 in the first quintile and a stagnation of incomes of the 20 % richest individuals (panel b). Inequalities have largely been declining since In 2011, the Gini fell by 2 points to below 30 %, the S80/S20 went down to 4.3, and the Palma ratio stood at 1.1 (panel c). Progress made in reducing inequality resulted in the inequality adjusted (1-Gini) real growth for GDP per capita being higher than the unadjusted figures since 2008 (panel d). Overall, developments in the GDP and beyond measures in Germany have recently been better than in other Member States. Chart 11: Indicators for Germany a) Economic growth and income growth - cumulative growth in real terms b) Median income growth within quintiles - cumulative growth in real terms GDP per capita GDHI per capita Adjusted (incl in-kind serv.) GDHI per capita Median Income st (bottom) quintile 2nd quintile 3rd quintile - Median 4th quintile 5th (top) quintile c) Income inequality d) Growth and inequality adjusted growth - cumulative growth in real terms GINI (lhs) S80/S20 (rhs) Palma ratio (rhs) GDP per capita GDP per capita (1- GINI) adjusted Source: Eurostat, National Accounts, EU-SILC; OECD (DG EMPL calculations) =100 as a reference year for the analysis, because of EU-SILC data availability. SILC income years not survey years. GDHI deflated by price index of household final consumption expenditure; median incomes deflated by inflation (HICP). 61 See the annex in the recurrent part of the ESSQR for quarterly developments in GDHI. 62 More precisely, median incomes of each quintile are analysed. 63 However, OECD estimates of GINI and S80/S20 are lower than those of Eurostat for but higher for 2011, implying an increase in inequality in September2014 I 65
66 Greece The Greek economy grew more than that of most other Member States until 2007, but then went into a severe recession. GDP per capita has followed the same path (since changes in population have been negligible) it has been in decline and remains much below the pre-crisis peak, receding to the 2000 level. The effect of the economic shock on household income has been severe. Between 2004 and 2007, household income improved faster than the economy, but since then real GDHI per capita, has been in continuous decline, which has been particularly strong since 2010 (when cuts in social benefits accompanied large declines in income from work 64 ). Social transfers in kind have also been cut sharply since 2010, and adjusted GDHI per capita has declined at the same pace as GDHI to the 2000 level (panel a). Median individual income has tracked economic and total income growth, although the positive changes were smaller and negative ones larger. Real median equivalised disposable household income generally improved from 2003 to 2009, but all progress was wiped out in 2010 and Incomes of the poorest individuals have suffered the most. Real income 65 in the bottom quintile has declined the most and remains 30 points lower than in Real incomes of individuals in other quintile groups have also declined, but not as much, and remain 20 points lower than in 2003 (panel b). Inequalities have increased since The Gini rose to nearly 35 %, the S80/S20 reached 6.6, up 1 point on 2009, while the Palma ratio remained stable at (panel c). Inequality-adjusted (1-Gini) real growth for GDP per capita followed a similar pattern to real GDP per capita growth until 2009, and started to drop below it in (panel d). Overall, economic developments and decreases in GDHI per capita and median income in Greece, along with the recent increase in inequality, have been the most severe in the EU. Chart 12: Indicators for Greece a) Economic growth and income growth - cumulative growth in real terms b) Median income growth within quintiles - cumulative growth in real terms GDP per capita GDHI per capita Adjusted (incl in-kind serv.) GDHI per capita Median Income st (bottom) quintile 2nd quintile 3rd quintile - Median 4th quintile 5th (top) quintile c) Income inequality d) Growth and inequality adjusted growth - cumulative growth in real terms GINI (lhs) S80/S20 (rhs) Palma ratio (rhs) 130 GDP per capita GDP per capita (1- GINI) adjusted Source: Eurostat, National Accounts, EU-SILC; OECD (DG EMPL calculations) =100 as a reference year for the analysis, because of EU-SILC data availability. SILC income years not survey years. GDHI deflated by price index of household final consumption expenditure; median incomes deflated by inflation (HICP). 64 See the annex in the recurrent part of the ESSQR for quarterly developments in GDHI. 65 More precisely, median incomes of each quintile are analysed. 66 OECD estimates of GINI and S80/S20 are similar to those of Eurostat for but lower for September 2014 I 66
67 Italy The economy grew less than that of many other Member States until 2007, and up until now, Italy has been experiencing a double-dip recession. The decline in GDP per capita has been even greater, partially due to population growth, and real GDP per capita has receded to the mid-90 level. The effect of the economic shock on household income has been severe. After a period of modest improvement up to 2007, real GDHI per capita has been on a continuous decline (due to cuts in income from work and in property incomes, despite large support in the form of social benefits in ). Social transfers in kind have been cut back since 2007, and adjusted GDHI per capita declined slightly faster than GDHI, to the lowest level since data became available (panel a). Median individual income has tracked economic and total income growth, although there were more positive changes (as measured by the EU-SILC). Median equivalised disposable household income generally improved until 2007 in real terms, but the subsequent declines wiped out all progress that had been made since data became available. Incomes of poorer individuals have greatly deteriorated. Real income 68 in the bottom quintile deteriorated the most and remains much lower than in 2007, erasing any notable progress made since However, real incomes of most wealthy individuals, which had not been evolving fast in the pre-crisis level, also declined (panel b). Inequalities between the richest and the poorest have increased since The Gini rose slightly to 32.5 % and the Palma ratio remained stable at 1.2, but the S80/S20 reached 5.7, up 0.5 point on (panel c). Progress was made in reducing inequality, resulting in the inequality adjusted (1-Gini) real growth for GDP per capita being higher than for unadjusted figures until 2007, but recent increases in the Gini have brought both the downward curves closer together (panel d). Overall, economic developments and decreases in GDHI per capita and median income in Italy have been one of the worst in the EU, and inequality has returned to mid-2000 level. 67 See the annex in the recurrent part of the ESSQR for quarterly developments in GDHI. 68 More precisely, median incomes of each quintile are analysed. 69 OECD estimates of GINI and S80/S20 are similar to those of Eurostat ones. September 2014 I 67
68 Chart 13: Indicators for Italy a) Economic growth and income growth - cumulative growth in real terms b) Median income growth within quintiles - cumulative growth in real terms GDP per capita GDHI per capita Adjusted (incl in-kind serv.) GDHI per capita Median Income st (bottom) quintile 2nd quintile 3rd quintile - Median 4th quintile 5th (top) quintile c) Income inequality d) Growth and inequality adjusted growth - cumulative growth in real terms 6 30 GINI (lhs) S80/S20 (rhs) Palma ratio (rhs) GDP per capita GDP per capita (1- GINI) adjusted Source: Eurostat, National Accounts, EU-SILC; OECD (DG EMPL calculations) =100 as a reference year for the analysis, because of EU-SILC data availability. SILC income years not survey years. GDHI deflated by price index of household final consumption expenditure; median incomes deflated by inflation (HICP). September2014 I 68
69 Portugal The economy grew less than that of many other Member States until 2007, and it is uncertain whether Portugal is out of the double-dip recession. GDP per capita has followed the same path (since changes in population have been negligible) it receded to the level of the late 90s. The effect of the economic shock on household income was initially well contained, only becoming severe in the second phase of the recession. After a period of slow improvement until 2007, real GDHI per capita has been in continuous decline (due to large cuts in income from work 70 ). Social transfers in kind have been cut sharply since 2010, and adjusted GDHI per capita has receded to 2000 levels (panel a). Median individual income has tracked economic and total income growth, although there were more positive changes (as measured by the EU-SILC). Real median equivalised disposable household income generally improved until 2009, but subsequent declines have erased progress. The incomes of poorer individuals and in other quintiles except the top one have improved considerably until 2009, before steep declines in Nevertheless, incomes 71 in all but the top quintile remain higher than or at similar level as in 2004 in real terms. Real incomes of most wealthy individuals have generally declined (panel b). Inequalities had generally been in decline between 2004 and 2009, 72 and remained unchanged since then, but are still among the highest in the EU. The Gini went down from 38 % to 34 %, the S80/S20 went down from 7 to just above 5.5, while the Palma ratio went down to 1.4 (panel c). Progress in reducing inequality has resulted in the inequality adjusted (1-Gini) real growth for GDP per capita being higher than for unadjusted figures (panel d). Overall, cumulative decreases in GDHI per capita and median income in Portugal have been moderate compared to other Member States, but inequality remains among the highest in the EU. Chart 14: Indicators for Portugal a) Economic growth and income growth - cumulative growth in real terms b) Median income growth within quintiles - cumulative growth in real terms GDP per capita GDHI per capita Adjusted (incl in-kind serv.) GDHI per capita Median Income st (bottom) quintile 2nd quintile 3rd quintile - Median 4th quintile 5th (top) quintile c) Income inequality d) Growth and inequality adjusted growth - cumulative growth in real terms GINI (lhs) S80/S20 (rhs) Palma ratio (rhs) GDP per capita GDP per capita (1- GINI) adjusted Source: Eurostat, National Accounts, EU-SILC; OECD (DG EMPL calculations) =100 as a reference year for the analysis, because of EU-SILC data availability. SILC income years not survey years. GDHI deflated by price index of household final consumption expenditure; median incomes deflated by inflation (HICP). 70 See the annex in the recurrent part of the ESSQR for quarterly developments in GDHI. 71 More precisely, median incomes of each quintile are analysed. 72 OECD estimates of GINI and S80/S20 are similar to those of Eurostat ones. September 2014 I 69
70 Spain The Spanish economy went through a strong double-dip recession, wiping out the progress made since mid-2000, but there have been signs of recovery since mid Real GDP per capita, on an upward trend until 2009, has been declining more strongly since 2008, partially due to population growth, receding to levels. The effect of the economic shock on household income was initially well contained. Real GDHI per capita increased initially (even in 2009 when employment contracted and income from work decreased but social benefits increased and taxes decreased 73 ), but has declined sharply since 2010, to early 2000 levels. Social transfers in kind (included in the adjusted GDHI) also increased over the years, especially in 2009, adding to household income, but have declined sharply since 2010 (panel a). Median individual income has largely tracked economic and total income growth, although positive changes were smaller and it declined earlier. Real median equivalised disposable household income generally improved until 2007, but subsequent declines wiped out any improvement by 2011, bringing it to a level not observed since data became available. Incomes of the poorest individuals have suffered the most. Real incomes 74 in the first and second quintiles have declined the most and remain almost 20 and 10 points lower than in Real median incomes of individuals in richer quintile groups have also declined, but not as much and are no lower than in 2003 (panel b). Inequalities surged in 2009 and are the highest in the EU. The Gini rose to 35 %, the S80/S20 reached 7.2, up 1.5 points on 2008, while the Palma ratio remained more stable at (panel c). Inequality-adjusted (1-Gini) real growth for GDP per capita increased slightly more slowly than real GDP per capita growth until 2007, but started to deteriorated faster in 2009 (panel d). Overall, economic developments and decreases in GDHI per capita and median income in Spain have recently been among the most severe, and inequality is the worst in the EU. 73 See the annex in the recurrent part of the ESSQR for quarterly developments in GDHI. 74 More precisely, median incomes of each quintile are analysed. 75 OECD estimates of GINI and S80/S20 are lower than those of Eurostat ones for September 2014 I 70
71 Chart 15: Indicators for Spain a) Economic growth and income growth - cumulative growth in real terms b) Median income growth within quintiles - cumulative growth in real terms GDP per capita GDHI per capita Adjusted (incl in-kind serv.) GDHI per capita Median Income st (bottom) quintile 2nd quintile 3rd quintile - Median 4th quintile 5th (top) quintile c) Income inequality d) Growth and inequality adjusted growth - cumulative growth in real terms GINI (lhs) S80/S20 (rhs) Palma ratio (rhs) GDP per capita GDP per capita (1- GINI) adjusted Source: Eurostat, National Accounts, EU-SILC; OECD (DG EMPL calculations) =100 as a reference year for the analysis, because of EU-SILC data availability. SILC income years not survey years. GDHI deflated by price index of household final consumption expenditure; median incomes deflated by inflation (HICP). September2014 I 71
72 September2014 I 72
73 Annex 1: Real GDP growth, real GDHI growth and its main components for selected Member States Source: Eurostat, National Accounts. Data non-seasonally adjusted. Summary of Member States' recent developments: Continuous increase: DE since 2013Q2, SE continuous growth, UK since 2013Q4 Increase in 2014Q1: CZ after declines since mid-2011 Increase in 2013Q4: FR after stable previous quarters, NL after declines since mid-2011 Stable in 2014Q1: FI broadly stable since mid-2011 Stable in 2013Q4: IE declines from mid-2012 mid-2012 Decline in 2014Q1: IT after declines since 2008 despite improvement in 2013Q4, PL first strong decline since mid-2011, RO after stable previous quarters, SI after declines since 2008 despite improvement in 2013Q4 Continuous decline: CZ since mid-2011, EL since mid-2009, ES since the beginning of 2010 despite signs of stability in 2013Q4, PT since 2013Q2 September2014 I 73
74 September2014 I 74
75 September2014 I 75
76 September2014 I 76
77 September2014 I 77
78 September2014 I 78
79 September2014 I 79
 and number of employees. Right axis: unemployment rate. Source: Eurostat, Labour Force Survey and National Accounts. Data non-seasonally adjusted.")
80 Annex 2: Real GDP growth, employment growth and unemployment rates in the EU Member States Left axis: year-on-year percentage change of real GDP, GDHI (where available) and number of employees. Right axis: unemployment rate. Source: Eurostat, Labour Force Survey and National Accounts. Data non-seasonally adjusted. September 2014 I 80


81 September 2014 I 81


82 September2014 I 82
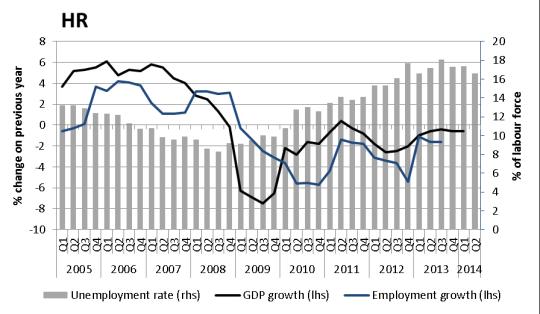
83 September2014 I 83
September With regularly updated data and charts downloadable here. Social Europe EU Employment and Social Situation I Quarterly Review
 September 2015 With regularly updated data and charts downloadable here September 2015 I 1 This Quarterly Review provides in-depth analysis of recent labour market and social developments. It is prepared
Employment and Social Developments in Europe
 Employment and Social Developments in Europe Quarterly Review February 2018 Social Europe February 2018 With regularly updated data and charts downloadable here February 2018 I 1 The Employment and Social
Employment and Social Developments in Europe
 Employment and Social Developments in Europe Quarterly Review December 218 Social Europe December 218 With regularly updated data and charts downloadable here December 218 I 1 The Employment and Social
Social Europe I Quarterly Review
 March 2014 With supplements on: - Labour market transitions before and during a severe economic downturn: some evidence from microeconomic data - Trends in poverty and social exclusion between 2008 and
October 2010 Euro area unemployment rate at 10.1% EU27 at 9.6%
 STAT//180 30 November 20 October 20 Euro area unemployment rate at.1% EU27 at 9.6% The euro area 1 (EA16) seasonally-adjusted 2 unemployment rate 3 was.1% in October 20, compared with.0% in September 4.
January 2010 Euro area unemployment rate at 9.9% EU27 at 9.5%
 STAT//29 1 March 20 January 20 Euro area unemployment rate at 9.9% EU27 at 9.5% The euro area 1 (EA16) seasonally-adjusted 2 unemployment rate 3 was 9.9% in January 20, the same as in December 2009 4.
Special Eurobarometer 418 SOCIAL CLIMATE REPORT
 Special Eurobarometer 418 SOCIAL CLIMATE REPORT Fieldwork: June 2014 Publication: November 2014 This survey has been requested by the European Commission, Directorate-General for Employment, Social Affairs
Themes Income and wages in Europe Wages, productivity and the wage share Working poverty and minimum wage The gender pay gap
 5. W A G E D E V E L O P M E N T S At the ETUC Congress in Seville in 27, wage developments in Europe were among the most debated issues. One of the key problems highlighted in this respect was the need
Taxation trends in the European Union EU27 tax ratio at 39.8% of GDP in 2007 Steady decline in top personal and corporate income tax rates since 2000
 DG TAXUD STAT/09/92 22 June 2009 Taxation trends in the European Union EU27 tax ratio at 39.8% of GDP in 2007 Steady decline in top personal and corporate income tax rates since 2000 The overall tax-to-gdp
Social Protection and Social Inclusion in Europe Key facts and figures
 MEMO/08/625 Brussels, 16 October 2008 Social Protection and Social Inclusion in Europe Key facts and figures What is the report and what are the main highlights? The European Commission today published
Supplement March Trends in poverty and social exclusion between 2012 and March 2014 I 1
 Supplement March 2014 Trends in poverty and social exclusion between 2012 and 2013 March 2014 I 1 This supplement to the Quarterly Review provides in-depth analysis of recent labour market and social developments.
COUNCIL OF THE EUROPEAN UNION. Brussels, 13 June /1/13 REV 1 SOC 409 ECOFIN 444 EDUC 190
 COUNCIL OF THE EUROPEAN UNION Brussels, 13 June 2013 10373/1/13 REV 1 SOC 409 ECOFIN 444 EDUC 190 COVER NOTE from: to: Subject: The Employment Committee Permanent Representatives Committee (Part I) / Council
January 2009 Euro area external trade deficit 10.5 bn euro 26.3 bn euro deficit for EU27
 STAT/09/40 23 March 2009 January 2009 Euro area external trade deficit 10.5 26.3 deficit for EU27 The first estimate for the euro area 1 (EA16) trade balance with the rest of the world in January 2009
August 2008 Euro area external trade deficit 9.3 bn euro 27.2 bn euro deficit for EU27
 STAT/08/143 17 October 2008 August 2008 Euro area external trade deficit 9.3 27.2 deficit for EU27 The first estimate for the euro area 1 (EA15) trade balance with the rest of the world in August 2008
Macroeconomic Policies in Europe: Quo Vadis A Comment
 Macroeconomic Policies in Europe: Quo Vadis A Comment February 12, 2016 Helene Schuberth Outline Staff Projection of the Euro Area Monetary Policy Investment Rebalancing in the euro area Fiscal Policy
Growth, competitiveness and jobs: priorities for the European Semester 2013 Presentation of J.M. Barroso,
 Growth, competitiveness and jobs: priorities for the European Semester 213 Presentation of J.M. Barroso, President of the European Commission, to the European Council of 14-1 March 213 Economic recovery
PROGRESS TOWARDS THE LISBON OBJECTIVES 2010 IN EDUCATION AND TRAINING
 PROGRESS TOWARDS THE LISBON OBJECTIVES IN EDUCATION AND TRAINING In 7, reaching the benchmarks for continues to pose a serious challenge for education and training systems in Europe, except for the goal
Securing sustainable and adequate social protection in the EU
 Securing sustainable and adequate social protection in the EU Session on Social Protection & Security IFA 12th Global Conference on Ageing 11 June 2014, HICC Hyderabad India Dr Lieve Fransen European Commission
Flash Eurobarometer 398 WORKING CONDITIONS REPORT
 Flash Eurobarometer WORKING CONDITIONS REPORT Fieldwork: April 2014 Publication: April 2014 This survey has been requested by the European Commission, Directorate-General for Employment, Social Affairs
in focus Statistics Contents Labour Mar k et Lat est Tr ends 1st quar t er 2006 dat a Em ploym ent r at e in t he EU: t r end st ill up
 Labour Mar k et Lat est Tr ends 1st quar t er 2006 dat a Em ploym ent r at e in t he EU: t r end st ill up Statistics in focus This publication belongs to a quarterly series presenting the European Union
PROGRESS TOWARDS THE LISBON OBJECTIVES 2010 IN EDUCATION AND TRAINING
 PROGRESS TOWARDS THE LISBON OBJECTIVES IN EDUCATION AND TRAINING In, reaching the benchmarks for continues to pose a serious challenge for education and training systems in Europe, except for the goal
European Commission. Statistical Annex of Alert Mechanism Report 2017
 European Commission Statistical Annex of Alert Mechanism Report 2017 COMMISSION STAFF WORKING DOCUMENT STATISTICAL ANNEX Accompanying the document REPORT FROM THE COMMISSION TO THE EUROPEAN PARLIAMENT,
DATA SET ON INVESTMENT FUNDS (IVF) Naming Conventions
 Naming Conventions") DIRECTORATE GENERAL STATISTICS LAST UPDATE: 10 APRIL 2013 DIVISION MONETARY & FINANCIAL STATISTICS ECB-UNRESTRICTED DATA SET ON INVESTMENT FUNDS (IVF) Naming Conventions The series keys related to Investment
DIRECTORATE GENERAL STATISTICS LAST UPDATE: 10 APRIL 2013 DIVISION MONETARY & FINANCIAL STATISTICS ECB-UNRESTRICTED DATA SET ON INVESTMENT FUNDS (IVF) Naming Conventions The series keys related to Investment
COVER NOTE The Employment Committee Permanent Representatives Committee (Part I) / Council EPSCO Employment Performance Monitor - Endorsement
 / Council EPSCO Employment Performance Monitor - Endorsement") COUNCIL OF THE EUROPEAN UNION Brussels, 15 June 2011 10666/1/11 REV 1 SOC 442 ECOFIN 288 EDUC 107 COVER NOTE from: to: Subject: The Employment Committee Permanent Representatives Committee (Part I) / Council
COUNCIL OF THE EUROPEAN UNION Brussels, 15 June 2011 10666/1/11 REV 1 SOC 442 ECOFIN 288 EDUC 107 COVER NOTE from: to: Subject: The Employment Committee Permanent Representatives Committee (Part I) / Council
The Trend Reversal of the Private Credit Market in the EU
 The Trend Reversal of the Private Credit Market in the EU Key Findings of the ECRI Statistical Package 2016 Roberto Musmeci*, September 2016 The ECRI Statistical Package 2016, Lending to Households and
Flash Eurobarometer 408 EUROPEAN YOUTH REPORT
 Flash Eurobarometer EUROPEAN YOUTH REPORT Fieldwork: December 2014 Publication: April 2015 This survey has been requested by the European Commission, Directorate-General for Education and Culture and co-ordinated
May 2009 Euro area external trade surplus 1.9 bn euro 6.8 bn euro deficit for EU27
 STAT/09/106 17 July 2009 May 2009 Euro area external trade surplus 1.9 6.8 deficit for EU27 The first estimate for the euro area 1 (EA16) trade balance with the rest of the world in May 2009 gave a 1.9
Aggregation of periods for unemployment benefits. Report on U1 Portable Documents for mobile workers Reference year 2016
 Aggregation of periods for unemployment benefits Report on U1 Portable Documents for mobile workers Reference year 2016 Frederic De Wispelaere & Jozef Pacolet - HIVA KU Leuven June 2017 EUROPEAN COMMISSION
In 2009 a 6.5 % rise in per capita social protection expenditure matched a 6.1 % drop in EU-27 GDP
 Population and social conditions Authors: Giuseppe MOSSUTI, Gemma ASERO Statistics in focus 14/2012 In 2009 a 6.5 % rise in per capita social protection expenditure matched a 6.1 % drop in EU-27 GDP Expenditure
Supplement September Towards a better measurement of welfare and inequalities. September 2014 I 1
 Supplement September 214 Towards a better measurement of welfare and inequalities September 214 I 1 Social Europe This supplement to the Quarterly Review provides in-depth analysis of recent labour market
Eurofound in-house paper: Part-time work in Europe Companies and workers perspective
 Eurofound in-house paper: Part-time work in Europe Companies and workers perspective Presented by: Eszter Sandor Research Officer, Surveys and Trends 26/03/2010 1 Objectives Examine the patterns of part-time
The EFTA Statistical Office: EEA - the figures and their use
 The EFTA Statistical Office: EEA - the figures and their use EEA Seminar Brussels, 13 September 2012 1 Statistics Comparable, impartial and reliable statistical data are a prerequisite for a democratic
Employment of older workers Research Note no. 5/2015
 Research Note no. 5/2015 E. Őzdemir, T. Ward M. Fuchs, S. Ilinca, O. Lelkes, R. Rodrigues, E. Zolyomi February - 2016 EUROPEAN COMMISSION Directorate-General for Employment, Social Affairs and Inclusion
Issues Paper. 29 February 2012
 29 February 212 Issues Paper In the context of the European semester, the March European Council gives, on the basis of the Commission's Annual Growth Survey, guidance to Member States for the Stability
Flash Eurobarometer 470. Report. Work-life balance
 Work-life balance Survey requested by the European Commission, Directorate-General for Justice and Consumers and co-ordinated by the Directorate-General for Communication This document does not represent
Library statistical spotlight
 /9/2 Library of the European Parliament 6 4 2 This document aims to provide a picture of the, in particular by looking at car production trends since 2, at the number of enterprises and the turnover they
Fiscal sustainability challenges in Romania
 Preliminary Draft For discussion only Fiscal sustainability challenges in Romania Bucharest, May 10, 2011 Ionut Dumitru Anca Paliu Agenda 1. Main fiscal sustainability challenges 2. Tax collection issues
Flash Eurobarometer 441. Report. European SMEs and the Circular Economy
 European SMEs and the Circular Economy Survey requested by the European Commission, Directorate-General Environment and co-ordinated by the Directorate-General for Communication This document does not
Investment in France and the EU
 Investment in and the EU Natacha Valla March 2017 22/02/2017 1 Change relative to 2008Q1 % of GDP Slow recovery of investment, and with strong heterogeneity Overall Europe s recovery in investment is slow,
SOCIAL PROTECTION COMMITTEE ANNUAL REPORT 2016 REVIEW OF THE SOCIAL PROTECTION PERFORMANCE MONITOR AND DEVELOPMENTS IN SOCIAL PROTECTION POLICIES
 SOCIAL PROTECTION COMMITTEE ANNUAL REPORT 2016 REVIEW OF THE SOCIAL PROTECTION PERFORMANCE MONITOR AND DEVELOPMENTS IN SOCIAL PROTECTION POLICIES SOCIAL PROTECTION COMMITTEE ANNUAL REPORT 2016 REVIEW OF
Transition from Work to Retirement in EU25
 EUROPEAN CENTRE EUROPÄISCHES ZENTRUM CENTRE EUROPÉEN 1 Asghar Zaidi is Director Research at the European Centre for Social Welfare Policy and Research, Vienna; Michael Fuchs is Researcher at the European
THE EU S ECONOMIC RECOVERY PICKS UP MOMENTUM
 THE EU S ECONOMIC RECOVERY PICKS UP MOMENTUM ECONOMIC SITUATION The EU economy saw a pick-up in growth momentum at the beginning of this year, boosted by strong business and consumer confidence. Output
PUBLIC PERCEPTIONS OF VAT
 Special Eurobarometer 424 PUBLIC PERCEPTIONS OF VAT REPORT Fieldwork: October 2014 Publication: March 2015 This survey has been requested by the European Commission, Directorate-General for Taxations and
FIRST REPORT COSTS AND PAST PERFORMANCE
 FIRST REPORT COSTS AND PAST PERFORMANCE DECEMBER 2018 https://eiopa.europa.eu/ PDF ISBN 978-92-9473-131-9 ISSN 2599-8862 doi: 10.2854/480813 EI-AM-18-001-EN-N EIOPA, 2018 Reproduction is authorised provided
NOTE ON EU27 CHILD POVERTY RATES
 NOTE ON EU7 CHILD POVERTY RATES Research note prepared for Child Poverty Action Group Authors: H. Xavier Jara and Chrysa Leventi Institute for Social and Economic Research (ISER) University of Essex The
Investment in Germany and the EU
 Investment in Germany and the EU Pedro de Lima Head of the Economics Studies Division Economics Department Berlin 19/12/2016 11/01/2017 1 Slow recovery of investment, with strong heterogeneity Overall
Flash Eurobarometer N o 189a EU communication and the citizens. Analytical Report. Fieldwork: April 2008 Report: May 2008
 Gallup Flash Eurobarometer N o 189a EU communication and the citizens Flash Eurobarometer European Commission Expectations of European citizens regarding the social reality in 20 years time Analytical
Overview of EU public finances
 6 volume 17, 12/29B I Overview of EU public finances PRE-CRISIS DEVELOPMENTS Public finance developments in the EU up to 28 can be divided into three stages: In 1997, the Stability and Growth Pact entered
Traffic Safety Basic Facts Main Figures. Traffic Safety Basic Facts Traffic Safety. Motorways Basic Facts 2015.
 Traffic Safety Basic Facts 2013 - Main Figures Traffic Safety Basic Facts 2015 Traffic Safety Motorways Basic Facts 2015 Motorways General Almost 30.000 people were killed in road accidents on motorways
Working Poor in Europe
 Working Poor in Europe Georg Fischer Director for Analysis, Evaluation, External Relations DG Employment, social affairs and inclusion 29.7.2013 Clarification of definitions and terms Overall social trends
Flash Eurobarometer 458. Report. The euro area
 The euro area Survey requested by the European Commission, Directorate-General for Economic and Financial Affairs and co-ordinated by the Directorate-General for Communication This document does not represent
Country Health Profiles
 State of Health in the EU Country Health Profiles Brussels, November 2017 1 The Country Health Profiles 1. Highlights 2. Health status 3. Risk Factors 4. Health System (description) 5. Performance of Health
The Skillsnet project on Medium-term forecasts of occupational skill needs in Europe: Replacement demand and cohort change analysis
 The Skillsnet project on Medium-term forecasts of occupational skill needs in Europe: Replacement demand and cohort change analysis Paper presented at the Workshop on Medium-term forecast of occupational
Gender pension gap economic perspective
 Gender pension gap economic perspective Agnieszka Chłoń-Domińczak Institute of Statistics and Demography SGH Part of this research was supported by European Commission 7th Framework Programme project "Employment
Traffic Safety Basic Facts Main Figures. Traffic Safety Basic Facts Traffic Safety. Motorways Basic Facts 2017.
 Traffic Safety Basic Facts 2013 - Main Figures Traffic Safety Basic Facts 2015 Traffic Safety Motorways Basic Facts 2017 Motorways General More than 24.000 people were killed in road accidents on motorways
December 2010 Euro area annual inflation up to 2.2% EU up to 2.6%
 STAT/11/9 14 January 2011 December 2010 Euro area annual inflation up to 2.2% EU up to 2.6% Euro area 1 annual inflation was 2.2% in December 2010 2, up from 1.9% in November. A year earlier the rate was
ILO World of Work Report 2013: EU Snapshot
 Greece Spain Ireland Poland Belgium Portugal Eurozone France Slovenia EU-27 Cyprus Denmark Netherlands Italy Bulgaria Slovakia Romania Lithuania Latvia Czech Republic Estonia Finland United Kingdom Sweden
Council of the European Union Brussels, 25 July 2017 (OR. en)
") Council of the European Union Brussels, 25 July 217 (OR. en) 1151/17 ADD 1 COVER NOTE From: date of receipt: 17 July 217 To: SOC 543 EMPL 414 ECOFIN 667 EDUC 318 JEUN 95 FISC 17 Secretary-General of the
Council of the European Union Brussels, 25 July 217 (OR. en) 1151/17 ADD 1 COVER NOTE From: date of receipt: 17 July 217 To: SOC 543 EMPL 414 ECOFIN 667 EDUC 318 JEUN 95 FISC 17 Secretary-General of the
Taylor & Francis Open Access Survey Open Access Mandates
 Taylor & Francis Open Access Survey Open Access Mandates Annex C European Union November 2014 November 2014 0 The results presented in this report are based on research carried out on behalf of Taylor
State of play of CAP measure Setting up of Young Farmers in the European Union
 State of play of CAP measure Setting up of Young Farmers in the European Union Michael Gregory EN RD Contact Point Seminar CEJA 20 th September 2010 Measure 112 rationale: Measure 112 - Setting up of young
The economic and budgetary consequences of ageing populations
 The economic and budgetary consequences of ageing populations Henri Bogaert Bureau du Plan and Chairman of the Ageing Working Group Giuseppe Carone European Commission DG ECFIN Rome, 23 February 2007 Outline
DRAFT JOINT EMPLOYMENT REPORT FROM THE COMMISSION AND THE COUNCIL. accompanying the Communication from the Commission on the Annual Growth Survey 2018
 EUROPEAN COMMISSION Brussels, 22.11.2017 COM(2017) 674 final DRAFT JOINT EMPLOYMENT REPORT FROM THE COMMISSION AND THE COUNCIL accompanying the Communication from the Commission on the Annual Growth Survey
in focus Statistics T he em ploym ent of senior s in t he Eur opean Union Contents POPULATION AND SOCIAL CONDITIONS 15/2006 Labour market
 T he em ploym ent of senior s in t he Eur opean Union Statistics in focus OULATION AND SOCIAL CONDITIONS 15/2006 Labour market Authors Christel ALIAGA Fabrice ROMANS Contents In 2005, in the EU-25, 22.2
STAT/14/ October 2014
 STAT/14/158-21 October 2014 Provision of deficit and debt data for 2013 - second notification Euro area and EU28 government deficit at 2.9% and 3.2% of GDP respectively Government debt at 90.9% and 85.4%
In 2008 gross expenditure on social protection in EU-27 accounted for 26.4 % of GDP
 Population and social conditions Author: Antonella PUGLIA Statistics in focus 17/2011 In 2008 gross expenditure on social protection in EU-27 accounted for 26.4 % of GDP Social protection benefits are
Traffic Safety Basic Facts Main Figures. Traffic Safety Basic Facts Traffic Safety. Motorways Basic Facts 2016.
 Traffic Safety Basic Facts 2013 - Main Figures Traffic Safety Basic Facts 2015 Traffic Safety Motorways Basic Facts 2016 Motorways General Almost 26.000 people were killed in road accidents on motorways
Aleksandra Dyba University of Economics in Krakow
 61 Aleksandra Dyba University of Economics in Krakow dyba@uek.krakow.pl Abstract Purpose development is nowadays a crucial global challenge. The European aims at building a competitive economy, however,
52 ECB. The 2015 Ageing Report: how costly will ageing in Europe be?
 Box 7 The 5 Ageing Report: how costly will ageing in Europe be? Europe is facing a demographic challenge. The old age dependency ratio, i.e. the share of people aged 65 or over relative to the working
Report on the distribution of direct payments to agricultural producers (financial year 2016)
") Report on the distribution of direct payments to agricultural producers (financial year 2016) Every year, the Commission publishes the distribution of direct payments to farmers by Member State. Figures
Report on the distribution of direct payments to agricultural producers (financial year 2016) Every year, the Commission publishes the distribution of direct payments to farmers by Member State. Figures
HOW RECESSION REFLECTS IN THE LABOUR MARKET INDICATORS
 REPUBLIC OF SLOVENIA HOW RECESSION REFLECTS IN THE LABOUR MARKET INDICATORS Matej Divjak, Irena Svetin, Darjan Petek, Miran Žavbi, Nuška Brnot ??? What is recession?? Why in Europe???? Why in Slovenia?
Investment and Investment Finance. the EU and the Polish story. Debora Revoltella
 Investment and Investment Finance the EU and the Polish story Debora Revoltella Director - Economics Department EIB Warsaw 27 February 2017 Narodowy Bank Polski European Investment Bank Contents We look
May 2009 Euro area annual inflation down to 0.0% EU down to 0.7%
 STAT/09/88 16 June 2009 May 2009 Euro area annual inflation down to 0.0% EU down to 0.7% Euro area 1 annual inflation was 0.0% in May 2009 2, down from 0.6% in April. A year earlier the rate was 3.7%.
Short Analytical Web Note 2/2016
 Short Analytical Web Note 2/2016 Analysis of the Youth Guarantee in EU Member States This note provides an analytical overview of the labour market outcomes of young people in the EU Member States following
Macroeconomic overview SEE and Macedonia
 Macroeconomic overview SEE and Macedonia Zoltan Arokszallasi Chief Analyst, Macro & FX/FI Research Erste Group Bank Erste Investors Breakfast, 29 September, Skopje 02. Oktober SEE shows mixed performance
EUROSTAT SUPPLEMENTARY TABLE FOR REPORTING GOVERNMENT INTERVENTIONS TO SUPPORT FINANCIAL INSTITUTIONS
 EUROPEAN COMMISSION EUROSTAT Directorate D: Government Finance Statistics (GFS) and Quality Unit D1: Excessive deficit procedure and methodology Unit D2: Excessive deficit procedure (EDP) 1 Unit D3: Excessive
The European economy since the start of the millennium
 The European economy since the start of the millennium A STATISTICAL PORTRAIT 2018 edition 1 Since the start of the millennium, the European economy has evolved and statistics can help to better perceive
Consumer Credit. Introduction. June, the 6th (2013)
") Consumer Credit in Europe at end-2012 Introduction Crédit Agricole Consumer Finance has published its annual survey of the consumer credit market in 27 European Union countries (EU-27) for the sixth year
Consumer Credit in Europe at end-2012 Introduction Crédit Agricole Consumer Finance has published its annual survey of the consumer credit market in 27 European Union countries (EU-27) for the sixth year
COMMISSION STAFF WORKING DOCUMENT Accompanying the document
 EUROPEAN COMMISSION Brussels, 9.10.2017 SWD(2017) 330 final PART 13/13 COMMISSION STAFF WORKING DOCUMENT Accompanying the document REPORT FROM THE COMMISSION TO THE EUROPEAN PARLIAMENT, THE COUNCIL, THE
DG TAXUD. STAT/11/100 1 July 2011
 DG TAXUD STAT/11/100 1 July 2011 Taxation trends in the European Union Recession drove EU27 overall tax revenue down to 38.4% of GDP in 2009 Half of the Member States hiked the standard rate of VAT since
H Marie Skłodowska-Curie Actions (MSCA)
") H2020 Key facts and figures (2014-2020) Number of BE researchers funded by MSCA: EU budget awarded to BE organisations (EUR million): Number of BE organisations in MSCA: 274 161,04 227 In detail, the number
H2020 Key facts and figures (2014-2020) Number of BE researchers funded by MSCA: EU budget awarded to BE organisations (EUR million): Number of BE organisations in MSCA: 274 161,04 227 In detail, the number
EUROPA - Press Releases - Taxation trends in the European Union EU27 tax...of GDP in 2008 Steady decline in top corporate income tax rate since 2000
 DG TAXUD STAT/10/95 28 June 2010 Taxation trends in the European Union EU27 tax ratio fell to 39.3% of GDP in 2008 Steady decline in top corporate income tax rate since 2000 The overall tax-to-gdp ratio1
EUROPEAN COMMISSION EUROSTAT
 EUROPEAN COMMISSION EUROSTAT Directorate F: Social statistics Unit F-3: Labour market Doc.: Eurostat/F3/LAMAS/29/14 WORKING GROUP LABOUR MARKET STATISTICS Document for item 3.2.1 of the agenda LCS 2012
Recent trends and reforms in unemployment benefit coverage in the EU
 Recent trends and reforms in unemployment benefit coverage in the EU European Commission Social Situation Monitor: Seminar on coverage of unemployment benefits Janine Leschke, Department of Business and
Scenario for the European Insurance and Occupational Pensions Authority s EU-wide insurance stress test in 2016
 17 March 2016 ECB-PUBLIC Scenario for the European Insurance and Occupational Pensions Authority s EU-wide insurance stress test in 2016 Introduction In accordance with its mandate, the European Insurance
LEADER implementation update Leader/CLLD subgroup meeting Brussels, 21 April 2015
 LEADER 2007-2013 implementation update Leader/CLLD subgroup meeting Brussels, 21 April 2015 #LeaderCLLD 2,416 2,416 8.9 Progress on LAG selection in the EU (2007-2013) 3 000 2 500 2 000 2 182 2 239 2 287
Taxation trends in the European Union Further increase in VAT rates in 2012 Corporate and top personal income tax rates inch up after long decline
 STAT/12/77 21 May 2012 Taxation trends in the European Union Further increase in VAT rates in 2012 Corporate and top personal income tax rates inch up after long decline The average standard VAT rate 1
Background on the Euro Plus Pact. Information prepared for the European Council, 9 December 2011
 Background on the Euro Plus Pact Information prepared for the European Council, 9 December 2011 Contents 1 1. Our commitments 2. Competitiveness 3. Employment 4. Sustainability of public finances 5. Financial
H Marie Skłodowska-Curie Actions (MSCA)
") H2020 Key facts and figures (2014-2020) Number of FR researchers funded by MSCA: EU budget awarded to FR organisations (EUR million): Number of FR organisations in MSCA: 1 072 311.72 479 In detail, the
H2020 Key facts and figures (2014-2020) Number of FR researchers funded by MSCA: EU budget awarded to FR organisations (EUR million): Number of FR organisations in MSCA: 1 072 311.72 479 In detail, the
Weighting issues in EU-LFS
 Weighting issues in EU-LFS Carlo Lucarelli, Frank Espelage, Eurostat LFS Workshop May 2018, Reykjavik carlo.lucarelli@ec.europa.eu, frank.espelage@ec.europa.eu 1 1. Introduction The current legislation
EUROSTAT SUPPLEMENTARY TABLE FOR REPORTING GOVERNMENT INTERVENTIONS TO SUPPORT FINANCIAL INSTITUTIONS
 EUROPEAN COMMISSION EUROSTAT Directorate D: Government Finance Statistics (GFS) and Quality Unit D1: Excessive deficit procedure and methodology Unit D2: Excessive deficit procedure (EDP) 1 Unit D3: Excessive
H Marie Skłodowska-Curie Actions (MSCA)
") H2020 Key facts and figures (2014-2020) Number of PT researchers funded by MSCA: EU budget awarded to PT organisations (EUR million): Number of PT organisations in MSCA: 716 66,67 165 In detail, the number
H2020 Key facts and figures (2014-2020) Number of PT researchers funded by MSCA: EU budget awarded to PT organisations (EUR million): Number of PT organisations in MSCA: 716 66,67 165 In detail, the number
H Marie Skłodowska-Curie Actions (MSCA)
") H2020 Key facts and figures (2014-2020) Number of IE researchers funded by MSCA: EU budget awarded to IE organisations (EUR million): Number of IE organisations in MSCA: 253 116,04 116 In detail, the number
H2020 Key facts and figures (2014-2020) Number of IE researchers funded by MSCA: EU budget awarded to IE organisations (EUR million): Number of IE organisations in MSCA: 253 116,04 116 In detail, the number
COMMISSION STAFF WORKING DOCUMENT STATISTICAL ANNEX. Accompanying the document
 EUROPEAN COMMISSION Brussels, 22.11.2017 SWD(2017) 661 final COMMISSION STAFF WORKING DOCUMENT STATISTICAL ANNEX Accompanying the document REPORT FROM THE COMMISSION TO THE EUROPEAN PARLIAMENT, THE COUNCIL,
The Gender Employment Gap: Challenges and Solutions
 Cornell University ILR School DigitalCommons@ILR International Publications Key Workplace Documents 2016 The Gender Employment Gap: Challenges and Solutions Eurofound Follow this and additional works at:
H Marie Skłodowska-Curie Actions (MSCA)
") H2020 Key facts and figures (2014-2020) Number of SE researchers funded by MSCA: EU budget awarded to SE organisations (EUR million): Number of SE organisations in MSCA: 138 114.71 150 In detail, the number
H2020 Key facts and figures (2014-2020) Number of SE researchers funded by MSCA: EU budget awarded to SE organisations (EUR million): Number of SE organisations in MSCA: 138 114.71 150 In detail, the number
Standard Eurobarometer 83 Spring 2015 THE EU BUDGET REPORT
 Standard Eurobarometer 83 Spring 2015 THE EU BUDGET REPORT Fieldwork: May 2015 This survey has been requested and co-ordinated by the European Commission, Directorate-General for Communication. http://ec.europa.eu/public_opinion/index_en.htm
Harmonised Index of Consumer Prices (HICP) August 2015
 August 2015") Aug-14 Sep-14 Oct-14 Nov-14 Dec-14 Jan-15 Feb-15 Mar-15 Apr-15 May-15 Jun-15 MONTENEGRO STATISTICAL OFFICE R E L E A S E Broj: 201 Podgorica, 18 September 2015 When using the data please name the source
Aug-14 Sep-14 Oct-14 Nov-14 Dec-14 Jan-15 Feb-15 Mar-15 Apr-15 May-15 Jun-15 MONTENEGRO STATISTICAL OFFICE R E L E A S E Broj: 201 Podgorica, 18 September 2015 When using the data please name the source
Social protection in the European Union
 Population and social conditions Author: Alexandra PETRÁŠOVÁ Statistics in focus 46/2008 Social protection in the European Union In 2005, expenditure on social protection accounted for 27.2% of GDP in
STAT/14/64 23 April 2014
 STAT/14/64 23 April 2014 Provision of deficit and debt data for 2013 - first notification Euro area and EU28 government deficit at 3.0% and 3.3% of GDP respectively Government debt at 92.6% and 87.1% In
STAT/12/ October Household saving rate fell in the euro area and remained stable in the EU27. Household saving rate (seasonally adjusted)
") STAT/12/152 30 October 2012 Quarterly Sector Accounts: second quarter of 2012 Household saving rate down to 12.9% in the euro area and stable at 11. in the EU27 Household real income per capita fell by
STAT/12/152 30 October 2012 Quarterly Sector Accounts: second quarter of 2012 Household saving rate down to 12.9% in the euro area and stable at 11. in the EU27 Household real income per capita fell by