Social Europe I Quarterly Review
|
|
|
- Madeleine Bates
- 5 years ago
- Views:
Transcription


1 March 2014 With supplements on: - Labour market transitions before and during a severe economic downturn: some evidence from microeconomic data - Trends in poverty and social exclusion between 2008 and Trends in social expenditure and distributional impact of policy changes until 2013 March 2014 I 1
2 This Quarterly Review provides in-depth analysis of recent labour market developments. It is prepared by the Employment Analysis and Social Analysis Units in DG EMPL. A wide combination of information sources have been used to produce this report, including Eurostat statistics (see [codes] mentioned under the charts, to be used with the Eurostat data search engine: reports and survey data from the Commission s Directorate-General for Economic and Financial Affairs, national and sectoral statistics and articles from respected press sources. Employment and social analysis portal: Contact: empl-analysis@ec.europa.eu Neither the European Commission nor any person acting on behalf of the Commission may be held responsible for the use that may be made of the information contained in this publication. Europe Direct is a service to help you find answers to your questions about the European Union Freephone number (*): (*) Certain mobile telephone operators do not allow access to numbers or these calls may be billed. More information on the European Union is available on the Internet ( Cataloguing data as well as an abstract can be found at the end of this publication. Luxembourg: Publications Office of the European Union, 2014 ISBN ISSN doi: /91804 European Union, 2014 Reproduction is authorised provided the source is acknowledged. March 2014 I 2
3 Table of Contents Macroeconomic and employment developments and outlook... 7 Employment in the EU and its Member States Unemployment Long-term unemployment, additional potential labour force and underemployment Households' income and financial situation Productivity, wages and hours worked Labour demand: vacancies, labour shortages and hiring activity Labour market and social situation for selected groups Youth...24 Migrants...26 Supplements to the EU Employment and Social Situation Quarterly Review. 29 S1. Labour market transitions before and during a severe economic downturn: some evidence from micro-economic data...30 S2. Trends in poverty and social exclusion between 2011 and S3. Trends in social expenditure and the distributional impact of policy changes until Annex 1: Real GDP growth, real GDHI growth and its main components for selected Member States Annex 2: Selected research March 2014 I 3
4 Executive summary The EU economy is maintaining the growth first seen in the second quarter of 2013 (+0.4% in Q4), with estimated gross domestic product (GDP) figures from across the EU indicating that a recovery has started, albeit at a relatively slow pace. At this early stage, it is difficult to assess whether and when this fragile economic recovery will bring new jobs and to what extent society as a whole will benefit. Improvements in the labour markets in Europe are still at best weak. Employment in the EU showed the first signs of stabilising during 2013, with a mild increase in the number of persons employed in the third and fourth quarters (+0.1% in both). This reflects a slow-down of the number of employed losing their jobs, though the job finding rate continues to deteriorate. It also corresponds to a slowdown in the decrease of employment in the construction and industry sectors, while the number of employed continued to grow in the service sectors. In February 2014, managers in the EU expected moderate employment growth in industry, while employment expectations in the services sector were still below their long-term average. In 2013, the gross disposable income of households continued to decline in the Euro area 1 in real terms, but at a slower pace and nearly stabilised in the third quarter, reflecting the evolution of labour market incomes and a weakening of the stabilisation impact of welfare spending. Growth in households disposable income is lagging behind GDP growth. There is a danger that the recovery will not benefit all parts of the economy equally, with a large part of households and individuals potentially benefiting only marginally, if at all, from the slightly improved economic situation. In the third quarter of 2013, real gross disposable household income remained stable overall in the Euro area compared to the same quarter in Poverty and social exclusion in the EU has deteriorated during the crisis and show little signs of improvement so far, especially in the Member States where economic conditions continued to worsen. According to Eurostat data, poverty and social exclusion continued to increase in 2011 and 2012, reflecting the deterioration of labour market conditions, as long-term unemployment increased and an increasing share of jobs do not ensure a living wage (e.g. involuntary part-time). Poverty and social exclusion are estimated to have increased further in a few countries in 2013 (according to Euromod estimates available for 10 countries), especially in countries where it was already high. Also, a recent Euromod study shows that reforms of the tax and benefit systems introduced in were progressive or neutral in 7 out of 9 countries reviewed. The prolonged economic downturn has seen households financial distress intensify in recent months, due to the need to draw on savings or borrow in order to maintain current standards of living. Households in the lowest income quartile experienced the greatest difficulty in covering their current expenditure. The market for permanent and full-time jobs has seen only slight improvement, and it is the increasing use of temporary and part-time work which has driven the rising overall employment figures. The number of part-time jobs has risen during the crisis, mostly because the job cuts which have taken place in predominantly male-oriented sectors have been followed by an increase in the proportion of the male labour force working part-time and a higher rate of transition of workers from full-time to part-time jobs. Unemployment has stabilised since mid-2013, but figures for January 2014 show that it is still at record high levels, with around 26 million people (10.8 % of the economically active population) in the EU looking for work. In several Member States, unemployment remains close to the historically-high levels first seen in the current crisis. The unemployment rate among young people fell by 0.3 % over the year to January 2014 in the EU and by 0.1% in the Euro area. Unemployment in the same period has fallen more among men than among women. Both involuntary part-time workers and the potential additional workforce (i.e. discouraged workers who are no longer actively looking for jobs but who could form part of the workforce) grew in the EU, and differences between Member States became more pronounced. Despite this 1 No GDHI in real terms available for EU28. March 2014 I 4
5 somewhat mixed picture, the outlook for unemployment is showing the first signs of improvement, with European consumers expecting unemployment to fall in the coming months. Young people continue to be the hardest hit by the job crisis, with the unemployment rate amongst this age group standing at 23.4 % in January 2014 for the EU as a whole. A total of 2.5 million young women and 3.1 million young men aged are currently unable to find work. In 2013, only a third of young people in the EU had a job, and many of these were on a temporary or part-time basis. Half of Member States saw an overall improvement in unemployment figures for young people, but considerable disparities continue to exist across the EU. Overall, close to 60 % of young people in the EU were not in employment in 2013, although in 9 out of 10 cases this was due to enrolment in education. The rate of growth of nominal unit labour costs continued to slow in the Euro area, increasing the risk of cost-push deflationary pressures that could damage prospects of a sustained recovery and the accompanying creation of jobs. In Spain, on the other hand, the real unit labour cost increased for the first time since the fourth quarter of Three supplements accompany this Quarterly review. The first supplement compares labour market transitions in the EU as a whole in 2010 and The analysis shows that employment stability for individual workers declined significantly by 2010 whereby a transition to unemployment was the most important destination on leaving employment. Moreover, the stepping-stone function of temporary employment (whereby workers on temporary contracts move up to a permanent contract) has diminished notably. The second supplement analyses recent trends in poverty and social exclusion. According to latest survey data, poverty continued to increase in 2012 and is estimated to have increased further since then in those countries where economic and labour market conditions have continued to deteriorate. Between 2011 and 2012, the population at risk of poverty or social exclusion increased in one third of EU-Member States, amongst them in countries with low levels of poverty and social exclusion such as the United Kingdom, Luxembourg and Austria. The at-risk-of-poverty rate remained stable on average at EU level between 2011 and 2012, hiding diverging national developments at national level. It increased especially noticeably in Greece and is estimated to increase further between 2011 and 2013 in this country and a few others. 2 The third supplement presents recent developments in social expenditure and estimates of the distributional impact of policy changes until The latest available data show that the stabilising impact of social protection expenditure remained very weak in 2013, despite a slight improvement compared to In 2013 social protection expenditure grew much less than expected, and remained below its trend, despite the further deterioration of the output gap (around -3 %). In two countries, changes to the tax and benefit system in lead to a reduction of incomes across all or most of the income distribution. In four others the overall impact on household incomes was positive, with those at the bottom of the distribution benefiting most in proportional terms. 2 Eurostat statistics on poverty and social exclusion are currently available until 2012, providing information about the 2011 income distribution. March 2014 I 5
6 Latest labour markets trends in the EU Q Q Q Q Q4 Real GDP (% change on previous quarter, SAWA) (% change on previous year, SAWA) Employment growth (% change on previous quarter, SAWA) ,1 (% change on previous year, SAWA) Employment rate (15-64) (% of working-age population, NSA) NA Employment rate (20-64) (% of working-age population, NSA) NA Job vacancy rate (EU27) (% of vacant and occupied posts, NSA) Labour productivity (% change on previous year, SAWA) Nominal unit labour cost (% change on previous year, SAWA) Long-term unemployment rate (% labour force, NSA) NA 2013 Jan 2013 Oct 2013 Nov 2013 Dec Jan 2014 Unemployment rate (SA) Total (% labour force) Men Women Youth (% labour force aged 15-24) Source: Eurostat, DG EMPL own calculations. Note: SA = seasonally adjusted; SAWA = seasonally adjusted and adjusted by working days; NSA = non-seasonally adjusted; NA: not available. March 2014 I 6
7 Macroeconomic and employment developments and outlook The first signs of an economic recovery emerged in 2013, following the prolonged economic and social crisis. The EU economy picked up in the second quarter, with GDP growing at an average of 0.3% per quarter since then (with +0.4% in Q4). Growth has been weaker in the Euro area (EA), with an increase of 0.3% in the fourth quarter of GDP fell by 0.5% over the course of 2013 in the Euro area and rose by 0.1% in the EU. The GDP gap between the EU/EA and the US economy whose GDP rose by 0.8% in the last quarter of 2013 was the widest since 2009 (see Chart 1). GDP growth in the EU is becoming less dependent on external demand and more driven by internal demand, with private consumption contributing positively to GDP growth in all four quarters of Chart 1: Real GDP in the EU/EA and US (lhs), and % changes over the previous quarter (rhs) income (GDHI), with a direct negative impact on aggregate demand and the general living standard of the populations. In 2013, the gross disposable income of households continued to decline in the Euro Area 4 in real terms, but at a slower pace and nearly stabilised in the third quarter, reflecting the evolution of labour market incomes. However, the growth in disposable household income in Europe, adjusted for inflation, still lags behind GDP growth, and has done so since the beginning of There is a concern that the recovery is not benefitting all parts of the economy equally, with households and individuals not benefiting much from improvements in the economy. Chart 2: Disposable Household income lags behind GDP Source: Eurostat, National Accounts, data nonseasonally adjusted [namq_gdp_k] In the fourth quarter of 2013, GDP growth became positive in the majority of EU Member States, albeit that there were large differences, with negative quarter-onquarter changes registered in Cyprus, Denmark, Croatia and Finland (see Chart 3). Source: Eurostat, National Accounts, data seasonally adjusted and adjusted by working days [namq_gdp_k] Since the onset of the crisis, Europe experienced a persistent year-on-year decline in real gross disposable households 3 Eurostat news release of National Accounts data for 2013Q4 available at: 4 No GDHI in real terms available for EU28. March 2014 I 7
8 Chart 3: Real GDP growth in the fourth quarter of 2013, by Member States Chart 4: Real GDP change (y-o-y) vs. total employment change (y-o-y), by Member State: third quarter 2013 (top panel) and fourth quarter 2013 (bottom panel). Source: Eurostat, National Accounts, data seasonally adjusted and adjusted by working days (q-o-q) and non-seasonally adjusted (y-o-y) [namq_gdp_k]; figures for IE, LU, PT, and RO: 2013Q3 It is still too early to assess whether the recent phase of economic recovery will bring with it a significant increase in new jobs, and what type of jobs they will be. Figures from the third and the fourth quarters of 2013 show that in an increasing number of EU Member States an improving economy has not been accompanied by the creation of new jobs, as represented by the countries positioned in the north-west quadrants of Chart 4. Source: Eurostat, National Accounts, data nonseasonally adjusted [namq_gdp_k and namq_aux_pem] Note: data not available for HR in Q3 and for IE, LU, PT, and UK in Q4. Unemployment in Europe remained at a record high in January, with about 26 million people, or 10.8% (12% in the EA) of the economically active population, looking for work. Major disparities in unemployment rates (UR) between Member States exist and have been increasing since the end of 2008 (see Chart 5). The unemployment rates in the US have been falling since The divergent trends in the EU/EA and US unemployment rates are the result of both growth differentials between these two regions and a declining active labour force in the US (the total activity rate in the US declined 2.49 percentage points (pps) since 2008Q3, while increased 1.1 pps in the EU in the same period). March 2014 I 8

9 Euro area EU-27 EU Employment and Social Situation Chart 5: Unemployment rates in Europe (EU/EA) and US and unemployment disparities in Europe Table 1: Recent forecasts for growth and unemployment Institute date gr.'14 gr. '15 UR '14 UR '15 IMF 21-Jan NA NA NA NA Commission 25-Feb ECB 06-Mar NA NA NA NA IMF 21-Jan NA NA Commission 25-Feb ECB 06-Mar Source: Diverse forecast documents; "gr." is real GDP growth in %; "UR" is the unemployment rate, in % of the active population. Source: Eurostat, LFS, data seasonally adjusted [une_rt_m] Note: Disparity is measured by the degree of dispersion of EU28 unemployment rates. Dispersion is the coefficient of variation calculated over the EU-28 Member States' unemployment rates. If all unemployment rates of EU MS are equal, the coefficient of variation is zero. Significant differences between unemployment rates imply a fairly wide dispersion. Outlook Steady recovery in economic sentiment The Commission's economic sentiment indicator has recovered steadily, but from a very low level, since April Confidence indicators stand now well above their longterm average, except in the service and construction sectors. Similarly, the Euro-area Purchasing Managers Index (PMI) composite output index reached its highest level in three years in February 2014, and remained above the 50-level (which separates growth from contraction) for eight consecutive months now. Forecasted growth is however not yet strong enough to make a significant dent in unemployment. Table 1 shows the recent forecasts for the EU-27 and the Euro area by the European Commission and two international institutions. Commission winter forecasts for real GDP growth remained close to the autumn forecasts with growth projections of 1.5% in the EU and 1.2% in the Euro area in 2014, and 2.0% and 1.8% respectively in The winter forecast projected a modest rise in employment (from 2014 on) and a decline in the unemployment rate to 10.4% in the EU and 11.7% in the Euro area by 2015, with cross-country differences remaining very large. The ECB unemployment forecast is similar, but less optimistic about growth in The ECB and IMF forecasts also cover 2016, with Euro area growth projections of 1.8% and 1.5% respectively. The ECB sees a small drop in Euro area unemployment to 11.4% in In February 2014, employment prospects in industry in the EU remained above their long-term average, indicating that managers in this sector expect moderate growth in employment. Employment expectations in the services sector have remained below their long-term average, both in the EU as a whole and in the Euro area. Sentiment around jobs in the construction sector has remained depressed at European level in recent years. In February 2014, managers in the construction sector reported reducing staff numbers more drastically on average in the Euro area than in the EU as a whole. European consumers expecting unemployment to fall slightly. In February 2014, European consumers expectations for unemployment at EU level over the coming months remained lower than the long-term average, indicating that they see unemployment as falling slightly in the coming months (see Chart 6). March 2014 I 9

10 Chart 6: EU consumers expectations for unemployment over the next 12 months and unemployment rate (scale varies) Source: European Commission DG ECFIN, Business and Consumer Surveys and Eurostat, LFS, [une_rt_m], data seasonally adjusted Employment in the EU and its Member States Decline in employment came to a halt in the second half of 2013 Employment started to show small signs of stabilising during 2013, with a slight upturn in growth (+0.1%) in the third quarter in the EU and in the last quarter in the EA. Still, falls registered in the beginning of the year weighted heavily on 2013 performance. Compared to a year earlier, employment decreased in the EU by 0.1% ( people) and by a more severe 0.5% in the EA ( people) reaching million by the end of 2013 in the EU (see Chart 7). Chart 7: Employment in the EU and the EA, (scale varies) The employment trend improved at the end of 2013 in the EU28 and in the EA where the decrease has been more severe during the past two years Prospects have improved, with employment stabilising since the second quarter of 2013, followed by two consecutive quarters of slight growth in the EU28 (+0.1% in 2013 Q3 and 2013 Q4). Over the two years to 2013 Q4, the decline in employment was more severe in the Euro area (-1.2% over the two year to 2013 Q4) than in the EU28 (-0.2%). Yet, in the last quarter, employment trends improved in both area (+0.1 % q-o-q). Employment increased in 17 Member States in the last quarter 2013 In the last quarter 2013, 17 Member States have benefited from increased employment, while it decreased in seven (see Chart 8). Even if the trend improved at EU28 aggregate level, Member State performance varied, with the highest increases (compared with the previous quarter) in Lithuania (+ 1.0%), Portugal (+ 0.7 %) and Ireland (+0.7%), and the largest decreases in, Estonia (-1.3%), Latvia (-1.1%), Italy (-0.5%) and the Netherlands (-0.5%). Chart 8: Employment growth in the fourth quarter of 2013, compared to the previous quarter and previous year in the EU, the EA and the Member States Source: Eurostat, National Accounts, data seasonally adjusted, [namq_aux_pem]. Q for HR Employment is not decreasing in the majority of sectors. Source: Eurostat, national accounts [namq_aux_pem]. Data seasonally adjusted. Employment growth in the last quarter of 2013 was mostly driven by increased employment in the service sectors, and a slowdown in the decrease in employment in the construction and industry sectors. In particular the construction sector, seriously March 2014 I 10
 Source:")
11 hit by the crisis, registered the first signs of recovery. Chart 10: Employment rate in the EU-28, the euro area and in Member States, 2013 Q3 Chart 9: Employment growth in the EU, by NACE sector (NACE code between parentheses; scale varies) Source: Eurostat, LFS, data non-seasonally adjusted [lfsi_emp_q] Source: Eurostat, National Accounts, data seasonally adjusted and adjusted by working days (q-o-q) and non-seasonally adjusted (y-o-y) [namq_nace10_e] Employment rate for the EU has stagnated below 70% In 2013 Q3, the EU-28 employment rate for the age group (68.3 %) remained stable in comparison with the third quarter of In the Euro area, it was 67.7 % a decline of 0.3 % over the year. In the year to 2013 Q3, 16 Member States saw an employment rate increase and 12 a decrease. The highest rises were recorded in Ireland (+2.1 pps) and Lithuania (+1.0 pps) while the most significant falls occurred in Cyprus (-3.1 pps) and Croatia (-2.2 pps). The difference between Sweden, which has the highest employment rate, and Greece is more than 25 pps (see Chart 10). The 2013 Q3 EU employment rate was 2.0 pps lower than in 2008 (70.3%). Employment rate differs across population groups As of 2013 Q3, there was a decrease in the employment rate over the year for the young and prime aged worker groups but an increase for older workers. Workers with lower levels of education recorded a significant decrease (see Chart 11). Chart 11: Year-on-year change in the EU-28 employment rate in 2013 Q3, by age group, gender and education level Source: Eurostat, LFS, data non-seasonally adjusted [lfsq_ergaed]. Improvements in employment have been driven by temporary and part-time work. In the year to the third quarter of 2013, temporary employment grew by 1.6% or workers, while permanent employment declined by 0.5% or (Chart 12). Self-employment decreased by 1.4% or March 2014 I 11
, 2005-13 (scale varies) Source: Eurostat, LFS, data non-seasonally adjusted (DG EMPL estimation) Full-time employment falling while parttime continues to rise")
12 Chart 12: Employees in permanent and temporary work in the EU-28, selfemployment and total employment (15-64 years) (1 000 persons), , year-onyear change Chart 13: Part-time and full-time employees in the EU-28 (1 000 employees), (scale varies) Source: Eurostat, LFS, data non-seasonally adjusted (DG EMPL estimation) Full-time employment falling while parttime continues to rise In the year to 2013 Q3, the number of fulltime workers in the EU had fallen by 0.8% (or 1.3 million). When viewed over the medium term, over the last five years, fulltime employment has decreased dramatically by 9.8 million (- 5.4%). On the other hand, at EU aggregate level, the number of employees working part-time has grown by 1.2% (or parttimers) in the year to 2013 Q3. There has been steady growth in this type of work in recent years, with 2.9 million more parttime jobs since the third quarter of 2008, a rise of 7.8%. Consequently, the share of part-time workers (of total EU employees) has risen consistently in recent years, reaching 19.3% in the third quarter of While permanent jobs were severely hit during the crisis, part-time jobs did not appear to have suffered, mostly because of an increasing share of male part-time workers in the EU and higher transitions of male workers from full-time to part-time work. Source: Eurostat, LFS, data non-seasonally adjusted [lfsq_epgaed] Unemployment The EU unemployment rate has fallen slightly from a high initial level. Recent months have seen a slight drop in the unemployment rate in the EU as a whole. Between September 2013 and January 2014, unemployment fell by 0.1 % to 10.8 %. Over the same period of time, the unemployment rate in the Euro area also fell by 0.1% to reach 12.0 % in January The unemployment rate in the EU is 0.2% lower compared to January 2013, which represents fewer people unemployed. With 26.2 million people out of work and actively seeking work in the EU, and 19.1 million in the Euro area, the level of unemployment remains historically high. This mild improvement follows on from a second peak in unemployment which saw the number of people unemployed rise by 17% between the first quarter of 2011 and the first quarter of 2013, an increase equivalent to 4.0 million more people out of work in the EU28. March 2014 I 12
![Chart 14: Unemployment rate in the EU (total and young people) and in EA, January 2007 to January 2014 (scale varies) Source: Eurostat, LFS, data seasonally adjusted [une_rt_m].](/docs-images/93/113109722/images/13-0.jpg "an increasing number of Member States have seen unemployment stabilise, but in some cases at levels very close to historic highs.")
13 Chart 14: Unemployment rate in the EU (total and young people) and in EA, January 2007 to January 2014 (scale varies) Source: Eurostat, LFS, data seasonally adjusted [une_rt_m].an increasing number of Member States have seen unemployment stabilise, but in some cases at levels very close to historic highs. In the three months to December 2013, the unemployment rate increased in 16 EU countries and decreased in 12. The recent falls in unemployment in Spain, the United Kingdom and Germany and, to a lesser extent, in Poland and Portugal have improved the unemployment situation at EU level. A rise in joblessness in Italy and France has, however, had a negative effect on the EU unemployment rate over recent months. The unemployment rate in the EU Member States is stabilising, but at a high level, with several countries remaining close to the historically high unemployment levels seen in recent years (see Chart 15). Chart 15: Monthly unemployment rates in the EU Member States in January 2014, and the highest and lowest unemployment rates since 2008 Diverging trends among different population groups The unemployment rate among young people fell by 0.3% over the year to January 2014 in the EU and by 0.1% in the Euro area. Unemployment fell more significantly among men than women, both in the EU as a whole (where there was a decrease in the respective unemployment rates for men and women of 0.2% and 0.1% year-on-year) and in the Euro area (where unemployment among men fell by 0.1% while the rate among women remained unchanged) (see Chart 16). Chart 16: Year-on-year change in unemployment rate in the EU in January 2014, by age and gender Source: Eurostat, LFS, data seasonallyadjusted[une_rt_m]. Source: Eurostat, LFS,.data seasonally adjusted [une_rt_m]. Exceptions: HU, LV (2013M12) EE, EL, UK (2013M11). March 2014 I 13
14 Impact of restructuring on employment The European restructuring Monitor (ERM) recorded a total of 345 cases of restructuring between 1 October and 31 December a Of these, 230 were cases of announced restructuring involving job loss, 104 were cases involving announced job creation and 11 were cases involving both job loss and job creation. These cases comprised a total of 96,245 announced job losses and 37,529 announced job gains. Internal restructuring accounted for over 70% of the announced job losses, while the incidence of job loss due to bankruptcy (11%) and closures (9%) decreased compared to the previous quarter. In terms of geographical distribution, the countries which recorded the greatest number of announced job losses were the United Kingdom (13,838 jobs) and Germany (13,506 jobs), followed by France (11,705 jobs), Spain (10,142 jobs), Greece (6,537 jobs) and Italy (6,457 jobs). The Czech Republic (9,529 jobs) recorded the highest number of new jobs, followed by France (6,020 jobs), Poland (4,558 jobs), the United Kingdom (3,528 jobs) and Germany (3,370 jobs). The figure below plots the top-10 NACE Rev.2 1-digit sectors in terms of announced job loss and job creation in the EU, in the period 1 December 2013 to 28 February This period registered a total of 61,685 announced job losses and 38,340 announced job gains in the EU. Manufacturing experienced the most restructuring activity involving job losses, accounting for about 35% of total job losses, while Retail and Transport and Storage accounted for the majority of job gains (around 27% of total job gains). Source: ERM, December 2013 February 2014 (DG EMPL estimation) a For details see the January issue of the ERM Quarterly available at: March 2014 I 14
.")
15 Long-term unemployment, additional potential labour force and underemployment 5 Long-term unemployment stagnated in the EU In the three first quarters of 2013 the number of long-term unemployed has remained stable in the EU (around 12.5 million people). Long-term and very longterm unemployment rates have also been stationary for the last three quarters, showing a trend similar to the unemployment rate. but its share grew, intensifying labour market detachment The share of long-term unemployment (as percentage of the total unemployment) in the EU is increasing. It has reached and surpassed its pre-crisis level, with a sharp rise in the latest quarters. Often changes in unemployment precede changes in long-term unemployment. 6 Chart 17 shows that the unemployment rate anticipated the changes in the long-term and, later on, in the very long-term unemployment rate. However, the trend in the latest quarters for all three indicators is towards stagnation. Indeed, the first indicator to stabilize was the very long-term unemployment rate (2012Q4). Chart 17: Unemployment, long-term and very long-term unemployment rates and long-term unemployment incidence in EU Q1-2013Q3 (scale varies) Source: Eurostat, LFS, data seasonally adjusted (unemployment rate) and non-seasonally adjusted (long-term unemployment rates) [une_rt_q and une_ltu_q]. Note: Very long-term unemployment refers to those in unemployment for at least two consecutive years Member States show different long-term unemployment patterns The dispersion in the long-term unemployment levels among Member States, not only remained high, but also increased last year. 5 Underemployment and additional potential labour force cover the three EUROSTAT supplementary indicators to unemployment (SIU): [1] underemployed part-time workers, [2] persons seeking work but not immediately available and [3] persons available for work but not seeking it (i.e. discouraged). These people do not fulfil all the criteria of the unemployment definition of the International Labour Organisation (ILO) and are therefore not classified as unemployed. They do however share some characteristics with the unemployed. See: dex.php/underemployment_and_potential_additional_la bour_force_statistics. 6 ESDE 2012 (Chapter 1, The dynamics of long-term unemployment, 1.1.2, pag. 67) March 2014 I 15
![Chart 18: Long-term unemployment in Member States Source: Eurostat, LFS, data non-seasonally adjusted [une_lt_q] Activity in the EU still increasing The activity rate in the EU has increased](/docs-images/93/113109722/images/16-1.jpg "constantly in recent years for the main age groups, to reach a high point in the active population in the EU, with 238.5 million people in the 20-64 age group.")
16 Chart 18: Long-term unemployment in Member States Source: Eurostat, LFS, data non-seasonally adjusted [une_lt_q] Activity in the EU still increasing The activity rate in the EU has increased constantly in recent years for the main age groups, to reach a high point in the active population in the EU, with million people in the age group. At the same time, the United States suffered a noticeable decline in its activity rate (see page 8). and converging among Member States Significant differences persist among the activity rates of EU Member States. Less than 2/3 of the population is actively involved in the labour market in Croatia, Italy and Hungary (see Chart 20). However, in terms of activity rates, convergence between Member States has taken place in the period between 2008 and Malta had the lowest activity rate of the EU in It has consistently increased its activity rate since the onset of the crisis and still led growth in the EU during last year. On the other hand, Croatia is suffering sustained decline in its activity (Chart 20). Chart 19: Activity rate levels and evolution in Member States Source: Eurostat, LFS, data non-seasonally adjusted [lfsi_act_q] March 2014 I 16

17 Chart 20: Convergence in the activity rates of Member States in the period 2008Q3 to 2013Q3. increasing differences among Member States The size of the potential labour force and underemployment is relevant, as they represent on average an increase of 40% on the unemployment level. Chart 22: Unemployment and the three supplementary indicators to unemployment (SIU), by Member State (2013Q3) Source: Eurostat, LFS, data non-seasonally adjusted [lfsi_act_q] Both the underemployed and additional potential labour force growing in the EU Underemployed and additional potential labour force 7 in the EU have grown at the same pace as the unemployment rate, especially since the middle of All three supplementary indicators have evolved in a similar manner. Chart 21: Unemployment rate, potential labour force and underemployment in the EU (scale varies) Source: Eurostat, LFS, data non-seasonally adjusted [une_rt_q and lfsi_sup_age_q] (DG EMPL estimation). (*)SIU for FR from 2012Q Discouraged or underemployed Source: Eurostat, LFS, data seasonally adjusted (unemployment rate) and non-seasonally adjusted (other indicators), [une_rt_q and lfsi_sup_age_q] (DG EMPL estimation] Member States can be divided into two main groups on the basis of the incidence of the different supplementary indicators: discouraged or underemployed. In the EU, as a whole, the incidence of the discouraged is slightly higher. 7 Additional potential labour force is those seeking work but not available and not seeking work but available (see footnote 6 and: dex.php/underemployment_and_potential_additional_la bour_force_statistics). March 2014 I 17

18 Chart 23: Labour underutilisation in EU Member State (2013Q3) thanks to the slowdown of job destruction in the sectors most hit by the crisis, i.e. construction and industry (see Chart 9). At the same time, the increase of social benefits partly compensated these market income losses, but to a much lesser extent than in Indeed, in , the stabilisation impact of tax-benefit systems weakened, also reflecting the exceptional scale of the fiscal adjustment needed at EA level. By the third quarter of 2013, real GDHI had stabilised overall in the Euro Area compared to the same quarter in It was nearly stable in Ireland, France or Italy and improved in some Member States such as Sweden and Germany. However, GDHI continued to decline in Greece, Portugal, Slovenia and Spain (see Chart 24 for the EA and charts in the annex for selected Member States). Households' financial distress 9 - the need to draw on savings or to run into debt - continues to increase. Source: Eurostat, LFS, data non-seasonally adjusted [une_rt_q],[lfsi_sup_age_q] (DG EMPL estimation). (*) Values for FR from 2012Q4 Households' income and financial situation The decline in household incomes slowed down and nearly stabilised in the Euro Area In 2013, the gross disposable household income of households continued to decline year on year in the Euro Area 8 in real terms, but at a slower pace and nearly stabilising in the third quarter. This relative improvement mainly occurred because the decline in labour market incomes (especially in the compensation of employees) slowed down. This is consistent with the trends observed on the labour market showing that employment growth stabilised mainly Financial distress has continued its upward trend since Contributing factors have been the increasing share of the population reporting that their households had to draw on their savings and also, more recently, the increasing share reporting running into debt. Financial distress reached a new high level, not experienced in the previous decade, driven primarily by the increasing reliance on savings since 2011 (see Chart 25). Financial distress continues to increase for all households, and especially strongly for those on low incomes. Financial distress remains well above longterm averages for households in all income quartiles, and for all but upper quartile households it has soared above levels recorded at the time the crisis first hit. The acute financial situation continues to affect low income households the most, in particular last year saw a widening of the gap in financial distress between low income households and other households. 10% of adults in low income households are 8 The real GDHI for EA is analysed based on data releases from Eurostat and the ECB. Calculation of quarterly real GDHI for EU is not possible because data for several Member States are missing. The nominal EA aggregate is converted into real GDHI by deflating with the EA HICP. 9 See previous editions of this report. For details on Business and Consumer Surveys, including consumer survey's question on the current financial situation of the household, see: veys/index_en.htm March 2014 I 18
 Source: Eurostat,")
19 forced to run into debt and a further 15% must draw on savings to cover current expenditure (compared to 5% and 12% for the total population). Chart 24: a weakening of the stabilisation impact of social benefits in 2012 compared to 2009 Real GDP growth, real GDHI growth and its main components, EA17 (2005Q1-2013Q3) Source: Eurostat, National Accounts and Price Statistics, data non-seasonally adjusted [namq_gdp_k, nasq_nf_tr and prc_hicp_midx] (DG EMPL estimation) Chart 25: Rise in financial distress across all income quartile households, driven mainly by increased need to draw on savings Reported financial distress by income quartile, and components of reported financial distress (share of adults reporting necessity to draw on savings and share of adults reporting need to run into debt), EU28 Source: European Commission DG ECFIN, Business and Consumer Surveys (DG EMPL estimation), data non-seasonally adjusted. Note: Three-months moving averages. Horizontal lines reflect long-term averages of financial distress for total and 4 income quartile households. For total households, the share of adults reporting needing to draw on savings and needing to run into debt are stacked in the grey chart area which adds to total financial distress. March 2014 I 19

20 Divergence in developments in household financial situations across Member States continues The incidence of financial distress among all households worsened over 2013 in several Member States and remains higher than in 2007 in most of them, ranging from less than 5% in Germany and Sweden to more than 25% in many Southern Member States. The increase in financial distress among people in the lowest income quartile households, which has accelerated since 2007 in all Member States soared in 2013 in France and Spain, while nearly halved in Bulgaria, Croatia and Ireland. The share of the population in the lowest income quartile households that suffers from financial difficulties ranges from less than 10% in Germany and Luxembourg to more than 40% in Italy, Romania, Slovakia and Spain (see Chart 26). Chart 26: Financial distress in low income households affected Member States differently. Reported financial distress in lowest income quartile households in 2007, 2012Q4 and 2013Q4 in EU Member States Source: European Commission DG ECFIN, Business and Consumer Surveys, DG EMPL calculations. Note: Data non-seasonally adjusted, 3-months moving averages. Productivity, wages and hours worked Productivity, labour costs and hours worked Labour productivity growth remained weak in most Member States in the fourth quarter of 2013 In the fourth quarter of 2013, labour productivity growth (measured as productivity per person employed) was weak in the EU (as compared with the fourth quarter of 2012), as several Member States recorded very low or even negative productivity growth. These developments reflect primarily a weak cyclical pick-up in output growth for most Member States. In the Euro area, Cyprus (-1.1%), Estonia (-0.5%) and Malta (-0.5%) recorded decreases in their labour productivity, while most of the other Member States showed growth just above or below 1% - notable exceptions are Slovenia (+3.2%) and the Netherlands (+2.1%). Outside the Euro area, Romania (+5.6%), Latvia (+4.0%) and Slovenia (+3.2%) recorded robust productivity growth, while the Czech Republic (+0.2%), Denmark (-0.1%), and Finland (+0.4%) showed rather weak growth (see Chart 27). March 2014 I 20
21 Chart 27: Labour productivity, nominal compensation per employee and nominal unit labour cost Source: DG EMPL calculations based on Eurostat [namq_aux_lp], [ namq_aux_ulc] Note: Not seasonable adjusted data. but growth in nominal compensation per employee was also weak in most Member States. Growth in nominal compensation per employee remained subdued in the European Union in the fourth quarter of 2013 (as compared with the fourth quarter of 2012), with some Member States even showing strong decreases. In the Euro area, Cyprus (-6.5%), followed by Portugal (-0.4%) and Malta (-0.3%) recorded a strong decrease in their average nominal compensation per employee, while growth remained rather subdued in Belgium (1.8%), Germany (1.8%), France (1.6%), Italy (1.5%) and the Netherlands (1.4%), but picked in Spain (+2.2%) and Finland (+2.3%) and rose sharply in Estonia (8.8%). Outside the Euro area, Romania (+6.2%), Lithuania (+5.0%) and Bulgaria (+4.2%) recorded very strong growth in nominal compensation per employee. See Chart 27. so that deflationary pressures in the Euro area strengthened. In the Euro area, nominal unit labour cost growth (i.e. growth in nominal compensation per employee adjusted for productivity growth) weakened notably in the last quarter of 2013 (as compared with the same quarter in 2012) - with Cyprus and Greece even showing strong decreases. See Chart 27. Weakening nominal unit labour cost growth is a driver of cost-push deflationary pressures which in combination with nominal interest rates close to their lower bound in the face of sharp output gaps may lead to a significant weakening of growth and employment. Within the Euro area, the strongest decreases in nominal unit labour cost are to be found in Cyprus (down by -5.4%) and Greece (-4.7%), while moderate decreases are recorded for Slovakia (-1.5%) and the Netherlands (-0.8%). Apart from Estonia, which recorded a very strong 8.8% increase (as compared with the fourth quarter of 2012), the other Member States of the Euro area showed weak growth in their nominal unit labour cost. In Germany, nominal unit labour cost grew by 1.1% in the fourth quarter of 2013, by 1.0% in France, by 0.7% in Italy, and by 1.7% in Austria. Outside the Euro area, Lithuania (3.6%) and Hungary (3.4%) showed rather robust growth in nominal unit labour cost increased in the fourth quarter (as compared with the fourth quarter in 2012). However, several Member States outside the Euro area also showed weak nominal unit labour cost growth, i.e. Denmark (0.8%) and even decreasing in the Czech Republic (-3.0%)... but real unit labour cost decreased rapidly in several Member States. Real unit labour cost (which is the nominal unit labour cost adjusted for prices and which also measures the labour income share) decreased rapidly in several Member States in the fourth quarter of 2013 reflecting weaker growth in compensation per employee (adjusted for output prices) than labour productivity (see Chart 28). By far, the sharpest decreases in real unit labour cost in the fourth quarter of 2013 (as compared with the fourth quarter of 2012) are to be found in the Czech republic (- 5.0%), Romania (-4.4%), and Slovenia (- 3.4%), followed by Cyprus (-2.9%), Malta (-2.2%) and Sweden (-2.0%). A notable development was that in Spain the real unit labour cost increased for the first time since the fourth quarter of 2009 due to a much stronger increase in real compensation per employee than productivity, primarily triggered by the ongoing GDP price disinflation with an increase of only 0.2% in the fourth quarter (as compared with the same quarter in 2012). March 2014 I 21
![Chart 28: Real unit labour cost Source: Eurostat, [namq_aux_ulc] The number of hours worked remained on average fairly stable The third quarter of 2013 (i.e. a quarter for which data are available for all Member States), full-time workers in Greece performed the highest average number of actual weekly hours of work in a main job, i.](/docs-images/93/113109722/images/22-1.jpg "e. 43.7 hours, followed by workers in Poland (42.5 hours), Cyprus (42.4 hours), Portugal (42.2 hours) and Austria (42.1%).")
22 Chart 28: Real unit labour cost Source: Eurostat, [namq_aux_ulc] The number of hours worked remained on average fairly stable The third quarter of 2013 (i.e. a quarter for which data are available for all Member States), full-time workers in Greece performed the highest average number of actual weekly hours of work in a main job, i.e hours, followed by workers in Poland (42.5 hours), Cyprus (42.4 hours), Portugal (42.2 hours) and Austria (42.1%). The lowest amount of hours worked by fulltime workers was recorded in Finland (39.7 hours), followed by Hungary (39.8 hours) and France (40.0 hours). At the same time, part-time workers in Romania worked the longest hours, i.e. on average 27.5 hours, followed by workers in Sweden (24.3 hours) and Belgium (23.5 hours). The lowest amount of hours worked by part-time workers was found in Portugal (16.6 hours), followed by Germany (18.5 hours) and Spain (18.7 hours). See Chart 29. Chart 29: Hours worked: Full- and part-time Labour demand: vacancies, labour shortages and hiring activity The EU s job finding rate has decreased from an already low level, while the job separation rate has stabilised. The EU job finding rate 10 decreased again in the third quarter of 2013 to 10.4 % 11 (see). This was its lowest level in the past year, showing that it is becoming increasingly hard for an unemployed person to find a job. The job separation rate 12 was 0.84 % in 2013 Q3 (see Chart 30). The EU s job finding rate remained low over the past year compared with the pre-crisis period. In the second semester of 2012, it dropped below 12 % from an average of over 20 % five years ago (see Chart 30). The EU job separation rate has remained high since 2009, growing moderately to 0.87 % in the last quarter of 2012, 0.14 percentage points higher than five years previously. Chart 30: Job finding and job separation in the EU (scale varies) Source: Eurostat; LFS (DG EMPL estimation) The fall in the number of people starting new jobs has spread across many sectors of the EU economy Source: Eurostat, [lfsq_ewhais] Note: average number of actual weekly hours of work in main job In many sectors fewer people have started a new job in the third quarter of The 10 Monthly ratio of the number of people starting new jobs to those who are unemployed. People starting a job include those previously in work and those changing jobs (employment to employment flow), those unemployed (unemployment to employment) or those not in the workforce (inactivity to employment). 11 Weighted average of the four quarters preceding the estimated quarter. 12 Monthly ratio of the number of people who quit their job to the number of people in employment. March 2014 I 22
23 number of people starting new jobs has decreased in the wholesale and retail trade by 4.6 % (over the year to the third quarter of 2013), in manufacturing by 11.2 %, in accommodation and food service activities by 4.5 %, in human health and social work activities by 5.1 %, in the construction sector by 12.2 % and in administrative and support service activities by 17.0 %. In the education sector, however, there has been an increase (of 5.6 %) in the number of people starting a job. Chart 31: Number of people starting a new job and Year-on-year change in the third quarter of 2013 by NACE sector (scale varies) Source: Eurostat; LFS (DG EMPL estimation) According to the recently published European Vacancy Monitor, vacancies were fairly stable in the third quarter of 2013, except for some increase in the public sector. 13 In the fourth quarter of 2013 the EU job vacancy rate rose compared to the level a year ago (1.6% against 1.4% in 2012Q4), with a rate above the EU level in only three of the ten Member States for which data are available Belgium, Germany and the UK. 14 In the quarters between 2013Q1 and 2014Q1, there were increases in the labour shortage indicator at the EU level at the same time as unemployment remained fairly stable. Increases between the last quarter of 2013 and the first quarter of 13 Available at: 14 BE, CZ, BE, DE, ES, NL, RO, SK, FI, and UK (as for the 3 rd March 2014) were particularly significant in Slovenia (+4.7 pps), the Czech Republic (+2.6 pps) and Croatia (+2.4ppt), while the strongest declines were registered in the UK (-6.2 pps) and Estonia (-3.1 pps). The latest Manpower Employment Outlook Survey provides with a measure of hiring expectations between January and March Despite continuing economic challenges and widespread uncertainty in the global labour market, first-quarter research reveals that at the global level the majority of hiring managers will continue to add to their workforces by varying degrees during the first quarter of In Europe, positive hiring activity is expected in 12 of the 19 Member States covered by the Survey. 16 The strongest hiring plans for the first quarter of 2013 are in Poland, where the Outlooks improve in most sectors and regions in both quarter-on-quarter and year-on-year comparisons. In Greece, employer hiring plans are positive for the second consecutive quarter, and employers report the strongest outlook since the fourth quarter of Irish, Italian and Spanish employers continue to predict weak labour markets, with the weakest hiring intentions reported by employers in Italy, where employer hiring plans have improved slightly from three months ago but remain negative and unchanged from year-ago levels. Latest data for January 2014 from EUROCIETT17 report a growth of 4.8% in the number of hours worked by agency workers in Europe.18 This means growth is still accelerating ever since the first positive growth in October last year, however not as quickly as during the last recovery, in Q1 of Today, Poland, Denmark and Italy show the biggest growth in the European market. 15 The Manpower Employment Outlook Survey is a forward-looking employment survey polling over 65,000 employers in 42 countries and territories to measure their intentions to increase or decrease the number of employees in their workforce during the next quarter. 16 For details see: npowergroup-en/home/thoughtleadership/meos/#.uxysc3ct58f 17 Available at: ocs/stats/eurociett_march_2014_agency_work_busines s_indicator.pdf 18 The weighted European average is determined by the surveyed countries share of the European agency work market in The countries contributing to the weighted European Average account for 62.6% of the agency work market in Europe. March 2014 I 23
. Over the year to the third quarter of 2013 unemployment was already down by 1% - the first year-on-year decline since mid- 2011.")
24 Labour market and social situation for selected groups Youth Labour markets for youth in the EU have shown signs of stabilising since mid-2013 Monthly developments in 2013 and in January 2014 indicate stabilisation in unemployment for youth (see Chart 14). Over the year to the third quarter of 2013 unemployment was already down by 1% - the first year-on-year decline since mid Inactivity and the number of people not in employment, education or training (NEET) also decreased by 1% and 2%, respectively over the same period (see Chart 32). Chart 32: The labour market for youth aged has stabilised, but it remains much weaker than prior to the downturn Employment rate, unemployment ratio and NEET rate (% of population 15-24) and unemployment rate (% of labour force 15-24) in the EU Young people, hit severely during the downturn, still face many challenges, with historically high unemployment and increasing divergence among Member States In only a third of young persons in the EU had a job, down from 37% in 2008, often on temporary or part-time basis. More than 40% of young employees had temporary jobs, 3.5 times more than primeage adults. Nearly a quarter of young people a constantly increasing share, work part-time, up from less than 20% in Unemployment affected around 10% 20 of young people aged in the EU, up from 8% in Unemployment, with the rate at 23.4% in January 2014, affects 2.5 million young women and 3.1 million young men aged Considerable disparities exist among Member States, despite improvements in half of them over 2013 (except for a surge in Cyprus, Estonia and Italy). The unemployment rate ranges from around 10% or less in countries little affected by labour market deterioration, i.e. Austria, Germany and the Netherlands, to more than half of the young active in the labour market being unemployed in Greece and Spain nearly a triple compared to In , unemployment affected around 10% of young people aged in the EU, up from 8% observed in However, also people aged who often enter the labour market after graduation, require policy attention, because they suffer from a similar lack of job opportunities (with the unemployment ratio of 10% as well). Source: Eurostat, EU LFS, data non-seasonally adjusted, (DG EMPL estimation, average of four quarters to quarter 3) 19 Average of four quarters 2012q3-2013q3 20 The unemployment-to-population ratio. 21 Average of four quarters 2012q3-2013q3 March 2014 I 24

25 Chart 33: Youth unemployment rates in Europe, January 2014 Youth unemployment rate 22 ppt change (y-o-y) EL ES HR IT CY PT SK BG PL IE FR HU BE RO LV EU SI SE EE LU LT UK FI CZ MT DK NL AT DE Differences between the unemployment rates and the unemployment ratios reflect disparities in the activity levels of young people in different Member States. At EU level, nearly 60 % of young people were inactive in , with variations among Member States of between 30 % and 75 %. In nine out of 10 cases this was because of enrolment in education. High unemployment rates of young people in Spain and especially in Greece and Croatia, and low rates in Austria, Germany and the Netherlands partially reflect differences in labour market participation (higher in the latter group), including in the employment of young people. Consequently, the disparities between the unemployment rate and the unemployment-to-population ratio are the highest in the first group and lowest in the latter one. This results in a lower variation in the unemployment-topopulation ratio among Member States. Young people who are neither in employment nor in education or training (NEET) should remain the main policy focus Around 70% of young people remained in education in the EU in However, the share of those who are not in education or employment picked up from below 11% in 2008, to around 12.5% in 2010, and then has broadly stabilised since 2011 at around 13%. Considerable disparities exist among Member States, ranging from less than 5% in the Netherlands to more 20% or more in southern Europe, while in Baltics the NEET is on downturn (see Chart 34). 22 RO: September 2013; EE, EL, and UK: November 2013; HR, CY, LV, HU, and SI: December Average of four quarters 2012q3-2013q3 24 Average of four quarters 2012q3-2013q3 March 2014 I 25
26 Chart 34: The share of young people not in education or employment varies among Member States and remains higher than before the downturn in most of them NEET rate for the EU, EA and Member States Source: Eurostat, EU LFS, data non-seasonally adjusted (DG EMPL estimation average of four quarters) Young people face high poverty risk, but variations among countries reflect household composition The risk of poverty among young people (16-24), which stood at 23.1% in 2012, and is higher than among adults (around 15%) is not straightforward to assess. While it is understandable that lack of experience and high education is penalised in terms of wages, the household composition blurs the comparison across Member States. The variations between adults and youth rates are clearly impacted by the incidence of young people sharing household with their parents. The poverty gap has been the highest in Denmark, Finland, and Sweden where less than 60% of young people live with parents and one of the lowest in Belgium, the Czech Republic, Malta and Slovakia where the share is above 85% transitions. Migrants Labour markets in the EU for third country migrants continued to deteriorate, and remain a challenge Third-country migrants account for nearly 5 % of the EU population. Their labour market situation has always been more severe than that among nationals, with significantly subdued activity and employment and double the unemployment rate (20 %). The labour market continued to weaken up to the third quarter of 2013, as third-country migrants were increasingly unemployed for longer on the account of weaker employment. Weaker labour market development pushed migrants into poverty or social exclusion, which had always been less favourable (see Chart 35). March 2014 I 26
27 Nat Other EU Non-EU Nat Other EU Non-EU Nat Other EU Non-EU Nat Other EU Non-EU Nat Other EU Non-EU Nat Other EU Non-EU Nat Other EU Non-EU Nat Other EU Non-EU Nat Other EU Non-EU Nat Other EU Non-EU EU Employment and Social Situation Chart 35: Labour market for third-country migrants in the EU continued to deteriorate in 2013 and remains worse than for Europeans. Employment rate, inactivity rate (% of pop 15-64), unemployment rate, long-term unemployment rate (% of actiive pop 15-64),youth unemployment rate (% of active pop 15-24) and unemployment ratio (% of pop 15-24), q3, at-risk-of-poverty-or-social-exclusion rate, at-risk-of-poverty rate (% of pop 18-64), in-work poverty rate (% of employed 18-64), severe material deprivation (% of pop 18-64), , by nationality groups, EU-27, Empl rate (%pop) Inact rate (%pop) Une rate (%act) LUR (%act) Youth une rate Youth une ratio AROPE AROP IWP SMD Source: Eurostat, EU LFS and EU SILC, data non-seasonally adjusted (DG EMPL estimation, average of four quarters to quarter 3 for labour market indicators) March 2014 I 27
28 March 2014 I 28
29 Supplements to the EU Employment and Social Situation Quarterly Review S1. Labour market transitions before and during a severe economic downturn: some evidence from micro-economic data S2. Trends in poverty and social exclusion between 2011 and 2012 S3. Trends in social expenditure and distributional impact of policy changes until 2013 March 2014 I 29
30 S1. Labour market transitions before and during a severe economic downturn: some evidence from micro-economic data This supplement provides some empirical evidence on labour market transitions in the European Union before and during the economic downturn that started in using micro-economic EU SILC data 26 (for the Member States for which data are available 27 ). A search and matching model underpinned the empirical analysis of conditional transition probabilities. In such model labour market transitions are triggered by mismatches between reservation wages and productivity. For instance, as an economy goes into recession, the productivity of many matches falls below the required reservation wage, which leads to an upsurge in job destructions and increased inflows into unemployment. At the same time, firms reduce their hiring activities and post fewer vacancies so that the flows from unemployment to employment are reduced. Both effects reduce employment and increase unemployment. Comparing labour market transitions in the European Union as a whole in 2010 with transitions in 2006, the analysis shows that employment stability declined significantly in 2010 whereby a transition to unemployment was the most important destination on leaving employment; that transitions of men and young people were most strongly affected; and that the stepping-stone function of temporary employment (whereby workers on temporary contracts move up to a permanent contract) reduced notably. The following charts provide some further details. 28 Transitions from employment This section shows estimates of the impact of individual characteristics (i.e. gender, age and skills) on the probability to transit from employment (E) to another labour market state (i.e. selfemployment (S), unemployment (U), education (Ed) or inactivity (I)) in 2006 and Chart 1 shows the changes in the transition probabilities of the reference groups between 2006 and These reference categories are women for gender, years old for age, and medium skilled for skill level. The chart shows that the probability to transit from employment to unemployment increased for women by 0.7 percentage point (pps) in 2010 compared with 2006, for years old workers by 1.2 pps and for medium-skilled workers by 1.2 ppt. At the same time, the probability to stay employed was for women 0.7 pps lower in 2010 than in 2006, 0.9 pps for years old, and 1.1 pps for medium-skilled workers. 25 I.e., based on the "Study on labour market transitions using micro-data from the Statistics on Income and Living Conditions (SILC)", executed by Rheinisch-Westfälisches Institut für Wirtschaftsforschung (RWI) with funding of the European Union Programme for Employment and Social Solidarity - PROGRESS ( ) (contract VC/2013/0020)) 26 Applying advanced econometric techniques, i.e., multinomial logit estimation techniques that recognize more than two possible discrete outcomes, in casu the labour market states employment, unemployment, self-employment, education and inactivity SILC releases not available for Germany, Croatia and Romania, but including Iceland and Norway. 28 See RWI (2014) for an elaborated discussion of the estimation results.. 29 Technically speaking: the values shown in Chart 1 reflect the point estimates of a "crisis dummy" which is 0 in 2006 and 1 in 2010, thereby measuring the impact of the crisis on the transition probability of the reference category, i.e. women, medium skilled,and years old. March 2014 I 30
31 Chart 1: Change in transition probability from employment for reference categories between 2006 and 2010 Source: RWI (2014, Tables A.6.5, A.6.7 and A.6.9) Note: E: employment, S: self-employed, U: unemployed, Ed: education, I: inactive Note: the bars reflect the value of the point estimate of a "crisis dummy" which is 0 in 2006 and 1 in 2010, thereby measuring the impact of the crisis on the transition probability of the reference category, i.e. women, medium skilled,and years old. Note: only statistically significant estimates for E and U. Chart 2 shows transition probabilities from employment for the other groups of workers (relative to the reference category): the blue bars show the transition probabilities in 2010, while the red stars show the probabilities in All individual covariates that were included in the regression analysis have intuitive signs and are significant in most cases. The estimation results can be summarised as follows. In 2010, employed men were 0.9 pps more likely to remain employed than women, compared to 1.2 pps in Men were about 1.5 pps less likely to become inactive than women in 2010 which is almost the same as in 2006, see Chart 2.A. Here it should be noted that these estimates are corrected for individual and occupational characteristics of the employees, which implies that they take into account the often stronger sensitivity of men's job opportunities to the business cycle. In other words, the estimated convergence of probability in employment stability may reflect structural changes in labour market behaviour - such as a decrease in discrimination against female workers. In 2010, the probability to remain employed was highest for those aged between 35 and 54 years and lowest for those aged between 55 and 64 years, see Charts 2.B, 1.C and2.d. The probability of making a transition from employment to unemployment was highest for the youngest cohort (aged 15-24) in both periods, even increasing by 1.6 pps (compared to the cohort) between 2006 and Finally, the employment stability of the low-skilled decreased by 0.4 pps compared to the medium skilled between 2006 and 2010, see Charts 2.E. At the same time, their probability to become unemployed or inactive increased, up from respectively 0.9 pps and 0.6 ppt. in 2006 to respectively 1.2 pps and 0.7 pps in Not surprisingly, the high-skilled workers had a lower probability to become unemployed or inactive than their medium skilled and low-skilled counterparts in 2010 albeit that it was less pronounced than in 2006, see Chart 2.F. March 2014 I 31
32 EU Employment and Social Situation Chart 2: Probability of transition from employment in 2006 and 2010 (scales vary) A. Men relative to women B years old relative to years old C years old relative to years old D years old relative to years old E. Low-skilled relative to medium skilled F. High-skilled relative to medium skilled Source: RWI (2014, Table A.6.13 and Table A.6.15) Note: E: employment, S: self-employed, U: unemployed, Ed: education, I: inactive March 2014 I 32
33 Transitions from unemployment Charts 3 shows to what extent individual characteristics affected the probability to transit from unemployment into another labour market state in 2006 and Changes in the transition probabilities from unemployment for reference categories between 2006 and 2010 are not shown as they did not include statistically significant estimates. Unemployed men were 4.9 pps more likely to remain unemployed than women in 2010 (up from 0.5 pps in 2006). Nevertheless, an unemployed man was about 3 pps more likely to find a job than a woman in 2010 (but down from 6.7 pps in 2006), and also 9.3 pps less likely to become inactive (about the same as in 2006). In 2010, young persons were about 8 ppt. more likely to make a transition from unemployment to employment than the years cohort, while older persons were about 17.5 ppt. less likely than the years cohort. Nevertheless, for the young cohort this probability decreased by about 4 pps between 2006 and 2010, while it increased for the older workers by about 2.5 pps. In 2010, the low skilled were 7.4 pps more likely to remain unemployed than the medium-skilled (about the same as in 2006), but they were still 6.3 pps less likely to transit from unemployment to employment than the medium skilled (compared to 8.8 pps 2006), see Charts 3.E. By contrast, unemployed high skilled workers experienced a strong increase in their probability to stay unemployed (compared to the medium skilled), while their probability to get employed also decreased, down by 2 pps between 2006 and Transition from temporary employment Charts 4 shows to what extent individual characteristics affect the probability to transit from temporary employment to another labour market state (including permanent employment). Most estimated coefficients display intuitive tendencies, but several are not statistically significant. 30 Men were about 2 ppt. more likely to move from temporary to permanent employment than women in 2010, compared to 3.4 pps in 2006, see Chart 4.A. They were also about 2 ppt. less likely to become inactive in 2010, compared to 2.6 pps in Again, it should be noted that these estimates are net of job characteristics, so that the change in the estimated parameter values may indicate structural changes such as less discrimination against female workers. In 2010, the youngest and oldest age cohorts were respectively 3.2 and 8.0 ppt. less likely to remain in temporary employment than the middle-aged group, compared to respectively 1.5 ppt. and 4.0 pps in 2006, see Chart 4.B. Young workers on a temporary contract were about 1.4 ppt. more likely to move into education than the years old in 2010, compared to 3.3 ppt. in 2006; and they were also about 3.6 ppt. more likely to transit to unemployment than the years old. 31 The oldest workers on a temporary contract were about 11.9 pps more likely to become inactive than the years old in 2010, compared with 9.8 pps in Chart 4.E to 4.F show that low-skilled workers on a temporary contact were 2.9 pps less likely to move to a permanent-contract job than medium-skilled workers in 2010, compared to 4.7 pps in However, they were also 4.8 ppt. more likely to become unemployed than the mediumskilled workers in 2010, compared to 2.9. pps in Finally, in 2010 the high-skilled workers on a temporary contract were more likely to remain on temporary contracts and less likely to transit into unemployment and inactivity than the other skill groups though these differences in probability have decreased notably between 2006 and This could be due to a lack of statistical power since these regressions are restricted to those individuals that transfer from temporary employment and this is a smaller group than those permanently employed. Change in transition probability from temporary employment for the reference categories between 2006 and 2010 is not shown because they did not include significant estimates. 31 No significant estimate for March 2014 I 33
34 EU Employment and Social Situation Chart 3: Probability of transition from unemployment in 2006 and 2010 (scales vary) A. Men relative to women B years old relative to years old C years old relative to years old D years old relative to years old E. Low-skilled relative to medium skilled F. High-skilled relative to medium skilled Source: RWI (2014, Table A.6.61 and Table A.6.63) Note: E: employment, S: self-employed, U: unemployed, Ed: education, I: inactive March 2014 I 34
35 EU Employment and Social Situation Chart 4: Probability of transition from temporary employment in 2006 and 2010 (scales vary) A. Men relative to women B years old relative to years old C years old relative to years old D years old relative to years old E. Low-skilled relative to medium skilled F. High-skilled relative to medium skilled Source: RWI (2014, Table A.6.31 and Table A.6.31) Note: E: employment, S: self-employed, U: unemployed, Ed: education, I: inactive March 2014 I 35
36 S2. Trends in poverty and social exclusion between 2011 and 2012 The latest survey data indicated that poverty would continue to increase in 2012, particularly in a few countries where economic and labour market conditions had continued to deteriorate. In the EU-28, % of Europeans were affected by the risk of poverty or social exclusion 33 in 2012, an increase of 0.5 pps since 2011 (see Chart 1). This corresponds to 124 million people (123 million in the EU-27). 34 Chart 1- Recent trends in poverty and social exclusion in Europe (% of the population) Source: Eurostat, EU-SILC The at-risk of poverty or social exclusion increased in one third of the Member States between 2011 and 2012 Between 2011 and 2012, the share of the population at risk of poverty or social exclusion increased in a third of the EU s Member States (see Chart 2): EL, CY, IE, IT, RO, HU, MT and PT. It dropped in HR, BG, BE and ES, but this decrease is partly explained by a fall in the poverty threshold, reflecting lower overall living standards in these countries (see below). Rates also increased in countries with relatively low levels of poverty and social exclusion, such as the UK, LU and AT. 35 In the Baltic States, especially LV, the situation remained stable or even improved due to economic recovery in recent years, following a profound shock just after the crisis. Nevertheless, poverty and social exclusion remain high in these Member States. 32 NB: Croatia did not join the EU until The EU poverty and social exclusion headline target is determined on the basis of three indicators: the at-risk-of-poverty rate, the severe material deprivation rate and the share of people living in very low work-intensity (quasi-jobless) households. It covers people in any of these categories and, while very broad, reflects the many facets of poverty and social exclusion across Europe. 34 See also annexes to the Communication Taking stock of the Europe 2020 strategy for smart, sustainable and inclusive growth., Many ways, one objective, March In AT, the information process has changed; information from additional administrative sources (mainly as regards income) was introduced between 2011 and This resulted in a change in income distribution and a break in series. For this reason, SILC results regarding incomes for AT are not commented on further. However, as the Euromod nowcast exercise is based on ex-ante information, it is not affected by the break in series and is commented on. 36
37 Chart changes in the components of the at risk of poverty or social exclusion (pp) Source: Eurostat, EU-SILC In a number of countries, the poverty threshold declined, reflecting a general deterioration of living conditions The average at-risk-of-poverty rate (relative income poverty) remained stable at EU level between 2011 and 2012, but this hid diverging national developments, with a particularly sharp increase in EL. However, changes in the rate must be considered alongside changes in the poverty threshold, which shifts in line with total income. The combination of labour market deterioration and the weakening stabilising effect of social protection over time 36 may result in marked declines of household disposable incomes and thereby drops in the poverty threshold (defined as 60 % of median equivalised income). In such cases, changes in the (relative) risk-of-poverty rate do not necessarily reflect changes in the actual income situation of households. The anchored poverty rate, using a threshold fixed at 2008 value (updated by inflation) over time, helps to disentangle the two effects. EL has seen a strong increase in the risk of poverty (by 1.7 pps since 2011), accompanied by a strong drop in the risk-of-poverty threshold (by 14.3 % since 2011). If the poverty threshold had remained at the 2008 level (updated by inflation), the risk of poverty in EL would have increased by 15.7 pps between 2008 and 2012 (see Chart 3). In ES, IT, IE, EE and LT, poverty rates and poverty thresholds have decreased or stagnated. However, the anchored poverty rates increased significantly in these countries, indicating a deterioration of households social situation. Nowcasting the at-risk of poverty to 2013 Currently available Eurostat statistics on poverty and social exclusion go up to 2012, i.e. covering 2011 income distribution. The lack of timely information 37 from income surveys has led to the development of alternative indicators, such as financial distress. 38 A micro-level approach, nowcasting, is also possible. This has the advantage of reflecting changes in different parts of the income distribution, shifts in tax-benefit policies and developments on the labour market. Nowcast exercises provide estimates of change in the distribution of income between households over the period for which EU-SILC data are not yet available, on the basis of changes in household income and employment, taking account of changes in tax-benefit policies. 39 On average, past 36 See Employment and social developments in Europe, Chapter Eurostat indicators on poverty and social exclusion based on 2014 EU-SILC survey (where income data will still refer to 2013) will be released in December See Data sources for the timely monitoring of the social situation in EU Member States DG EMPL Working Paper 2/2013 ( ), I. Engsted-Maquet and P. Minty. 39 Thanks to the more timely release of labour force data, it is possible to take advantage of employment transitions and changes from short- to long-term unemployment, as well as the tax-benefit policy changes included in the EUROMOD microsimulation model, to nowcast the risk of poverty up to
38 nowcast exercises have been 95 % accurate, 40 although accuracy has varied across Member States and over time. 41 Between 2011 and 2013, the at-risk of poverty is estimated to rise in a number of countries and further in Greece Results 42 up to 2013 are available for a subset of 13 Member States: DE, EE, EL, ES, FR, IT, LV, LT, AT, PL, PT, RO and FI (see Chart 4). The latest nowcast estimates that at-risk-of-poverty rates will increase further between 2011 and 2013 in EL (by 1.8 pp), RO (1.1 pp), LV (0.9 pps) and EE (0.7 pp), decrease slightly in PT (by 0.8 pps), FR (0.8 pps) and AT (0.6 pps), and stabilise in IT, ES, DE and LT. The estimated decrease in PT is explained by a considerable drop in the poverty threshold (by 5 % in ). The threshold is also expected to decrease in ES (by 2 %) and more dramatically in EL (by 20 %), which shows the worst combination of increasing relative poverty and falling median income. Anchored poverty (using a fixed 2009 poverty threshold) is expected to increase in in all of the 13 Member States in question, with the exception of the three Baltic countries and PL (drops of 2.2 % in EE and LT, 1.6 % in LV and 0.7 % in PL). The advantages of nowcasting where there are structural breaks in EU-SILC data Nowcast results based on microsimulations are not only useful to overcome the problem of the timeliness of data, but also where there is a break in the series of survey data. EU-SILC data were recently revised on the basis of 2011 censuses. As a result, Eurostat reports series breaks in the 2011 data for LV and 2012 data for LT. In AT, data were adjusted on the basis of administrative data, producing a structural break in 2012 EU-SILC data. For these three Member States, Eurostat statistics on monetary poverty cannot distinguish between actual change in the at-risk-of-poverty rate and the effect of the statistical break. Nowcast results are expected to be more reliable, as they are not based on revised survey data. For LT, for instance, nowcast estimates capture much better the effect of temporary cuts in social benefits since 2010, showing a rising trend in the at-risk-of-poverty rate, while Eurostat statistics show a falling trend. For AT, nowcast estimates show a decrease in the rate, while Eurostat statistics show an increase. For LV, the structural break in EU-SILC data does not significantly affect poverty figures Chart 3: Anchored poverty rates (2008 thresholds). Source: Eurostat, EU-SILC. 40 Average of the absolute deviation of calibrated nowcast estimates from Eurostat figures for the years in which both sets of data are available ( ), excluding the years in which there is a structural break in the data for some MS (2012 for LT and AT, 2011 for LV). 41 While for most Member States and years the level of accuracy is close to 100 %, some problems are reported for LT. This might be explained by large macro-economic shocks. In general, nowcast estimates tend to underestimate the rise in the atrisk-of-poverty rate in the Member States most affected by the crisis (by, on average, 5 % in EL, ES and IT) and in RO (by, on average 9 %) and to overestimate poverty figures for FR (by 4 %). 42 Results are extracted from Nowcasting: estimating developments in the risk of poverty and income distribution in 2012 and 2013, Social Situation Monitor, research note 1/

39 Chart 4 Nowcast estimates of the at risk of poverty rates Source: Euromod In 2012, severe material deprivation rose, while the share of people living in jobless households stabilized Between 2008 and 2010, following deterioration in the labour markets and the ensuing rise in unemployment, an upward trend in poverty and social exclusion was driven by the increasing share of individuals living in jobless households. In , when growth resumed in many Member States, the share of people living in jobless households tended to stabilise (down 0.1 pp in EU-27 between 2011 and 2012, reference years 2010 and 2011). Joblessness decreased in LV, LT, EE, but also in FI, SE, DE and FR (see Table 1). However, it continued to rise in EL, CY, IE, the UK, PT, ES, BG and HR. From 2010, as a consequence of sustained hardship, severe material deprivation started to increase significantly across Europe (down by 0.1 pp between 2008 and 2010, but up by 1.1 pp between 2010 and 2012), rising especially sharply in EL, CY, IE, IT, HU, MT, ES and the UK. Elderly people facing biggest changes in poverty The elderly are the age group that has experienced the biggest change in poverty rates (see Chart 5). The risk of poverty for older persons had declined in most Member States since 2008, and continued to fall between 2011 and 2012 in many (EL, CY, the UK, ES, BG, PT, BE, HR and DK). 39
40 The improvement in the relative situation for the elderly reflects the fact that pensions have remained to a large extent unchanged during the crisis, and have in some cases brought pensioners income above the poverty threshold; however, this is due to changes in total income distribution rather than their economic situation in real terms). Conversely, in the Baltic States, where increases in the poverty threshold were marked between 2011 and 2012 following the sharp drop between 2008 and 2010, the older age group faced an increased risk of poverty. Working-age adults have been strongly hit in EL, reflecting the deterioration in labour market conditions. As many working-age adults live in households with children, child poverty has also been impacted. In other Member States, poverty among working-age adults remained stable between 2011 and 2012 in a context of resuming growth. It decreased slightly in some Member States where the poverty threshold also fell, e.g. the NL, BE, the CZ and IE. Between 2011 and 2013, nowcast estimates that the biggest changes in poverty levels in most Member States will continue to affect the elderly. Among Member States where monetary poverty declines are estimated between 2011 and 2013 (FR, IT, AT, PT, FI and particularly ES), the elderly will probably be the group with the most significant decreases. However, in countries where the risk of poverty is expected to increase (EE, LT, RO) or remain stable (LV), the elderly are expected to experience a considerable increase in monetary poverty, particularly in EE and LV (+6 pps). Nowcast estimates that anchored poverty among the elderly will increase in LT and particularly in RO (+1.1 pps) and decrease in EE (following an increase of 7 pp between 2010 and 2012) and LV. The increase in anchored poverty in EE is explained by the slower growth of pensions when economic growth resumed. In EL, working-age adults are expected to be the group most exposed to poverty increases between 2011 and 2013 (+3.0 pps). Chart 5 Changes in risk of poverty by age group, Source: EU SILC, Eurostat; 2011 for IE 40
41 EU Employment and Social Situation Table 1 - Developments in main social and complementary indicators ( ) and nowcast estimates Risk of poverty or social exclusion 2012, % change (pp) At risk of poverty rate 2012, % change (pp) Poverty threshold change ( ) (%) Severe material deprivation 2012, % change (pp) Jobless households 2012, % change (pp) Anchored poverty rate (2008) EU , % change (pp) 2013*, % 2011*-13* change (pp) EU EL CY IE** IT AT LU RO UK HU MT PT BE ES SI EE BG DK Nowcasted at risk of poverty rate CZ HR SK FR DE PL SE LT NL FI LV Poverty threshold change (2011*-13*) (%) Source: EU SILC, Eurostat and Euromod (nowcast). Data for IE refer to the year before (no data for 2012) Poverty threshold changes measured using the Harmonized Consumer price index in national currency. * figures for Nowcast refer to the reference year March 2014 I 41
42 S3. Trends in social expenditure and the distributional impact of policy changes until 2013 The latest data available show that the stabilising impact of social protection expenditure remained very weak in 2013 despite a slight improvement In 2013, as the decline in labour market incomes slowed down, the stabilising impact of social benefits 43 improved slightly in comparison to However, the impact remained well below the effects observed at the onset of the crisis ( ), when social benefits were the main contributing factor to the stabilisation of household incomes in Europe 44 (see Chart 1). Chart 1 - Contributions of components to the growth of real gross disposable of households in the Euro area ( ) Source: ECB and Eurostat. Note: annual percentage change and percentage point contributions. Labour income includes compensation of employees and gross operating surplus and mixed income (compensation of self-employed). In 2013, while the economic environment remained weak 45, most Member States registered increases in cash expenditure and relatively stable in-kind expenditure 46. However, declines were very significant in some Member States (IE, EL, CY, LT, SI and UK), while cash benefits actually recorded real increases in most Member States (except IE, EL, CY, LT and AT). These diverse developments in 2013 translated into a relatively weak pattern of social expenditure growth in the EU and EA (see Chart 2). This slight increase in 2013 only partly compensates for the declines observed in Indeed, in 2012, despite a weaker economic environment 47, most Member States registered a decline in in-kind expenditure, and relatively stable cash expenditure. 43 Social protection expenditure generally helps to stabilise the economy in bad economic times, since social benefits partly compensate for the decline in households market income. Unemployment benefits typically have a stabilising function, as do means-tested benefits of various sorts (typically social exclusion, family or housing).health and pensions expenditure play a role too, but to a lesser extent, since they generally increase (or remain constant), while market incomes decline. 44 The stabilising role of social benefits is analysed in detail in the 2013 review Employment and Social Developments in Europe. 45 In 2013, GDP remained stable in the EU and declined by 0.4% on average in the EA (with positive developments in BE, BG, DE, DK, EE, IE, F, LV, LT, LU, HU, MT, AT, PL, RO, SK, SE and the UK). 46 For 2013, the annual growth rate of social expenditure reflects an estimate based on quarterly National Accounts. 47 In 2012, GDP declined by 0.4% on average in the EU and 0.7% in the EA (with positive developments in BG, DE, EE, IE, LV, LT, MT, AT, PL, RO, SK, SE and the UK). March 2014 I 42
43 Chart 2 Breakdown of the annual change in real public social expenditure between the contributions from in-cash and in-kind benefits ( ) in the EU-27 and EA-17 Source: Eurostat (NA and DG EMPL calculations). Note: the values for 2013 are generally an estimate based on national accounts. Note: When no data are available in the National Accounts (annual), the data were either based on National Accounts (quarterly) or the AMECO database (in the latter case by usually applying calculated growth rates to the data available from National Accounts (annual). In 2013, social protection expenditure grew much less than expected given poor economic conditions In this section, the evolution of social expenditure (deviation from trend) is analysed in relation to the output gap, and compared to developments in past recessions (See chart 3). 48 Based on past experience, social expenditure is expected to grow above the trend when the output gap declines and particularly when it is negative, and to adjust downwards and return to the trend when the output gap recovers. Compared to past recessions, the year of recession (N, 2009 in most countries) was much deeper in this crisis, and led to a strong increase in public social expenditure well above the trend. In past recessions, the output gap was generally narrower and the deviation from the trend of social expenditure was smaller. 49 During the following two years (N+1, 2010 in most countries and N+2, 2011 in most countries), the output gap improved and growth in social expenditure declined, which resulted in them approaching their trend levels, as one would expect from past recessions. However, three years into the crisis (2012 in most countries), social expenditure grew well below its trend and went on adjusting downwards despite a worsening of the output gap, contrary to what happened in past instances of declining and negative output gap. In 2013 (which corresponds to 4 years after the first recession year in most countries), growth in social protection expenditure remained below their trend, despite the further deterioration of the output gap (around -3 %), which resulted in a further weakening of their stabilisation impact. This partly reflects the exceptional scale of the fiscal consolidation needed during this crisis, which translated into a significant downward adjustment in the cyclical component of social protection expenditure, as well as a potential permanent adjustment of the trend of social protection expenditure. 48 For a detailed description of the method and analysis See 2013 review of Employment and Social Developments in Europe p This tends to suggest that the increase in social expenditure in the first year of this crisis was more sensitive to the economic cycle in this crisis, reflecting greater increases in unemployment levels and also greater increases in other types of expenditure (such as health and pensions expenditure due to the play of indexation mechanisms in a context of slowdown of inflation). 43
44 Chart 3: Deviation from the trend of public social expenditure and GDP output gap in current and past recessions EU27 and EA17 Source : Eurostat, National Accounts, DG EMPL calculations. Notes: 2013 data are estimated based on quarterly data from the first three quarters. In the current recession, N is year Estimates of the deviation from the trend in social protection expenditures are based on a standard Hodrick-Prescott filter. Reading notes : in the year of the recession, in the current crisis, social expenditure was about 5% above their trend in Europe, while the GDP was about 4% below its potential (output gap of -4%). Averages are unweighted country averages (since countries do not always experience a recession the same year). What drove the changes in social protection expenditure? Detailed information on the evolution of social expenditure by function is only available until In 2011, social protection expenditure declined in real terms, mainly driven by the reduction in expenditure on unemployment benefits and sickness and disability. This decline followed on from the significant growth observed in 2008 and 2009, and the very modest increase of The increase in unemployment expenditure mainly reflected increases in the number of unemployed persons (see Chart 4), while the contribution of pensions and health expenditure reflected the automatic impact of indexation mechanisms in a context of inflation slow-down. Chart 4: Annual real growth of social expenditure in the EU-27 ( ) and the contribution of different functions 7% 6% 5% 4% 3% 2% 1% 0% -1% -2% social exclusion and housing unemployment benefits family sickness and disability Source: Eurostat (ESSPROS) and DG EMPL calculations. Note: For the EU-27, actually refers to the EU-25 since data for all of theeu-27 were not available; refers to the average annual growth rate. In 2011, average expenditure per unemployed 50 decreased further compared to 2010 contributing to a real decline in real unemployment expenditure (Chart 5). This may reflect a number of factors, such as erosion of the eligibility of unemployed people, an increase in the share of long-term unemployed people among the unemployed, as well as the impact of indexation rules in the specific sequence of inflation during this crisis or tightening of benefit 50 Development in unemployment expenditure can be broken down into the effects of changes in the numbers of unemployed (the total number of potential beneficiaries) and changes in average expenditure per potential beneficiary. 44
45 calculation rules in some countries. The impact of these factors differs depending on the countriy, as illustrated in the section below. Chart 5: Contributions to the annual change in real unemployment expenditure ( ) EU- 27 and EA-17 Source: Eurostat (ESSPROS). Note: This graph shows the annual change in real expenditure on unemployment benefits (in %) and the main factors that influence it: the average expenditure per unemployed and the number of short-term (ST) and long-term (LT, i.e. for more than one year) unemployed. The contributions of these factors is expressed in percentage points. Distributional impact of tax-benefit changes since 2008 Until detailed data become available, it is difficult to evaluate the impact of changes in the taxbenefit system on inequality. Even then, 51 it will be difficult to distinguish the direct effect of the crisis from that of policy changes. 52 This section illustrates the impact of changes in the tax benefit system in 12 Member States, including some where household incomes were particularly affected during the crisis. This assessment takes into account changes in taxes (direct income taxes and social contributions, as well as VAT changes) and in cash benefits (pensions and other benefits). It does not take account of other measures that may have had an indirect impact on the distribution of households income, such as those affecting employers or cuts in public services. 53 Updated results from the EUROMOD micro-simulation model illustrate the impact of measures enacted over the period on households incomes in 12 countries. 54 It should be noted that to assess the impact of overall changes over the period, a counterfactual needs to be chosen, specifically on the implicit indexation of benefit levels and calculation rules over the period and that price indexation (CPI counterfactual) is used in the results presented below. 51 The most recent data available reflect the income situation in 2011, while nowcast estimates of poverty trends up to 2013 are available for a number of Member States. 52 A recent IMF study analysed past fiscal consolidation episodes (in a number of OECD countries over the period ) and found that a 1 percentage point of GDP consolidation is associated with an increase of about 0.6 % in inequality of disposable income (as measured by the Gini coefficient) in the following year. It also suggests that the cumulative impact peaks after five to six years and fades after the tenth year. IMF (2012), Fiscal monitor, Taking Stock: A Progress Report on Fiscal Adjustment, October Furthermore, some measures may have already expired during the period considered (from 2008 until mid-2012), while some countries may have planned further adjustments after mid De Agostini P., Paulus A., Sutherland H. and Tasseva I. (2014), "The effect of tax-benefit changes on income distribution in EU countries since the beginning of the economic crisis", Research note 02/2013, Social Situation Monitor, forthcoming. 45
46 Size of overall impact on household incomes differ EUROMOD results focus on the impact of measures implemented after the 2008 economic downturn and up to mid The impact of these measures on household incomes was particularly strong in Ireland, Greece, Portugal, Spain and Lithuania. It was less pronounced in Estonia, Italy, France, Latvia and the UK and was positive in Germany and Romania. The composition of measures taken into account varies significantly across Member States (Chart 6), with large contributions from cuts in pensions, increases in income taxes or social contributions and reduced benefits. Cuts in public pensions were particularly important in Greece. Cuts in non-means-tested benefits were relatively large in Ireland and Lithuania, while there were also cuts in means-tested benefits in Ireland, Portugal, the UK and Germany. Increases in income tax were important in Ireland, Greece, Portugal and Spain, and in terms of the share of the total, also in Estonia, Italy and France. Increases in social contributions were significant in Ireland, Lithuania and Latvia. Chart 6: Aggregate effects of policy changes on household disposable income ( ) Note: counterfactual on CPI (prices). Source: De Agostini and al (2014). and can have different impacts on the distribution of household incomes In France, Greece, Latvia, Portugal and Romania, the better-off lose a higher proportion of their income than the poor, as a result of the measures modelled over (Chart 7). In Spain and the UK, the burden of fiscal consolidation falls slightly more heavily on the poor and/or the rich than it does on those on middle incomes, producing an inverted U-shaped pattern. Italy and Ireland show more mildly progressive and nearly proportional changes in incomes over the income distribution. While the effect of consolidation measures can be labelled progressive, a proportional income drop can actually affect the living standards of those already in lower income brackets more severely. At the other extreme, in Estonia, Germany and Lithuania, measures over the period period have had a clearly regressive impact. 46
47 Chart 7: Percentage change in household disposable income due to policy changes by household income decile group Notes: Deciles are based on equivalised household disposable income in 2013 with 2008 policies in place, indexed by the CPI counterfactual index and are constructed. Measures include changes in benefits and taxes and social contributions and changes in VAT. Changes in VAT are also included though they do not impact directly on incomes, but they do indirectly through changes in price levels. The charts are drawn to different scales, but the interval between gridlines on each of them is the same. Source: De Agostini and al (2014). As a consequence, it appears that the overall distributional impact of measures over the period period is not related to the overall size of the average impact on household incomes. In other words, more regressive and progressive patterns are observed both in countries with more or less significant overall impact on household incomes, which highlights the central importance of the design of measures as regards their distributional impact. and the same types of tools can have different distributional impacts depending on their design The overall progressive impact on household incomes shown for Greece, France, Latvia, Portugal and Romania reflects different types of effects, such as changes in the design of nonmeans-tested benefits, of public pensions and of taxes (Chart 8). The regressive pattern observed in Estonia mainly reflects changes introduced in the indexation of pension benefits, the one observed in Lithuania mainly reflects changes in VAT and the one observed in Germany mainly changes in taxes and non-pension benefits. Changes in the design of non-pension benefits were progressive in Greece, Latvia, France and Romania, while they were regressive in Ireland, Germany, Portugal (resulting from the freeze of means-tested benefits) and Romania. 47

48 Chart 8: Contribution by type of measure to the change in household disposable income due to policy changes by household income decile group. Notes: Deciles are based on equivalised household disposable income in 2013 with 2008 policies in place, indexed by CPI counterfactual index and are constructed. The charts are drawn to different scales, but the interval between gridlines on each of them is the same. Source: De Agostini and al (2014). The design of changes to public pensions was progressive in Greece and, to a lesser extent, in Portugal (where downward changes have been limited for lower levels of pensions) and Italy, and regressive in Estonia and to a lesser extent in Latvia (reflecting changes in the indexation of benefits). Changes in SICs (social insurance contributions) and income taxes were generally progressive, while they were merely proportional in Estonia, Greece and Italy, and were regressive in Germany and Portugal. Increases in VAT generally had proportional or regressive effects. Changes in the main VAT rate were null in Germany and France and ranged from 2 pps (Estonia, Ireland, Italy and Portugal) to 5 pps (Spain and Romania). The differences across countries are linked to differences in the structure of VAT, consumption patterns and savings rates (which generally increases along the income distribution), as well as differences in increases in the standard rate of VAT. In several countries (such as Spain, Italy, Lithuania, Romania and the UK), the extent of the effect on household incomes is similar to the total of other tax and benefit measures. The burden of fiscal consolidation can also be shared differently across different types of households. The effects across countries are generally similar for children and older people, with a few exceptions. Households with children are more affected in Estonia and Lithuania and less so in Germany, while households with older people have been more affected in Ireland, Italy, Greece, Spain and Lithuania. This partly reflects changes in tax and benefits, particularly for 48
49 children or elderly people, such as changes in child tax credits or pensions (but also the composition of households across the income distributions). Policy changes introduced in were progressive or neutral in seven out of nine countries, but had a clearly negative impact on low income households in Spain and the UK These results also help to shed some light on changes introduced between mid-2012 and mid- 2013, and in particular those implemented since the analysis for presented in Avram et al. (2012). 55 Chart 9 contrasts them directly for the nine countries included in both studies. 56 In Greece and Portugal the effect of additional policy changes in was to reduce incomes, across all or most of the income distribution. In Estonia, Italy, Latvia, Lithuania and Romania the overall impact on household incomes was positive (except in Italy for the highest decile), with those at the bottom of the distribution benefiting most in proportional terms from the changes in the most recent year. In the UK and Spain households in the bottom of the distribution have seen reductions in their income due to policy changes in Chart 9 - Percentage change in household disposable income due to policy changes (by household income decile group) Notes: Deciles or quintiles are based on equivalised household disposable income in 2013 and 2012 respectively with 2008 policies in place, indexed by change in prices (CPI). The charts are drawn to different scales, but the interval between gridlines on each of them is the same. Source: De Agostini and al (2014). Conclusion Social protection spending played a prominent role in compensating households income losses in the early phase of the crisis and helped stabilise the economy. Its impact declined since mid- 2010, was negligible in 2012 and slightly resumed in This reduction in social spending was stronger than in past recessions, partly reflecting the exceptional need for fiscal consolidation in the context of the Euro crisis. It neutralised the economic stabilisation function of social protection systems in many Member States. 55 Avram and al (2012) (Avram, S., F. Figari, C. Leventi, H. Levy, J. Navicke, M. Matsaganis, E. Militaru, A. Paulus, O. Rastrigina, and Sutherland H., (2012), "The distributional effects of fiscal consolidation in nine EU countries", Research Note 1/2012 of the social Situation Observatory) compared 2012 policies with those from 2008, indexed by CPI by measuring the percentage change in household disposable income (by income decile) and are there therefore broadly comparable with the CPI indexed comparison of 2008 with 2013 from De Agostini and al (2014). 56 It should be noted that these two sets of results are based on different micro-data. The results use 2010 SILC and the results use 2008 SILC. 49
50 Changes to the tax and benefits systems over the period have sometimes led to significant reductions in the level of real household incomes, potentially putting a heavy strain on the living standards of low income households. The impact of spending cuts and tax hikes was different on high and low income households. The analysis shows that careful design of the measures is crucial to avoid the poorest being disproportionately affected, as has been the case in a few countries. 50

51 Q1 Q2 Q3 Q4 Q1 Q2 Q3 Q4 Q1 Q2 Q3 Q4 Q1 Q2 Q3 Q4 Q1 Q2 Q3 Q4 Q1 Q2 Q3 Q4 Q1 Q2 Q3 Q4 Q1 Q2 Q3 Q4 Q1 Q2 Q3 % change on previous year EU Employment and Social Situation Annex 1: Real GDP growth, real GDHI growth and its main components for selected Member States Source: Eurostat, National Accounts. Data non-seasonally adjusted. 8 6 DE Compensation of employees Compensestion of self-employed Net property income Net social benefits Net other current transfers Taxes on income, wealth (negative) GDP growth Real GDHI 51

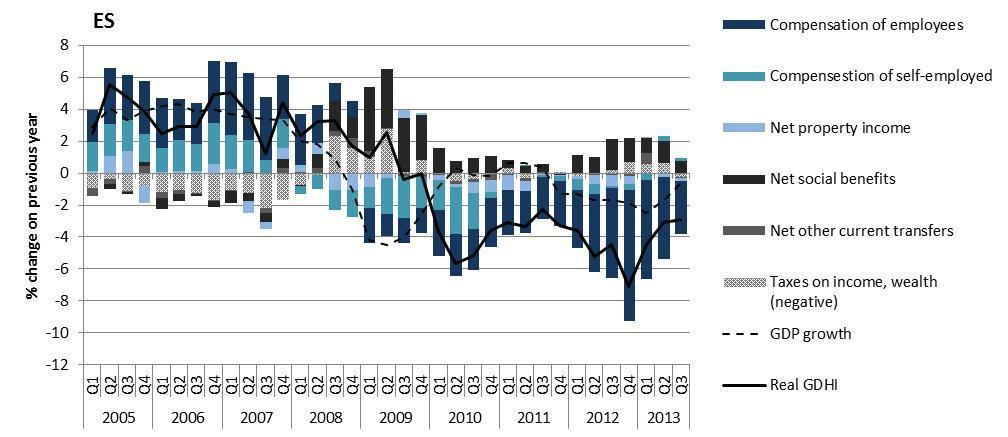
52 52
Employment and Social Developments in Europe
 Employment and Social Developments in Europe Quarterly Review February 2018 Social Europe February 2018 With regularly updated data and charts downloadable here February 2018 I 1 The Employment and Social
September With regularly updated data and charts downloadable here. Social Europe EU Employment and Social Situation I Quarterly Review
 September 2015 With regularly updated data and charts downloadable here September 2015 I 1 This Quarterly Review provides in-depth analysis of recent labour market and social developments. It is prepared
Employment and Social Developments in Europe
 Employment and Social Developments in Europe Quarterly Review December 218 Social Europe December 218 With regularly updated data and charts downloadable here December 218 I 1 The Employment and Social
September With regularly updated data and charts downloadable here. September 2014 I 1. Social Europe I Quarterly Review
 With supplements on: - Human capital availability across the EU skills perspective - Towards a better measurement of welfare and inequalities With regularly updated data and charts downloadable here September
January 2010 Euro area unemployment rate at 9.9% EU27 at 9.5%
 STAT//29 1 March 20 January 20 Euro area unemployment rate at 9.9% EU27 at 9.5% The euro area 1 (EA16) seasonally-adjusted 2 unemployment rate 3 was 9.9% in January 20, the same as in December 2009 4.
Special Eurobarometer 418 SOCIAL CLIMATE REPORT
 Special Eurobarometer 418 SOCIAL CLIMATE REPORT Fieldwork: June 2014 Publication: November 2014 This survey has been requested by the European Commission, Directorate-General for Employment, Social Affairs
October 2010 Euro area unemployment rate at 10.1% EU27 at 9.6%
 STAT//180 30 November 20 October 20 Euro area unemployment rate at.1% EU27 at 9.6% The euro area 1 (EA16) seasonally-adjusted 2 unemployment rate 3 was.1% in October 20, compared with.0% in September 4.
Themes Income and wages in Europe Wages, productivity and the wage share Working poverty and minimum wage The gender pay gap
 5. W A G E D E V E L O P M E N T S At the ETUC Congress in Seville in 27, wage developments in Europe were among the most debated issues. One of the key problems highlighted in this respect was the need
THE EU S ECONOMIC RECOVERY PICKS UP MOMENTUM
 THE EU S ECONOMIC RECOVERY PICKS UP MOMENTUM ECONOMIC SITUATION The EU economy saw a pick-up in growth momentum at the beginning of this year, boosted by strong business and consumer confidence. Output
COUNCIL OF THE EUROPEAN UNION. Brussels, 13 June /1/13 REV 1 SOC 409 ECOFIN 444 EDUC 190
 COUNCIL OF THE EUROPEAN UNION Brussels, 13 June 2013 10373/1/13 REV 1 SOC 409 ECOFIN 444 EDUC 190 COVER NOTE from: to: Subject: The Employment Committee Permanent Representatives Committee (Part I) / Council
Taxation trends in the European Union EU27 tax ratio at 39.8% of GDP in 2007 Steady decline in top personal and corporate income tax rates since 2000
 DG TAXUD STAT/09/92 22 June 2009 Taxation trends in the European Union EU27 tax ratio at 39.8% of GDP in 2007 Steady decline in top personal and corporate income tax rates since 2000 The overall tax-to-gdp
COVER NOTE The Employment Committee Permanent Representatives Committee (Part I) / Council EPSCO Employment Performance Monitor - Endorsement
 / Council EPSCO Employment Performance Monitor - Endorsement") COUNCIL OF THE EUROPEAN UNION Brussels, 15 June 2011 10666/1/11 REV 1 SOC 442 ECOFIN 288 EDUC 107 COVER NOTE from: to: Subject: The Employment Committee Permanent Representatives Committee (Part I) / Council
COUNCIL OF THE EUROPEAN UNION Brussels, 15 June 2011 10666/1/11 REV 1 SOC 442 ECOFIN 288 EDUC 107 COVER NOTE from: to: Subject: The Employment Committee Permanent Representatives Committee (Part I) / Council
Flash Eurobarometer 398 WORKING CONDITIONS REPORT
 Flash Eurobarometer WORKING CONDITIONS REPORT Fieldwork: April 2014 Publication: April 2014 This survey has been requested by the European Commission, Directorate-General for Employment, Social Affairs
OVERVIEW. The EU recovery is firming. Table 1: Overview - the winter 2014 forecast Real GDP. Unemployment rate. Inflation. Winter 2014 Winter 2014
 OVERVIEW The EU recovery is firming Europe's economic recovery, which began in the second quarter of 2013, is expected to continue spreading across countries and gaining strength while at the same time
The European economy since the start of the millennium
 The European economy since the start of the millennium A STATISTICAL PORTRAIT 2018 edition 1 Since the start of the millennium, the European economy has evolved and statistics can help to better perceive
Social Protection and Social Inclusion in Europe Key facts and figures
 MEMO/08/625 Brussels, 16 October 2008 Social Protection and Social Inclusion in Europe Key facts and figures What is the report and what are the main highlights? The European Commission today published
Supplement March Trends in poverty and social exclusion between 2012 and March 2014 I 1
 Supplement March 2014 Trends in poverty and social exclusion between 2012 and 2013 March 2014 I 1 This supplement to the Quarterly Review provides in-depth analysis of recent labour market and social developments.
ILO World of Work Report 2013: EU Snapshot
 Greece Spain Ireland Poland Belgium Portugal Eurozone France Slovenia EU-27 Cyprus Denmark Netherlands Italy Bulgaria Slovakia Romania Lithuania Latvia Czech Republic Estonia Finland United Kingdom Sweden
in focus Statistics Contents Labour Mar k et Lat est Tr ends 1st quar t er 2006 dat a Em ploym ent r at e in t he EU: t r end st ill up
 Labour Mar k et Lat est Tr ends 1st quar t er 2006 dat a Em ploym ent r at e in t he EU: t r end st ill up Statistics in focus This publication belongs to a quarterly series presenting the European Union
The Trend Reversal of the Private Credit Market in the EU
 The Trend Reversal of the Private Credit Market in the EU Key Findings of the ECRI Statistical Package 2016 Roberto Musmeci*, September 2016 The ECRI Statistical Package 2016, Lending to Households and
European Commission. Statistical Annex of Alert Mechanism Report 2017
 European Commission Statistical Annex of Alert Mechanism Report 2017 COMMISSION STAFF WORKING DOCUMENT STATISTICAL ANNEX Accompanying the document REPORT FROM THE COMMISSION TO THE EUROPEAN PARLIAMENT,
Overview of EU public finances
 6 volume 17, 12/29B I Overview of EU public finances PRE-CRISIS DEVELOPMENTS Public finance developments in the EU up to 28 can be divided into three stages: In 1997, the Stability and Growth Pact entered
Growth, competitiveness and jobs: priorities for the European Semester 2013 Presentation of J.M. Barroso,
 Growth, competitiveness and jobs: priorities for the European Semester 213 Presentation of J.M. Barroso, President of the European Commission, to the European Council of 14-1 March 213 Economic recovery
Macroeconomic Policies in Europe: Quo Vadis A Comment
 Macroeconomic Policies in Europe: Quo Vadis A Comment February 12, 2016 Helene Schuberth Outline Staff Projection of the Euro Area Monetary Policy Investment Rebalancing in the euro area Fiscal Policy
SURVEY ON THE ACCESS TO FINANCE OF SMALL AND MEDIUM-SIZED ENTERPRISES IN THE EURO AREA APRIL TO SEPTEMBER 2012
 SURVEY ON THE ACCESS TO FINANCE OF SMALL AND MEDIUM-SIZED ENTERPRISES IN THE EURO AREA APRIL TO SEPTEMBER 2012 NOVEMBER 2012 European Central Bank, 2012 Address Kaiserstrasse 29, 60311 Frankfurt am Main,
Flash Eurobarometer 408 EUROPEAN YOUTH REPORT
 Flash Eurobarometer EUROPEAN YOUTH REPORT Fieldwork: December 2014 Publication: April 2015 This survey has been requested by the European Commission, Directorate-General for Education and Culture and co-ordinated
Short Analytical Web Note 2/2016
 Short Analytical Web Note 2/2016 Analysis of the Youth Guarantee in EU Member States This note provides an analytical overview of the labour market outcomes of young people in the EU Member States following
Contents. Main statistical findings. From Statistics Explained
 1 of 10 1/14/2014 3:37 AM From Statistics Explained Data up to November 2013. Most recent data: Further Eurostat information, Main tables and Database. Unemployment levels and rates move in a cyclical
DG TAXUD. STAT/11/100 1 July 2011
 DG TAXUD STAT/11/100 1 July 2011 Taxation trends in the European Union Recession drove EU27 overall tax revenue down to 38.4% of GDP in 2009 Half of the Member States hiked the standard rate of VAT since
Council of the European Union Brussels, 25 July 2017 (OR. en)
") Council of the European Union Brussels, 25 July 217 (OR. en) 1151/17 ADD 1 COVER NOTE From: date of receipt: 17 July 217 To: SOC 543 EMPL 414 ECOFIN 667 EDUC 318 JEUN 95 FISC 17 Secretary-General of the
Council of the European Union Brussels, 25 July 217 (OR. en) 1151/17 ADD 1 COVER NOTE From: date of receipt: 17 July 217 To: SOC 543 EMPL 414 ECOFIN 667 EDUC 318 JEUN 95 FISC 17 Secretary-General of the
Eurozone. EY Eurozone Forecast March 2015
 Eurozone EY Eurozone Forecast March 2015 Austria Belgium Cyprus Estonia Finland France Germany Greece Ireland Italy Latvia Lithuania Luxembourg Malta Netherlands Slovakia Slovenia Spain Outlook for Modest
Securing sustainable and adequate social protection in the EU
 Securing sustainable and adequate social protection in the EU Session on Social Protection & Security IFA 12th Global Conference on Ageing 11 June 2014, HICC Hyderabad India Dr Lieve Fransen European Commission
PROGRESS TOWARDS THE LISBON OBJECTIVES 2010 IN EDUCATION AND TRAINING
 PROGRESS TOWARDS THE LISBON OBJECTIVES IN EDUCATION AND TRAINING In 7, reaching the benchmarks for continues to pose a serious challenge for education and training systems in Europe, except for the goal
74 ECB THE 2012 MACROECONOMIC IMBALANCE PROCEDURE
 Box 7 THE 2012 MACROECONOMIC IMBALANCE PROCEDURE This year s European Semester (i.e. the framework for EU policy coordination introduced in 2011) includes, for the first time, the implementation of the
PROGRESS TOWARDS THE LISBON OBJECTIVES 2010 IN EDUCATION AND TRAINING
 PROGRESS TOWARDS THE LISBON OBJECTIVES IN EDUCATION AND TRAINING In, reaching the benchmarks for continues to pose a serious challenge for education and training systems in Europe, except for the goal
Consumer credit market in Europe 2013 overview
 Consumer credit market in Europe 2013 overview Crédit Agricole Consumer Finance published its annual survey of the consumer credit market in 28 European Union countries for seven years running. 9 July
Employment of older workers Research Note no. 5/2015
 Research Note no. 5/2015 E. Őzdemir, T. Ward M. Fuchs, S. Ilinca, O. Lelkes, R. Rodrigues, E. Zolyomi February - 2016 EUROPEAN COMMISSION Directorate-General for Employment, Social Affairs and Inclusion
The EU Craft and SME Barometer 2018/H2
 The EU Craft and SME Barometer 2018/H2 SMEs show stability at high level; SME Climate Index stabilises at 81.7 Internal demand fosters SMEs growth, yet no further acceleration is expected The UEAPME SME
Quarterly Financial Accounts Household net worth reaches new peak in Q Irish Household Net Worth
 Quarterly Financial Accounts Q4 2017 4 May 2018 Quarterly Financial Accounts Household net worth reaches new peak in Q4 2017 Household net worth rose by 2.1 per cent in Q4 2017. It now exceeds its pre-crisis
May 2009 Euro area external trade surplus 1.9 bn euro 6.8 bn euro deficit for EU27
 STAT/09/106 17 July 2009 May 2009 Euro area external trade surplus 1.9 6.8 deficit for EU27 The first estimate for the euro area 1 (EA16) trade balance with the rest of the world in May 2009 gave a 1.9
Investment in France and the EU
 Investment in and the EU Natacha Valla March 2017 22/02/2017 1 Change relative to 2008Q1 % of GDP Slow recovery of investment, and with strong heterogeneity Overall Europe s recovery in investment is slow,
EUROPA - Press Releases - Taxation trends in the European Union EU27 tax...of GDP in 2008 Steady decline in top corporate income tax rate since 2000
 DG TAXUD STAT/10/95 28 June 2010 Taxation trends in the European Union EU27 tax ratio fell to 39.3% of GDP in 2008 Steady decline in top corporate income tax rate since 2000 The overall tax-to-gdp ratio1
Eurozone. Economic Watch FEBRUARY 2017
 Eurozone Economic Watch FEBRUARY 2017 EUROZONE WATCH FEBRUARY 2017 Eurozone: A slight upward revision to our GDP growth projections The recovery proceeded at a steady and solid pace in, resulting in an
Supplement September Towards a better measurement of welfare and inequalities. September 2014 I 1
 Supplement September 214 Towards a better measurement of welfare and inequalities September 214 I 1 Social Europe This supplement to the Quarterly Review provides in-depth analysis of recent labour market
Austria s economy set to grow by close to 3% in 2018
 Austria s economy set to grow by close to 3% in 218 Gerhard Fenz, Friedrich Fritzer, Fabio Rumler, Martin Schneider 1 Economic growth in Austria peaked at the end of 217. The first half of 218 saw a gradual
Working Poor in Europe
 Working Poor in Europe Georg Fischer Director for Analysis, Evaluation, External Relations DG Employment, social affairs and inclusion 29.7.2013 Clarification of definitions and terms Overall social trends
January 2009 Euro area external trade deficit 10.5 bn euro 26.3 bn euro deficit for EU27
 STAT/09/40 23 March 2009 January 2009 Euro area external trade deficit 10.5 26.3 deficit for EU27 The first estimate for the euro area 1 (EA16) trade balance with the rest of the world in January 2009
Taxation trends in the European Union Further increase in VAT rates in 2012 Corporate and top personal income tax rates inch up after long decline
 STAT/12/77 21 May 2012 Taxation trends in the European Union Further increase in VAT rates in 2012 Corporate and top personal income tax rates inch up after long decline The average standard VAT rate 1
August 2008 Euro area external trade deficit 9.3 bn euro 27.2 bn euro deficit for EU27
 STAT/08/143 17 October 2008 August 2008 Euro area external trade deficit 9.3 27.2 deficit for EU27 The first estimate for the euro area 1 (EA15) trade balance with the rest of the world in August 2008
Macroeconomic overview SEE and Macedonia
 Macroeconomic overview SEE and Macedonia Zoltan Arokszallasi Chief Analyst, Macro & FX/FI Research Erste Group Bank Erste Investors Breakfast, 29 September, Skopje 02. Oktober SEE shows mixed performance
LESS DYNAMIC GROWTH AMID HIGH UNCERTAINTY
 OVERVIEW: The European economy has moved into lower gear amid still robust domestic fundamentals. GDP growth is set to continue at a slower pace. LESS DYNAMIC GROWTH AMID HIGH UNCERTAINTY Interrelated
61/2015 STATISTICAL REFLECTIONS
 Labour market trends, Quarters 1 3 25 61/25 STATISTICAL REFLECTIONS 18 December 25 Content 1. Employment outlook...1 1.1 Employed people...1 1.2 Job vacancies...3 1.3 Unemployed and inactive people, labour
STAT/14/ October 2014
 STAT/14/158-21 October 2014 Provision of deficit and debt data for 2013 - second notification Euro area and EU28 government deficit at 2.9% and 3.2% of GDP respectively Government debt at 90.9% and 85.4%
Flash Eurobarometer 470. Report. Work-life balance
 Work-life balance Survey requested by the European Commission, Directorate-General for Justice and Consumers and co-ordinated by the Directorate-General for Communication This document does not represent
PUBLIC PERCEPTIONS OF VAT
 Special Eurobarometer 424 PUBLIC PERCEPTIONS OF VAT REPORT Fieldwork: October 2014 Publication: March 2015 This survey has been requested by the European Commission, Directorate-General for Taxations and
Scenario for the European Insurance and Occupational Pensions Authority s EU-wide insurance stress test in 2016
 17 March 2016 ECB-PUBLIC Scenario for the European Insurance and Occupational Pensions Authority s EU-wide insurance stress test in 2016 Introduction In accordance with its mandate, the European Insurance
Consumer Credit. Introduction. June, the 6th (2013)
") Consumer Credit in Europe at end-2012 Introduction Crédit Agricole Consumer Finance has published its annual survey of the consumer credit market in 27 European Union countries (EU-27) for the sixth year
Consumer Credit in Europe at end-2012 Introduction Crédit Agricole Consumer Finance has published its annual survey of the consumer credit market in 27 European Union countries (EU-27) for the sixth year
THE ECONOMY AND THE BANKING SECTOR IN BULGARIA
 THE ECONOMY AND THE BANKING SECTOR IN BULGARIA THIRD QUARTER OF 2018 SOFIA HIGHLIGHTS The Bulgarian economy recorded growth of 3,2% on an annual basis in Q2 2018, driven by the private consumption and
Flash Eurobarometer 458. Report. The euro area
 The euro area Survey requested by the European Commission, Directorate-General for Economic and Financial Affairs and co-ordinated by the Directorate-General for Communication This document does not represent
THE PROCESS OF ECONOMIC CONVERGENCE IN MALTA
 THE PROCESS OF ECONOMIC CONVERGENCE IN MALTA Article published in the Quarterly Review 2017:3, pp. 29-36 BOX 2: THE PROCESS OF ECONOMIC CONVERGENCE IN MALTA 1 Convergence, both economically and institutionally,
EUROSTAT SUPPLEMENTARY TABLE FOR REPORTING GOVERNMENT INTERVENTIONS TO SUPPORT FINANCIAL INSTITUTIONS
 EUROPEAN COMMISSION EUROSTAT Directorate D: Government Finance Statistics (GFS) and Quality Unit D1: Excessive deficit procedure and methodology Unit D2: Excessive deficit procedure (EDP) 1 Unit D3: Excessive
52 ECB. The 2015 Ageing Report: how costly will ageing in Europe be?
 Box 7 The 5 Ageing Report: how costly will ageing in Europe be? Europe is facing a demographic challenge. The old age dependency ratio, i.e. the share of people aged 65 or over relative to the working
Gender pension gap economic perspective
 Gender pension gap economic perspective Agnieszka Chłoń-Domińczak Institute of Statistics and Demography SGH Part of this research was supported by European Commission 7th Framework Programme project "Employment
Flash Eurobarometer 441. Report. European SMEs and the Circular Economy
 European SMEs and the Circular Economy Survey requested by the European Commission, Directorate-General Environment and co-ordinated by the Directorate-General for Communication This document does not
Issues Paper. 29 February 2012
 29 February 212 Issues Paper In the context of the European semester, the March European Council gives, on the basis of the Commission's Annual Growth Survey, guidance to Member States for the Stability
Austria s economy will grow by 2¾% in 2017
 Gerhard Fenz, Friedrich Fritzer, Martin Schneider 1 In the first half of 217, Austria s economy gathered further momentum. With growth rates by.8% in both the first and the second quarters, Austria recorded
SEE macroeconomic outlook Recovery gains traction, fiscal discipline improving. Alen Kovac, Chief Economist EBC May 2016 Ljubljana
 SEE macroeconomic outlook Recovery gains traction, fiscal discipline improving Alen Kovac, Chief Economist EBC May 216 Ljubljana Real economy highlights Recent GDP track record reveals more favorable footprint
4 Distribution of Income, Earnings and Wealth
 NERI Quarterly Economic Facts Autumn 2014 4 Distribution of Income, Earnings and Wealth Indicator 4.1 Indicator 4.2a Indicator 4.2b Indicator 4.3a Indicator 4.3b Indicator 4.4 Indicator 4.5a Indicator
Investment in Germany and the EU
 Investment in Germany and the EU Pedro de Lima Head of the Economics Studies Division Economics Department Berlin 19/12/2016 11/01/2017 1 Slow recovery of investment, with strong heterogeneity Overall
December 2010 Euro area annual inflation up to 2.2% EU up to 2.6%
 STAT/11/9 14 January 2011 December 2010 Euro area annual inflation up to 2.2% EU up to 2.6% Euro area 1 annual inflation was 2.2% in December 2010 2, up from 1.9% in November. A year earlier the rate was
SHORT-TERM EMPLOYMENT AND LABOUR MARKET OUTLOOK AND KEY CHALLENGES IN G20 COUNTRIES. A statistical update by ILO and OECD 1
 SHORT-TERM EMPLOYMENT AND LABOUR MARKET OUTLOOK AND KEY CHALLENGES IN G2 COUNTRIES Introduction A statistical update by ILO and OECD 1 The objective of this note is two-fold: i) to review the most recent
Transition from Work to Retirement in EU25
 EUROPEAN CENTRE EUROPÄISCHES ZENTRUM CENTRE EUROPÉEN 1 Asghar Zaidi is Director Research at the European Centre for Social Welfare Policy and Research, Vienna; Michael Fuchs is Researcher at the European
Fiscal sustainability challenges in Romania
 Preliminary Draft For discussion only Fiscal sustainability challenges in Romania Bucharest, May 10, 2011 Ionut Dumitru Anca Paliu Agenda 1. Main fiscal sustainability challenges 2. Tax collection issues
Traffic Safety Basic Facts Main Figures. Traffic Safety Basic Facts Traffic Safety. Motorways Basic Facts 2015.
 Traffic Safety Basic Facts 2013 - Main Figures Traffic Safety Basic Facts 2015 Traffic Safety Motorways Basic Facts 2015 Motorways General Almost 30.000 people were killed in road accidents on motorways
Eurofound in-house paper: Part-time work in Europe Companies and workers perspective
 Eurofound in-house paper: Part-time work in Europe Companies and workers perspective Presented by: Eszter Sandor Research Officer, Surveys and Trends 26/03/2010 1 Objectives Examine the patterns of part-time
The EFTA Statistical Office: EEA - the figures and their use
 The EFTA Statistical Office: EEA - the figures and their use EEA Seminar Brussels, 13 September 2012 1 Statistics Comparable, impartial and reliable statistical data are a prerequisite for a democratic
Pan-European opinion poll on occupational safety and health
 REPORT Pan-European opinion poll on occupational safety and health Results across 36 European countries Final report Conducted by Ipsos MORI Social Research Institute at the request of the European Agency
The intergenerational divide in Europe. Guntram Wolff
 The intergenerational divide in Europe Guntram Wolff Outline An overview of key inequality developments The key drivers of intergenerational inequality Macroeconomic policy Orientation and composition
The Northern Ireland labour market is characterised by relatively. population of working age are not active in the labour market at
 INTRODUCTION The Northern Ireland labour market is characterised by relatively high levels of economic inactivity. Around 28 per cent of the population of working age are not active in the labour market
Traffic Safety Basic Facts Main Figures. Traffic Safety Basic Facts Traffic Safety. Motorways Basic Facts 2017.
 Traffic Safety Basic Facts 2013 - Main Figures Traffic Safety Basic Facts 2015 Traffic Safety Motorways Basic Facts 2017 Motorways General More than 24.000 people were killed in road accidents on motorways
May 2012 Euro area international trade in goods surplus of 6.9 bn euro 3.8 bn euro deficit for EU27
 108/2012-16 July 2012 May 2012 Euro area international trade in goods surplus of 6.9 3.8 deficit for EU27 The first estimate for the euro area 1 (EA17) trade in goods balance with the rest of the world
In 2009 a 6.5 % rise in per capita social protection expenditure matched a 6.1 % drop in EU-27 GDP
 Population and social conditions Authors: Giuseppe MOSSUTI, Gemma ASERO Statistics in focus 14/2012 In 2009 a 6.5 % rise in per capita social protection expenditure matched a 6.1 % drop in EU-27 GDP Expenditure
National accounts and GDP
 National accounts and GDP Statistics Explained Data extracted in July 2018. Planned article update: July 2019. National accounts are the source for a multitude of well-known economic indicators which are
Continued slow employment response in 2004 to the pick-up in economic activity in Europe.
 Executive Summary - Employment in Europe report 2005 Continued slow employment response in 2004 to the pick-up in economic activity in Europe. Despite the pick up in economic activity employment growth
Report on the distribution of direct payments to agricultural producers (financial year 2016)
") Report on the distribution of direct payments to agricultural producers (financial year 2016) Every year, the Commission publishes the distribution of direct payments to farmers by Member State. Figures
Report on the distribution of direct payments to agricultural producers (financial year 2016) Every year, the Commission publishes the distribution of direct payments to farmers by Member State. Figures
STAT/12/ October Household saving rate fell in the euro area and remained stable in the EU27. Household saving rate (seasonally adjusted)
") STAT/12/152 30 October 2012 Quarterly Sector Accounts: second quarter of 2012 Household saving rate down to 12.9% in the euro area and stable at 11. in the EU27 Household real income per capita fell by
STAT/12/152 30 October 2012 Quarterly Sector Accounts: second quarter of 2012 Household saving rate down to 12.9% in the euro area and stable at 11. in the EU27 Household real income per capita fell by
A statistical overview of the economic situation in the euro area
 A statistical overview of the economic situation in the euro area By Gian Luigi Mazzi Florence, 29 April 2016 EUI-nomics 2016 Outline Latest PEEIs figures GDP growth estimates for the first quarter 2016
European Semester Country Report for Greece
 European Semester Country Report for Greece European commission IOBE conference: Integrating Greece into the European Semester Policy Framework: Priorities for sustainable growth and competitiveness Wednesday,
Aggregation of periods for unemployment benefits. Report on U1 Portable Documents for mobile workers Reference year 2016
 Aggregation of periods for unemployment benefits Report on U1 Portable Documents for mobile workers Reference year 2016 Frederic De Wispelaere & Jozef Pacolet - HIVA KU Leuven June 2017 EUROPEAN COMMISSION
June 2012 Euro area international trade in goods surplus of 14.9 bn euro 0.4 bn euro surplus for EU27
 121/2012-17 August 2012 June 2012 Euro area international trade in goods surplus of 14.9 0.4 surplus for EU27 The first estimate for the euro area 1 (EA17) trade in goods balance with the rest of the world
May 2009 Euro area annual inflation down to 0.0% EU down to 0.7%
 STAT/09/88 16 June 2009 May 2009 Euro area annual inflation down to 0.0% EU down to 0.7% Euro area 1 annual inflation was 0.0% in May 2009 2, down from 0.6% in April. A year earlier the rate was 3.7%.
SOCIAL PROTECTION COMMITTEE ANNUAL REPORT 2016 REVIEW OF THE SOCIAL PROTECTION PERFORMANCE MONITOR AND DEVELOPMENTS IN SOCIAL PROTECTION POLICIES
 SOCIAL PROTECTION COMMITTEE ANNUAL REPORT 2016 REVIEW OF THE SOCIAL PROTECTION PERFORMANCE MONITOR AND DEVELOPMENTS IN SOCIAL PROTECTION POLICIES SOCIAL PROTECTION COMMITTEE ANNUAL REPORT 2016 REVIEW OF
Library statistical spotlight
 /9/2 Library of the European Parliament 6 4 2 This document aims to provide a picture of the, in particular by looking at car production trends since 2, at the number of enterprises and the turnover they
Investment and Investment Finance. the EU and the Polish story. Debora Revoltella
 Investment and Investment Finance the EU and the Polish story Debora Revoltella Director - Economics Department EIB Warsaw 27 February 2017 Narodowy Bank Polski European Investment Bank Contents We look
DATA SET ON INVESTMENT FUNDS (IVF) Naming Conventions
 Naming Conventions") DIRECTORATE GENERAL STATISTICS LAST UPDATE: 10 APRIL 2013 DIVISION MONETARY & FINANCIAL STATISTICS ECB-UNRESTRICTED DATA SET ON INVESTMENT FUNDS (IVF) Naming Conventions The series keys related to Investment
DIRECTORATE GENERAL STATISTICS LAST UPDATE: 10 APRIL 2013 DIVISION MONETARY & FINANCIAL STATISTICS ECB-UNRESTRICTED DATA SET ON INVESTMENT FUNDS (IVF) Naming Conventions The series keys related to Investment
January 2014 Euro area international trade in goods surplus 0.9 bn euro 13.0 bn euro deficit for EU28
 STAT/14/41 18 March 2014 January 2014 Euro area international trade in goods surplus 0.9 13.0 deficit for EU28 The first estimate for the euro area 1 (EA18) trade in goods balance with the rest of the
The Skillsnet project on Medium-term forecasts of occupational skill needs in Europe: Replacement demand and cohort change analysis
 The Skillsnet project on Medium-term forecasts of occupational skill needs in Europe: Replacement demand and cohort change analysis Paper presented at the Workshop on Medium-term forecast of occupational
Labour Market Resilience
 Labour Market Resilience In Malta Report published in the Quarterly Review 2013:1 LABOUR MARKET RESILIENCE IN MALTA 1 Labour market developments in Europe showed a substantial degree of cross-country heterogeneity
in focus Statistics T he em ploym ent of senior s in t he Eur opean Union Contents POPULATION AND SOCIAL CONDITIONS 15/2006 Labour market
 T he em ploym ent of senior s in t he Eur opean Union Statistics in focus OULATION AND SOCIAL CONDITIONS 15/2006 Labour market Authors Christel ALIAGA Fabrice ROMANS Contents In 2005, in the EU-25, 22.2