The year-to-date rally in global risk assets after the Fed flip appears to us to be a last gasp of speculative mania for the current economic cycle.
|
|
|
- Melvin Leonard
- 5 years ago
- Views:
Transcription


1 Crescat Q Quarterly Research Letter April 18, 2019 Crescat Capital LLC 1560 Broadway Denver, CO (303) Dear Investors: The year-to-date rally in global risk assets after the Fed flip appears to us to be a last gasp of speculative mania for the current economic cycle. In our view, three flawed narratives are driving late-cycle euphoria in financial markets today: 1. Central banks can always prevent a downturn in financial markets and the business cycle ; 2. US stocks valuations remain attractive ; and 3. Chinese stimulus and a US-China trade deal will reignite growth in the second half of We believe that the first two storylines are simply wrong. We show why herein. Regarding the third, in our view, China is much more likely to tank the world economy over the next several quarters than rescue it given the historic credit imbalances there, which we also explain below. Central Banks Do Not Have Your Back There has been a huge misconception that global central bank liquidity is what is driving stock prices up today. Our work shows that both global M2 money supply and central bank assets have been contracting on a year-overyear basis so far in That tells us liquidity has not been the driver of the current market-top-retest rally; hope has been. 1

2 But even when global QE returns, it is likely to be no saving grace. As shown above, starting in September 2006 led by China, global central banks increased their balance sheets by $3.9 trillion or more than 50% through March of This unprecedented level of money printing did not prevent the Global Financial Crisis. Rather it preceded and accompanied it. Even the Fed s QE1 which started in 2008 did not stop stocks from plunging; it only coincided with it as shown below. The same goes for the Fed s past changes in interest rate regimes from hiking to easing which are much more often bearish than bullish for stocks. As we show in the chart below, there were twelve times since 1954 (the history of the Fed Funds) that the US central bank paused its interest rate hiking cycle and then reversed it. Only three of those reversals ended in soft landings (1966, 1984, and 1995). In contrast, nine were associated with stock market downturns that led to recessions. We believe the three soft landings were possible because they occurred early in the business cycle, an average of only three years into the expansion. The Fed s December 2018 hike followed by a pause, on the other hand, occurred a record 9 1/2 years into the economic expansion, exceeding the last hike at the peak of the tech bubble by one quarter! Of the nine pauses associated with market downturns and recessions, the economic contraction began an average of just five months from the date of the last rate hike. That would be next month if this is the average delay! But we likely won t know officially when the next recession begins, as typical, until months after it has started when prior-reported economic data gets revised downward. It is also important to note that the stock market peak associated with the nine recessions occurred an average of two months before the last Fed rate hike. The September 2018 market peak, therefore which we are re-testing though still shy of, could still be relevant; it was three months before the Fed s last hike. Even if the market pushes marginally higher here, it will still be very likely that we are near a top based on Crescat s work. It is also important to note that none of the historical corrections and bear markets that surrounded late-cycle Fed rate reversals bottomed until after the economy entered the recession. It seems highly prudent therefore to wait until the next inevitable recession which may be right around the corner before buying stocks today. 2


3 Another good macro timing signal for the peak of the stock market and business cycle is when the credit markets start pricing in Fed rate-cuts late in the expansion. That has never been a bullish sign. As shown in the chart below, every prior time the 2-year yield started to fall after re-testing a multi-decade resistance line going back to 1980, a major bear market and recession followed. Will this time be any different? 3


4 Precious Metals The recent drop in nominal rates is also causing a drop in real yields. Below we show a multi-year breakout of the 5-year TIPS, inverted, which reflects the real interest rate. Real rates have followed gold prices remarkably closely for years. If this pattern holds, even if inflation expectations remain muted, the decline in nominal rates should be positive for gold, especially at today s historically low valuation relative to the global monetary base. It s stunning to us to see the historically depressed valuation of silver gold s high-beta, safe-haven cousin this late in the cycle. An interesting way to see silver s valuation imbalance is to compare it to a broad US stock index. Below, we show the Russell 3000-to-silver ratio near record levels. It formed what appears to be a double top after retesting tech-bubble-peak levels last year. 4

5 Global Yield Curve Inversion As we noted before, today we have an unprecedented amount of economies with 30-year yields lower than LIBOR overnight rates. Spain just joined the pack recently and we now have fourteen economies showing this negative spread. For us, it reiterates Crescat s global yield curve inversion thesis, which is negative for global stocks and positive for future inflows into US dollars, and US Treasuries by extension, as haven assets in a global financial crisis. The fact is, US yields across the entire curve today are attractively high compared to many global developed market alternatives. When financial crises have unfolded in the past, US rates have tended to converge with global rates. Therefore, we expect many of these yield spreads to narrow significantly as the global economic cycle turns down. 5


6 US Treasury vs. German Bund Spread US vs. German 5-year yield spread just broke down from a multi-year support line! Previous breakdowns timed the market top in 2000 & It s another critical macro timing indicator. The US-German 5-year yield spread breakdown is possibly leading a big move that is likely to happen on 10-year spread. In our global macro hedge fund, we are long US 10-year Treasuries and short 10-year German Bunds to play the likely breakdown and narrowing of that spread as shown in the chart below. The legendary former bond king, Bill Gross, was too early in this trade. It got away from him, but it was still a good idea. The trade is now lining up with so many of our other macro timing indicators that we believe the spread is finally getting ready to converge. A classic head-and-shoulders pattern meanwhile appears to have formed over the last year, a bearish technical set up. 6

7 US Yield Curve Inversions Below is our comprehensive way of measuring inversions in the US yield curve. This model calculates all possible 44 spreads across US rates, and the percentage is now close to 50%, just as high as it was at the peak of the tech and housing bubbles. Historically, these elevated levels of inversions tend to be great times to own precious metals and sell US stocks. 7


8 US Equity Valuations Near Record Highs The recent surge in stocks has pushed valuations back near all-time highs. Below, we show that the total US market cap-to-gdp ratio reached its highest ever last September at 1.46 prior to the 4th quarter market meltdown as measured by the Wilshire 5000 Index. This measure is close to re-testing its highs again today! The first panel of the chart below illustrates how the total US equity market capitalization tends to fluctuate above and below GDP across economic cycles. In the second panel, we can clearly see that valuations in this cycle went even higher than in the tech bubble. A multiple of 1.00 relative to GDP tends to be the median valuation over time. But valuations rarely stop at the median during bull and bear market cycles as the chart clearly shows. The truth is, the total US stock market s estimation of its underlying business net worth is as stretched as ever. But total market cap to GDP is just one example of US stock market valuations at historic extremes. Crescat s models show that record or near-record valuations were hit on September 2018 across at least eight valuation measures. In the table below, we show seven additional valuation extremes today relative to the S&P 500 Index with values updated through March. We are essentially only re-testing the September 2018 valuation highs today in April: 8

9 Crescat Macro Model Crescat s macro model combines sixteen factors across key fundamental, economic, and technical indicators to time the US stock market and business cycle. After the year-to-date rally, the model is just two percentage points from record overvalued and record late-cycle levels! The yellow line below shows a backtest of our model score going back to The model did extremely well at timing the tops and bottoms of the last two US stock market and business cycles. This time, the S&P 500 briefly entered overvalued/late-cycle levels in September of 2015 and was followed by a meltdown in China and emerging markets that Crescat capitalized on in A pause in 2016 in Fed interest rate hikes gave emerging and developed markets a new lease to extend the global business cycle. As hikes resumed in 2017, the market and our macro model score only surged to new highs. In September 2018, we reached what we believe were and still are truly mania levels. We strongly believe US stocks are overdue for a bear market and the time of reckoning is near. The bear market started to unfold in the fourth quarter of last year in our view. But now we are retesting the September highs. Based on Crescat s macro model score, and a myriad of other indicators, there is a strong probability that this rally will soon fail and that the bear market will resume. It s interesting to us how surging US stocks are in complete disconnect with the deteriorating fundamental outlook. Earnings estimates for 2019 in fact have been plunging all year while diverging significantly from sharply rising equity prices. This is not a positive set-up for stocks as we start the Q1 earnings season. 9

10 Sentiment Indicators The recent stock market rally has remarkably similar fingerprints to the January 2018 and September 2018 speculative tops as shown by the two charts below courtesy of Jason Goepfert at sentimentrader.com. Jason s smart versus dumb money indicators incorporate OEX put/call and open interest ratios, commercial hedger positions in equity index futures, and the current relationship between stocks and bonds. The smartmoney indicator is currently near its lows while the dumb money one is near its highs. A similar wide spread between these two indicators preceded the market s two steep selloffs last year. 10

11 Sentimentrader also tracks 60+ market indicators and tallies the percentage of them showing extreme optimism versus extreme pessimism. As shown in the chart below, 44% of these indicators are registering extreme optimism levels in equity markets today. Conversely, only 2% of these indicators are showing significant levels of pessimism. Similar to the smart vs. dumb money spread, such divergences performed extremely well at identifying the last two interim market tops. Record bullish sentiment rarely ends well for longs. Neither does extreme divergences between speculative longs and professional hedgers who are short. Certainly, indicators like these in hindsight could have helped us see how temporarily oversold the markets were in late December to better manage the recent counter attack from the bulls. While we have stayed grounded primarily in our macro and fundamental research, and that will not change, sentiment indicators can help on the margin. We hope they will help others to can see why timing for many of our tactically bearish macro views could be ripe. 11

12 The chart below shows a third sentiment indicator we found that looks incredibly frothy today, VIX speculation at an extreme. Speculative futures traders are more net short stock market volatility than they were at the September market peak. China More Likely to Tank than Rescue the Global Economy We think those looking for a China growth resurgence or trade deal to materially extend the stock market and business cycle are sorely mistaken. We have written extensively about China s 400% growth in banking assets since 2008, likely creating the largest credit bubble and overvalued currency in modern financial history. Based on this unsustainable rate of credit expansion, China was responsible for over 60% of global GDP growth since the global financial crisis. The country s massive investment in non-productive infrastructure assets was financed on credit and created high GDP growth but failed to add to the wealth or debt-servicing capacity of the country. As a result, China appears to us to be a financial crisis waiting to unfold. State-directed misallocation of capital has compromised the savings of Chinese citizens. In other words, there is an enormous non-performing loan problem that we believe renders China s banks insolvent. The country s citizens, the banks creditors, are the ones holding the bag. When the Chinese economy inevitably implodes under its bad debt, the government will be forced to print money to recapitalize its banks and bail out its citizens to avoid social unrest. This massive money printing will almost certainly lead to a currency crisis. The Trump administration s hardball on trade is just one of many catalysts for the bursting of the China credit bubble. Whether there is a trade agreement or an ongoing trade war, either one would lead to a continued decline in China s current account balance which should exert downward pressure on its currency. We think China s increasing fiscal deficit due to the recent stimulus will also exert new downward pressure on the currency. While the US administration may continue to hype an impending trade deal as hope for financial markets, we believe trade talks have dragged on for too long already to not have wreaked havoc on global supply chains and economic growth for the rest of the year. As the light continues to get shined on China, it should become clear that nothing beyond a token trade deal is likely to ever be reached. It is much more likely that the ongoing trade 12
13 negotiations will only continue to serve to awaken the US government and its citizen voters to the egregious extent of China s malfeasance. China s cyber hacking, intellectual property theft, and forced technology transfer are likely to be impossible roadblocks to arriving at any meaningful and enforceable trade deal. The U.S. Trade Representative reports make it clear that China has failed to live up to its commitments to open its markets to fair trade ever since it was permitted to join the WTO in China s state-directed economic policies are simply incompatible with an international trade system based on open, market-oriented policies and rooted in the principles of nondiscrimination, market access, reciprocity, fairness and transparency. With election season upon us in the US, the nature of our country s engagement with China should once again become a major campaign issue. Taking a strong stance against China s trade and human rights transgressions would likely have broad, bi-partisan voter support. Democracy, liberty, and justice are the foundation that has made the US a true world economic superpower. Contrast that with China s authoritarianism, suppression, and corruption. Sure, there may be some corruption in democratic, advanced economies too. But we believe it pales compared to China. In our view, the trade talks are closer to morphing into a new cold war than to being resolved by a substantial trade pact. Meanwhile, much like downfall of other totalitarian communist economies, we believe both internal and foreign capital is likely to continue fleeing the country, exerting downward pressure on its currency, economy, and banks. We continue to have a negative view on both the Chinese yuan and Hong Kong dollar that we are expressing in our global macro fund through put options on these currencies. We also are short richly-valued, USlisted China-hustle stocks in both hedge funds. Crescat Remains Steadfast in our Tactically Bearish Views and Positioning Today, with historic US equity valuations, record credit bubbles globally, and the longest US economic expansion cycle ever likely to soon come to an end based on our models, we remain steadfast in our net short US and global equities position in our hedge funds. We are also short subprime credit in our global macro fund. We remain long precious metals and precious metals mining stocks across all our strategies. There is indeed a US business cycle as well as a global economic cycle. We believe both are ripe for a downturn. We intend to capitalize on the downturn like we did in the fourth quarter of last year which should be only the beginning. Like last year, Crescat s hedge funds are having what we think is only a temporary pullback as the US stock market retests its all-time highs. Like last year, we believe global financial markets are poised for a major downturn. Staying grounded in our models, themes, and positioning was key to our strong hedge fund performance in Such grounding we believe will be key to generating strong performance again in the coming months and quarters. We will continue to follow our model signals and risk controls, but we aim to stay committed to our tactically bearish views and positioning until the next global economic downturn becomes widely acknowledged. We plan on getting significantly net long again in our hedge funds, but not until our macro model tells us that stocks are undervalued and that it's early in the business cycle. As macro managers with a strong value bias, we remain confident that the underlying intrinsic value of Crescat s portfolios at any time are worth substantially more than the market is quoting them (longs worth more and shorts worth less) or we would not be in those positions. This grounding gives us the fortitude to withstand a moderate amount of market volatility and persevere for long-term high absolute and risk-adjusted returns compared to our benchmarks as we have been able to deliver historically and expect to in the future. We think the financial markets are presenting an incredible setup for Crescat s strategies today. 13
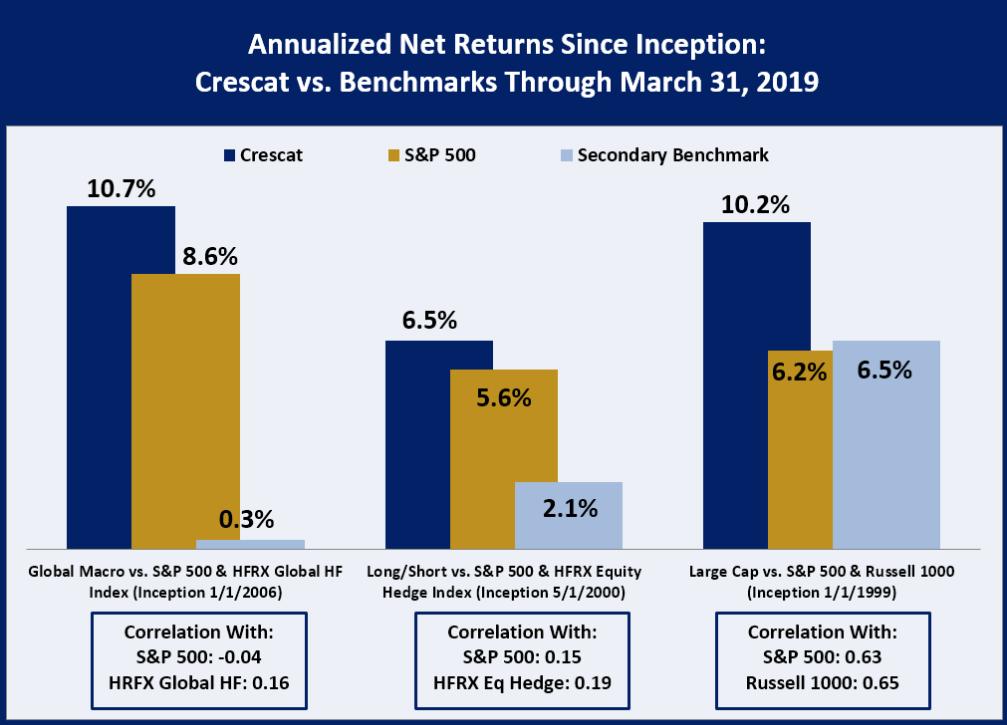
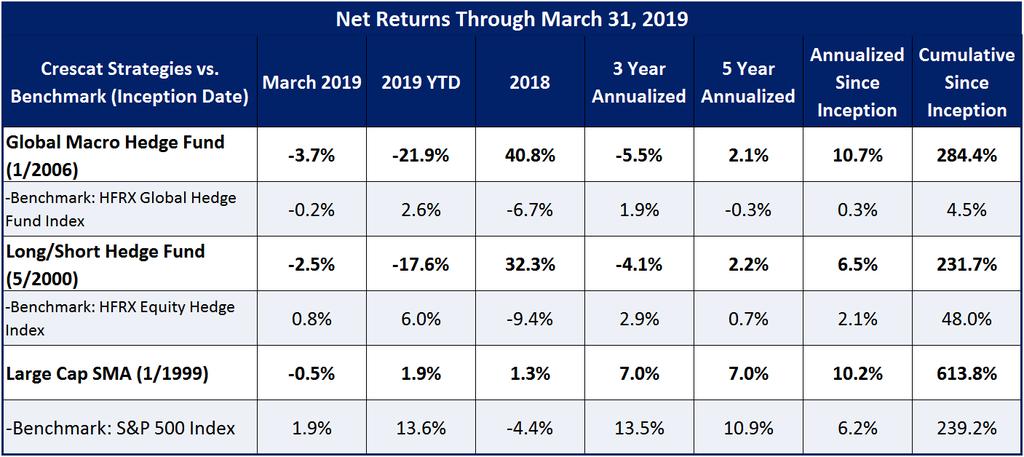
14 Performance Through Q

15 Profit Attribution by Theme Sincerely, Kevin C. Smith, CFA Chief Investment Officer Tavi Costa Global Macro Analyst For more Information please contact Linda Smith at or (303) Crescat Capital LLC 15
16 Important Disclosures Case studies are included for informational purposes only and are provided as a general overview of our general investment process, and not as indicative of any investment experience. There is no guarantee that the case studies discussed here are completely representative of our strategies or of the entirety of our investments, and we reserve the right to use or modify some or all of the methodologies mentioned herein. Only accredited investors and qualified clients will be admitted as limited partners to a Crescat fund. For natural persons, investors must meet SEC requirements including minimum annual income or net worth thresholds. Crescat funds are being offered in reliance on an exemption from the registration requirements of the Securities Act of 1933 and are not required to comply with specific disclosure requirements that apply to registration under the Securities Act. The SEC has not passed upon the merits of or given its approval to the Crescat funds, the terms of the offering, or the accuracy or completeness of any offering materials. A registration statement has not been filed for any Crescat fund with the SEC. Limited partner interests in the Crescat funds are subject to legal restrictions on transfer and resale. Investors should not assume they will be able to resell their securities. Investing in securities involves risk. Investors should be able to bear the loss of their investment. Investments in the Crescat funds are not subject to the protections of the Investment Company Act of Performance data represents past performance, and past performance does not guarantee future results. Performance data is subject to revision following each monthly reconciliation and annual audit. Current performance may be lower or higher than the performance data presented. Crescat is not required by law to follow any standard methodology when calculating and representing performance data. The performance of Crescat funds may not be directly comparable to the performance of other private or registered funds. Investors may obtain the most current performance data and private offering memorandum for a Crescat fund by contacting Linda Smith at (303) or by sending a request via to lsmith@crescat.net. See the private offering memorandum for each Crescat fund for complete information and risk factors. 16
March 16, Dear Investors:
 March 16, 2019 Crescat Capital LLC 1560 Broadway Denver, CO 80202 (303) 271-9997 info@crescat.net www.crescat.net Dear Investors: At Crescat we remain positioned to capitalize on a downturn in the economic
February 21, Dear Investors:
 February 21, 2019 Crescat Capital LLC 1560 Broadway Denver, CO 80202 (303) 271-9997 info@crescat.net www.crescat.net Dear Investors: There is indeed a business cycle and timing it ahead of key inflection
We are positioned to capitalize on these themes in unique ways across all three of our investment strategies:
 6/25/18 Crescat Capital LLC 1560 Broadway Denver, CO 80202 (303) 271-9997 info@crescat.net www.crescat.net Dear Investors, We strongly believe that the global macro investment cycle is turning down right
Crescat Capital LLC 1560 Broadway Denver, CO (303) January 27, 2018.
 January 27, 2018.") January 27, 2018 Crescat Capital LLC 1560 Broadway Denver, CO 80202 (303) 271-9997 info@crescat.net www.crescat.net Dear Investors, Believe me: We re in a bubble right now. And the only thing that looks
January 27, 2018 Crescat Capital LLC 1560 Broadway Denver, CO 80202 (303) 271-9997 info@crescat.net www.crescat.net Dear Investors, Believe me: We re in a bubble right now. And the only thing that looks
Crescat Capital LLC 1560 Broadway Denver, CO (303) November 16, Dear Fellow Investors,
 November 16, Dear Fellow Investors,") November 16, 2018 Crescat Capital LLC 1560 Broadway Denver, CO 80202 (303) 271-9997 info@crescat.net www.crescat.net Dear Fellow Investors, October was a frightening month for investors around the world.
November 16, 2018 Crescat Capital LLC 1560 Broadway Denver, CO 80202 (303) 271-9997 info@crescat.net www.crescat.net Dear Fellow Investors, October was a frightening month for investors around the world.
ANOTHER TOUGH WEEK COMMENTARY REASSURANCE KEY TAKEAWAYS LPL RESEARCH WEEKLY MARKET. October
 LPL RESEARCH WEEKLY MARKET COMMENTARY October 29 2018 ANOTHER TOUGH WEEK John Lynch Chief Investment Strategist, LPL Financial Jeffrey Buchbinder, CFA Equity Strategist, LPL Financial Ryan Detrick, CMT
Crescat Capital LLC 1560 Broadway Denver, CO (303) September 15, 2018.
 September 15, 2018.") Crescat Capital LLC 1560 Broadway Denver, CO 80202 (303) 271-9997 info@crescat.net www.crescat.net September 15, 2018 Dear Investors: Our current three best macro ideas today are complementary plays on
Crescat Capital LLC 1560 Broadway Denver, CO 80202 (303) 271-9997 info@crescat.net www.crescat.net September 15, 2018 Dear Investors: Our current three best macro ideas today are complementary plays on
The yellow highlighted areas are bear markets with NO recession.
 Part 3, Final Report: Major Market Reversal Model This is the third and final report on my major market reversal model. This portion of the model focuses on the domestic and international economy. I ve
Tactical Gold Allocation Within a Multi-Asset Portfolio
 Tactical Gold Allocation Within a Multi-Asset Portfolio Charles Morris Head of Global Asset Management, HSBC Introduction Thank you, John, for that kind introduction. Ladies and gentlemen, my name is Charlie
The $VIX, the Dow, and China. 3/15/2008
 The $VIX, the Dow, and China. 3/15/2008 In the past few days, I have received some questions from a few members. These questions cannot be answered in a few words, and because other members may be interested,
S&P 500 Update: Week ending May 11th 2018
 S&P 500 Update: Week ending May 11th 2018 1. Market Recap: The S&P 500 closed higher by 2.2% for week and broke out of some key resistance areas and a short term downtrend. There are 4 topics now setting
Technical Strategy. Q1 Dollar top as the basis for a sharp correction
 2017 Chart 38. ) DXY with Advance/Decline Line (20 Key Dollar Pairs) Chart 39. ) US Dollar with Presidential Cycle Tactically, we have been bullish US dollar since the May 2016 bottom, which is the base
JUNE S&P 500 INDEX 2,618.00
 Tuesday, April 10, 2018 U.S. Stocks Gave Up Gains Late to Close Marginally Higher JUNE S&P 500 INDEX 2,618.00 +3.50 (+0.13%) Day High: 2,653.75 Day Low: 2,610.00 U.S. equities pared most of the day s gains
Fourth Quarter Market Outlook. Jason Bulinski, CFA Donald A. Powell, CFA Joseph Styrna, CFA
 Fourth Quarter 2018 Market Outlook Jason Bulinski, CFA Donald A. Powell, CFA Joseph Styrna, CFA Economic Outlook Growth: Strong 2018, But Expecting Slowdown in 2019 Growth & Jobs 2018 2017 2016 2015 2014
Why Worry About a Melt-Up?
 Why Worry About a Melt-Up? November 6, 2013 by Liz Ann Sonders of Charles Schwab The risk of a melt-up in stocks is garnering more attention; and is something we've been discussing recently, too. Sentiment
BCA 4Q 2018 Review and 2019 Outlook Russ Allen, CIO. Summary Outlook
 BCA 4Q 2018 Review and 2019 Outlook Russ Allen, CIO Summary Outlook January 15, 2019 Markets in 2019 will be choppy with volatility more like this past year than the placid trading of 2017. The Fed is
Monthly Investment Compass Charting The Course Of The Markets
 Monthly Investment Compass Charting The Course Of The Markets November 11 th, 2017 Monthly Investment Compass 1) Executive Summary: November 11 th, 2017 U.S. Stock Market: Unmet upside targets in several
Risk of Policy Error Clearly Rising Some Key Charts and Index Levels
 Risk of Policy Error Clearly Rising Some Key Charts and Index Levels 4 th March 2018 What a difference a few weeks make. At the end of January, financial markets were melting up, commentators were salivating
Market Maps. Bob Dickey, Technical Strategist, Portfolio Advisory Group. December RBC Capital Markets, LLC / Portfolio Advisory Group
 Market Maps Bob Dickey, Technical Strategist, Portfolio Advisory Group RBC Capital Markets, LLC / Portfolio Advisory Group All values in U.S. dollars and priced as of market close, December 1, 2017, unless
Gold, Mining Stocks on the Verge of a Major Bull Market
 Gold, Mining Stocks on the Verge of a Major Bull Market By Robert McHugh, Ph.D. In looking at the charts for Gold, Silver and Mining Stocks, it is clear that patterns and wave mappings suggest a bottom
Monthly Investment Compass Charting The Course Of The Markets
 Monthly Investment Compass Charting The Course Of The Markets September 21st, 2017 Monthly Investment Compass 1) Executive Summary: September 21 st, 2017 U.S. Stock Market: Virtually all of our near term
Fed Plans To Trim Its Massive $4.5 Trillion Balance Sheet
 Fed Plans To Trim Its Massive $4.5 Trillion Balance Sheet June 21, 2017 by Gary Halbert of Halbert Wealth Management 1. Fed to Reduce Massive $4.5 Trillion Balance Sheet Implications 2. How the Fed Got
Understanding the Key Support Levels for Gold
 Understanding the Key Support Levels for Gold Gold bulls and inquiring minds are perplexed by last week's mayhem in the precious metals markets. In addition to gold and silver, copper prices also went
Rise Up: Dow 20k Fails to Thrill Individual Investors
 Rise Up: Dow 20k Fails to Thrill Individual Investors January 30, 2017 by Liz Ann Sonders of Charles Schwab Key Points After a torturous period of flirtation, the Dow finally crosses 20k Individual sentiment
FIVE FORECASTERS: FEW WARNING SIGNS
 LPL RESEARCH WEEKLY MARKET COMMENTARY January 25 2016 FIVE FORECASTERS: FEW WARNING SIGNS Burt White Chief Investment Officer, LPL Financial; Jeffrey Buchbinder, CFA Market Strategist, LPL Financial; Barry
As of July 10, Quarter in Review
 As of July 10, 2015 Quarter in Review The following are the total returns for many of the major asset classes in the second quarter of 2015 (note that as a client you do not have exposure to all of these
JULY 2014 ISSUE *** Reports are similar to that of the FED minutes. Only minor changes to the outlook take place each month along with updated charts.
 MARKET TREND JULY 2014 ISSUE *** Reports are similar to that of the FED minutes. Only minor changes to the outlook take place each month along with updated charts. S&P 500 Monthly Chart BIG PICTURE INNER-Market
February 2018 Monthly Commodity Market Overview Newsletter. Stock Index Futures
 February 2018 Monthly Commodity Market Overview Newsletter By the ADMIS Research Team Stock Index Futures There was a severe decline in the first week of February with S&P 500 futures posting the biggest
Gary Shilling - Why You Should Own Bonds
 Gary Shilling - Why You Should Own Bonds February 17, 2015 by Robert Huebscher If you followed Gary Shilling s advice for the last 30 years, you would be very wealthy. Shilling runs the New Jersey-based
The Worst Week In A Decade For US Stocks
 The Worst Week In A Decade For US Stocks February 15, 2018 by Gary Halbert of Halbert Wealth Management 1. The Worst Week For US Stock Markets Since 2008 2. Confluence of Negative Factors Became Important
Gundlach s Forecast for 2016
 Gundlach s Forecast for 2016 January 19, 2016 by Robert Huebscher Jeffrey Gundlach is a prescient and accurate forecaster. Last week, as he does each January, he offered his market outlook. But unlike
ADVANCE SPECIAL COMMENTARY No. 858 Economic and Financial Review and Preview December 30, 2016
 ADVANCE SPECIAL COMMENTARY No. 858 Economic and Financial Review and Preview December 30, 2016 Consumer Expectations Soar Along with Anticipated Changes from the Incoming Administration Yet, the Near-Term
To fully understand the dramatic turns in the financial markets that
 01_chap_murphy.qxd 10/24/03 2:06 PM Page 1 CHAPTER 1 A Review of the 1980s To fully understand the dramatic turns in the financial markets that started in 1980, it s necessary to know something about the
Investing During The Trump Administration: Opportunity & Danger
 Investing During The Trump Administration: Opportunity & Danger Prepared for the Los Angeles Chapter of the American Association of Individual Investors (AAII ) June 17 th, 2017 About Asbury Research John
Fundamental Update: Has the Euro fallen far enough?
 Fundamental Update: Has the Euro fallen far enough? Kathleen Brooks, Research Director FOREX.COM May 29, 2012 I overheard an interesting conversation the other day; someone was saying they were too frightened
2018 Economic & Stock Market Outlook: Clouds Could Test Investor Resolve
 2018 Economic & Stock Market Outlook: Clouds Could Test Investor Resolve Supplemental Chart Pack December 13, 2017 Bruce Bittles Chief Investment Strategist (941) 906-2830 bbittles@rwbaird.com William
Market Commentary 1 st Quarter 2018
 Where Do We Go From Here? The key to making money in stocks is not to get scared out of them Peter Lynch Successful investing is often determined by one s ability to stay the course. Since 2009, investors
The Nutcracker and the Bond King
 The Nutcracker and the Bond King 10-year bond yields have just experienced one of the sharpest 100-day percentage drops in over 50 years Interest rates are now below their closing level of the 666 March
WILL EIGHT BE GREAT FOR THE BULL?
 LPL RESEARCH WEEKLY MARKET COMMENTARY March 14 2016 WILL EIGHT BE GREAT FOR THE BULL? Burt White Chief Investment Officer, LPL Financial Jeffrey Buchbinder, CFA Market Strategist, LPL Financial KEY TAKEAWAYS
Gundlach s Forecast for 2017
 Gundlach s Forecast for 2017 January 11, 2017 by Robert Huebscher Investors will confront excessive debt, high P/E levels and political uncertainty as they enter the Trump presidential era. In response,
What Is Driving The Metal Markets?
 What Is Driving The Metal Markets? In all likelihood, Mark Twain did not have metal markets in mind when he said, history does not repeat itself, but it does rhyme Nevertheless, it seems as though we are
Monthly Investment Compass Charting The Course Of The Markets
 Monthly Investment Compass Charting The Course Of The Markets January 12 th, 2017 Monthly Investment Compass Executive Summary: January 12 th 2017 U.S. Stock Market: A number of near term metrics warn
GOLD OUTLOOK 2019: RECOVERY EXPECTED TO CONTINUE
 GOLD OUTLOOK 2019: RECOVERY EXPECTED TO CONTINUE January 2019 Gold staged a recovery late in 2018. The yellow metal has recovered most of its losses since June 2018. A collapse in speculative positioning
Markets update August 2013
 Markets update August 2013 Global share markets retreated in August amid increasing US Federal Reserve taper talk and escalating geopolitical tensions. The Australian share market made good gains, commodities
On Our Radar September 2015
 On Our Radar September 2015 The Dow Jones Industrial Average (DJIA), S&P 500 and NASDAQ Composite fell 6.56 percent, 6.25 percent, and 6.85 percent, respectively, in August, which was highlighted by a
MONTHLY NEWSLETTER SEPTEMBER 2018
 MONTHLY NEWSLETTER SEPTEMBER 2018 Since bottoming out toward the end of march and even with the volatility, we are still approaching all time highs at the time of this newsletter. Still plenty of events
Gold and Gold Stocks Patterns, Cycles and Insider Activity, Part 1 December 27, 2017 Author Pater Tenebrarum
 Gold and Gold Stocks Patterns, Cycles and Insider Activity, Part 1 December 27, 2017 Author Pater Tenebrarum Repeating Patterns and Positioning A noteworthy confluence of patterns in gold and gold stocks
Macro Monthly UBS Asset Management June 2018
 Macro Monthly UBS Asset Management June 18 Investing in a mature cycle Erin Browne Head of Asset Allocation Evan Brown, CFA Director, Asset Allocation Roland Czerniawski, CFA Associate Director, Asset
Surveying The Commodity Carnage
 Surveying The Commodity Carnage November 25, 2015 by Doug Ramsey of Leuthold Weeden Capital Management Commodities and commodity stocks have been a disaster in recent years, but fortunately one that our
2017 Mid-year US Equity Outlook: Rattle and Hum
 2017 Mid-year US Equity Outlook: Rattle and Hum July 5, 2017 by Liz Ann Sonders of Charles Schwab Key Points We may be witnessing an extreme version of "gridlock is good" with record-setting partisan conflict.
November 2017 Monthly Commodity Market Overview Newsletter
 November 2017 Monthly Commodity Market Overview Newsletter By the ADMIS Research Team Stock Index Futures S&P 500, Dow Jones, NASDAQ and Russell 2000 futures registered new historical highs in November.
Weekly Re-Lay for June 18-22, 2018
 06/16/18 Overall Outlook & System Trade(s) Update: Stock Indices continue to rally into their late- June cycle high, the time frame when the next multimonth peak is most likely Gold & Silver fulfilled
Table 1: Economic Growth Measures
 US Equities continued to advance in the second quarter, with the S&P 500 returning 5.2% for the quarter and 7.1% for the first half. Energy was by far the best performing sector in the quarter, returning
QUICK PIVOT FRIDAY, JANUARY 7, 2011 BOB HOYE PUBLISHED BY INSTITUTIONAL ADVISORS. Surreal Policymakers Are Blowing Serial Bubbles
 QUICK PIVOT FRIDAY, JANUARY 7, 2011 BOB HOYE PUBLISHED BY INSTITUTIONAL ADVISORS Surreal Policymakers Are Blowing Serial Bubbles The above is more a sarcastic observation than a title for this edition.
Michael Riesner Marc Müller 23/05/2017. These are sales views based on Technical Analysis. They do not represent the UBS House View.
 h Equities Sales Trading Commentary Technical Analysis Weekly Comment Global Michael Riesner Marc Müller 23/05/2017 michael.riesner@ubs.com marc.mueller@ubs.com +41-44-239 1676 +41-44-239 1789 These are
Market Insight: It s Nasty Out There Is This a Bear Market?
 December 16, 2018 Market Insight: It s Nasty Out There Is This a Bear Market? Year-end commentaries are supposed to be filled with reflection, thankfulness, and inspiration for the New Year. In the grand
HOPE FOR ROTATION. So, let me talk a little about each of these. Tariffs. Tariffs are restrictions to trade; they are a tax and they cause inflation.
 HOPE FOR ROTATION We ve said repeatedly that we believe the current bull market will continue until there is either a recession or a restrictive monetary policy. So far, that position has been accurate
Technical Analysis. Weekly Comment. Global. SPX Overbought Relief Rally in Europe!! Equities Sales Trading Commentary
 h Technical Analysis Equities Sales Trading Commentary Weekly Comment Global Michael Riesner Marc Müller 03/07/2012 michael.riesner@ubs.com marc.mueller@ubs.com +41-44-239 1676 +41-44-239 1789 SPX Overbought
The sideways churn in the major U.S. Stock indexes since late March continues. We have a lot of new members that have
 May 17, 2016 Dear Members, The sideways churn in the major U.S. Stock indexes since late March continues. We have a lot of new members that have recently joined us in the past couple of months. For you
WILL GOLD CONTINUE TO SHINE?
 LPL RESEARCH WEEKLY MARKET COMMENTARY March 7 216 WILL GOLD CONTINUE TO SHINE? Burt White Chief Investment Officer, LPL Financial Jeffrey Buchbinder, CFA Market Strategist, LPL Financial KEY TAKEAWAYS
Inflows, indexes, and the future: Trends in active and passive. Key takeaways
 August 2017 Inflows, indexes, and the future: Trends in active and passive PANELISTS 1 2 3 Key takeaways We believe global monetary easing has been the primary driver behind the closer stock-to-stock correlations,
October 2017 Monthly Commodity Market Overview Newsletter. Stock Index Futures
 October 2017 Monthly Commodity Market Overview Newsletter By the ADMIS Research Team Stock Index Futures S&P 500, Dow Jones, NASDAQ and Russell 2000 futures registered new historical highs in October.
REFLECTING ON NASDAQ 6,000
 LPL RESEARCH WEEKLY MARKET COMMENTARY May 1 2017 REFLECTING ON NASDAQ 6,000 Burt White Chief Investment Offcer, LPL Financial Jeffrey Buchbinder, CFA Market Strategist, LPL Financial KEY TAKEAWAYS The
A Corrective Decline Approaching within. Gold s Long Term Rising Trend
 A Corrective Decline Approaching within Gold s Long Term Rising Trend By Robert McHugh, Ph.D. February 22nd, 2019 On September 4 th, 2018, we published an article forecasting that Gold was about to start
Will We See A Recession This Year?
 Will We See A Recession This Year? Rising Rates Are Here This week, the Federal Reserve Bank (Fed) signaled their intention to raise their target interest rate when they meet in mid-march. If they do,
Market Maps. Bob Dickey, Technical Strategist, Portfolio Advisory Group. March RBC Capital Markets, LLC / Portfolio Advisory Group
 Market Maps Bob Dickey, Technical Strategist, Portfolio Advisory Group RBC Capital Markets, LLC / Portfolio Advisory Group All values in U.S. dollars and priced as of February 28, 2019, unless otherwise
Odds Rise For "Inverted Yield Curve" & New Recession
 Odds Rise For "Inverted Yield Curve" & New Recession June 14, 2017 by Gary Halbert of Halbert Wealth Management 1. Policy Committee Set to Hike Fed Funds Rate Tomorrow 2. Yield Curve Flattening Could It
PERSPECTIVE ON MARKET VOLATILITY
 LPL RESEARCH WEEKLY MARKET COMMENTARY October 15 2018 PERSPECTIVE ON MARKET VOLATILITY John Lynch Chief Investment Strategist, LPL Financial Ryan Detrick, CMT Senior Market Strategist, LPL Financial Jeffrey
YIELD CURVE INVERSION: A CLEAR BUT UNLIKELY DANGER
 1-year minus -year UST (%) INVESTMENT STRATEGY COMMENTARY YIELD CURVE INVERSION: A CLEAR BUT UNLIKELY DANGER December 4, 17 Investors focus on the yield curve with good reason an inverted curve has historically
Erlanger Squeeze Play - Squeezeometer. Erlanger Squeeze Play
 Page 1 of 5 Indicator Focus: Squeezeometer by Phil Erlanger Erlanger Squeeze Play A core function of our research centers on the concept of advance phases and decline phases. Whether we're in a bull or
US Financial Market Update for March Prepared for the Market Technicians Association
 US Financial Market Update for March 2016 Prepared for the Market Technicians Association March 16 th, 2016 About Asbury Research Research, Methodology & Clientele Our Research: Asbury Research, established
Fourth Quarter Market Outlook. Kim Huebner, CFA Don Powell, CFA Joseph Styrna, CFA
 Fourth Quarter 2017 Market Outlook Kim Huebner, CFA Don Powell, CFA Joseph Styrna, CFA Economic Outlook Growth Increasing, Spending Modest, Low Unemployment 2017 2016 2015 2014 2013 2012 2011 GDP* Q3:
However, while prices are likely to fall a bit further, we also continue to believe that we could be with a. Wednesday, November
 Wednesday, November 28 2018 In our last update, we noted that Gold Stocks had resistance in the $19.75 to $19.80 area and that the odds were about 62% that GDX could be near a short term high of importance.
2014 Economic & Stock Market Outlook Mid-Year Chart Pack Update June 12, 2014
 Baird Market & Investment Strategy 14 Economic & Stock Market Outlook Mid-Year Chart Pack Update June, 14 Please refer to Appendix Important Disclosures. The following charts and comments are meant to
TWG. Toronto Wealth Group. My Conversations with: Peter J. Frost & Tristan Sones. Investments, Retirement Planning, Insurance.
 I attended the AGF Think Income, Think Equities, Investment Insights from Peter Frost event on January 22 nd, 2013 and the AGF Open House & Investment Forum on March 7 th, 2013 featuring Tristan Sones.
REUTERS TECHNICAL ANALYSIS Q2 OUTLOOK WANG TAO
 The Irving Oil refinery is photographed at sunset on in Saint John, New Brunswick, March 9, 2014. REUTERS/Devaan Ingraham REUTERS TECHNICAL ANALYSIS Q2 OUTLOOK 2014 - WANG TAO It will be a bearish quarter
Precious Metals: The dollar giveth, the dollar taketh away
 Snap Precious Metals: The dollar giveth, the dollar taketh away Commodities A strong beat in Friday's US jobs report has furthered investor expectations of rising inflation and additional rate increases.
UPDATE ON GROWTH AND VALUE STOCKS
 LPL RESEARCH WEEKLY MARKET COMMENTARY September 18 2017 UPDATE ON GROWTH AND VALUE STOCKS Burt White Chief Investment Officer, LPL Financial Jeffrey Buchbinder, CFA Market Strategist, LPL Financial KEY
Canadian Technical Comment
 October 15 2017 TSX: Shift to defense underway as near-term pullback looms Summary Recommendation: For long-term investment managers with cash on hand, we would wait for a short-term (2-4 week) corrective
The Grand Illusion November 4, 2016
 The Grand Illusion November 4, 2016 Many know that the economy is not good. Fact is, the economic issues actually began in 2000 and have only been made worse. The world economy is in a systemic crisis
MARKET PERSPECTIVES KEY TAKEAWAYS LPL RESEARCH. November MORE THAN JUST A TRUMP TAPER?
 LPL RESEARCH B O N D MARKET PERSPECTIVES KEY TAKEAWAYS Last week s Treasury sell-off is broadly being attributed to President-elect Donald Trump s victory, and corresponding increases in policy uncertainty
THE CHAPMAN REPORT FOR DECEMBER 22, 2008
 THE CHAPMAN REPORT FOR DECEMBER 22, 2008 Charts and technical commentary by David Chapman Union Securities Ltd, 33 Yonge Street, Suite 901, Toronto, Ontario, M5E 1G4 fax (416) 604-0533, (416) 604-0557,
What Does a Humped Yield Curve Mean for Future Stock Market Returns
 What Does a Humped Yield Curve Mean for Future Stock Market Returns February 11, 2019 by Bryce Coward of Knowledge Leaders Capital As many commentators have pointed out, the yield curve has developed a
MARKET INSIGHT Performance Economic Update Charts* of Interest
 MARKET INSIGHT Performance Economic Update Charts* of Interest *Provided by Strategas Research Partners LLC October 24, 2011 PERFORMANCE: as of 10-24-2011 Sector Week 3Mo YTD S&P 500 1.1% -7.3% 0.7% Russell
Last Hurrah for the Dollar. Market Update June 15, Seattle Technical Advisors
 SeattleTA provides investment managers with technical analysis of the equity, fixed-income, commodity, and currency markets. This week should see the start of the final push upward by the US Dollar prior
Research Desk Stock Broking
 Research Desk Stock Broking India ValueMax January 01, 2015 ValueMax Monthly Investment Ideas ValueMax helps clients to take a long stance on stocks from the S&P BSE-100 universe. Comprising monthly technical
Market Maps. Bob Dickey, Technical Strategist, Portfolio Advisory Group. January RBC Capital Markets, LLC / Portfolio Advisory Group
 Market Maps Bob Dickey, Technical Strategist, Portfolio Advisory Group RBC Capital Markets, LLC / Portfolio Advisory Group All values in U.S. dollars and priced as of December 31, 2018, unless otherwise
Quick Takes Pro Technical Analysis for Everyone
 Quick Takes Pro Technical Analysis for Everyone Michael Kahn Research LLC January 16, 2016 We ll spare you the statistics about how bad the opening to the year was. Worst since blah, blah. But we will
Is it 1932 o r 1942, 1958,
 Volume 23, No. 1, April 24, 2009 CWS CAPITAL PARTNERS LLC CWS Capital Partners LLC Is it 1932 o r 1942, 1958, 1962, 1970, 1975, 1978, 1982, 2002? CALENDAR OF EVENTS Monday, May 25, 2009 Memorial Day, CWS
COMMENTARY NUMBER 353 January Inflation. February 17, January Annual Inflation Rose to 1.6% (CPI-U), 1.8% (CPI-W), 9.
, 1.8% (CPI-W), 9.") COMMENTARY NUMBER 353 January Inflation February 17, 2011 January Annual Inflation Rose to 1.6% (CPI-U), 1.8% (CPI-W), 9.1% (SGS) Accelerating December and January Inflation Was Muted by Unstable Seasonal
COMMENTARY NUMBER 353 January Inflation February 17, 2011 January Annual Inflation Rose to 1.6% (CPI-U), 1.8% (CPI-W), 9.1% (SGS) Accelerating December and January Inflation Was Muted by Unstable Seasonal
Market Outlook By Mark Connolly, Principal, New Castle Investment Advisors, LLC. Prepared January 15, 2018
 Prepared January 15, 2018 Market Outlook 2018 By Mark Connolly, Principal, New Castle Investment Advisors, LLC Last year s stock market performance was nothing less than spectacular. The Dow Jones Industrial
The Financial Sector
 Brad Smith January 30, 2009 The Financial Sector Yield Curve The yield curve has maintained its steepness over the past sixth months and has continued to be depressed on both short and long ends. With
Investment Perspectives. From The Global Investment Committee
 Investment Perspectives From The Global Investment Committee Global Risk Aversion Reached Extreme Levels Morgan Stanley Standardized Global Risk Demand Index As of October 15, 2014 Complacent Extreme Fear
Compiled by Timon Rossolimos
 Compiled by Timon Rossolimos - 2 - The Seven Best Forex Indicators -All yours! Dear new Forex trader, Everything we do in life, we do for a reason. Why have you taken time out of your day to read this
2016 April Financial Market Update
 Charles Sherry Director, Institutional Education Group Blue Ocean Global Wealth 51 Monroe St., Plaza West 06 Rockville, MD 20850 Tel: 720.308.4560 csherry@blueoceanglobalwealth.com 2016 April Financial
Economic & Financial Market Update
 Economic & Financial Market Update September 2011 www.wellscap.com James W. Paulsen, Ph.D., Chief Investment Strategist Armageddon Hypochondria!??! Banks are Broke! Consumers Won t Spend! Government Out
Quarterly portfolio Summary
 Quarterly portfolio Summary Sample ETF Portfolio June 30, 2014 Target Current Investment Mix: % $ % Fixed Income: 50.65% $16,856.80 65.00% Growth: 26.65% $8,869.22 35.00% Cash/Cash Equivalents:* 22.70%
January 25th, Dear Turtle Creek Client,
 January 25th, 2019 Dear Turtle Creek Client, 2018 was a year in which literally nothing worked for investors. Every major asset class from stocks to bonds to commodities posted negative returns and the
Storm Clouds and Silver Linings
 INSIGHTS MARCH 2018 A feature article from our U.S. partners Storm Clouds and Silver Linings The recent correction rattled the market, but it may be just what stocks needed to resume their uptrend. Jurrien
THE FIVE FINGER GUIDE: ECONOMIC DATA THAT PROVIDE A HEADS-UP TO A U.S. RECESSION
 TD Economics Special Report www.td.com/economics THE FIVE FINGER GUIDE: ECONOMIC DATA THAT PROVIDE A HEADS-UP TO A U.S. RECESSION Recession cries for the U.S. economy reached a feverish pitch among investors