A Corrective Decline Approaching within. Gold s Long Term Rising Trend
|
|
|
- Bartholomew Boyd
- 5 years ago
- Views:
Transcription
1 A Corrective Decline Approaching within Gold s Long Term Rising Trend By Robert McHugh, Ph.D. February 22nd, 2019 On September 4 th, 2018, we published an article forecasting that Gold was about to start a strong rising trend. At the time, Gold was trading at Since then Gold has risen to We presented several charts that we follow every day at our website at that pointed out reasons we believed a Bullish trend was about to commence. This weekend we are seeing a top approaching for the first leg up of a new Bull market for Precious Metals and Mining stocks. Again, we visit our key charts and indicators to show why we believe a corrective decline is next, but within a continuing new Bull market. Before we get into the short-term forecast pointing to this corrective decline, we want to revisit the long-term trend for Gold, and why it, along with Silver and Mining stocks, are headed higher over the long term. Looking at the fundamentals first, there is no stopping the rise in the price of Gold. As long as world Central Bankers continue to increase the quantity of fiat currencies, because Gold s production is limited, a simple supply and demand equation predicts Gold must go higher. Hyperinflation pushes Gold s value higher. Demand for Gold is also increasing as it is a key component of technological electronic products, an increasing product line worldwide. Gold also acts as a safe haven during times of war and political crisis. The government held the $35 per ounce price until August 15, 1971, when President Richard Nixon announced that the United States would no longer convert dollars to Gold at a fixed value, thus completely abandoning the Gold standard. FDR tried to balance the amount of printed currency with U.S. Treasury Gold Reserves, limiting the amount of currency. Nixon s action meant there is no limit to the printing of U.S. Dollars, and meant Gold could rise as high as it wants to, in relation to the quantity of Fiat currency in circulation.
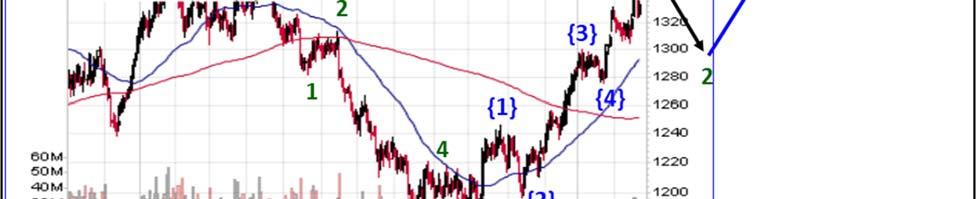
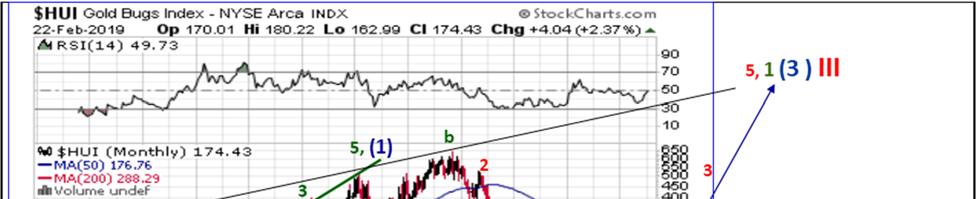
2 Since 1971, we have seen a meteoric rise in Gold s U.S. Dollar value. Below we show a long-term Elliott wave mapping for Gold since Gold exploded inside a Cycle degree wave I up Bull market that ended in 1980 right above 800. It then corrected that multi-decade Bull market as Cycle degree wave II down worked Gold lower through July 1999, bottoming around 250. Since then, Cycle degree wave III up has been driving Gold s valuation higher. Elliott waves must be proportional to each other within a degree of trend. The Bull market in Gold from 1999 through September 2011 took Gold up to 1,923, but on a logarithmic scale was not proportional to the Bull market through Neither has been the corrective decline from September 2011 through now here in September This tells us that the Bull market through 2011 and correction through 2018 are one degree lower than Cycle degree. They are therefore Primary degree moves, wave (1) up and (2) down. What this means, is Gold remains inside a powerful Cycle degree wave III up Bull market. Significantly higher upside is coming to Gold. Next is Primary degree wave (3) up. This should be impressive.


 up, wave 1-up and 2-down have completed.")

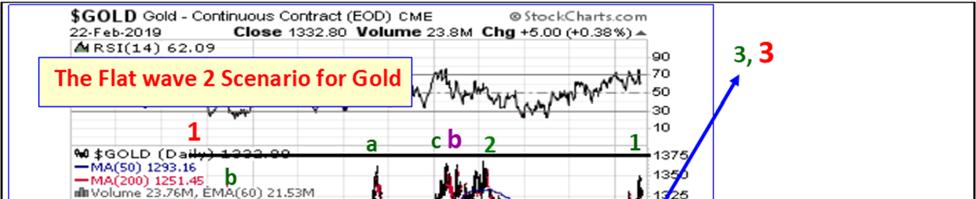
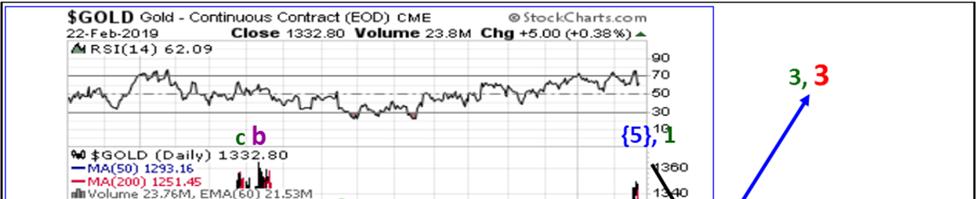
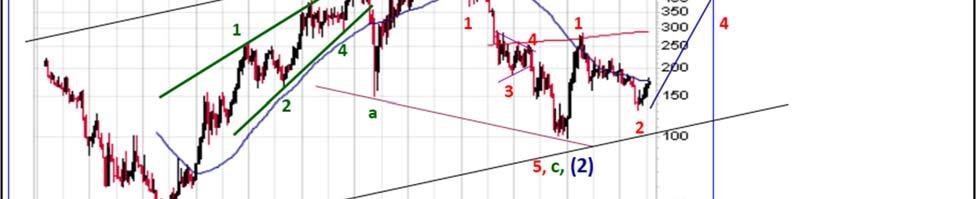
3 The big picture shows that Gold is rising inside a long-term ascending trendchannel for III Up. The first primary degree leg up, wave (1), topped in September From then through 2016, Gold declined in corrective primary degree wave (2) down. Wave (3) up is now underway. Inside (3) up, wave 1-up and 2-down have completed. Gold has started wave 3-up of (3) up. In the charts we show below, the top we are referring to occurring now is subwave 1-up of 3-up. The corrective decline is subwave 2-down of 3-up, which is next.


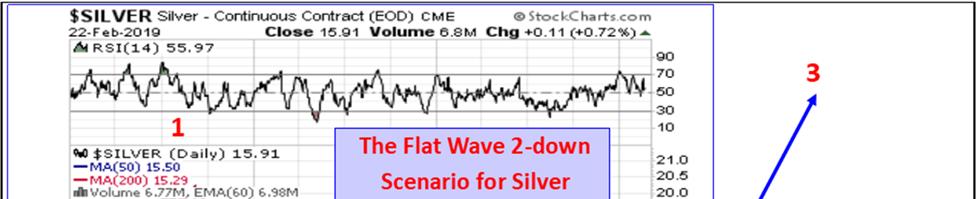
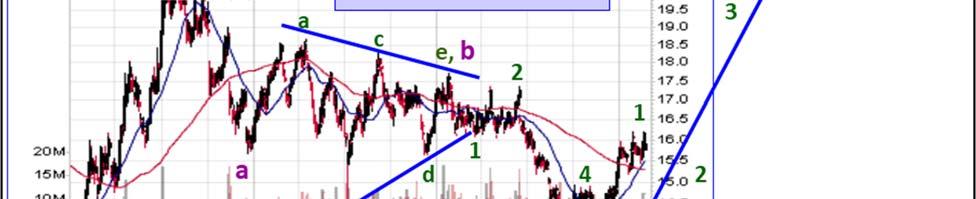
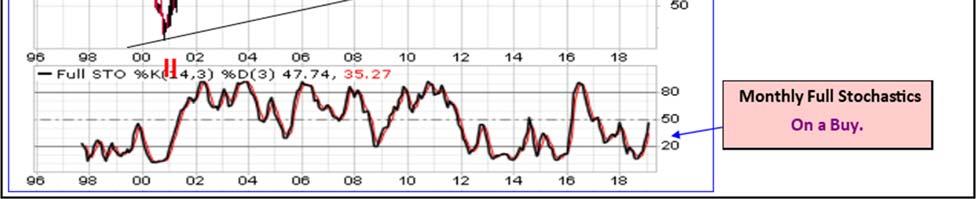
4 But before we show the shorter-term Elliott Wave mapping charts identifying the coming corrective decline, we want to cover a pattern chart that supports the long-term view that Gold is in a Bull market. The next chart below is fascinating and very Bullish. Gold has formed a long-term Inverse Head & Shoulders bottom, with well defined trend-lines acting as boundaries for all the significant bottoms since Gold fell to the rising bottoms trend-line from its low in Predictably, that support line of this pattern held beautifully, meaning Gold can now enjoy a long and powerful Bull Market. The Upside price target for this pattern is 1,600ish. Before that level is reached, there is a coming corrective short-term decline, the key point of this weekend s article. Below we show short-term mapping charts giving a close-up view for Gold, Silver and Mining stocks. Each is completing the first small degree subwave of wave 3-up and is now due for a short-term corrective decline.
5
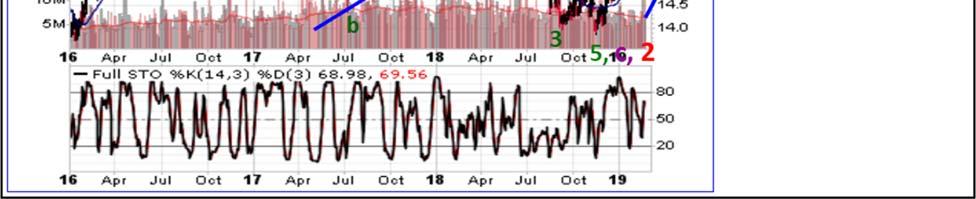
6


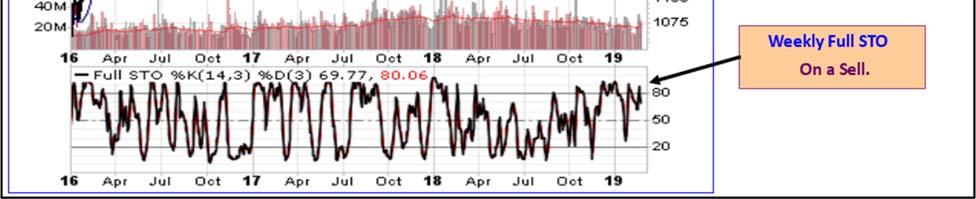
7 Gold prices have a strong correlation with Mining stock prices. At we have developed several proprietary indicators that help us identify when the next significant move is starting for Mining stocks, and in which direction the move will develop. We publish these indicators in every Daily Newsletter to subscribers. When we get new Buy signals in our HUI Mining stock key trend-finder indicators, we will have high confidence the next major Bull market in Mining stocks, as well as Gold, is starting. Let s examine what those Mining stock key indicators are telling us at this time.
 HUI key trend-finder indicators generated a Buy signal on January 30th.")


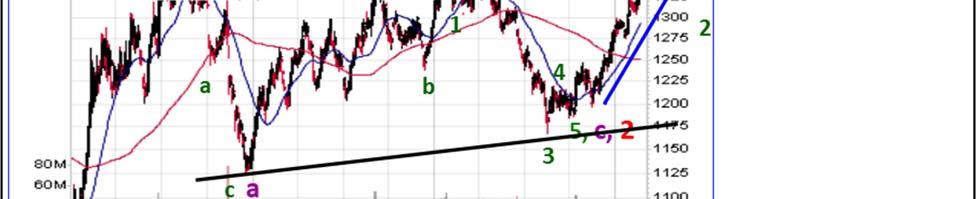
8 Mining stocks have risen sharply since our two component (The HUI 30 day Stochastic and the HUI Purchasing Power Indicator) HUI key trend-finder indicators generated a Buy signal on January 30th. They remain on a Buy signal, as both the HUI 30 day Stochastic and the HUI Purchasing Power Indicator remain on Buy signals this weekend. The Purchasing Power Indicator shown below is a momentum measure that identifies when momentum is powerful enough to expect the object in motion, price, to continue in motion, either up or down. It last triggered a Sell signal back on June 14 th, 2018 and then triggered a Buy signal on January 29 th, 2019 which has led to a strong rally.


9 The next chart below compares the HUI 10-day average Advance/Decline Line Indicator to the HUI price index. What we are looking for are divergences, either Bullish or Bearish between these two measures. When we spot them, they can be nice early warnings of a coming price trend change. This Indicator was a key clue for us back in our September 4 th, 2018 article where we forecast that Gold, Silver and Mining stocks were about to rally sharply. At that time, in that article, we showed this chart had a significant Bullish divergence. Here is the chart we presented back in September 2018:


10 However, in this next chart below, we now see a Bearish Divergence between the HUI and its 10 day average Advance/Decline Line Indicator, warning a declining trend is approaching. That trend may be starting now.


11 The next chart shows our proprietary HUI Demand Power / Supply Pressure Indicator, which gives both Buy and Sell signals. Mining stocks have risen sharply since the HUI Demand Power / Supply Pressure Indicator generated a Buy signal on January 29th. It remains on a Buy signal. However, there is a Bearish Divergence between the HUI and its Demand Power Measure, warning of an approaching top and decline to follow.


12 Once we get new Sell signals in our key indicators, we will have confidence that the corrective decline within the larger degree rising trend will be underway. What the technical charts and analysis is telling us is that there is an impressive rally phase, a strong Bull market, underway now for Gold bugs to enjoy. However, nothing goes straight up, rallies occur in stairstep fashion, and next is a short-term corrective decline. At McHugh s Market Forecast Services at we will be watching this development carefully and will report to our Subscribers when the corrective decline is over and a resumption of the rising trend begins. As traders and investors, we want to be ready and not miss this once in a decade opportunity.
Gold, Mining Stocks on the Verge of a Major Bull Market
 Gold, Mining Stocks on the Verge of a Major Bull Market By Robert McHugh, Ph.D. In looking at the charts for Gold, Silver and Mining Stocks, it is clear that patterns and wave mappings suggest a bottom
SUMMARY DAILY STATISTICS FOR FRIDAY FEBRUARY 6th, Closing Price Demand Supply Purchasing Date SP ASX 200 Power Pressure Power Indicator
 ROBERT D. MCHUGH, JR., Ph.D. Australia Weekend Market Analysis A Publication of Main Line Investors, Inc. P.O. Box 1026 Issue No. 625 Email Address: Kimberton, PA 19442 Friday February 6th, 2009 rmchugh@technicalindicatorindex.com
Market Commentary October 15th th, 2017 U.S. Stocks Approaching a Major Top
 Market Commentary October 15th th, 2017 U.S. Stocks Approaching a Major Top By Robert McHugh, Ph.D. October 15th, 2017 Patterns and wave mappings are warning that a major stock market top is approaching.
SUMMARY DAILY STATISTICS FOR FRIDAY DECEMBER 12th, Closing Price Demand Supply Purchasing Date SP ASX 200 Power Pressure Power Indicator
 ROBERT D. MCHUGH, JR., Ph.D. Australia Weekend Market Analysis A Publication of Main Line Investors, Inc. P.O. Box 1026 Issue No. 591 Email Address: Kimberton, PA 19442 Friday December 12th, 2008 rmchugh@technicalindicatorindex.com
Technical Strategy. Q1 Dollar top as the basis for a sharp correction
 2017 Chart 38. ) DXY with Advance/Decline Line (20 Key Dollar Pairs) Chart 39. ) US Dollar with Presidential Cycle Tactically, we have been bullish US dollar since the May 2016 bottom, which is the base
ROBERT D. MCHUGH, JR., Ph.D. Weekend Market Forecasting and Trading Report
 ROBERT D. MCHUGH, JR., Ph.D. Weekend Market Forecasting and Trading Report An Educational Publication of Main Line Investors, Inc. P.O. Box 1026 Issue No. 3233 Email Address: Kimberton, PA 19442 Friday,
Understanding the Key Support Levels for Gold
 Understanding the Key Support Levels for Gold Gold bulls and inquiring minds are perplexed by last week's mayhem in the precious metals markets. In addition to gold and silver, copper prices also went
REUTERS TECHNICAL ANALYSIS Q1 OUTLOOK WANG TAO
 An employee works in a ferronickel smelter owned by state miner Aneka Tambang Tbk at Pomala district in Indonesia's southeast Sulawesi province March 30, 2011. The country accounts for roughly 7 percent
Pattern Trader - April Trade Analysis, Trade Set-ups and Profit (Loss)
") Pattern Trader - April - 2016 - Trade Analysis, Trade Set-ups and Profit (Loss) Currency Pair: EURJPY Entry Order: SELL stop @ 126.94 Stop loss: 127.57 Take profit: 125.18 Analysis: EURJPY has been going
Pattern Trader - April - 2016 - Trade Analysis, Trade Set-ups and Profit (Loss) Currency Pair: EURJPY Entry Order: SELL stop @ 126.94 Stop loss: 127.57 Take profit: 125.18 Analysis: EURJPY has been going
ChartWorks. PUBLISHED BY INSTITUTIONAL ADVISORS September 7, 2009
 ChartWorks PUBLISHED BY INSTITUTIONAL ADVISORS September 7, 2009 Technical observations of RossClark@shaw.ca Gold... couldn t be better. We ve watched patiently, monitoring the action in anticipation of
Fast Track Stochastic:
 Fast Track Stochastic: For discussion, the nuts and bolts of trading the Stochastic Indicator in any market and any timeframe are presented herein at the request of Beth Shapiro, organizer of the Day Traders
THE ROSEN MARKET TIMING LETTER
 THE ROSEN MARKET TIMING LETTER PRECIOUS METALS - FOREX - STOCK INDICES - COMMODITIES https://www.deltasociety.com/content/ron-rosen-precious-metals-timing-letter RONALD L. ROSEN March 12, 2017 Gold bullion
Compiled by Timon Rossolimos
 Compiled by Timon Rossolimos - 2 - The Seven Best Forex Indicators -All yours! Dear new Forex trader, Everything we do in life, we do for a reason. Why have you taken time out of your day to read this
REUTERS TECHNICAL ANALYSIS Q2 OUTLOOK WANG TAO
 The Irving Oil refinery is photographed at sunset on in Saint John, New Brunswick, March 9, 2014. REUTERS/Devaan Ingraham REUTERS TECHNICAL ANALYSIS Q2 OUTLOOK 2014 - WANG TAO It will be a bearish quarter
Major Trends Update Jan. 10, 2019
 Prepared By Robert Miner, Dynamic Traders Group, Inc. Major Trends Update Jan. 10, 2019 This Major Trends Report of most of the markets we follow on a regular basis in the DT Reports is a summary of the
Gold, Miners and US Dollar - Various Correlations -
 November 5, 2017 Gold, Miners and US Dollar - Various Correlations - Technical observations of RossClark@shaw.ca Gold and silver mining stocks have been underperforming bullion for several months. The
Test Your Chapter 1 Knowledge
 Self-Test Answers Test Your Chapter 1 Knowledge 1. Which is the preferred chart type in LOCKIT? The preferred chart type in LOCKIT is the candle chart because candle patterns are part of the decision-making
13 April US Equity Indices: the land of the bearish rising wedge. Walter Zimmermann United ICAP. US Equity Indices 13 Apr
 - 1-13 April 2015 : the land of the bearish rising wedge Walter Zimmermann United ICAP The market commentary contained in this document represents the opinions of the author. Such opinions are subject
WTI Crude Oil ($WTIC)
") 1 WTI Crude Oil ($WTIC) Monthly While gold is giving us mixed signals, Crude Oil is not (which actually could help in analyzing gold, assuming that Crude Oil and Gold share the same fate and are correlated
1 WTI Crude Oil ($WTIC) Monthly While gold is giving us mixed signals, Crude Oil is not (which actually could help in analyzing gold, assuming that Crude Oil and Gold share the same fate and are correlated
Monthly Dairy Technical Commentary Thursday September 5, 2013
 Monthly Dairy Technical Commentary Thursday September 5, 2013 CME Class III Milk Futures The weekly price trend for Class III Milk points down from its August 2011 high, and the latest breakdown below
Bad Breadth. Market Update August 17, Seattle Technical Advisors
 SeattleTA provides investment managers with This week is options expiration week and mid-august is often better for equities than earlier or later in the month. Stock Traders Almanac reports that for the
Cycle Turn Indicator Direction and Swing Summary. of Select Markets as of the close on. February 9, Daily Swing
 Cycle Turn Indicator Direction and Swing Summary of Select Markets as of the close on February 9, 2018 Market Daily CTI Daily Swing Weekly CTI Weekly Swing Industrial Negative High Negative High Transports
Stocks, Bonds, U.S. Dollar Index, Precious Metals and Special Opportunities Updated Every Monday, Wednesday and Friday (except U.S.
 Stocks, Bonds, U.S. Dollar Index, Precious Metals and Special Opportunities Updated Every Monday, Wednesday and Friday (except U.S. Holidays) The SM is service marked and copyrighted by Elliott Wave International
ARE YOU READY, HISTORY REPEATS AND WE REMAIN IGNORANT
 WEEKLY FINANCIAL NEWSLETTER ARE YOU READY, HISTORY REPEATS AND WE REMAIN IGNORANT Dear Members, Many market pundits came to predict market trend with their own theories. For example, the Black Swan theory
Why Is Gold Not Much, Much Higher?
 Why Is Gold Not Much, Much Higher? by Jonathan Davis 24th March 2017 Practically everything that could have been said about gold has been said. You know that the market bottomed around the year 2000 at
10-Year Treasury Notes ($UST Price)
") 1 Weekly Inter-market Technical Report 10-Year Treasury Notes ($UST Price) Monthly Continuing from last week's report, bonds (notes) appear to be on a strong buy signal on the monthly chart, as price is
1 Weekly Inter-market Technical Report 10-Year Treasury Notes ($UST Price) Monthly Continuing from last week's report, bonds (notes) appear to be on a strong buy signal on the monthly chart, as price is
Cycle Turn Indicator Direction and Swing Summary. of Select Markets as of the close on. May 18, Daily Swing
 Cycle Turn Indicator Direction and Swing Summary of Select Markets as of the close on May 18, 2018 Market Daily CTI Daily Swing Weekly CTI Weekly Swing Industrial Neutral Low Positive Low Transports Positive
THE CHAPMAN REPORT FOR DECEMBER 22, 2008
 THE CHAPMAN REPORT FOR DECEMBER 22, 2008 Charts and technical commentary by David Chapman Union Securities Ltd, 33 Yonge Street, Suite 901, Toronto, Ontario, M5E 1G4 fax (416) 604-0533, (416) 604-0557,
Weekly Commodity Update Metals & Energy 8 th March Geofin Comtrade Ltd. GEOFIN RESEARCH DESK
 Weekly Commodity Update Metals & Energy 8 th March 2016 Geofin Comtrade Ltd. CONTENTS Currency Dollar Index, USD INR Precious Metals Gold, Silver Energy Crude Oil, Natural Gas Base Metals Copper, Nickel,
Weekly outlook for Mar
 Weekly outlook for Mar. 26 30 2018 Summary The S&P500 index is expected to test February's low first and bounce from it before the Good Friday holiday. The end of the month and the end of the quarter may
Market Insights End of the Year Trading Market Overview/Analysis. A technical overview of the holiday period.
 Market Insights 2018 End of the Year Trading Market Overview/Analysis By Alistair Schultz, Dealing Operations A technical overview of the holiday period. Markets have been relatively stable throughout
CMT LEVEL I CURRICULUM Self-Evaluation
 CMT LEVEL I CURRICULUM Self-Evaluation DEAR CFA CHARTERHOLDER, As a CFA charterholder, the requirement that you sit for the CMT Level I exam is waived. However, the content in the CMT Level I Curriculum
Trading Patterns For Stocks And Commodities
 Trading Patterns For Stocks And Commodities It doesn t matter if you are a long-term investor, short swing trader or day trader, you are always looking for an advantageous spot to enter your position.
DAILY TECHNICAL REPORT MA S-TERM. 16 December, 2011 L-TERM MULTI-WEEK OBJECTIVES/COMMENTS ENTRY LEVEL STRATEGY/ POSITION
 MA S-TERM MULTI-DAY Please note: None of the strategies below represent trading advice or trading recommendations of any kind. Please refer to our full disclaimer. L-TERM MULTI-WEEK STRATEGY/ POSITION
Pattern Trader - November Trade Analysis, Trade Set-ups and Profit (Loss)
") Pattern Trader - November - 2015 - Trade Analysis, Trade Set-ups and Profit (Loss) Instrument: S&P 500 (US500) Entry Order: SELL stop @ 2078.00 Stop loss: 2130.00 Take profit: 1975.00 Analysis: This market
Pattern Trader - November - 2015 - Trade Analysis, Trade Set-ups and Profit (Loss) Instrument: S&P 500 (US500) Entry Order: SELL stop @ 2078.00 Stop loss: 2130.00 Take profit: 1975.00 Analysis: This market
1 P a g e. Executive Summary
 Executive Summary Based on this week s deduction of observable facts, we continue to favor the major a at SPX 1867, major b at SPX 2021 and major c down to SPX 1830-1850ies around October 9-12. How exactly
Big Picture report April 2 nd 2012
 Big Picture report April 2 nd 2012 Francesco Maggioni francesco.maggioni@gmail.com +39 393 70 40 234 Quantitative approach for asymmetric results Time to downshift exposure in equities? Who is lying? SP500
Technical analysis & Charting The Foundation of technical analysis is the Chart.
 Technical analysis & Charting The Foundation of technical analysis is the Chart. Charts Mainly there are 2 types of charts 1. Line Chart 2. Candlestick Chart Line charts A chart shown below is the Line
Technical Analysis. Weekly Comment. Global. SPX Overbought Relief Rally in Europe!! Equities Sales Trading Commentary
 h Technical Analysis Equities Sales Trading Commentary Weekly Comment Global Michael Riesner Marc Müller 03/07/2012 michael.riesner@ubs.com marc.mueller@ubs.com +41-44-239 1676 +41-44-239 1789 SPX Overbought
To fully understand the dramatic turns in the financial markets that
 01_chap_murphy.qxd 10/24/03 2:06 PM Page 1 CHAPTER 1 A Review of the 1980s To fully understand the dramatic turns in the financial markets that started in 1980, it s necessary to know something about the
Dynamic Trader Daily Report Comprehensive Analysis and Education For the Serious Trader and Investor
 Dynamic Trader Daily Report Comprehensive Analysis and Education For the Serious Trader and Investor Published By Monday, February 07, 2000 Dynamic Traders Group, Inc. DynamicTraders.com dt@dynamictraders.com
THE ROSEN MARKET TIMING LETTER
 THE ROSEN MARKET TIMING LETTER PRECIOUS METALS - FOREX - STOCK INDICES - COMMODITIES RONALD L. ROSEN March 18, 2019 rrosen5@tampabay.rr.com FREEBIE # 2 THE FINALE ---------------------------------------
This article is taken from the notes of my trading log for a closed and open trade in the platinum
 Time, price and pattern by Robert Miner This article is taken from the notes of my trading log for a closed and open trade in the platinum market. My trading plan is three-dimensional. I look for coincidences
THIS IS JUST THE BEGINNING
 THIS IS JUST THE BEGINNING The following is an extract from the December 07 Issue of The Global Speculator sent to subscribers on the 4 th of January 2008. As many of you are already aware the Gold price
THE HIGHTOWER REPORT
 Futures Analysis & Forecasting HightowerReport.com November 30, 2018 Metals Market Update Long Gold - A Trade for All Seasons? Signs of a key bottom in both gold and silver continue to surface, and prices
SPX for the smaller major-4 triangle or SPX to complete the double zigzag. Figure 1.
 Today s break -finally- below SPX2625 (and SPX2613) places the Ball now firmly in the Bears camp, albeit today s strong rally off the lows. And the two main bear counts remain the focus for now: SPX2579-2568
March 16, Dear Investors:
 March 16, 2019 Crescat Capital LLC 1560 Broadway Denver, CO 80202 (303) 271-9997 info@crescat.net www.crescat.net Dear Investors: At Crescat we remain positioned to capitalize on a downturn in the economic
NEM BSBS today but no entry. For newcomers, this is an excellent example on the difference between a signal and a set up. We have a buy signal today.
 Gold update March 25/2006 A note to new subscribers and a reminder to existing subscribers: we trade the signals and not the analysis. Traders simply buy when we have a buy signal, and exit on a TLB (trendline
THE ROSEN MARKET TIMING LETTER
 THE ROSEN MARKET TIMING LETTER PRECIOUS METALS - FOREX - STOCK INDICES - COMMODITIES https://www.deltasociety.com/content/ron-rosen-precious-metals-timing-letter RONALD L. ROSEN December 17, 2015 SPECIAL
Daily Flash News
 Daily Flash News Issue: 3049 8 August 2014 Friday s Flashnews for all major markets Dear Members, Today I am just writing ranges as I am will be busy doing Pooja for 12 hours starting at 7.00 AM. In India
Flash Report Silver. follow me October 29 th, Quantitative approach for asymmetric results. Silver: investors on a verge of a nerve crisis
 Flash Report Silver follow me October 29 th, 2014 Francesco Maggioni francesco.maggioni@gmail.com IT +39 393 70 40 234 UK +44 757 681 62 43 Quantitative approach for asymmetric results Silver: investors
Pattern Trader - Trade Analysis, Trade Set-ups and Profit (Loss)
") Pattern Trader - Trade Analysis, Trade Set-ups and Profit (Loss) Currency Pair: GBPJPY Entry Order: SELL stop @ 133.56 Stop loss: 134.18 Take profit: 131.87 Analysis: Last night's pending order was not
Pattern Trader - Trade Analysis, Trade Set-ups and Profit (Loss) Currency Pair: GBPJPY Entry Order: SELL stop @ 133.56 Stop loss: 134.18 Take profit: 131.87 Analysis: Last night's pending order was not
Tracking the Daily Market Averages
 Tracking the Daily Market Averages Your Most Important and Profitable Investing Skill Tracking the market s direction is a powerful key to successful investing. If you trade in sync with the market, take
SUMMARY OF INDEX DAILY CLOSINGS FOR FRIDAY, DECEMBER 18th, 2015
 ROBERT D. MCHUGH, JR., Ph.D. Weekend Market Forecasting and Trading Report An Educational Publication of Main Line Investors, Inc. P.O. Box 1026 Issue No. 2739 Email Address: Kimberton, PA 19442 Friday,
Technical Analysis. Weekly Comment. Global. Wave 5 in SPX Underway Don t Chase USDJPY! Equities Sales Trading Commentary
 h Technical Analysis Weekly Comment Equities Sales Trading Commentary Global Michael Riesner Marc Müller 12/03/2013 michael.riesner@ubs.com marc.mueller@ubs.com +41-44-239 1676 +41-44-239 1789 Wave 5 in
QUICK PIVOT FRIDAY, JANUARY 7, 2011 BOB HOYE PUBLISHED BY INSTITUTIONAL ADVISORS. Surreal Policymakers Are Blowing Serial Bubbles
 QUICK PIVOT FRIDAY, JANUARY 7, 2011 BOB HOYE PUBLISHED BY INSTITUTIONAL ADVISORS Surreal Policymakers Are Blowing Serial Bubbles The above is more a sarcastic observation than a title for this edition.
Another Three Go Down
 Published by TFNN, Corp. ~ 601 Cleveland Street, Ste 618 Clearwater, FL 33755 ~ 1-877-518-9190 ~ http://www.tfnn.com ~ Copyright 2010 ~ All Rights Reserved Another Three Go Down Patterns Profits & Peace
And the Oscar goes to
 Published by TFNN, Corp. ~ 601 Cleveland Street, Ste 618 Clearwater, FL 33755 ~ 1-877-518-9190 ~ http://www.tfnn.com ~ Copyright 2010 ~ All Rights Reserved 02-28-11 And the Oscar goes to Hank Paulson,
Cycle Turn Indicator Direction and Swing Summary. of Select Markets as of the close on. April 2, Daily CTI. Swing
 Cycle Turn Indicator Direction and Swing Summary of Select Markets as of the close on April 2, 2019 Market Daily CTI Daily Swing Weekly CTI Weekly Swing Industrial Positive Low Positive Low Transports
Leavitt Brothers Weekly Sunday, February 28, 2016
 Leavitt Brothers Weekly Sunday, February 28, 2016 Join our email list and get reports just like this send directly to you. http://www.leavittbrothers.com/email-subscribe.cfm Overall the market did well
1 P a g e. Executive Summary
 Executive Summary Price finally reached our expect SPX2112-2120 and the negative divergences that started to creep in on the daily TIs finally also took their toll over the past 2 days. The weekly charts
The Performance of Our Secondary Trend Indicator (a.k.a Technical Indicator Index)
") The Performance of Our Secondary Trend Indicator (a.k.a Technical Indicator Index) By Robert McHugh, Ph.D. March 10th, 2012 Our Market Analysis service specializes in presenting several Indicators designed
The Performance of Our Secondary Trend Indicator (a.k.a Technical Indicator Index) By Robert McHugh, Ph.D. March 10th, 2012 Our Market Analysis service specializes in presenting several Indicators designed
The Investors Newsletter
 I N S I D E T H I S I S S U E 1 Perspectives 2 Summary of Indexes 3 Fundamentals & Indicators 4 Index Chart & Analysis economic reports from the past quarter are not indicating the push into higher prices
Gold Outlook. Bear bug hits gold!!! CMP - $1150. ICICI Securities Ltd. Retail Equity Research. November 5, 2014
 Gold Outlook. Gold price performance of last 5 years 44% -36% 30% 10% 7% -28% -5% 2010 2011 2012 2013 YTD Year 2014 Bear bug hits gold!!! CMP - $1150 Global commodity prices have remained in a downward
Intelligent Investing, LLC Major Indices Daily Update 02/26/ 19
 Elliot Wave Updates Yesterday I found a move below last Friday s high (SPX2794.20) will be a first sign of lower prices as then the decline can t be a 4 th wave because 4 th and 1 st waves can t overlap
Daily Flash News
 Daily Flash News 2043 27 March 2014 Thursday s Flash-news (Unedited) Dear Members, On Wednesday once again, the US market fell sharply on the selling pressure. Big tech names, especially social networks
THE ROSEN MARKET TIMING LETTER
 THE ROSEN MARKET TIMING LETTER PRECIOUS METALS - FOREX - STOCK INDICES - COMMODITIES https://www.deltasociety.com/content/ron-rosen-precious-metals-timing-letter RONALD L. ROSEN June 21, 2018 REPORT --------------------------
Does Gold Still have Room to Run?
 Does Gold Still have Room to Run? By Teresa Fernandez November 16, 2010 The Futures Volume Open Interest (FVOI) Indicator will tell you. Many investors have a hesitancy about investing in gold. Memories
Icoachtrader Consulting Service WELCOME TO. Trading Boot Camp. Day 5
 Icoachtrader Consulting Service www.icoachtrader.weebly.com WELCOME TO Trading Boot Camp Day 5 David Ha Ngo Trading Coach Phone: 1.650.899.1088 Email: icoachtrader@gmail.com The information presented is
Weekly MCX Research Report BULLIONS WEEKLY TECHNICAL LEVELS GOLD(APRIL) MCX WEEKLY CHART
 MCX WEEKLY CHART") Weekly MCX Research Report BULLIONS WEEKLY TECHNICAL LEVELS GOLD(APRIL) MCX WEEKLY CHART 26/02/2018-02/02/2018 S1 30336 S2 30167 PP 30564 R1 30733 R2 30961 TECHNICAL/FUNDAMENTAL VIEW - Gold market continue
Weekly MCX Research Report BULLIONS WEEKLY TECHNICAL LEVELS GOLD(APRIL) MCX WEEKLY CHART 26/02/2018-02/02/2018 S1 30336 S2 30167 PP 30564 R1 30733 R2 30961 TECHNICAL/FUNDAMENTAL VIEW - Gold market continue
Risk and reward 12/28/2008
 Risk and reward 12/28/2008 Since our major sell signal was confirmed on 1/31 this year, we adopted a cautious stance and that has helped us sidestepping a devastating global equity collapse which likely
Save Our Gold : A few thoughts on the Swiss Gold initiative
 Background In an attempt to halt the slide into an ever depreciating fiat currency, there has been a movement in Switzerland to return the Swiss franc to a hard asset backed currency, a currency backed
The Hackett Money Flow Commodity Report November 3, 2016
 Growing Financial Success CONTENTS The US Dollar Is Setting Up for A major Bull Market Peak In The First Half of 2017 To Set Off a Terminal Bear market Decline. Look For Downside Volatility Into Year End
Inter-market Technical Analysis for April 22, Summary Chart TheoTrade LLC. All rights reserved.
 1 Weekly Inter-market Technical Report Summary Chart 1 2018 TheoTrade LLC. All rights reserved. 2 Intraday Intermarket Volatility is returning to the markets, particularly with the collapse/sell-swing
Gold and Gold Stocks Patterns, Cycles and Insider Activity, Part 1 December 27, 2017 Author Pater Tenebrarum
 Gold and Gold Stocks Patterns, Cycles and Insider Activity, Part 1 December 27, 2017 Author Pater Tenebrarum Repeating Patterns and Positioning A noteworthy confluence of patterns in gold and gold stocks
Daily Flash News
 Daily Flash News 5 2032 14 March 2014 Friday s Flash news: (Unedited copy) Today our offer will expire Dear Members, On Thursday most of markets traded negative, selloff was witnessed in European and USA
ROBERT D. MCHUGH, JR., Ph.D. FINANCIAL MARKETS FORECAST & ANALYSIS A Publication of Main Line Investors, Inc.
 ROBERT D. MCHUGH, JR., Ph.D. FINANCIAL MARKETS FORECAST & ANALYSIS A Publication of Main Line Investors, Inc. Visit Our Website at www.technicalindicatorindex.com Assessing the Quality of the Equity Rally
Forex Sentiment Report Q2 FORECAST WEAK AS LONG AS BELOW April
 Forex Sentiment Report 08 April 2015 www.ads-securities.com Q2 FORECAST WEAK AS LONG AS BELOW 1.1200 Targets on a break of 1.1534/35: 1.1740/50 1.1870/75 1.2230/35 Targets on a break of 1.0580/70: 1.0160
Pattern Trader - December Trade Analysis, Trade Set-ups and Profit (Loss)
") Pattern Trader - December - 2016 - Trade Analysis, Trade Set-ups and Profit (Loss) Pair: XAUUSD (spot Gold) Entry Order: BUY stop @ 1177.00 Stop loss: 1167.00 Take profit: 1192.00 Trade Risk Profile: 0.50%
Pattern Trader - December - 2016 - Trade Analysis, Trade Set-ups and Profit (Loss) Pair: XAUUSD (spot Gold) Entry Order: BUY stop @ 1177.00 Stop loss: 1167.00 Take profit: 1192.00 Trade Risk Profile: 0.50%
Cycle Turn Indicator Direction and Swing Summary. of Select Markets as of the close on. April 10, 2018
 Cycle Turn Indicator Direction and Swing Summary of Select Markets as of the close on April 10, 2018 Market Daily CTI Daily Swing Weekly CTI Weekly Swing Industrial Positive Low Negative High Transports
4 th September, DGCX- on the move:
 DGCX- on the move: 4 th ember, Gold and silver- post a weekly gain of 0.24% and 4.84% respectively. US dollar exhibited mixed behavior - rising against the Japanese yen by 0.4% but falling against GBP
Schogt Market Timing
 MMA WEEKLY COMMENTS AND TRADE RECOMMENDATIONS FOR WEEK OF JANUARY 31, 2011 Weekly Analysis - All Markets Comments: Please take a moment to view my weekly geocosmic comments on the stock market, at http://www.mmacycles.com/artweek.htm.
JULY 2014 ISSUE *** Reports are similar to that of the FED minutes. Only minor changes to the outlook take place each month along with updated charts.
 MARKET TREND JULY 2014 ISSUE *** Reports are similar to that of the FED minutes. Only minor changes to the outlook take place each month along with updated charts. S&P 500 Monthly Chart BIG PICTURE INNER-Market
Daily Flash News
 Daily Flash News 2034 18 March 2014 Tuesday s Flash news Dear Members, On Monday stocks rebounded strongly and commodities as predicted. Currencies traded mix and Treasury bond remained directionless.
Patterns Profits & Peace of Mind - Page 1-01/18/11
 Published by TFNN, Corp. ~ 601 Cleveland Street, Ste 618 Clearwater, FL 33755 ~ 1-877-518-9190 ~ http://www.tfnn.com ~ Copyright 2010 ~ All Rights Reserved 01-18-11 In last week's letter, I mentioned how
The law of Supply and Demand
 The law of Supply and Demand I have been trading for more than 25 years. What I have discovered in that time span is one of the best and most actuate tools in trading is the relationship between price
INTERMEDIATE EDUCATION GUIDE
 INTERMEDIATE EDUCATION GUIDE CONTENTS Key Chart Patterns That Every Trader Needs To Know Continution Patterns Reversal Patterns Statistical Indicators Support And Resistance Fibonacci Retracement Moving
Martin Pring s. Weekly InfoMovie Report. April 8, 2014
 Martin Pring s Weekly InfoMovie Report April 8, 2014 Issue 1093 Weekly InfoMovie Report 1 Key level remains $184 on the SPY. US Equity Market - Last time I pointed out that the $184 level on the S&P ETF
Daily Flash News
 5 2019 5 March 2014 Dear Members, Wednesday s Flash news: (Unedited copy) This headline was given on Monday s flashnews: Buy USA, Indian market and sell commodities on Monday Tuesday was one of the best
Has Oil Bottomed yet?
 November 14, 2014 Has Oil Bottomed yet? Oil has bottomed intermediate-term. The next move is a bounce to the area of at least $100/barrel within a span of ~12 months. Once that upside completes, oil will
Market Turning Points By Andre Gratian
 Market Turning Points By Andre Gratian June 21, 2015 Precision timing for all time frames through a multi-dimensional approach to forecasting using technical analysis: Cycles - Breadth - P&F and Fibonacci
Global Bear Market at our Doorstep?
 6 June 2012 Global Bear Market at our Doorstep? by William Cai, Vice President, Personal Financial Services This article was featured in the Jun 2012 issue of The Business Times. Below is the original
MONTHLY NEWSLETTER SEPTEMBER 2018
 MONTHLY NEWSLETTER SEPTEMBER 2018 Since bottoming out toward the end of march and even with the volatility, we are still approaching all time highs at the time of this newsletter. Still plenty of events
Intermediate Outlook July 13-20, 2009 Jim Curry, Publisher
 Intermediate Outlook July 13-20, 2009 Jim Curry, Publisher S&P 500 CASH S&P 500 Cash Index - 07/17/09 Close - 940.38 SPX CASH: 5-Day Projected Support and Resistance levels: High - 976; Low - 908 SEPT
The Dow Theory in Technical Analysis
 The Dow Theory in Technical Analysis INTRODUCTION Today Foreign Exchange Market is one of the popular segments of the global financial market. FOREX is the largest and the most liquid financial market
Pattern Trader - December Trade Analysis, Trade Set-ups and Profit (Loss)
") Pattern Trader - December - 2015 - Trade Analysis, Trade Set-ups and Profit (Loss) Currency Pair: GBPJPY Entry Order: SELL stop @ 184.92 Stop loss: 185.37 Take profit: 181.18 Analysis: Since forming a
Pattern Trader - December - 2015 - Trade Analysis, Trade Set-ups and Profit (Loss) Currency Pair: GBPJPY Entry Order: SELL stop @ 184.92 Stop loss: 185.37 Take profit: 181.18 Analysis: Since forming a
THE ROSEN MARKET TIMING LETTER PRECIOUS METALS - FOREX - STOCK INDICES - COMMODITIES. REPORT $21.44
 THE ROSEN MARKET TIMING LETTER PRECIOUS METALS - FOREX - STOCK INDICES - COMMODITIES trendpl@triad.rr.com RONALD L. ROSEN April 2018 REPORT -------------------------- $21.44 GCF of 21 and 44 - Greatest
Martin Pring s. Weekly InfoMovie Report. December 27, Happy New Year to Our Wonderful Subcriber Family! May 2013 be Prosperous and Productive!
 Martin Pring s Weekly InfoMovie Report December 27, 2012 Issue 1028 Happy New Year to Our Wonderful Subcriber Family! May 2013 be Prosperous and Productive! The Pring Family ~ 2012 Weekly InfoMovie Report
What Is Driving The Metal Markets?
 What Is Driving The Metal Markets? In all likelihood, Mark Twain did not have metal markets in mind when he said, history does not repeat itself, but it does rhyme Nevertheless, it seems as though we are