For personal use only
|
|
|
- Coral Davidson
- 5 years ago
- Views:
Transcription

1 STOCK EXCHANGE LISTINGS: NEW ZEALAND (MCY) / AUSTRALIA (MCY) NEWS RELEASE Investor Roadshow Presentation November November 2016 Mercury will be giving presentations at a series of international investor meetings during November The presentation materials are attached. ENDS For further information: David Glendining Head of Communications T Tim Thompson Investor Relations/Treasury T ABOUT MERCURY NZ LIMITED At Mercury we re thinking boldly about the possibilities with energy and inspiring New Zealanders with our renewable electricity and ideas making energy wonderful. Energy from Mercury s hydro and geothermal stations will power a brighter future for our country. Visit us at:

2 Mercury Investor Roadshow FRASER WHINERAY Chief Executive WILLIAM MEEK Chief Financial Officer 22 November 2016
3 DISCLAIMER This presentation has been prepared by Mercury NZ Limited and its group of companies ( Company ) for informational purposes. This disclaimer applies to this document and the verbal or written comments of any person presenting it. Information in this presentation has been prepared by the Company with due care and attention. However, neither the Company nor any of its directors, employees, shareholders nor any other person gives any warranties or representations (express or implied) as to the accuracy or completeness of this information. None of the Company, its directors, employees, shareholders or any other person shall have any liability whatsoever to any person for any loss (including, without limitation, arising from any fault or negligence) arising from this presentation or any information supplied in connection with it. This presentation may contain projections or forward-looking statements regarding a variety of items. Such projections or forward-looking statements are based on current expectations, estimates and assumptions and are subject to a number of risks, and uncertainties, including material adverse events, significant one-off expenses and other unforeseeable circumstances, such as, without limitation, hydrological conditions. There is no assurance that results contemplated in any of these projections and forward-looking statements will be realised, nor is there any assurance that the expectations, estimates and assumptions underpinning those projections or forward looking statements are reasonable. Actual results may differ materially from those projected in this presentation. No person is under any obligation to update this presentation at any time after its release or to provide you with further information about the Company. A number of non-gaap financial measures are used in this presentation, which are outlined in the appendix of the presentation. You should not consider any of these in isolation from, or as a substitute for, the information provided in the audited consolidated financial statements, which are available at The information in this presentation is of a general nature and does not constitute financial product advice, investment advice or any recommendation. The presentation does not constitute an offer to sell, or a solicitation of an offer to buy, any security and may not be relied upon in connection with the purchase or sale of any security. Nothing in this presentation constitutes legal, financial, tax or other advice. 2 DISCLAIMER

4 3 COUNTRY, INDUSTRY & MERCURY
5 NEW ZEALAND ECONOMIC OVERVIEW Key Facts Credit Rating: AA/stable Population: 4.7 million Currency: New Zealand Dollar (NZD) GDP: NZ$250 billion NEW ZEALAND GDP BY SECTOR Services Sector Manufacturing, Energy & Construction Agriculture, Forestry & Fishing Mining Other > Stable political environment > National government since 2008 and in 3 rd term > Robust GDP growth achieved over recent years (currently 3.6% 1 ), with below-trend unemployment (currently 4.9% 2 ) Current supportive drivers of GDP growth include: > Strong tourism growth > Robust construction sector activity > Robust house price growth > Low interest rate environment (1.75% cash rate) > Historic high net migration (60,000 net annual inflows or 1.3%) Factors dampening GDP growth include: > Global geopolitical and growth concerns > Slower growth profile for China and East Asia > Canterbury rebuild activity at peak > Inflation expected to stay below central bank target (1-3%) over the near-term (currently 0.4% 2 ) 4 COUNTRY 1 Year to 30 June Year to 31 September 2016


6 NEW ZEALAND S COMPETITIVE ADVANTAGE IN ELECTRICITY RENEWABILITY NZ 3 rd highest level of renewable electricity generation in OECD COMPETITIVENESS Among the most competitive markets in the world RELIABILITY NZ ranks 3 rd lowest out of 25 large energy-consuming countries for energy security risk 5 COUNTRY Source: Accenture, Ministry of Business, Innovation & Employment, United States Chamber of Commerce
 > Solar installed in 11,500 or 0.")
 is owner and operator > Transports high voltage electricity to networks and large industrial users > 1200MW HVDC link between South and North")
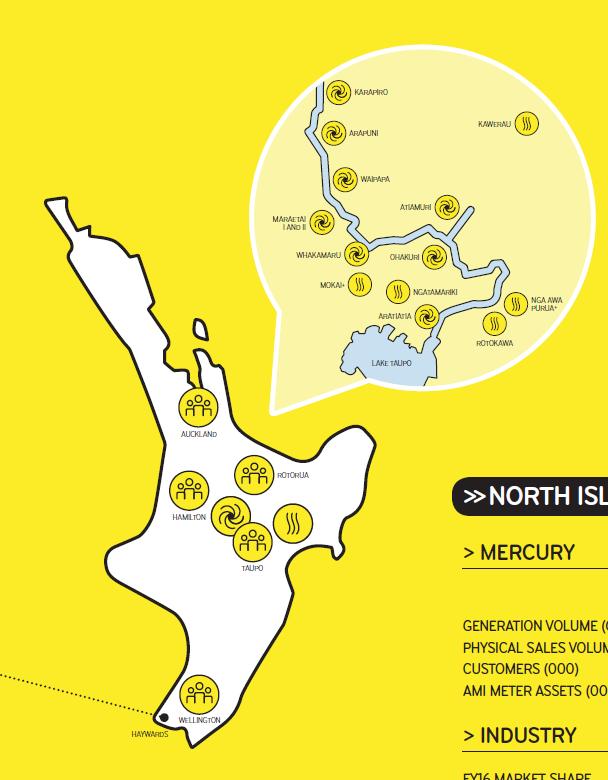
7 THE INDUSTRY WE OPERATE IN 1. GENERATORS > Generate electricity and sell to wholesale market > 5 major generators producing about 95% of NZ s electricity > 80% renewable electricity (unsubsidised) > Solar installed in 11,500 or 0.6% of total customer connections 2. THE NATIONAL GRID > Transpower (State-owned Enterprise) is owner and operator > Transports high voltage electricity to networks and large industrial users > 1200MW HVDC link between South and North Islands DISTRIBUTION AND NETWORK OWNERS > 15,000km of overhead and underground networks > 29 distribution companies > Regulated monopolies RETAILERS AND CONSUMERS > 22 retailers buy from wholesale market and onsell to nearly 2 million consumers > Retail prices determined by competition (unregulated) > Electricity Authority responsible for promoting competition, efficiency and reliability of supply for longterm benefit of consumers > NZAS (aluminium smelter) 13% of national demand > 2 major metering companies with national smart meter penetration of 69% 6 INDUSTRY
8 For personal GWh use only Korea Israel Hungary Czech Republic Netherlands United States Australia Poland Estonia Mexico France Japan Belgium Slovak Republic United Kingdom Ireland Greece Slovenia Luxembourg Germany Turkey Spain Italy Chile Finland Portugal Denmark Switzerland Sweden Canada Austria New Zealand Norway Iceland % UNSUBSIDISED RENEWABLE ELECTRICITY MARKET NEW ZEALAND S GENERATION MIX Hydro Wind Coal Gas Waste Heat/Biogas, Oil and Wood Geothermal 50,000 45,000 40,000 35,000 30,000 25,000 20,000 15,000 10,000 5, OECD RENEWABLE ELECTRICITY INDUSTRY Source: Ministry of Business, Innovation & Employment, IEA

9 Norway United States Korea Mexico Switzerland Finland Sweden Luxembourg New Zealand France United Kingdom Estonia Netherlands Austria Belgium Chile Japan Slovenia Czech Republic Ireland Hungary Greece Denmark Italy Turkey Slovak Republic Poland Germany Portugal US$ per kwh COMPETITIVE RETAIL MARKET 2015 OECD RESIDENTIAL ELECTRICITY PRICES INDUSTRY 1 Residential pricing in US dollars per unit using Purchase Price Parity (PPP) Source: Ministry of Business, Innovation & Employment, IEA, Accenture
10 REGULATORY Market > Government and opposition parties constructively engaged in policy discussions > Consultation continues on changes to the methodology for recovering the cost of transmission (Transmission Pricing Methodology - TPM) with implementation likely beyond 2019 > Additional Mercury charges minor (indicatively assessed by Electricity Authority at ~$5m/annum) > Regulatory focus on reforms to distribution pricing in response to emerging technology Water > No charge for use of water for hydro generation > Consultation at national and regional levels regarding water quality standards and long-term water management > Government has established a technical advisory group to advise on water allocation approaches to address Maori rights and interests Climate > Carbon cost expected to increase with the removal of the transitional 2-for-1 surrender obligations under the NZ Emissions Trading Scheme (ETS) > Carbon pricing has increased 250% through FY2016 to circa $18/t > Government announced policy package to promote the adoption of EVs - target 64,000 vehicles by INDUSTRY


11 INTEGRATED ELECTRICITY GENERATOR & RETAILER 10 MERCURY
12 OUR PURPOSE Inspiring New Zealanders to enjoy energy in more wonderful ways Inspiring New Zealanders We want to inspire New Zealanders by delivering value, innovation and outstanding experiences To enjoy energy We want our customers to enjoy what energy does for them and choose Mercury because we make a positive difference in their lives In more wonderful ways We will bring new technology and ideas to create wonderful experiences for our customers in a uniquely New Zealand context OUR GOAL To be New Zealand s leading energy brand OUR STRATEGY Mercury will create long term value for our owners by: Delivering customer advocacy Outstanding customer experience Leading digital offerings Culture-driven innovation Leveraging core strengths Operational efficiency Astute portfolio management Efficient capital allocation Delivering sustainable growth Executing relevant strategic opportunities Being ready for domestic growth Embracing emerging technologies 11 MERCURY
 Waikato Hydro System is the largest series of peaking stations in the North Island Rain-fed North Island hydro")
13 MERCURY S COMPETITIVE ADVANTAGE 100% renewable generation with two low-cost complementary fuel sources in base-load geothermal and peaking hydro North Island generation is uniquely located close to major load centres and not dependent on the inter-island transmission link (HVDC) Waikato Hydro System is the largest series of peaking stations in the North Island Rain-fed North Island hydro catchment with inflows correlated with winter peak demand (unlike South Island) Building a track record of customerled innovation and rewarding loyalty Long-term commercial partnerships with Maori landowners and other key stakeholders 12 MERCURY

14 13 MARKET DYNAMICS
15 NZ Energy Margin NEW ZEALAND ELECTRICITY SUPPLY > Rationalisation of thermal capacity within FY2016 has resulted in supply and demand being better balanced > Mercury closed 140MW Southdown power station in December 2015 > Contact Energy closed 400MW Otahuhu B power station in September 2015 > Genesis s Huntly Rankine units contracted through 2022 ensuring energy security > Ultimate future linked to on-going operation of the New Zealand Aluminium Smelter (NZAS) NZ ENERGY MARGIN 30% 25% 20% 15% 10% Margin - Likely Generation Development Margin - 2 Huntly Rankine Units Margin Security Standard 5% 0% Calendar Year 14 MARKET DYNAMICS Source: Transpower, Mercury
16 GWh GWh NEW ZEALAND ELECTRICITY DEMAND > High net migration and GDP per capita growth more than offsetting reductions in per household consumption resulting from efficiency gains > Highest demand on record for FY2016 and increases over the past two financial years relative to pcp > Demand up 0.3% in FY2016, 0.6% after normalising for temperature > Solar remains a niche customer proposition > Solar installed in 11,500 or 0.6% of total customer connections ANNUAL ELECTRICITY DEMAND AND GROWTH RATE Annual Growth Rate (RHS) Consumption (LHS) 44,000 42,000 40,000 38,000 36,000 34,000 32,000 30,000 Financial Year 4% 3% 2% 1% 0% -1% -2% -3% TEMPERATURE ADJUSTED SEGMENT ELECTRICITY DEMAND 14,000 12,000 10,000 8,000 6,000 4,000 2,000 0 Urban* Rural* Dairy Tiwai Industrial (excluding Tiwai) FY2012 FY2013 FY2014 FY2015 FY2016 Irrigation 15 MARKET DYNAMICS * normalised for temperature

17 NEW ZEALAND ALUMINIUM SMELTER (NZAS) > 13% of New Zealand national demand > Financial contract between NZAS and Meridian for 572MW through to 31 Dec 2030 > Annual right to terminate contract with 12 months notice from 1 Jan 2017 > Right to reduce from 572MW to 400MW with 12 months notice from 30 Apr 2017 > Trading conditions for the aluminium industry remain challenging despite recent price recovery > Aluminium prices have increased over last 12 months from post GFC lows to circa US$1,750/t (up ~20%) > Further thermal rationalisation in the North Island highly likely in response to NZAS closure > Industry has demonstrated ability to quickly respond to changes in supply and demand > Mercury best placed in the event of NZAS closure > 100% renewable North Island generation close to major North Island load centres > Physical transmission of South Island hydro generation to North Island load centres, as well as locational wholesale price effects, are second order considerations of a NZAS closure Mercury generation assets NZAS AUCKLAND HAYWARDS BENMORE HVDC 16 MARKET DYNAMICS
18 INTERPRETING MARKET DYNAMICS DYNAMIC: DEMAND GROWTH AND THERMAL RATIONALISATION FUNDAMENTALS: SUPPLY AND DEMAND BETTER BALANCED EXPECTED MARKET RESPONSE Increased wholesale price volatility Futures price increase Commercial and Industrial (C&I) pricing increase Retail margin reduction in the absence of energy price increases OBSERVED MARKET RESPONSE Annual futures pricing flat Customer churn remains at high levels Growing number of new entrant retailers MITIGATING FACTORS Benign wholesale prices due to generally above average inflows into South Island catchments and short-term management of thermal fuel positions NZAS closure uncertainty 17 MARKET DYNAMICS
19 Jul-12 Jan-13 Jul-13 Jan-14 Jul-14 Jan-15 Jul-15 Jan-16 Jul-16 Jan-17 Jul-17 Jan-18 Jul-18 Jan-19 Jul-19 Jan-20 Jul-20 Wholesale / Futures Price (OTA) WHOLESALE ELECTRICITY PRICES > Wholesale spot prices and electricity futures prices not currently reflecting changes in supply and demand > Benign wholesale prices due to generally above average inflows into South Island catchments and short-term management of thermal fuel positions > Electricity futures prices reflecting lack of wholesale spot price volatility and NZAS closure uncertainty WHOLESALE ELECTRICITY PRICES $200+ $180 Daily observed prices Quarterly futures $160 $140 $120 $100 $80 $60 $40 $20 $0 18 MARKET DYNAMICS
20 Jul-11 Jan-12 Jul-12 Jan-13 Jul-13 Jan-14 Jul-14 Jan-15 Jul-15 Jan-16 Jul-16 Jul-11 Jan-12 Jul-12 Jan-13 Jul-13 Jan-14 Jul-14 Jan-15 Jul-15 Jan-16 Jul-16 Annual Churn Annual Churn CUSTOMER > Retail energy prices flat, reflecting strong competition > MBIE Residential sales-based electricity cost flat (+0.3%) for the four years to 31 March > Churn remains high relative to international benchmarks > Major centres (such as Auckland) observing slightly higher churn due to customer density > Historic incumbencies (such as Mercury in Auckland) showing churn advantage > Churn rates of niche brands (such as Globug and Bosco) higher reflecting behaviours of customer bases NATIONAL CHURN 30% 25% 20% 15% 10% 5% 0% All Retailers (excl. Mercury) Mercury (excl. Globug and Bosco)* Mercury* AUCKLAND CHURN 30% 25% 20% 15% 10% 5% 0% All Retailers (excl. Mercury) Mercury (excl. Globug and Bosco) Mercury } } Total switches Trader switches 2 *Step up in Mercury trader churn from May 2015 partially related to consolidation of niche brands (i.e. switching between Mercury brands) 19 MARKET DYNAMICS Source: Electricity Authority 1 Sales-based costs are after discount costs which reflect actual uptake of prompt payment discounts, dual fuel discounts, and incentive discounts for attracting or retaining a customer 2 A trader switch is where a customer changes retailer without changing house

21 20 BUSINESS OVERVIEW
22 HEALTH & SAFETY > Zero harm is our well-being goal > FY2016 demonstrates continued improvement in achieving our goal > no high severity incidents involving employees, contractors or visitors on Mercury controlled sites > reduction of lost time (moderate severity) incidents from 5 to 3 > continued high engagement survey rating reflecting commitment to the health and safety of Mercury s people > One high severity incident in FY2017 to date > A contractor was injured in an office stair fall > Collaboration to improve industry-wide safety with initiatives such as the industry forum - StayLive TOTAL RECORDABLE INJURY FREQUENCY RATE (TRIFR) (per 200,000 hours; includes onsite employees and contractors) Financial Year Low Severity Incidents Moderate Severity Incidents High Severity Incidents 21 BUSINESS OVERVIEW
23 Sep-14 Nov-14 Jan-15 Mar-15 May-15 Jul-15 Sep-15 Nov-15 Jan-16 Mar-16 May-16 Jul-16 Sep-16 Percentage of Customers CUSTOMER > Rewarding loyalty leading to increased customer satisfaction and reduced churn > Free Power Day a loyalty product which helps customers appreciate the value of electricity > Airpoints Mercury has partnered with Air New Zealand to enable customers to earn Airpoints dollars > 41% of Mercury 2 residential customers on fixed-price contracts > Through FY % of Mercury 2 customers responded as highly satisfied in the Company s regular survey the highest of the five large retailers > On-going focus on increasing depth of customer relationships through innovative propositions > The acquisition of in-house solar capability through the purchase of What Power Crisis (WPC) adds to innovative customer solutions available GLOBUG, Good Energy Monitor (GEM) and fixed-price contracts > Enabling customers to utilise electricity as a transport fuel EV fuel package, customer discounts for e-bikes and partnering with Plugshare to establish the country s Electric Highway CUSTOMERS HIGHLY SATISFIED 12 Rolling 3 months 70% 65% 60% 55% 50% 45% 40% Mercury Largest 4 Brands (excl. Mercury) 22 BUSINESS OVERVIEW 1 Based on Mercury s monthly survey 2 Mercury (excluding Bosco and GLOBUG)
24 Jul 11 Jan 12 Jul 12 Jan 13 Jul 13 Jan 14 Jul 14 Jan 15 Jul 15 Jan 16 Jul 16 $/MWh GWh ELECTRICITY GENERATION > 100% renewable generation with two complementary lowcost fuel sources > High up-front build cost, low operating cost > Central North Island close to major load centres and not dependent on HVDC > Generation Weighted Average Price (GWAP) favourable to peers reflecting the flexibility and location of assets > Flexible hydro generation (1052MW) > Largest series of peaking stations in North Island > Seasonal inflow patterns correlated with demand and inversely correlated to those of the major South Island hydro catchments 2 > Built > Base-load geothermal generation > Only renewable not dependent on weather > Built ANNUAL GENERATION 1 5,000 4,000 3,000 2,000 1, Hydro Geothermal Financial Year MONTHLY GWAP 200 Long-term hydro average Peer GWAP MRP GWAP 23 BUSINESS OVERVIEW 1 A long term time-series of hydro generation can be found in the appendix (pg. 35) 2 Further detail can be found in the appendix (pg. 36)
25 GWh $/MWh GWh PORTFOLIO MANAGEMENT > Average net long (generation) position reflecting integrated portfolio and closure of Southdown > Portfolio management is subject to robust risk management framework > Movement in net position year-on-year due to hydrology, plant availability and value of sales ANNUAL NET POSITION FY2016 ANNUAL NET POSITION Net Position Whakamaru Average Spot Price 1, , Financial year ,000 8,000 7,000 6,000 5,000 4,000 3,000 2,000 1,000 0 Gas-Fired CFD Buy Additional Hydro Minimum Hydro Geothermal CFD Buy - VAS Buy Other CFD Sell 'End User' CFD Sell Commerical Losses Residential Norske Skog CFD Sell - VAS Sell 24 BUSINESS OVERVIEW
26 METRIX > Metrix 2 nd largest NZ meter data and services provider with 436k meters owned or under management 1 > Market consolidated and initial meter upgrade largely complete or contracted > Smart meter deployment has enabled customer-led product development > Broadly utilised by retailers with products such as Mercury s Free Power Days, GEM and GLOBUG NATIONAL MARKET SHARE September 2016 GREATER AUCKLAND MARKET SHARE 2 September % 2% 3% 8% 9% Vector Metrix TrustPower 32% Metrix Owned 19% 56% Contact Energy Smartco Ltd Counties Power 6% 62% Metrix Managed Other Other 25 BUSINESS OVERVIEW 1 396k meters are owned by Metrix 2 Includes Vector and Counties networks

27 26 FINANCIAL OVERVIEW
28 $m $m $m $m FINANCIAL TRACK RECORD ENERGY MARGIN FY2012 FY2013 FY2014 FY2015 FY2016 EBITDAF FY2012 FY2013 FY2014 FY2015 FY2016 UNDERLYING EARNINGS FY2012 FY2013 FY2014 FY2015 FY2016 FREE CASH FLOW FY2012 FY2013 FY2014 FY2015 FY FINANCIAL OVERVIEW
29 Cents per share DIVIDENDS > Mercury s dividend policy is to make distributions with a pay-out ratio of 70% to 85% of Free Cash Flow on average through time 1 > FY2017 ordinary dividend guidance is an increase of 2% to 14.6cps, the sixth year of consecutive ordinary dividend growth > Supplementary dividend paid to non-residents to reduce economic impact of Non-Resident Withholding Taxes > Focus remains on appropriate capital management > FY2016 non-imputed special dividend of 4.0cps increased total distributions to 100% of Free Cash Flow and distributed proceeds from land sales within FY2015 and FY2016 DIVIDEND Interim Final Specials Ordinary guidance F Financial Year 28 FINANCIAL OVERVIEW 1 With consideration given to working capital requirements, maintenance of a BBB+ credit rating, economic market and hydrological risks, and estimated financial performance
30 $m CAPITAL EXPENDITURE > Stay-in-business capital expenditure expect to be circa $80m per annum over the medium term > FY2017 guidance of $125m for stay-in-business and for minimal growth capital expenditure > Stay-in-business includes the drilling of four wells as part of a co-ordinated drilling campaign across multiple reservoirs (circa $55m) and the continuation of the company s hydro refurbishment programme > Stay-in-business consistent with medium-term guidance (FY2013 to FY2017f average circa $80m) CAPITAL EXPENDITURE Growth: Domestic geothermal generation Below normalised stay-in-business guidance due to timing of geothermal makeup wells F Financial Year Growth: Metering New investment Stay-in-business Normalised stay-in-business FINANCIAL OVERVIEW
31 $m OPERATING EXPENSES > FY2017 operating costs guided to be comparable with FY2016 levels > Operating expenditure below 2010 levels, despite 2 new geothermal stations added OPERATING EXPENDITURE One-off costs Operating expenditure Financial Year 30 FINANCIAL OVERVIEW
32 $m FUNDING PROFILE DEBT MATURITIES AS AT 31 OCTOBER Domestic Wholesale Bonds US Private Placement Capital Bond Drawn Bank Facilities Undrawn Bank Facilities Financial Year > The average debt maturity profile for committed facilities was 9.2 years at 31 October 2016 > Interest costs elevated due to interest rate hedges put in place in 2008 during the company s domestic geothermal investment programme. These hedges roll off progressively from the end of FY2018 with an estimated $20-30m annual cash flow benefit in FY FINANCIAL OVERVIEW
33 CAPITAL STRUCTURE > bbb stand alone rating is key reference point for dividend policy and a sustainable capital structure > S&P re-affirmed Mercury s credit rating of BBB+/stable on 23 December 2015 > One-notch upgrade given majority Crown ownership > Key ratio for stand alone S&P credit rating bbb requires Debt / EBITDAF between 2.0x and 2.8x > Capital management continues to be reviewed > Debt/EBITDAF 2.0x at 30 June 2016 > Gearing will be maintained reflecting majority Government ownership 30 June June June June June 2012 Net debt ($m) 1,068 1,082 1,031 1,028 1,116 Gearing ratio (%) Debt/EBITDAF (x) Adjusted for S&P treatment of subordinated debt 32 FINANCIAL OVERVIEW

34 33 APPENDIX
35 OWNERSHIP > Listed on NZX and ASX in May 2013 > Currently more than 90,000 shareholders (widest held New Zealand register) > Government majority ownership > Public Finance Act and Company s constitution require at least 51% Crown ownership > No other person may hold more than 10% of shares > Eight independent Directors > No direct government representation on Board MERCURY SHARE REGISTER 1 4% 2% 19% 51% 24% Government New Zealand Retail International Institutions New Zealand Institutions Treasury Stock 1 Data as at October APPENDIX
36 GWh WAIKATO HYDRO SYSTEM > A cascade river system with nine power stations along the Waikato River (New Zealand s longest river) > Supports average annual generation of 4,000GWh - since 1999 ranged from 3,300GWh to 4,800GWh > Maximum storage capacity of 580GWh in Lake Taupo (New Zealand s largest lake by area); minimum flow requirement 7.5GWh per day WAIKATO HYDRO SYSTEM GENERATION 6,000 5,000 4,000 Mercury Ownership Long-term hydro average 3,000 2,000 1,000 0 Financial Year 35 APPENDIX
37 Jan Feb Mar Apr May Jun Jul Aug Sep Oct Nov Dec Jan Feb Mar Apr May Jun Jul Aug Sep Oct Nov Dec Inflows (GWh) Load (GWh) Inflows (GWh) Load (GWh) INFLOW DISTRIBUTIONS > Positive correlation of North Island hydro inflows and sales AVERAGE SOUTH ISLAND INFLOWS VS. DEMAND AVERAGE NORTH ISLAND INFLOWS VS. DEMAND Average Inflows in SI (LHS) Average Market Demand (RHS) Average Inflows in NI (LHS) Average Market Demand (RHS) APPENDIX
38 REFERENCE MATERIAL Mercury Investor Centre INDUSTRY REFERENCES Electricity Authority website System Operator website Wholesale electricity spot prices Electricity futures prices INDUSTRY PUBLICATIONS Ministry of Business, Innovation and Employment - Energy in New Zealand Electricity Authority - Electricity in New Zealand APPENDIX
39
For personal use only
 NEWS RELEASE 20 May 2016 NZX: MRP ASX: MYT Investor Roadshow Presentation May 2016 Mighty River Power will be giving presentations at a series of international investor meetings during May 2016. The presentation
Financial Results. Year ended 30 June WILLIAM MEEK Chief Financial Officer. FRASER WHINERAY Chief Executive 23 August 2016
 Financial Results Year ended 30 June 2016 FRASER WHINERAY Chief Executive 23 August 2016 WILLIAM MEEK Chief Financial Officer DISCLAIMER The information in this presentation has been prepared by Mercury
Mercury. Investor Roadshow. TIM THOMPSON Head of Treasury & Investor Relations. WILLIAM MEEK Chief Financial Officer.
 Mercury Investor Roadshow WILLIAM MEEK Chief Financial Officer November 28 TIM THOMPSON Head of Treasury & Investor Relations DISCLAIMER This presentation has been prepared by Mercury NZ Limited and its
Financial Results. Six months ended 31 December WILLIAM MEEK Chief Financial Officer. FRASER WHINERAY Chief Executive 27 February 2018
 Financial Results Six months ended 31 December 2017 FRASER WHINERAY Chief Executive 27 February 2018 WILLIAM MEEK Chief Financial Officer DISCLAIMER The information in this presentation has been prepared
Mercury. Governance Roadshow. JOAN WITHERS Chair. JAMES MILLER Director. 12 December 2017
 Mercury Governance Roadshow JOAN WITHERS Chair JAMES MILLER Director 12 December 2017 DISCLAIMER This presentation has been prepared by Mercury NZ Limited and its group of companies ( Company ) for informational
Powering today, protecting tomorrow. MERIDIAN ENERGY LIMITED annual results roadshow presentation
 Powering today, protecting tomorrow Disclaimer The information in this presentation was prepared by Meridian Energy with due care and attention. However, the information is supplied in summary form and
26 February Financial Results. Six months ended 31 December Presented by:
 26 February 214 Financial Results Six months ended 31 December 213 Presented by: Doug Heffernan Chief Executive William Meek Chief Financial Officer 2 FINANCIAL RESULTS Disclaimer The information in this
Powering today, protecting tomorrow. MERIDIAN ENERGY LIMITED I investor roadshow presentation
 Powering today, protecting tomorrow Disclaimer The information in this presentation was prepared by Meridian Energy with due care and attention. However, the information is supplied in summary form and
Better energy. MERIDIAN ENERGY LIMITED RESULTS PRESENTATION YEAR ENDING 30th June 2014
 Better energy MERIDIAN ENERGY LIMITED RESULTS PRESENTATION YEAR ENDING 30th June 2014 Disclaimer The information in this presentation was prepared by Meridian Energy with due care and attention. However,
MRP hits half-year growth despite worst-ever hydro conditions
 NEWS RELEASE 26 February 2014 NZX: MRP ASX: MYT MRP hits half-year growth despite worst-ever hydro conditions Mighty River Power today released financial results for the six months ended 31 December 2013
Powering today, protecting tomorrow
 Powering today, protecting tomorrow Disclaimer The information in this presentation was prepared by Meridian Energy with due care and attention. However, the information is supplied in summary form and
Meridian Energy NZX retail investor presentation
 Meridian Energy NZX retail investor presentation 1 October 2018 Attached is a presentation Meridian Energy Limited is making at NZX retail investor evenings in early October 2018. ENDS Neal Barclay Chief
Mighty River Power Reports Increase in Net Profit and Underlying Earnings
 NEWS RELEASE 21 February 2013 Mighty River Power Reports Increase in Net Profit and Underlying Earnings FINANCIAL RESULTS FOR THE SIX MONTHS ENDED 31 DECEMBER 2012¹ Highlights Net Profit After Tax increased
IT S OUR FUTURE. MERIDIAN ENERGY LIMITED 2017 ANNUAL RESULTS PRESENTATION
 IT S OUR FUTURE. MERIDIAN ENERGY LIMITED 2017 ANNUAL RESULTS PRESENTATION That we are a sustainable business is increasingly important to all our stakeholders, and offers significant benefits Meridian
CRAIGS QUEENSTOWN INVESTOR DAY. MERIDIAN ENERGY LIMITED MANAGEMENT PRESENTATION
 CRAIGS QUEENSTOWN INVESTOR DAY. MERIDIAN ENERGY LIMITED MANAGEMENT PRESENTATION Meridian a reminder. $7b company, listed in 2013, 51% Government owned New Zealand s largest generator, from purely renewable
2018 INTERIM RESULTS PRESENTATION. MERIDIAN ENERGY LIMITED
 2018 INTERIM RESULTS PRESENTATION. MERIDIAN ENERGY LIMITED Opening comments. Challenges of two significant dry periods in 2017 749 GWH of new Australian generation capacity Retail platform decision in
MERIDIAN ENERGY LIMITED 2019 INTERIM RESULTS PRESENTATION
 MERIDIAN ENERGY LIMITED 219 INTERIM RESULTS PRESENTATION M E R I D I A N E N E R G Y L I M I T E D 2 1 9 I N T E R I M R E S U L T S P R E S E N T A T I O N H I G H L I G H T S 18% increase in interim
United States, Toronto, London, Tokyo, Hong Kong, Singapore
 United States, Toronto, London, Tokyo, Hong Kong, Singapore Not financial product advice: This presentation is for information purposes only and is not financial or investment advice or a recommendation
1. Half Year Results November Investor Briefing 2018 Half Year Results 8 November 2018
 1. Half Year Results November 2018 Investor Briefing 2018 Half Year Results 8 November 2018 Contents FY19 first half highlights Retail overview Generation and wholesale market overview Overview of financial
Results Presentation Six month period ended 31 December 2010
 Results Presentation Six month period ended 31 December 2010 22 February 2011 Disclaimer This presentation may contain projections or forward looking statements regarding a variety of items. Such forward-looking
Trustpower Annual General Meeting 25 July 2017
 Trustpower Annual General Meeting 25 July 2017 Chairman s Update 2. Trustpower AGM 25 July 2017 Demerger successfully completed Targeted Business Strategies - A strong focus on the core New Zealand retail
INTRODUCTION. Meridian Energy Limited 2018 Annual Results Presentation 2
 THE LONG RUN M E R I D I A N E N E R G Y L I M I T E D 2 0 1 8 A N N U A L R E S U L T S P R E S E N T A T I O N INTRODUCTION Meridian Energy Limited 2018 Annual Results Presentation 2 A S N A P S H O
Retail Bond Offer Investor Presentation
 Retail Bond Offer Investor Presentation Dorian Devers, Chief Financial Officer Louise Tong, Head of Capital Markets & Tax Joint Lead Managers February 2019 Important Notice The offer of debt securities
HY19 Result Presentation
 HY19 Result Presentation 27 February 2019 Marc England CHIEF EXECUTIVE OFFICER Chris Jewell CHIEF FINANCIAL OFFICER G E N E S I S E N E R G Y L I M I T E D AGENDA 1 Key Highlights 2 Financial Performance
Corrigendum. OECD Pensions Outlook 2012 DOI: ISBN (print) ISBN (PDF) OECD 2012
 ISBN (PDF) OECD 2012") OECD Pensions Outlook 2012 DOI: http://dx.doi.org/9789264169401-en ISBN 978-92-64-16939-5 (print) ISBN 978-92-64-16940-1 (PDF) OECD 2012 Corrigendum Page 21: Figure 1.1. Average annual real net investment
OECD Pensions Outlook 2012 DOI: http://dx.doi.org/9789264169401-en ISBN 978-92-64-16939-5 (print) ISBN 978-92-64-16940-1 (PDF) OECD 2012 Corrigendum Page 21: Figure 1.1. Average annual real net investment
October Leading Energy
 October 2012 Leading 2 Introduction Welcome to your update on the key issues and challenges for New Zealand s electricity generation and retail companies in FY12. We take a look at how the sector dealt
New Zealand Government Debt Market Outlook. February 2018
 New Zealand Government Debt Market Outlook February 2018 Overview New Zealand Economic Outlook New Zealand Government: Fiscal Priorities New Zealand Government Bonds: Risk/Reward NZDMO: Strategy and Announcements
RECENT EVOLUTION AND OUTLOOK OF THE MEXICAN ECONOMY BANCO DE MÉXICO OCTOBER 2003
 OCTOBER 23 RECENT EVOLUTION AND OUTLOOK OF THE MEXICAN ECONOMY BANCO DE MÉXICO 2 RECENT DEVELOPMENTS OUTLOOK MEDIUM-TERM CHALLENGES 3 RECENT DEVELOPMENTS In tandem with the global economic cycle, the Mexican
2017 International Investor Roadshow
 Higher Res images pending: branding team Monday 2017 International Investor Roadshow Dennis Barnes Chief Executive Officer October 2016 April 2017 Annual meeting of shareholders Ticker: CEN.NZE Disclaimer
Retail Bond Offer Investor Presentation
 Retail Bond Offer Investor Presentation August 2015 Graham Cockroft, Chief Financial Officer Louise Tong, Head of Treasury and Tax Lead Manager and Organising Participant Co-Manager Disclaimer The offer
Investor Roadshow. November Marc England CHIEF EXECUTIVE Chris Jewell CHIEF FINANCIAL OFFICER Wendy Jenkins GROUP MANAGER INVESTOR RELATIONS
 Investor Roadshow November 2018 Marc England CHIEF EXECUTIVE Chris Jewell CHIEF FINANCIAL OFFICER Wendy Jenkins GROUP MANAGER INVESTOR RELATIONS G E N E S I S E N E R G Y L I M I T E D Tokyo, Hong Kong,
Contact Energy FY18 Results Presentation 13 August 2018
 We are adapting to new technologies, services and ways of doing things inspired by the changing needs of our customers» The Contact brand needed to change to better reflect the type of energy and service
Ways to increase employment
 Ways to increase employment Iceland Luxembourg Spain Canada Italy Norway Denmark Germany Portugal Ireland Japan Belgium Switzerland Austria Slovenia United States New Zealand Finland France Netherlands
Presentation to Investor Briefing. May 2010
 P t ti t Presentation to Investor Briefing May 2010 Agenda TrustPower Key Facts FY2010 Financial i Performance and Operations Overview Competitor Benchmarking and Shareholder Returns Regulatory Environment
WE RE WORKING TO BUILD A BETTER FUTURE
 WE RE WORKING TO BUILD A BETTER FUTURE As a 100% renewable energy generator, and as a retailer, our business has always walked hand in hand with the environment. But building a sustainable future is much
Programme for Government Joe Reynolds Director Programme for Government and Delivering Social Change
 Programme for Government 2016-21 Joe Reynolds Director Programme for Government and Delivering Social Change Context the rationale for change Current PfG is a list of 82 Commitments Executive record on
FY18 Result Presentation
 Result Presentation 29 August 2018 Marc England CHIEF EXECUTIVE Chris Jewell CHIEF FINANCIAL OFFICER G E N E S I S E N E R G Y L I M I T E D AGENDA Year in Review Financial Performance Strategic Update
CLICK TO EDIT. Annual Results Investor Briefing 3 May 2016
 CLICK TO EDIT Annual Results Investor Briefing 3 May 2016 Disclaimer This presentation has been prepared by Trustpower Limited(Trustpower) in relation to a proposed demerger transaction(demerger). Information:
Sources of Government Revenue in the OECD, 2016
 FISCAL FACT No. 517 July, 2016 Sources of Government Revenue in the OECD, 2016 By Kyle Pomerleau Director of Federal Projects Kevin Adams Research Assistant Key Findings OECD countries rely heavily on
8-Jun-06 Personal Income Top Marginal Tax Rate,
 8-Jun-06 Personal Income Top Marginal Tax Rate, 1975-2005 2005 2000 1999 1998 1997 1996 1995 1994 1993 1992 1991 1990 1989 1988 Australia 47% 47% 47% 47% 47% 47% 47% 47% 47% 47% 47% 48% 49% 49% Austria
July 2012 Chartbook The Halftime Report
 Average Daily $VA LUE Traded ($Billions ) $Billions (212 ( US China Japan CHI-X London Hong Kong Germany France Canada Korea Australia Brazil Taiwan Spain India Italy $billions Switzerland Sweden Amsterdam
Low employment among the 50+ population in Hungary
 Low employment among the + population in Hungary The role of incentives, health and cognitive capacities Janos Divenyi (Central European University) and Gabor Kezdi (Central European University and IE-CRSHAS)
Approach to Employment Injury (EI) compensation benefits in the EU and OECD
 compensation benefits in the EU and OECD") Approach to (EI) compensation benefits in the EU and OECD The benefits of protection can be divided in three main groups. The cash benefits include disability pensions, survivor's pensions and other short-
Approach to (EI) compensation benefits in the EU and OECD The benefits of protection can be divided in three main groups. The cash benefits include disability pensions, survivor's pensions and other short-
OUTLOOK FOR THE NEW ZEALAND GOVERNMENT DEBT MARKET
 OUTLOOK FOR THE NEW ZEALAND GOVERNMENT DEBT MARKET All photography sourced from: http://www.nzstory.govt.nz 1 The Treasury OVERVIEW 1 New Zealand Economic Outlook 2 New Zealand Government Bonds: Risk/Reward
BETTER POLICIES FOR A SUCCESSFUL TRANSITION TO A LOW-CARBON ECONOMY
 BETTER POLICIES FOR A SUCCESSFUL TRANSITION TO A LOW-CARBON ECONOMY Rintaro Tamaki Deputy Secretary-General, OECD International Forum for Sustainable Asia and the Pacific (ISAP)1 Yokohama, July 1 Four
Competition, Reliability and Hedge Market Developments in NZ. Carl Hansen New Zealand Electricity Authority
 Competition, Reliability and Hedge Developments in NZ Carl Hansen New Zealand Electricity Authority Outline Overview of the NZ electricity system and markets The EA s policy framework Role and overall
Sources of Government Revenue in the OECD, 2018
 FISCAL FACT No. 581 Mar. 2018 Sources of Government Revenue in the OECD, 2018 Amir El-Sibaie Analyst Key Findings In 2015, OECD countries relied heavily on consumption taxes, such as the value-added tax,
Sources of Government Revenue in the OECD, 2017
 FISCAL FACT No. 558 Aug. 2017 Sources of Government Revenue in the OECD, 2017 Amir El-Sibaie Analyst Key Findings: OECD countries rely heavily on consumption taxes, such as the value-added tax, and social
Health Care in Crisis
 Health Care in Crisis The Economic Imperative for Health Care Reform James Kvaal and Ben Furnas February 19, 2009 1 Center for American Progress Health Care in Crisis U.S. spends twice as much per capita
>> OUR 2018 INTERIM REPORT >> MERCURY NZ LIMITED
 >> OUR 2018 INTERIM REPORT >> MERCURY NZ LIMITED ROAD MAP: 02 >> REPORT CARD 04 >> CHAIR AND CHIEF EXECUTIVE UPDATES 12 >> FINANCIAL COMMENTARY 15 >> INDEPENDENT REVIEW REPORT 18 >> FINANCIAL STATEMENTS
Switzerland and Germany top the PwC Young Workers Index in developing younger people
 Press release Date 9 November 2015 Contact Mihnea Anastasiu Pages 5 Media Relations Manager Tel: +40 21 225 3546 Email: mihnea.anastasiu@ro.pwc.com Switzerland and Germany top the PwC Young Workers Index
Statistical annex. Sources and definitions
 Statistical annex Sources and definitions Most of the statistics shown in these tables can be found as well in several other (paper or electronic) publications or references, as follows: the annual edition
The Cyprus Economy: from Recovery to Sustainable Growth. Vincenzo Guzzo Resident Representative in Cyprus
 The Economy: from Recovery to Sustainable Growth Vincenzo Guzzo Resident Representative in Growth momentum remains strong 18 : Real GDP ( billion) 1 Deviation from Pre-Crisis Level and Trend (Percent)
Simplified Disclosure Prospectus. for an offer of interest bearing capital bonds. Arranger, Organising Participant and Joint Lead Manager
 Simplified Disclosure Prospectus for an offer of interest bearing capital bonds. This Prospectus is a Simplified Disclosure Prospectus for an offer of capital bonds that will rank in priority to the ordinary
GREEK ECONOMIC OUTLOOK
 CENTRE OF PLANNING AND ECONOMIC RESEARCH Issue 29, February 2016 GREEK ECONOMIC OUTLOOK Macroeconomic analysis and projections Public finance Human resources and social policies Development policies and
PENSIONS IN OECD COUNTRIES: INDICATORS AND DEVELOPMENTS
 PENSIONS IN OECD COUNTRIES: INDICATORS AND DEVELOPMENTS Marius Lüske Directorate for Employment, Labour and Social Affairs, OECD Lisbon, 28.09.2018 Marius.LUSKE@oecd.org www.oecd.org/els OUTLINE Talk based
The Case for Fundamental Tax Reform: Overview of the Current Tax System
 The Case for Fundamental Tax Reform: Overview of the Current Tax System Sources of Federal Receipts Projected for 2016 Excise Taxes 2.9% Estate & Gift Taxes 0.6% Corporate Income Taxes 9.8% Other Taxes
OUTLOOK FOR THE NEW ZEALAND GOVERNMENT DEBT MARKET. 1 The Treasury
 OUTLOOK FOR THE NEW ZEALAND GOVERNMENT DEBT MARKET 1 The Treasury TODAY Economic outlook New Zealand Government: risk/reward Fiscal priorities NZDMO s strategy What to watch for 2 1. ECONOMIC OUTLOOK 3
>> OUR 2018 INTERIM REPORT >> MERCURY NZ LIMITED
 >> OUR 2018 INTERIM REPORT >> MERCURY NZ LIMITED ROAD MAP: 02 >> REPORT CARD 04 >> CHAIR AND CHIEF EXECUTIVE UPDATES 12 >> FINANCIAL COMMENTARY 15 >> INDEPENDENT REVIEW REPORT 18 >> FINANCIAL STATEMENTS
OUR 2017 FINANCIAL REPORT. Wonderful choice.
 OUR FINANCIAL REPORT Wonderful choice. Mercury NZ Limited ANNUAL FINANCIAL STATEMENTS FOR THE YEAR ENDED 30 JUNE 01 >> REPORT CARD 02 >> FINANCIAL TRACK RECORD 03 >> INDEPENDENT AUDITOR S REPORT 06 >>
TAX POLICY CENTER BRIEFING BOOK. Background. Q. What are the sources of revenue for the federal government?
 What are the sources of revenue for the federal government? FEDERAL BUDGET 1/4 Q. What are the sources of revenue for the federal government? A. About 48 percent of federal revenue comes from individual
Some Historical Examples of Yield Curves
 3 months 6 months 1 year 2 years 5 years 10 years 30 years Some Historical Examples of Yield Curves Nominal interest rate, % 16 14 12 10 8 6 4 2 January 1981 June1999 December2009 0 Time to maturity This
Auscap Long Short Australian Equities Fund Newsletter June 2018
 Auscap Long Short Australian Equities Fund Auscap Asset Management Limited Disclaimer: This newsletter contains performance figures and information in relation to the Auscap Long Short Australian Equities
A Comparison of the Tax Burden on Labor in the OECD, 2017
 FISCAL FACT No. 557 Aug. 2017 A Comparison of the Tax Burden on Labor in the OECD, 2017 Jose Trejos Research Assistant Kyle Pomerleau Economist, Director of Federal Projects Key Findings: Average wage
Statistical Annex. Sources and definitions
 Statistical Annex Sources and definitions Most of the statistics shown in these tables can also be found in two other (paper or electronic) publication and data repository, as follows: The annual edition
Recommendation of the Council on Tax Avoidance and Evasion
 Recommendation of the Council on Tax Avoidance and Evasion OECD Legal Instruments This document is published under the responsibility of the Secretary-General of the OECD. It reproduces an OECD Legal Instrument
Quarterly Investment Update First Quarter 2017
 Quarterly Investment Update First Quarter 2017 Market Update: A Quarter in Review March 31, 2017 CANADIAN STOCKS INTERNATIONAL STOCKS Large Cap Small Cap Growth Value Large Cap Small Cap Growth Value Emerging
January 2014 Euro area international trade in goods surplus 0.9 bn euro 13.0 bn euro deficit for EU28
 STAT/14/41 18 March 2014 January 2014 Euro area international trade in goods surplus 0.9 13.0 deficit for EU28 The first estimate for the euro area 1 (EA18) trade in goods balance with the rest of the
Sources of Government Revenue in the OECD, 2014
 FISCAL FACT Nov. 2014 No. 443 Sources of Government Revenue in the OECD, 2014 By Kyle Pomerleau Economist Key Findings OECD countries rely heavily on consumption taxes, such as the value added tax, and
Economic recovery and employment in the EU. Raymond Torres, Director, ILO Research Department
 Economic recovery and employment in the EU Raymond Torres, Director, ILO Research Department Outline of presentation I. Situation in the EU versus Japan and the US II. Role of macroeconomic policies and
ManpowerGroup Employment Outlook Survey Singapore
 ManpowerGroup Employment Outlook Survey Singapore 1 218 ManpowerGroup interviewed nearly 59, employers across 43 countries and territories to forecast labor market activity* in 1Q 218. All participants
Assessing Developments and Prospects in the Australian Welfare State
 Assessing Developments and Prospects in the Australian Welfare State Presentation to OECD,16 November, 2016 Peter Whiteford, Crawford School of Public Policy https://socialpolicy.crawford.anu.edu.au/ peter.whiteford@anu.edu.au
Budget repair and the size of Australia s government. Melbourne Economic Forum John Daley, Grattan Institute December 2015
 Budget repair and the size of Australia s government Melbourne Economic Forum John Daley, Grattan Institute December 2015 Budget repair and the size of Australia s government Attitudes to the best approach
ManpowerGroup Employment Outlook Survey Netherlands
 ManpowerGroup Employment Outlook Survey Netherlands 1 218 The ManpowerGroup Employment Outlook Survey for the first quarter 218 was conducted by interviewing a representative sample of 754 employers in
Declaration on Environmental Policy
 Declaration on Environmental Policy OECD Legal Instruments This document is published under the responsibility of the Secretary-General of the OECD. It reproduces an OECD Legal Instrument and may contain
Burden of Taxation: International Comparisons
 Burden of Taxation: International Comparisons Standard Note: SN/EP/3235 Last updated: 15 October 2008 Author: Bryn Morgan Economic Policy & Statistics Section This note presents data comparing the national
Emerging Markets Outlook
 Mark Mobius, Ph.D. Executive Chairman Templeton Emerging Markets Group Emerging Markets Outlook Dealer Use Only / Not for Distribution to the Public Agenda Performance Emerging Markets Equities: Demand
Macroeconomic overview SEE and Macedonia
 Macroeconomic overview SEE and Macedonia Zoltan Arokszallasi Chief Analyst, Macro & FX/FI Research Erste Group Bank Erste Investors Breakfast, 29 September, Skopje 02. Oktober SEE shows mixed performance
Statistical Annex ANNEX
 ISBN 92-64-02384-4 OECD Employment Outlook Boosting Jobs and Incomes OECD 2006 ANNEX Statistical Annex Sources and definitions Most of the statistics shown in these tables can be found as well in three
First estimate for 2011 Euro area external trade deficit 7.7 bn euro bn euro deficit for EU27
 27/2012-15 February 2012 First estimate for 2011 Euro area external trade deficit 7.7 152.8 deficit for EU27 The first estimate for the euro area 1 (EA17) trade in goods balance with the rest of the world
InterTrade Ireland Economic Forum 25 November 2011 The jobs crisis: stylised facts and policy challenges
 InterTrade Ireland Economic Forum 25 November 2011 The jobs crisis: stylised facts and policy challenges John P. Martin Director for Employment, Labour and Social Affairs, OECD The jobs crisis An unprecedented
Economic Performance. Lessons from the past and a guide for the future Björn Rúnar Guðmundson, Director
 Economic Performance Lessons from the past and a guide for the future Björn Rúnar Guðmundson, Director Analysis of economic performance Capital and labour: The raw ingredients in economic development However,
FINANCIAL & OPERATIONAL RESULTS
 FINANCIAL & OPERATIONAL RESULTS HALF YEAR ENDED 31 DECEMBER 2018 26 February 2019 DISCLAIMER This presentation contains forward-looking statements. Forward-looking statements often include words such as
Financial wealth of private households worldwide
 Economic Research Financial wealth of private households worldwide Munich, October 217 Recovery in turbulent times Assets and liabilities of private households worldwide in EUR trillion and annualrate
May 2012 Euro area international trade in goods surplus of 6.9 bn euro 3.8 bn euro deficit for EU27
 108/2012-16 July 2012 May 2012 Euro area international trade in goods surplus of 6.9 3.8 deficit for EU27 The first estimate for the euro area 1 (EA17) trade in goods balance with the rest of the world
August 2012 Euro area international trade in goods surplus of 6.6 bn euro 12.6 bn euro deficit for EU27
 146/2012-16 October 2012 August 2012 Euro area international trade in goods surplus of 6.6 12.6 deficit for EU27 The first estimate for the euro area 1 (EA17) trade in goods balance with the rest of the
ICT, knowledge and the economy 2012 Statistical annex
 ICT, knowledge and the economy 2012 Statistical annex This annex includes some tables with supplementary figures to the publication ICT, knowledge and the economy 2012. The tables are arranged by chapter.
Appendix. December 2011 Ministry of Finance
 Appendix December 2011 Ministry of Finance International Comparison of General Government Gross Debt According to the projection by OECD, Japan s general government gross debt to GDP ratio is more than
Damn the End of QE! Buy the Dollar and Treasurys!
 Damn the End of QE! Buy the Dollar and Treasurys! Dr. A. Gary Shilling President A. Gary Shilling & Company, Inc. A. Gary Shilling & Co., Inc. Economic Consultants Chart 1 Historic Inflation and Deflation
1 People in Paid Work
 1 People in Paid Work Indicator 1.1a Indicator 1.1b Indicator 1.2a Indicator 1.2b Indicator 1.3 Indicator 1.4 Indicator 1.5a Indicator 1.5b Indicator 1.6 Employment and Unemployment Trends (Republic of
1 People in Paid Work
 1 People in Paid Work Indicator 1.1a Indicator 1.1b Indicator 1.2a Indicator 1.2b Indicator 1.3 Indicator 1.4 Indicator 1.5a Indicator 1.5b Indicator 1.6 Employment and Unemployment Trends (Republic of
June 2012 Euro area international trade in goods surplus of 14.9 bn euro 0.4 bn euro surplus for EU27
 121/2012-17 August 2012 June 2012 Euro area international trade in goods surplus of 14.9 0.4 surplus for EU27 The first estimate for the euro area 1 (EA17) trade in goods balance with the rest of the world
The Outlook for the U.S. Economy and the Policies of the New President
 The Outlook for the U.S. Economy and the Policies of the New President Jason Furman Senior Fellow, PIIE SNS/SHOF Finance Panel Stockholm June 12, 2017 Peterson Institute for International Economics 1750
Economic Stimulus Packages and Steel: A Summary
 Economic Stimulus Packages and Steel: A Summary Steel Committee Meeting 8-9 June 2009 Sources of information on stimulus packages Questionnaire to Steel Committee members, full participants and observers
Communication on the future of the CAP
 Communication on the future of the CAP The CAP towards 2020: meeting the food, natural resources and territorial challenges of the future Tassos Haniotis, Director Agricultural Policy Analysis and Perspectives
Quarterly Investment Update First Quarter 2018
 Quarterly Investment Update First Quarter 2018 Dimensional Fund Advisors Canada ULC ( DFA Canada ) is not affiliated with [insert name of Advisor]. DFA Canada is a separate and distinct company. Market
Investor Strategy Day 22 November 2016
 Investor Strategy Day 22 November 2016 Disclaimer This presentation has been prepared by Genesis Energy Limited ( Genesis Energy ) for information purposes only. The information in this presentation is
Indicator B3 How much public and private investment in education is there?
 Education at a Glance 2014 OECD indicators 2014 Education at a Glance 2014: OECD Indicators For more information on Education at a Glance 2014 and to access the full set of Indicators, visit www.oecd.org/edu/eag.htm.
Stronger growth, but risks loom large
 OECD ECONOMIC OUTLOOK Stronger growth, but risks loom large Ángel Gurría OECD Secretary-General Álvaro S. Pereira OECD Chief Economist ad interim Paris, 3 May Global growth will be around 4% Investment
ManpowerGroup Employment Outlook Survey New Zealand
 ManpowerGroup Employment Outlook Survey New Zealand 1 218 New Zealand Employment Outlook The ManpowerGroup Employment Outlook Survey for the first quarter 218 was conducted by interviewing a representative