Some Historical Examples of Yield Curves
|
|
|
- Shonda Snow
- 6 years ago
- Views:
Transcription
1 3 months 6 months 1 year 2 years 5 years 10 years 30 years Some Historical Examples of Yield Curves Nominal interest rate, % January 1981 June1999 December Time to maturity This graph shows the yield curves for U.S. Treasury bonds at three points in time. Source: Federal Reserve Board
2 Government Bond Yield Curve, January 18, 2012

3

4 For S&P, a bond is considered investment grade if its credit rating is BBB- or higher. Bonds rated BB+ and below are considered to be speculative grade, sometimes also referred to as "junk" bonds
5 S&P: The general meaning of our credit rating opinions is summarized below. AAA Extremely strong capacity to meet financial commitments. Highest Rating. AA Very strong capacity to meet financial commitments. A Strong capacity to meet financial commitments, but somewhat susceptible to adverse economic conditions and changes in circumstances. BBB Adequate capacity to meet financial commitments, but more subject to adverse economic conditions. BBB- Considered lowest investment grade by market participants. BB+ Considered highest speculative grade by market participants. BB Less vulnerable in the near-term but faces major ongoing uncertainties to adverse business, financial and economic conditions. B More vulnerable to adverse business, financial and economic conditions but currently has the capacity to meet financial commitments. CCC Currently vulnerable and dependent on favorable business, financial and economic conditions to meet financial commitments. CC Currently highly vulnerable. C Currently highly vulnerable obligations and other defined circumstances. D Payment default on financial commitments. Note: Ratings from AA to CCC may be modified by the addition of a plus (+) or minus (-) sign to show relative standing within the major rating categories.
6
7

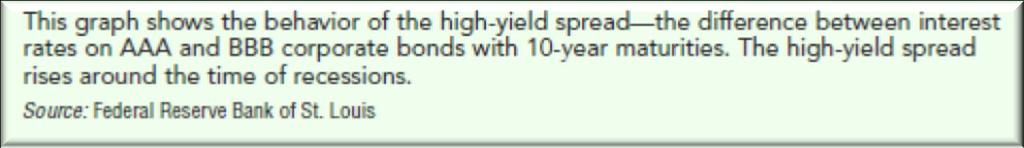
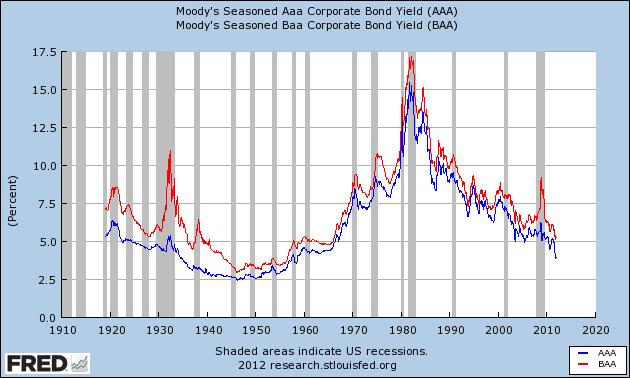
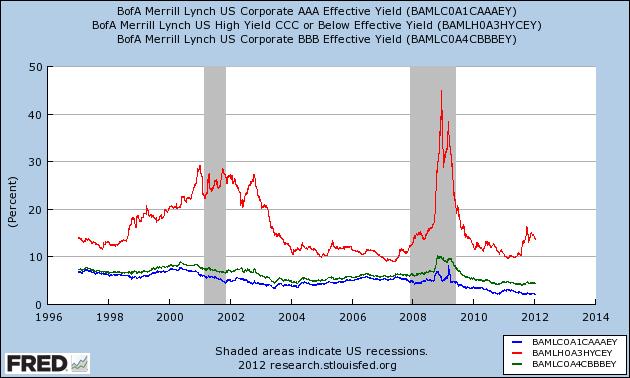
8 The High-Yield Spread,
9

10 S&P Ratings: Sovereign Debt
11 Croatia BBB- Negative Curacao A- Stable Cyprus BB+ Negative Czech Republic AA- Stable Denmark AAA Stable Dominican Republic B+ Stable Ecuador B- Positive Egypt B+ Negative El Salvador BB- Stable Estonia AA- Negative Fiji B Stable Finland AAA Negative France AA+ Negative Gabon BB- Stable Georgia BB- Stable Germany AAA Stable Ghana B Stable Greece CC Negative Grenada B- Stable Guatemala BB Negative Guernsey AA+ Stable Honduras B Positive Hong Kong AAA Stable Hungary BB+ Negative Iceland BBB- Stable India BBB- Stable Indonesia BB+ Positive Ireland BBB+ Negative
12 Harmonised long-term interest rates for convergence assessment purposes ( 1 ) (percentages per annum; period averages; secondary market yields of government bonds with maturities of close to ten years ( 2 )) Countries Dec. 10 Jan. 11 Feb. 11 Mar. 11 Apr May 11-Jun 11-Jul Aug. 11 Sep. 11 Oct. 11 Nov. 11 Dec. 11 Sources: ECB and European Commission. The latest data are available via Statistical Data Warehouse (SDW): Euro Area, SDW, Long-term Interest Rates Non-Euro Area, SDW, Long-term Interest Rates ( 1 ) As Estonia has a very limited government debt, there are currently no suitable long-term government bonds available on the financial market. See Table 2 for a MFI interest rate indicator for Estonia. ( 2 ) For Cyprus, primary market yields are reported. The same applies to Bulgaria and Romania up to December 2005, Slovenia up to October 2003 and Lithuania up to October ( 3 ) A harmonised long-term interest rate is presented starting mid-may Before, the Luxembourg Government did not have outstanding long-term debt securities with a residual maturity of close to ten years. Therefore, the yield on long-term bond(s) issued by a private credit institution with a residual maturity close to 10 years is presented for the period up to mid-may 2010 and is thus not fully harmonised for that period. Euro area Belgium Germany Ireland Greece Spain France Italy Cyprus Luxembourg ( 3 ) Malta Netherlands Austria Portugal Slovenia Slovakia Finland
13 Greece s Debt Crisis S&P bond rating (A) Greece s Sovereign Debt Ratings A A- BBB+ BBB Interest rates, % (B) Interest Rates on 10-Year Government Bonds Greece BBB- BB+ BB Germany Year Year Over , fears that the Greek government might default on its debt caused the country s bond rating (A) to fall and (B) interest rates on its bonds to rise relative to rates on bonds issued by other European governments. Source: Standart & Poor s; OECD

14 U.S. Real Interest Rates, Real 12 interest rate, % 10 8 BBB corporate bonds 30-year mortgages year Treasury bonds day Treasury bills -4 Year This graph charts the behavior over time of four interest rates in the United States. Each is a real rate-the nominal rate minus inflation over the previous year. The broad movements in the four interest rates are similar over time. Source: Federal Reserve Bank of St. Louis


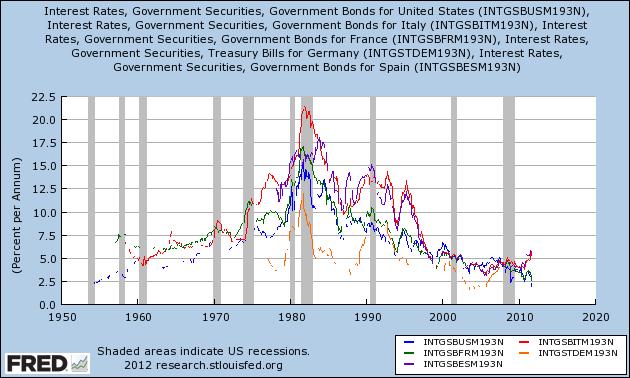
15 International Real Interest Rates, Real interest rate, % Canada USA France Year Real interest rates in the three countries examined here follow the same broad pattern over time. (The real interest rate for each country is the nominal rate on 3-month government bonds minus inflation over the previous year.) Source: International Monetary Fund

16 Inflation and Nominal Interest Rates Across Countries Nominal interest rate, % Turkey Russia Romania 40 Mexico USA Poland 10 Japan South Africa Inflation rate, % For the 1990s, this graph plots average inflation and the average nominal interest rate on 3-month government bonds in 41 countries. The graph illustrates the Fisher effect: higher inflation raises the nominal interest rate. Source: International Monetary Fund
Macroeconomic overview SEE and Macedonia
 Macroeconomic overview SEE and Macedonia Zoltan Arokszallasi Chief Analyst, Macro & FX/FI Research Erste Group Bank Erste Investors Breakfast, 29 September, Skopje 02. Oktober SEE shows mixed performance
January 2014 Euro area international trade in goods surplus 0.9 bn euro 13.0 bn euro deficit for EU28
 STAT/14/41 18 March 2014 January 2014 Euro area international trade in goods surplus 0.9 13.0 deficit for EU28 The first estimate for the euro area 1 (EA18) trade in goods balance with the rest of the
Second estimate for the third quarter of 2008 EU27 current account deficit 39.5 bn euro 19.3 bn euro surplus on trade in services
 STAT/09/12 22 January 2009 Second estimate for the third quarter of 20 EU27 current account deficit 39.5 bn euro 19.3 bn euro surplus on trade in According to the latest revisions1, the EU272 external
June 2014 Euro area international trade in goods surplus 16.8 bn 2.9 bn surplus for EU28
 127/2014-18 August 2014 June 2014 Euro area international trade in goods surplus 16.8 bn 2.9 bn surplus for EU28 The first estimate for the euro area 1 (EA18) trade in goods balance with the rest of the
First estimate for 2011 Euro area external trade deficit 7.7 bn euro bn euro deficit for EU27
 27/2012-15 February 2012 First estimate for 2011 Euro area external trade deficit 7.7 152.8 deficit for EU27 The first estimate for the euro area 1 (EA17) trade in goods balance with the rest of the world
May 2012 Euro area international trade in goods surplus of 6.9 bn euro 3.8 bn euro deficit for EU27
 108/2012-16 July 2012 May 2012 Euro area international trade in goods surplus of 6.9 3.8 deficit for EU27 The first estimate for the euro area 1 (EA17) trade in goods balance with the rest of the world
August 2012 Euro area international trade in goods surplus of 6.6 bn euro 12.6 bn euro deficit for EU27
 146/2012-16 October 2012 August 2012 Euro area international trade in goods surplus of 6.6 12.6 deficit for EU27 The first estimate for the euro area 1 (EA17) trade in goods balance with the rest of the
June 2012 Euro area international trade in goods surplus of 14.9 bn euro 0.4 bn euro surplus for EU27
 121/2012-17 August 2012 June 2012 Euro area international trade in goods surplus of 14.9 0.4 surplus for EU27 The first estimate for the euro area 1 (EA17) trade in goods balance with the rest of the world
Emerging Market Debt attractive yield with solid fundamentals
 For professional use only Not for Public distribution Emerging Market Debt attractive yield with solid fundamentals November 2012 Kevin Daly, Senior Portfolio Manager EMD Aberdeen Asset Management Table
Approach to Employment Injury (EI) compensation benefits in the EU and OECD
 compensation benefits in the EU and OECD") Approach to (EI) compensation benefits in the EU and OECD The benefits of protection can be divided in three main groups. The cash benefits include disability pensions, survivor's pensions and other short-
Approach to (EI) compensation benefits in the EU and OECD The benefits of protection can be divided in three main groups. The cash benefits include disability pensions, survivor's pensions and other short-
Reporting practices for domestic and total debt securities
 Last updated: 27 November 2017 Reporting practices for domestic and total debt securities While the BIS debt securities statistics are in principle harmonised with the recommendations in the Handbook on
EU BUDGET AND NATIONAL BUDGETS
 DIRECTORATE GENERAL FOR INTERNAL POLICIES POLICY DEPARTMENT ON BUDGETARY AFFAIRS EU BUDGET AND NATIONAL BUDGETS 1999-2009 October 2010 INDEX Foreward 3 Table 1. EU and National budgets 1999-2009; EU-27
EU-28 RECOVERED PAPER STATISTICS. Mr. Giampiero MAGNAGHI On behalf of EuRIC
 EU-28 RECOVERED PAPER STATISTICS Mr. Giampiero MAGNAGHI On behalf of EuRIC CONTENTS EU-28 Paper and Board: Consumption and Production EU-28 Recovered Paper: Effective Consumption and Collection EU-28 -
Quarterly Investment Update First Quarter 2017
 Quarterly Investment Update First Quarter 2017 Market Update: A Quarter in Review March 31, 2017 CANADIAN STOCKS INTERNATIONAL STOCKS Large Cap Small Cap Growth Value Large Cap Small Cap Growth Value Emerging
EMPLOYMENT RATE IN EU-COUNTRIES 2000 Employed/Working age population (15-64 years)
") EMPLOYMENT RATE IN EU-COUNTRIES 2 Employed/Working age population (15-64 years EU-15 Denmark Netherlands Great Britain Sweden Portugal Finland Austria Germany Ireland Luxembourg France Belgium Greece Spain
EMPLOYMENT RATE IN EU-COUNTRIES 2 Employed/Working age population (15-64 years EU-15 Denmark Netherlands Great Britain Sweden Portugal Finland Austria Germany Ireland Luxembourg France Belgium Greece Spain
European Advertising Business Climate Index Q4 2016/Q #AdIndex2017
 European Advertising Business Climate Index Q4 216/Q1 217 ABOUT Quarterly survey of European advertising and market research companies Provides information about: managers assessment of their business
Rev. Proc Implementation of Nonresident Alien Deposit Interest Regulations
 Rev. Proc. 2012-24 Implementation of Nonresident Alien Deposit Interest Regulations SECTION 1. PURPOSE Sections 1.6049-4(b)(5) and 1.6049-8 of the Income Tax Regulations, as revised by TD 9584, require
January 2010 Euro area unemployment rate at 9.9% EU27 at 9.5%
 STAT//29 1 March 20 January 20 Euro area unemployment rate at 9.9% EU27 at 9.5% The euro area 1 (EA16) seasonally-adjusted 2 unemployment rate 3 was 9.9% in January 20, the same as in December 2009 4.
Open Day 2017 Clearstream execution-to-custody integration Valentin Nehls / Jan Willems. 5 October 2017
 Open Day 2017 Clearstream execution-to-custody integration Valentin Nehls / Jan Willems 5 October 2017 Deutsche Börse Group 1 Settlement services: single point of access to cost-effective, low risk and
March 2005 Euro-zone external trade surplus 4.2 bn euro 6.5 bn euro deficit for EU25
 STAT/05/67 24 May 2005 March 2005 Euro-zone external trade surplus 4.2 6.5 deficit for EU25 The first estimate for euro-zone 1 trade with the rest of the world in March 2005 was a 4.2 billion euro surplus,
Summary of key findings
 1 VAT/GST treatment of cross-border services: 2017 survey Supplies of e-services to consumers (B2C) (see footnote 1) Supplies of e-services to businesses (B2B) 1(a). Is a non-resident 1(b). If there is
January 2009 Euro area external trade deficit 10.5 bn euro 26.3 bn euro deficit for EU27
 STAT/09/40 23 March 2009 January 2009 Euro area external trade deficit 10.5 26.3 deficit for EU27 The first estimate for the euro area 1 (EA16) trade balance with the rest of the world in January 2009
Chart pack to council for cooperation on macroprudential policy
 Chart pack to council for cooperation on macroprudential policy Contents List of charts... 3 Macro and macro-financial setting... 5 Swedish macroeconomic setting... 5 Foreign macroeconomic setting... Macro-financial
May 2009 Euro area external trade surplus 1.9 bn euro 6.8 bn euro deficit for EU27
 STAT/09/106 17 July 2009 May 2009 Euro area external trade surplus 1.9 6.8 deficit for EU27 The first estimate for the euro area 1 (EA16) trade balance with the rest of the world in May 2009 gave a 1.9
October 2010 Euro area unemployment rate at 10.1% EU27 at 9.6%
 STAT//180 30 November 20 October 20 Euro area unemployment rate at.1% EU27 at 9.6% The euro area 1 (EA16) seasonally-adjusted 2 unemployment rate 3 was.1% in October 20, compared with.0% in September 4.
Total Imports by Volume (Gallons per Country)
") 10/5/2017 Imports by Volume (Gallons per Country) YTD YTD Country 08/2016 08/2017 % Change 2016 2017 % Change MEXICO 51,349,849 67,180,788 30.8 % 475,806,632 503,129,061 5.7 % NETHERLANDS 12,756,776 12,954,789
10/5/2017 Imports by Volume (Gallons per Country) YTD YTD Country 08/2016 08/2017 % Change 2016 2017 % Change MEXICO 51,349,849 67,180,788 30.8 % 475,806,632 503,129,061 5.7 % NETHERLANDS 12,756,776 12,954,789
Spain France. England Netherlands. Wales Ukraine. Republic of Ireland Czech Republic. Romania Albania. Serbia Israel. FYR Macedonia Latvia
 Germany Belgium Portugal Spain France Switzerland Italy England Netherlands Iceland Poland Croatia Slovakia Russia Austria Wales Ukraine Sweden Bosnia-Herzegovina Republic of Ireland Czech Republic Turkey
January 2005 Euro-zone external trade deficit 2.2 bn euro 14.0 bn euro deficit for EU25
 42/2005-23 March 2005 January 2005 Euro-zone external trade deficit 2.2 14.0 deficit for EU25 The first estimate for euro-zone 1 trade with the rest of the world in January 2005 was a 2.2 billion euro
IRS Reporting Rules. Reference Guide. serving the people who serve the world
 IRS Reporting Rules Reference Guide serving the people who serve the world The United States has and continues to maintain a policy of not taxing the deposit interest earned by United States (US) nonresidents
Total Imports by Volume (Gallons per Country)
") 1/5/2018 Imports by Volume (Gallons per Country) YTD YTD Country 11/2016 11/2017 % Change 2016 2017 % Change MEXICO 50,994,409 48,959,909 (4.0)% 631,442,105 657,851,150 4.2 % NETHERLANDS 9,378,351 11,903,919
1/5/2018 Imports by Volume (Gallons per Country) YTD YTD Country 11/2016 11/2017 % Change 2016 2017 % Change MEXICO 50,994,409 48,959,909 (4.0)% 631,442,105 657,851,150 4.2 % NETHERLANDS 9,378,351 11,903,919
Total Imports by Volume (Gallons per Country)
") 11/2/2018 Imports by Volume (Gallons per Country) YTD YTD Country 09/2017 09/2018 % Change 2017 2018 % Change MEXICO 49,299,573 57,635,840 16.9 % 552,428,635 601,679,687 8.9 % NETHERLANDS 11,656,759 13,024,144
11/2/2018 Imports by Volume (Gallons per Country) YTD YTD Country 09/2017 09/2018 % Change 2017 2018 % Change MEXICO 49,299,573 57,635,840 16.9 % 552,428,635 601,679,687 8.9 % NETHERLANDS 11,656,759 13,024,144
August 2008 Euro area external trade deficit 9.3 bn euro 27.2 bn euro deficit for EU27
 STAT/08/143 17 October 2008 August 2008 Euro area external trade deficit 9.3 27.2 deficit for EU27 The first estimate for the euro area 1 (EA15) trade balance with the rest of the world in August 2008
Total Imports by Volume (Gallons per Country)
") 7/6/2018 Imports by Volume (Gallons per Country) YTD YTD Country 05/2017 05/2018 % Change 2017 2018 % Change MEXICO 71,166,360 74,896,922 5.2 % 302,626,505 328,397,135 8.5 % NETHERLANDS 12,039,171 13,341,929
7/6/2018 Imports by Volume (Gallons per Country) YTD YTD Country 05/2017 05/2018 % Change 2017 2018 % Change MEXICO 71,166,360 74,896,922 5.2 % 302,626,505 328,397,135 8.5 % NETHERLANDS 12,039,171 13,341,929
Corrigendum. OECD Pensions Outlook 2012 DOI: ISBN (print) ISBN (PDF) OECD 2012
 ISBN (PDF) OECD 2012") OECD Pensions Outlook 2012 DOI: http://dx.doi.org/9789264169401-en ISBN 978-92-64-16939-5 (print) ISBN 978-92-64-16940-1 (PDF) OECD 2012 Corrigendum Page 21: Figure 1.1. Average annual real net investment
OECD Pensions Outlook 2012 DOI: http://dx.doi.org/9789264169401-en ISBN 978-92-64-16939-5 (print) ISBN 978-92-64-16940-1 (PDF) OECD 2012 Corrigendum Page 21: Figure 1.1. Average annual real net investment
Total Imports by Volume (Gallons per Country)
") 12/6/2018 Imports by Volume (Gallons per Country) YTD YTD Country 10/2017 10/2018 % Change 2017 2018 % Change MEXICO 56,462,606 60,951,402 8.0 % 608,891,240 662,631,088 8.8 % NETHERLANDS 11,381,432 10,220,226
12/6/2018 Imports by Volume (Gallons per Country) YTD YTD Country 10/2017 10/2018 % Change 2017 2018 % Change MEXICO 56,462,606 60,951,402 8.0 % 608,891,240 662,631,088 8.8 % NETHERLANDS 11,381,432 10,220,226
Total Imports by Volume (Gallons per Country)
") 10/5/2018 Imports by Volume (Gallons per Country) YTD YTD Country 08/2017 08/2018 % Change 2017 2018 % Change MEXICO 67,180,788 71,483,563 6.4 % 503,129,061 544,043,847 8.1 % NETHERLANDS 12,954,789 12,582,508
10/5/2018 Imports by Volume (Gallons per Country) YTD YTD Country 08/2017 08/2018 % Change 2017 2018 % Change MEXICO 67,180,788 71,483,563 6.4 % 503,129,061 544,043,847 8.1 % NETHERLANDS 12,954,789 12,582,508
Total Imports by Volume (Gallons per Country)
") 2/6/2019 Imports by Volume (Gallons per Country) YTD YTD Country 11/2017 11/2018 % Change 2017 2018 % Change MEXICO 48,959,909 54,285,392 10.9 % 657,851,150 716,916,480 9.0 % NETHERLANDS 11,903,919 10,024,814
2/6/2019 Imports by Volume (Gallons per Country) YTD YTD Country 11/2017 11/2018 % Change 2017 2018 % Change MEXICO 48,959,909 54,285,392 10.9 % 657,851,150 716,916,480 9.0 % NETHERLANDS 11,903,919 10,024,814
Total Imports by Volume (Gallons per Country)
") 3/6/2019 Imports by Volume (Gallons per Country) YTD YTD Country 12/2017 12/2018 % Change 2017 2018 % Change MEXICO 54,169,734 56,505,154 4.3 % 712,020,884 773,421,634 8.6 % NETHERLANDS 11,037,475 8,403,018
3/6/2019 Imports by Volume (Gallons per Country) YTD YTD Country 12/2017 12/2018 % Change 2017 2018 % Change MEXICO 54,169,734 56,505,154 4.3 % 712,020,884 773,421,634 8.6 % NETHERLANDS 11,037,475 8,403,018
Scenario for the European Insurance and Occupational Pensions Authority s EU-wide insurance stress test in 2016
 17 March 2016 ECB-PUBLIC Scenario for the European Insurance and Occupational Pensions Authority s EU-wide insurance stress test in 2016 Introduction In accordance with its mandate, the European Insurance
August 2005 Euro-zone external trade deficit 2.6 bn euro 14.2 bn euro deficit for EU25
 STAT/05/132 20 October 2005 August 2005 Euro-zone external trade deficit 2.6 14.2 deficit for EU25 The first estimate for euro-zone 1 trade with the rest of the world in August 2005 was a 2.6 billion euro
Total Imports by Volume (Gallons per Country)
") 2/6/2018 Imports by Volume (Gallons per Country) YTD YTD Country 12/2016 12/2017 % Change 2016 2017 % Change MEXICO 50,839,282 54,169,734 6.6 % 682,281,387 712,020,884 4.4 % NETHERLANDS 10,630,799 11,037,475
2/6/2018 Imports by Volume (Gallons per Country) YTD YTD Country 12/2016 12/2017 % Change 2016 2017 % Change MEXICO 50,839,282 54,169,734 6.6 % 682,281,387 712,020,884 4.4 % NETHERLANDS 10,630,799 11,037,475
The Global Tax Reset 2017 Audit Committee Symposium
 The Global Tax Reset Copyright 2017 Deloitte Development LLC. All rights reserved. 2017 Audit Committee Symposium Anticipate. Navigate. Focus. 1 The Global Tax Reset General context Multinational companies
Guide to Treatment of Withholding Tax Rates. January 2018
 Guide to Treatment of Withholding Tax Rates Contents 1. Introduction 1 1.1. Aims of the Guide 1 1.2. Withholding Tax Definition 1 1.3. Double Taxation Treaties 1 1.4. Information Sources 1 1.5. Guide Upkeep
Total Imports by Volume (Gallons per Country)
") 5/4/2016 Imports by Volume (Gallons per Country) YTD YTD Country 03/2015 03/2016 % Change 2015 2016 % Change MEXICO 53,821,885 60,813,992 13.0 % 143,313,133 167,568,280 16.9 % NETHERLANDS 11,031,990 12,362,256
5/4/2016 Imports by Volume (Gallons per Country) YTD YTD Country 03/2015 03/2016 % Change 2015 2016 % Change MEXICO 53,821,885 60,813,992 13.0 % 143,313,133 167,568,280 16.9 % NETHERLANDS 11,031,990 12,362,256
Double Tax Treaties. Necessity of Declaration on Tax Beneficial Ownership In case of capital gains tax. DTA Country Withholding Tax Rates (%)
") Double Tax Treaties DTA Country Withholding Tax Rates (%) Albania 0 0 5/10 1 No No No Armenia 5/10 9 0 5/10 1 Yes 2 No Yes Australia 10 0 15 No No No Austria 0 0 10 No No No Azerbaijan 8 0 8 Yes No Yes
Double Tax Treaties DTA Country Withholding Tax Rates (%) Albania 0 0 5/10 1 No No No Armenia 5/10 9 0 5/10 1 Yes 2 No Yes Australia 10 0 15 No No No Austria 0 0 10 No No No Azerbaijan 8 0 8 Yes No Yes
STOXX EMERGING MARKETS INDICES. UNDERSTANDA RULES-BA EMERGING MARK TRANSPARENT SIMPLE
 STOXX Limited STOXX EMERGING MARKETS INDICES. EMERGING MARK RULES-BA TRANSPARENT UNDERSTANDA SIMPLE MARKET CLASSIF INTRODUCTION. Many investors are seeking to embrace emerging market investments, because
The Cyprus Economy: from Recovery to Sustainable Growth. Vincenzo Guzzo Resident Representative in Cyprus
 The Economy: from Recovery to Sustainable Growth Vincenzo Guzzo Resident Representative in Growth momentum remains strong 18 : Real GDP ( billion) 1 Deviation from Pre-Crisis Level and Trend (Percent)
DG TAXUD. STAT/11/100 1 July 2011
 DG TAXUD STAT/11/100 1 July 2011 Taxation trends in the European Union Recession drove EU27 overall tax revenue down to 38.4% of GDP in 2009 Half of the Member States hiked the standard rate of VAT since
Total Imports by Volume (Gallons per Country)
") 4/5/2018 Imports by Volume (Gallons per Country) YTD YTD Country 02/2017 02/2018 % Change 2017 2018 % Change MEXICO 53,961,589 55,268,981 2.4 % 108,197,008 114,206,836 5.6 % NETHERLANDS 12,804,152 11,235,029
4/5/2018 Imports by Volume (Gallons per Country) YTD YTD Country 02/2017 02/2018 % Change 2017 2018 % Change MEXICO 53,961,589 55,268,981 2.4 % 108,197,008 114,206,836 5.6 % NETHERLANDS 12,804,152 11,235,029
Total Imports by Volume (Gallons per Country)
") 6/6/2018 Imports by Volume (Gallons per Country) YTD YTD Country 04/2017 04/2018 % Change 2017 2018 % Change MEXICO 60,968,190 71,994,646 18.1 % 231,460,145 253,500,213 9.5 % NETHERLANDS 13,307,731 10,001,693
6/6/2018 Imports by Volume (Gallons per Country) YTD YTD Country 04/2017 04/2018 % Change 2017 2018 % Change MEXICO 60,968,190 71,994,646 18.1 % 231,460,145 253,500,213 9.5 % NETHERLANDS 13,307,731 10,001,693
Live Long and Prosper? Demographic Change and Europe s Pensions Crisis. Dr. Jochen Pimpertz Brussels, 10 November 2015
 Live Long and Prosper? Demographic Change and Europe s Pensions Crisis Dr. Jochen Pimpertz Brussels, 10 November 2015 Old-age-dependency ratio, EU28 45,9 49,4 50,2 39,0 27,5 31,8 2013 2020 2030 2040 2050
Global Tax Reset Transfer Pricing Documentation Summary. February 2018
 Global Tax Reset Transfer Pricing Summary February 2018 Global Tax Reset Transfer Pricing Summary Overview The Global Tax Reset Transfer Pricing Summary ( Guide ) compiles essential country-by-country
Double tax considerations on certain personal retirement scheme benefits
 www.pwc.com/mt The elimination of double taxation on benefits paid out of certain Maltese personal retirement schemes February 2016 Double tax considerations on certain personal retirement scheme benefits
Quarterly Financial Accounts Household net worth reaches new peak in Q Irish Household Net Worth
 Quarterly Financial Accounts Q4 2017 4 May 2018 Quarterly Financial Accounts Household net worth reaches new peak in Q4 2017 Household net worth rose by 2.1 per cent in Q4 2017. It now exceeds its pre-crisis
Communication on the future of the CAP
 Communication on the future of the CAP The CAP towards 2020: meeting the food, natural resources and territorial challenges of the future Tassos Haniotis, Director Agricultural Policy Analysis and Perspectives
Credit Ratings for 50 Countries and Regions by Dagong
 Review Summary at 1 st Anniversary of Issuance of Sovereign Credit Ratings for 50 Countries and Regions by Dagong July 11, 2011 Dagong officially released Sovereign credit ratings for 50 countries and
G-20 Trade Aggregates Based on IMF s Balance of Payments Database
 Twenty-Eighth Meeting of the IMF Committee on Balance of Payments Statistics Rio de Janeiro, Brazil October 27 29, 2015 BOPCOM 15/22 G-20 Trade Aggregates Based on IMF s Balance of Payments Database Prepared
Capital Flows, Cross-Border Banking and Global Liquidity. May 2012
 Capital Flows, Cross-Border Banking and Global Liquidity Valentina Bruno Hyun Song Shin May 2012 Bruno and Shin: Capital Flows, Cross-Border Banking and Global Liquidity 1 Gross Capital Flows Capital flows
Burden of Taxation: International Comparisons
 Burden of Taxation: International Comparisons Standard Note: SN/EP/3235 Last updated: 15 October 2008 Author: Bryn Morgan Economic Policy & Statistics Section This note presents data comparing the national
Today's CPI data: what you need to know
 Trend Macrolytics, LLC Donald Luskin, Chief Investment Officer Thomas Demas, Managing Director Michael Warren, Energy Strategist Data Insights: Consumer Price Index, Producer Price Index Friday, October
Today's CPI data: what you need to know
 Trend Macrolytics, LLC Donald Luskin, Chief Investment Officer Thomas Demas, Managing Director Michael Warren, Energy Strategist Data Insights: Consumer Price Index, Producer Price Index Wednesday, November
ECFIN-C3 (2009) PART 1 MAIN DEVELOPMENTS
 PART 1 MAIN DEVELOPMENTS") ECFIN-C3 (2009) PART 1 MAIN DEVELOPMENTS Methodological note Since the issue for the second quarter of 2004, nominal and real effective exchange rates presented in this report are calculated based on a
ECFIN-C3 (2009) PART 1 MAIN DEVELOPMENTS Methodological note Since the issue for the second quarter of 2004, nominal and real effective exchange rates presented in this report are calculated based on a
Total Imports by Volume (Gallons per Country)
") 3/7/2018 Imports by Volume (Gallons per Country) YTD YTD Country 01/2017 01/2018 % Change 2017 2018 % Change MEXICO 54,235,419 58,937,856 8.7 % 54,235,419 58,937,856 8.7 % NETHERLANDS 12,265,935 10,356,183
3/7/2018 Imports by Volume (Gallons per Country) YTD YTD Country 01/2017 01/2018 % Change 2017 2018 % Change MEXICO 54,235,419 58,937,856 8.7 % 54,235,419 58,937,856 8.7 % NETHERLANDS 12,265,935 10,356,183
EUROPA - Press Releases - Taxation trends in the European Union EU27 tax...of GDP in 2008 Steady decline in top corporate income tax rate since 2000
 DG TAXUD STAT/10/95 28 June 2010 Taxation trends in the European Union EU27 tax ratio fell to 39.3% of GDP in 2008 Steady decline in top corporate income tax rate since 2000 The overall tax-to-gdp ratio1
EMPLOYMENT RATE Employed/Working age population (15-64 years)
") 1 EMPLOYMENT RATE 1980-2003 Employed/Working age population (15-64 years 80 % Finland (Com 75 70 65 60 EU-15 Finland (Stat. Fin. 55 50 80 82 84 86 88 90 92 94 96 98 00 02 9.9.2002/SAK /TL Source: European
1 EMPLOYMENT RATE 1980-2003 Employed/Working age population (15-64 years 80 % Finland (Com 75 70 65 60 EU-15 Finland (Stat. Fin. 55 50 80 82 84 86 88 90 92 94 96 98 00 02 9.9.2002/SAK /TL Source: European
Quarterly Investment Update First Quarter 2018
 Quarterly Investment Update First Quarter 2018 Dimensional Fund Advisors Canada ULC ( DFA Canada ) is not affiliated with [insert name of Advisor]. DFA Canada is a separate and distinct company. Market
Developing Housing Finance Systems
 Developing Housing Finance Systems Veronica Cacdac Warnock IIMB-IMF Conference on Housing Markets, Financial Stability and Growth December 11, 2014 Based on Warnock V and Warnock F (2012). Developing Housing
Today's CPI data: what you need to know
 Trend Macrolytics, LLC Donald Luskin, Chief Investment Officer Thomas Demas, Managing Director Michael Warren, Energy Strategist Data Insights: Consumer Price Index, Producer Price Index Friday, July 14,
APA & MAP COUNTRY GUIDE 2017 DENMARK
 APA & MAP COUNTRY GUIDE 2017 DENMARK Managing uncertainty in the new tax environment DENMARK KEY FEATURES Competent authority Danish Tax Office ( SKAT ) APA provisions/ guidance Types of APAs available
Cyprus has signed Double Tax Treaties (DTTs) and conventions with 61 countries.
 and conventions with 61 countries.") INFORMATION SHEET 14 Title: Cyprus Double Tax Treaties Authored: January 2016 Updated: August 2016 Company: Reference: Chelco VAT Ltd Cyprus Ministry of Finance General Cyprus has signed Double Tax Treaties
INFORMATION SHEET 14 Title: Cyprus Double Tax Treaties Authored: January 2016 Updated: August 2016 Company: Reference: Chelco VAT Ltd Cyprus Ministry of Finance General Cyprus has signed Double Tax Treaties
Today's CPI data: what you need to know
 Trend Macrolytics, LLC Donald Luskin, Chief Investment Officer Thomas Demas, Managing Director Michael Warren, Energy Strategist Data Insights: Consumer Price Index, Producer Price Index Thursday, July
Summary 715 SUMMARY. Minimum Legal Fee Schedule. Loser Pays Statute. Prohibition Against Legal Advertising / Soliciting of Pro bono
 Summary Country Fee Aid Angola No No No Argentina No, with No No No Armenia, with No No No No, however the foreign Attorneys need to be registered at the Chamber of Advocates to be able to practice attorney
Report Penalties and measures imposed under the UCITS Directive in 2016 and 2017
 Report Penalties and measures imposed under the Directive in 206 and 207 4 April 209 ESMA34-45-65 4 April 209 ESMA34-45-65 Table of Contents Executive Summary... 3 2 Background and relevant regulatory
International Statistical Release
 International Statistical Release This release and additional tables of international statistics are available on efama s website (www.efama.org). Worldwide Investment Fund Assets and Flows Trends in the
Today's CPI data: what you need to know
 Trend Macrolytics, LLC Donald Luskin, Chief Investment Officer Thomas Demas, Managing Director Michael Warren, Energy Strategist Data Insights: Consumer Price Index, Producer Price Index Friday, August
PENTA CLO 2 B.V. (the "Issuer")
") THIS NOTICE CONTAINS IMPORTANT INFORMATION OF INTEREST TO THE REGISTERED AND BENEFICIAL OWNERS OF THE NOTES (AS DEFINED BELOW). IF APPLICABLE, ALL DEPOSITARIES, CUSTODIANS AND OTHER INTERMEDIARIES RECEIVING
THIS NOTICE CONTAINS IMPORTANT INFORMATION OF INTEREST TO THE REGISTERED AND BENEFICIAL OWNERS OF THE NOTES (AS DEFINED BELOW). IF APPLICABLE, ALL DEPOSITARIES, CUSTODIANS AND OTHER INTERMEDIARIES RECEIVING
Today's CPI data: what you need to know
 Trend Macrolytics, LLC Donald Luskin, Chief Investment Officer Thomas Demas, Managing Director Michael Warren, Energy Strategist Data Insights: Consumer Price Index, Producer Price Index Thursday, October
Sovereign Risks and Financial Spillovers
 Sovereign Risks and Financial Spillovers International Monetary Fund October 21 Roadmap What is the Outlook for Global Financial Stability? Sovereign Risks and Financial Fragilities Sovereign and Banking
EU-28 STEEL SCRAP STATISTICS. by Rolf Willeke Statistics Advisor of the BIR Ferrous Division For EFR a branch of EuRIC (30 October 2017)
") EU-28 STEEL SCRAP STATISTICS (JANUARY JUNE 2017) by Rolf Willeke Statistics Advisor of the BIR Ferrous Division For EFR a branch of EuRIC (30 October 2017) C O N T E N T S EU-28 and World Crude Steel Production
EU-28 STEEL SCRAP STATISTICS (JANUARY JUNE 2017) by Rolf Willeke Statistics Advisor of the BIR Ferrous Division For EFR a branch of EuRIC (30 October 2017) C O N T E N T S EU-28 and World Crude Steel Production
SPECIAL REPORT: U.S. ALUMINUM IMPORT MONITOR. Data through May Issued: July 2018
 SPECIAL REPORT: U.S. ALUMINUM IMPORT MONITOR Data through May 218 Issued: July 218 OVERVIEW OF SECTION 232 Section 232 of the Trade Expansion Act of 1962, as amended, authorizes the President to adjust
Harmonised Index of Consumer Prices (HICP) August 2015
 August 2015") Aug-14 Sep-14 Oct-14 Nov-14 Dec-14 Jan-15 Feb-15 Mar-15 Apr-15 May-15 Jun-15 MONTENEGRO STATISTICAL OFFICE R E L E A S E Broj: 201 Podgorica, 18 September 2015 When using the data please name the source
Aug-14 Sep-14 Oct-14 Nov-14 Dec-14 Jan-15 Feb-15 Mar-15 Apr-15 May-15 Jun-15 MONTENEGRO STATISTICAL OFFICE R E L E A S E Broj: 201 Podgorica, 18 September 2015 When using the data please name the source
Today's CPI data: what you need to know
 Trend Macrolytics, LLC Donald Luskin, Chief Investment Officer Thomas Demas, Managing Director Michael Warren, Energy Strategist Data Insights: Consumer Price Index, Producer Price Index Wednesday, December
Today's CPI data: what you need to know
 Trend Macrolytics, LLC Donald Luskin, Chief Investment Officer Thomas Demas, Managing Director Michael Warren, Energy Strategist Data Insights: Consumer Price Index, Producer Price Index Wednesday, February
SEE macroeconomic outlook Recovery gains traction, fiscal discipline improving. Alen Kovac, Chief Economist EBC May 2016 Ljubljana
 SEE macroeconomic outlook Recovery gains traction, fiscal discipline improving Alen Kovac, Chief Economist EBC May 216 Ljubljana Real economy highlights Recent GDP track record reveals more favorable footprint
Today's CPI data: what you need to know
 Trend Macrolytics, LLC Donald Luskin, Chief Investment Officer Thomas Demas, Managing Director Michael Warren, Energy Strategist Data Insights: Consumer Price Index, Producer Price Index Friday, January
Today's CPI data: what you need to know
 Trend Macrolytics, LLC Donald Luskin, Chief Investment Officer Thomas Demas, Managing Director Michael Warren, Energy Strategist Data Insights: Consumer Price Index, Producer Price Index Wednesday, April
TAXATION OF TRUSTS IN ISRAEL. An Opportunity For Foreign Residents. Dr. Avi Nov
 TAXATION OF TRUSTS IN ISRAEL An Opportunity For Foreign Residents Dr. Avi Nov Short Bio Dr. Avi Nov is an Israeli lawyer who represents taxpayers, individuals and entities. Areas of Practice: Tax Law,
STANDARD FOR AUTOMATIC EXCHANGE OF FINANCIAL ACCOUNT INFORMATION. Philip Kerfs, OECD
 STANDARD FOR AUTOMATIC EXCHANGE OF FINANCIAL ACCOUNT INFORMATION Philip Kerfs, OECD Overview Background, context and timeline The Standard: basic approach and key features Next steps: implementing the
NOTE. for the Interparliamentary Meeting of the Committee on Budgets
 NOTE for the Interparliamentary Meeting of the Committee on Budgets THE ROLE OF THE EU BUDGET TO SUPPORT MEMBER STATES IN ACHIEVING THEIR ECONOMIC OBJECTIVES AS AGREED WITHIN THE FRAMEWORK OF THE EUROPEAN
REPORT FROM THE COMMISSION TO THE EUROPEAN PARLIAMENT, THE COUNCIL, THE EUROPEAN ECONOMIC AND SOCIAL COMMITTEE AND THE COMMITTEE OF THE REGIONS
 EUROPEAN COMMISSION Brussels,.4.29 COM(28) 86 final/ 2 ANNEXES to 3 ANNEX to the REPORT FROM THE COMMISSION TO THE EUROPEAN PARLIAMENT, THE COUNCIL, THE EUROPEAN ECONOMIC AND SOCIAL COMMITTEE AND THE COMMITTEE
International Statistical Release
 International Statistical Release This release and additional tables of international statistics are available on efama s website (www.efama.org). Worldwide Investment Fund Assets and Flows Trends in the
FY2016 RESULTS. 1 February 2016 to 31 January Inditex continues to roll out its global, fully integrated store and online model.
 FY2016 RESULTS 1 February 2016 to 31 January 2017 Inditex continues to roll out its global, fully integrated store and online model. Strong operating performance: Net sales for FY2016 reached 23.3 billion,
SPECIAL REPORT: U.S. ALUMINUM IMPORT MONITOR. March Issued: May 2018
 SPECIAL REPORT: U.S. ALUMINUM IMPORT MONITOR March 218 Issued: May 218 OVERVIEW OF SECTION 232 Section 232 of the Trade Expansion Act of 1962, as amended, authorizes the President to adjust the imports
Enterprise Europe Network SME growth outlook
 Enterprise Europe Network SME growth outlook 2018-19 een.ec.europa.eu 2 Enterprise Europe Network SME growth outlook 2018-19 Foreword The European Commission wants to ensure that small and medium-sized
3 Labour Costs. Cost of Employing Labour Across Advanced EU Economies (EU15) Indicator 3.1a
 Indicator 3.1a") 3 Labour Costs Indicator 3.1a Indicator 3.1b Indicator 3.1c Indicator 3.2a Indicator 3.2b Indicator 3.3 Indicator 3.4 Cost of Employing Labour Across Advanced EU Economies (EU15) Cost of Employing Labour
3 Labour Costs Indicator 3.1a Indicator 3.1b Indicator 3.1c Indicator 3.2a Indicator 3.2b Indicator 3.3 Indicator 3.4 Cost of Employing Labour Across Advanced EU Economies (EU15) Cost of Employing Labour
 3. Bloomberg European Local Currency Sovereign Bloomberg Belgium Sovereign Bond Index 1 to 5 Year Bloomberg Bulgaria Local Sovereign Index Bloomberg Czech Rep Local Sovereign Index Bloomberg Eurozone
Information Leaflet No. 5
 Information Leaflet No. 5 REGISTRATION OF EXTERNAL COMPANIES INFORMATION LEAFLET NO. 5 / May 2017 1. INTRODUCTION An external (foreign) limited company registered abroad may establish a branch in the State.
Comparing pay trends in the public services and private sector. Labour Research Department 7 June 2018 Brussels
 Comparing pay trends in the public services and private sector Labour Research Department 7 June 2018 Brussels Issued to be covered The trends examined The varying patterns over 14 years and the impact
PRACTICAL ASPECTS AND DILEMMAS OF MEDIUM TERM FISCAL PLANNING - CASE OF SLOVENIA. Copyright rests with the author. All rights reserved.
 PRACTICAL ASPECTS AND DILEMMAS OF MEDIUM TERM FISCAL PLANNING - CASE OF SLOVENIA Copyright rests with the author. All rights reserved. Saša Jazbec, Ministry of Finance Republic of Slovenia MARCH 2018 Agenda
International Statistical Release
 International Statistical Release This release and additional tables of international statistics are available on efama s website (www.efama.org) Worldwide Investment Fund Assets and Flows Trends in the