TRIPLE SCREEN TRADING AND BLOOMBERG INTRODUCTION
|
|
|
- Millicent Horton
- 5 years ago
- Views:
Transcription
1 TAFX TRIPLE SCREEN TRADING AND BLOOMBERG INTRODUCTION
2 Disclaimer is in no way affiliated or representative of any other company, organisation, club or society, and the views presented are solely our own opinions. The author(s) is not a licensed investment advisor. Our services are educational tools designed to assist you in your personal judgment. It is not designed to replace your licensed financial consultant, and nothing in the content shall be construed to be an offer or solicitation for the purchase or sale of a security. All content on our website and related services is for informational purposes only, and opinions have been made on a general basis. No consideration has been given to any particular individual or specific investment objectives, financial situations or other circumstances. As such, the content should not be relied upon as authoritative without further being subject to the recipient s own independent verification and exercise of judgment. The fact that the content has been made available constitutes neither a recommendation to enter into a particular transaction nor a representation that any product described within is suitable or appropriate for the reader. Readers should be aware that many of the products which may be described within involve significant risks and may not be suitable for all investors, and that any decision to enter into transactions involving such products should not be made unless all such risks are understood and an independent determination has been made that such transactions would be appropriate.

3 History of Triple Screen System Developed by Dr. Alexander Elder since 1985 Triple Screen applies three screens to every trade Trades that pass the test have higher degree of profitability More than a training system, it is a style of trading
4 Choosing Timeframes: The Factor of Five Analyse the market in at least two timeframes The shorter timeframe has to be five times shorter than the longer one This method demands that you examine the long-term chart first (tide direction) Use the waves that go against the tide for entering positions
5 First Screen: Market Tide Use of MACD Histogram slope in weekly charts to identify long term trends First screen takes away one of three choices: buy, sell, or stand aside Swim with the tide or stay out of the water
6 First Screen: MACD
7 Second Screen: Market Wave Identifies the wave that goes against the tide When weekly trend is up, triple screen takes only buy signals from daily oscillators and ignores their sell signals When weekly trend is down, triple screen takes only shorting signals from daily oscillators and ignores their buy signals You can use Stochastics
8 Third Screen: Theory Chart
9 Third Screen: Intraday Breakout Trailing buy-stop technique in uptrend Trailing sell-stop technique in downtrends WEEKLY TREND DAILY TREND ACTION ORDER Up Up Stand aside None Up Down Go long Trailing buy-stop Down Down Stand aside None Down Up Go short Trailing sell-stop

10 Third Screen: Intraday Breakout


11 What is a Bloomberg Terminal? Where are they? Hon Sui Sen Memorial Library CAMRI Lab Mochtar Riady Bldg NLB HQ Business Level

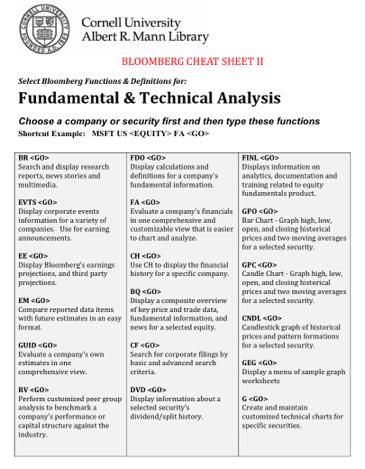
12 Bloomberg Keyboard Controls

13 Bloomberg Keyboard Controls

14 Main Screen after Log On Capture: GRAB <GO>

15 Seeking Help Capture: GRAB <GO> Help: HELP HELP

16 Equity Description Singapore Airline SIA SP <EQUITY> <GO> DES <GO>
17 Moving Average Convergence Divergence Singapore Airline SIA SP <EQUITY> <GO> DES <GO> MACD <GO>
18 Stochastics Singapore Airline SIA SP <EQUITY> <GO> DES <GO> MACD <GO> TAS <GO>
19 Additional Resources
USING THE STOCHASTIC OSCILLATOR 12th February 2015
 TAFX USING THE STOCHASTIC OSCILLATOR 12th February 2015 Disclaimer is in no way affiliated or representative of any other company, organisation, club or society, and the views presented are solely our
MACD INDICATOR Moving Average Convergence Divergence Part Three
 MACD INDICATOR Moving Average Convergence Divergence Part Three Reprinted from The Traders Journal Volume 2 Issue 3 By Jason Sidney Following on from the previous article on the MACD indicator we established
Of Trading. The Alexander Elder Way. Triple Screen Trading
 Triple Screen Trading System: The Alexander Elder Way Of Trading Ankit Jaiswal This triple screen trading system was developed by Dr Alexander Elder. This is a mechanism which goes through the practical
Technical Indicators
 Taken From: Technical Analysis of the Financial Markets A Comprehensive Guide to Trading Methods & Applications John Murphy, New York Institute of Finance, Published 1999 Technical Indicators Technical
Gold Outlook. Bear bug hits gold!!! CMP - $1150. ICICI Securities Ltd. Retail Equity Research. November 5, 2014
 Gold Outlook. Gold price performance of last 5 years 44% -36% 30% 10% 7% -28% -5% 2010 2011 2012 2013 YTD Year 2014 Bear bug hits gold!!! CMP - $1150 Global commodity prices have remained in a downward
FOREX TRADING STRATEGIES.
 FOREX TRADING STRATEGIES www.ifcmarkets.com www.ifcmarkets.com 2 One of the most powerful means of winning a trade is the portfolio of Forex trading strategies applied by traders in different situations.
Technical Analysis Workshop Series. Session Three
 Technical Analysis Workshop Series Session Three DISCLOSURES & DISCLAIMERS This research material has been prepared by NUS Invest. NUS Invest specifically prohibits the redistribution of this material
Maybank IB. Understanding technical analysis. by Lee Cheng Hooi. 24 September Slide 1 of Maybank-IB
 Maybank IB Understanding technical analysis 24 September 2011 by Lee Cheng Hooi Slide 1 of 40 Why technical analysis? 1) Market action discounts everything 2) Prices move in trends 3) History repeats itself
Williams Percent Range
 Williams Percent Range (Williams %R or %R) By Marcille Grapa www.surefiretradingchallenge.com RISK DISCLOSURE STATEMENT / DISCLAIMER AGREEMENT Trading any financial market involves risk. This report and
TD AMERITRADE Technical Analysis Night School Week 2
 TD AMERITRADE Technical Analysis Night School Week 2 Hosted By Derek Moore Director, National Education For the audio portion of today s webcast, please enable your computer speakers. Past performance
Technical Analysis Workshop Series. Session Ten Semester 2 Week 4 Oscillators Part 1
 Technical Analysis Workshop Series Session Ten Semester 2 Week 4 Oscillators Part 1 DISCLOSURES & DISCLAIMERS This research material has been prepared by NUS Invest. NUS Invest specifically prohibits the
Convergence and Divergence
 Convergence and Divergence Momentum: The Verge of Success Momentum plays a key role in trend analysis. Trends are composed of a series of price swings. It is a trader s edge to know when a trend is slowing
Planetary 2 Library ADVANCED TRADERS LIBRARY. Introduction: Benefits: Included in this Library: L I B R A R I E S. Strategies
 Planetary 2 Library ADVANCED TRADERS LIBRARY Introduction: The Advanced Traders Library I is a powerful compilation of strategies that will give you more than just a starting point for strategy development.
Counter Trend Trades. (Trading Against The Trend) By Russ Horn
 By Russ Horn") Counter Trend Trades (Trading Against The Trend) By Russ Horn 1 RISK DISCLOSURE STATEMENT / DISCLAIMER AGREEMENT Trading any financial market involves risk. This report and all and any of its contents
Counter Trend Trades (Trading Against The Trend) By Russ Horn 1 RISK DISCLOSURE STATEMENT / DISCLAIMER AGREEMENT Trading any financial market involves risk. This report and all and any of its contents
Chart Pattern Secrets
 Chart Pattern Secrets June 14, 2018 Next Alert: 06/19/18 The Trading System: Application of Trading Chart Patterns with Futures and Option Contracts Copyright 1997 All rights reserved. 1 2 3 4 5 5/15/18:
Technical Analysis Workshop Series. Session Two
 Technical Analysis Workshop eries ession Two DICLOURE & DICLAIMER This research material has been prepared by NU Invest. NU Invest specifically prohibits the redistribution of this material in whole or
Stock selection for traders Charles Schwab & Co., Inc. ( Schwab ). All rights reserved. Member SIPC. [ Y)
. All rights reserved. Member SIPC. [ Y)") Stock selection for traders 2018 Charles Schwab & Co., Inc. ( Schwab ). All rights reserved. Member SIPC. [0617-718Y) We believe in the power of investing to transform peoples lives. We look at the world
Stock selection for traders 2018 Charles Schwab & Co., Inc. ( Schwab ). All rights reserved. Member SIPC. [0617-718Y) We believe in the power of investing to transform peoples lives. We look at the world
Understanding Oscillators & Indicators March 4, Clarify, Simplify & Multiply
 Understanding Oscillators & Indicators March 4, 2015 Clarify, Simplify & Multiply Disclaimer U.S. Government Required Disclaimer Commodity Futures Trading Commission Futures and Options trading has large
By Tri, Senior Analyst
 1/1/2014 Trend Following By Tri, Senior Analyst NUS Students Investment Society NATIONAL UNIVERSITY OF SINGAPORE Introduction Trend following was introduced by Richard Dennis when he taught trading strategies
Inter-market Technical Analysis for April 22, Summary Chart TheoTrade LLC. All rights reserved.
 1 Weekly Inter-market Technical Report Summary Chart 1 2018 TheoTrade LLC. All rights reserved. 2 Intraday Intermarket Volatility is returning to the markets, particularly with the collapse/sell-swing
SPX for the smaller major-4 triangle or SPX to complete the double zigzag. Figure 1.
 Today s break -finally- below SPX2625 (and SPX2613) places the Ball now firmly in the Bears camp, albeit today s strong rally off the lows. And the two main bear counts remain the focus for now: SPX2579-2568
Chapter 2.3. Technical Analysis: Technical Indicators
 Chapter 2.3 Technical Analysis: Technical Indicators 0 TECHNICAL ANALYSIS: TECHNICAL INDICATORS Charts always have a story to tell. However, from time to time those charts may be speaking a language you
The 30-Minute Breakout Strategy. Trading Concepts, Inc.
 The 30-Minute Breakout Strategy The 30-Minute (First Half-Hour) Breakout Strategy Once the Market moves in either direction off of the OPEN and penetrates UP through the HIGH or DOWN through LOW of the
Index. long-term 200-day, 45 market cycle, myths, very long-term, weekly-based longer-term, 46-47
 Appel_Index2.qxd 2/22/05 11:07 AM Page 229 Index Symbols 10-day rate of change, NYSE Index advance-decline line, 133-134 18-month market cycles, 104 21-day rate of change, NYSE Index advance-decline line,
- My 4 Favorite Trades - Essential Trades of a Professional Trader
 presented by Thomas Wood MicroQuant SM Divergence Trading Workshop Day One - My 4 Favorite Trades - Essential Trades of a Professional Trader Risk Disclaimer Trading or investing carries a high level of
Allahabad Bank (ALLBAN): Down trend line breakout after base formation
: Down trend line breakout after base formation") Stocks on the move Scrip I-Direct Code Action Target Stoploss Upside Graphite India CAREVE Buy in the range of 450.00-458.00 510.00 425.00 12% Time Frame: 3 Months Research Analysts Dharmesh Shah dharmesh.shah@icicisecurities.com
Stocks on the move Scrip I-Direct Code Action Target Stoploss Upside Graphite India CAREVE Buy in the range of 450.00-458.00 510.00 425.00 12% Time Frame: 3 Months Research Analysts Dharmesh Shah dharmesh.shah@icicisecurities.com
Books & Trades #244. July 12, Favorite pattern Traders Camp discount Special. Dear Trader,
 Books & Trades #244 July 12, 2017 Favorite pattern Traders Camp discount Special Dear Trader, I d like to share with you a few slides from the Password course I am teaching at SpikeTrade.com in June and
Power Ranger Strategy
 Power Ranger Strategy Power Ranger Strategy Strategy Concept Using the common oscillator, the Stochastic to identify entry for early range trading. Time-frame H1 and above. Currency Pairs All currency
SXXP and SX5E nearing their downtrends. Gold remains a short in line with the trend. Dollar index at key support. EURUSD bearish candle
 Andy Dodd MSTA - +44 020 7031 4651 adodd@louiscapital.com Twitter : @louiscaptech SXXP and SX5E nearing their downtrends. Gold remains a short in line with the trend Dollar index at key support EURUSD
AUTHOR: NG EE HWA, TRAINER, CHARTNEXUS TRADING WITH RSI
 AUTHOR: NG EE HWA, TRAINER, CHARTNEXUS TRADING WITH RSI While the use of Relative Strength Index (RSI) to get technical buy and sell signals in a range-bound market is well understood, the use of this
Advanced Trading Systems Collection MACD DIVERGENCE FOREX TRADING SYSTEM
 MACD DIVERGENCE FOREX TRADING SYSTEM 1 This system will cover the MACD divergence. With this forex trading system you can trade any currency pair (I suggest EUR/USD and GBD/USD when you start), and you
iii Figure 1. SPX 60-min chart.
 Today the S&P500 (not the DJIA, NAS and NDX) made a marginally lower low below yesterday s low (SPX2527 vs SPX2529), which forced me to re-assess the short-term Elliott-wave count I have for this move
Using Oscillators & Indicators Properly May 7, Clarify, Simplify & Multiply
 Using Oscillators & Indicators Properly May 7, 2016 Clarify, Simplify & Multiply Disclaimer U.S. Government Required Disclaimer Commodity Futures Trading Commission Futures and Options trading has large
Level III Learning Objectives by chapter
 Level III Learning Objectives by chapter 1. Triple Screen Trading System Evaluate the Triple Screen Trading System and identify its strengths Generalize the characteristics of this system that would make
FOREX PROFITABILITY CODE
 FOREX PROFITABILITY CODE Forex Secret Protocol Published by Old Tree Publishing CC Suite 509, Private Bag X503 Northway, 4065, KZN, ZA www.oldtreepublishing.com Copyright 2013 by Old Tree Publishing CC,
BTIG Technical Strategy Year-End Chart Book December 2014
 BTIG Technical Strategy Year-End Chart Book December 2014 This year has been one for the technicians - trends and momentum have dominated conversations about the markets, and for good reason. The following
Stay on the Right Side & Finishing the Year Strong! From the Active Trend Trader
 Stay on the Right Side & Finishing the Year Strong! From the Active Trend Trader Disclaimer U.S. GOVERNMENT REQUIRED DISCLAIMER COMMODITY FUTURES TRADING COMMISSION FUTURES AND OPTIONS TRADING HAS LARGE
Now You Can Have These Trading Gems- Free!
 Presents Killer Patterns Now You Can Have These Trading Gems- Free! The Trading Info Revealed Here is not the Same as the Proven WizardTrader.com Methods But Works Well With Them 1 Copyright Information
MAGIC FOREX DIVERGENCE Trading Guide
 Tim Trush & Julie Lavrin Introducing MAGIC FOREX DIVERGENCE Trading Guide Your guide to financial freedom. Tim Trush, Julie Lavrin, T&J Profit Club, 2017, All rights reserved www.forexmystery.com Table
The Launchpad Strategy
 presented by Thomas Wood MicroQuant SM Divergence Trading Workshop Day One The Launchpad Strategy Risk Disclaimer Trading or investing carries a high level of risk, and is not suitable for all persons.
Introduction. Leading and Lagging Indicators
 1/12/2013 Introduction to Technical Indicators By Stephen, Research Analyst NUS Students Investment Society NATIONAL UNIVERSITY OF SINGAPORE Introduction Technical analysis comprises two main categories:
Chart Pattern Secrets
 Chart Pattern Secrets October 04, 2018 Next Alert: 10/09/18 The Trading System: Application of Trading Chart Patterns with Futures and Option Contracts Copyright 1997 All rights reserved. 1 2 3 9/20/18:
StockFinder Workbook. Fast and flexible sorting and rule-based scanning. Charting with the largest selection of indicators available
 StockFinder Workbook revised Apr 23, 2009 Charting with the largest selection of indicators available Fast and flexible sorting and rule-based scanning Everything you need to make your own decisions StockFinder
Test Your Chapter 1 Knowledge
 Self-Test Answers Test Your Chapter 1 Knowledge 1. Which is the preferred chart type in LOCKIT? The preferred chart type in LOCKIT is the candle chart because candle patterns are part of the decision-making
Cross Asset Technical Vista
 Cross Asset Technical Vista June, 2015 Markets and Products Analysis INVESTMENT PORTOFOLIO ANALYSIS DIVISION Important Disclaimer in page 2 1 Disclaimer Disclaimer: The information herein is believed to
Adaptive Oscillator for TradeStation
 1 Adaptive Oscillator for TradeStation PZT PROOF is an adaptive oscillator based on a statistical range of price action. Similar to a stochastic indicator, it creates values by comparing the distance between
Technical Analysis. A Language of the Market
 Technical Analysis A Language of the Market Acknowledgement: Most of the slides were originally from CFA Institute and I adapted them for QF206 https://www.cfainstitute.org/learning/products/publications/inv/documents/forms/allitems.aspx
ValueCharts for Sierra Chart
 ValueCharts for Sierra Chart Contents: What are ValueCharts? What are ValueAlerts SM? What are ValueBars SM? What are ValueLevels SM? What are ValueFlags SM? What are SignalBars SM? What is MQ Cycle Finder?
GUIDE TO STOCK trading tools
 P age 1 GUIDE TO STOCK trading tools VI. TECHNICAL INDICATORS AND OSCILLATORS I. Introduction to Indicators and Oscillators Technical indicators, to start, are data points derived from a specific formula.
Divergence and Momentum Trading
 presented by Thomas Wood MicroQuant SM Divergence Trading Workshop Day One Divergence and Momentum Trading Risk Disclaimer Trading or investing carries a high level of risk, and is not suitable for all
Trading Lessons from the Intraday Frame (study)
") 1 Daily "Idealized Trades" Report Trading Lessons from the Intraday Frame (study) 1 2018 TheoTrade LLC. All rights reserved. 2 Trading Lessons from the Intraday Frame (1-min) 2 2018 TheoTrade LLC. All
1 Daily "Idealized Trades" Report Trading Lessons from the Intraday Frame (study) 1 2018 TheoTrade LLC. All rights reserved. 2 Trading Lessons from the Intraday Frame (1-min) 2 2018 TheoTrade LLC. All
CMT LEVEL I CURRICULUM Self-Evaluation
 CMT LEVEL I CURRICULUM Self-Evaluation DEAR CFA CHARTERHOLDER, As a CFA charterholder, the requirement that you sit for the CMT Level I exam is waived. However, the content in the CMT Level I Curriculum
Chapter 2.3. Technical Indicators
 1 Chapter 2.3 Technical Indicators 0 TECHNICAL ANALYSIS: TECHNICAL INDICATORS Charts always have a story to tell. However, sometimes those charts may be speaking a language you do not understand and you
Quad EMA Strategy. by Admiral Markets Trading Camp
 Quad EMA Strategy by Admiral Markets Trading Camp Contents About the Author 3 Strategy Description 4 Exponential Moving Average 5 Awesome Oscillator 9 MACD Indicator 13 Conclusion 19 About the Author Nenad
OSCILLATORS. TradeSmart Education Center
 OSCILLATORS TradeSmart Education Center TABLE OF CONTENTS Oscillators Bollinger Bands... Commodity Channel Index.. Fast Stochastic... KST (Short term, Intermediate term, Long term) MACD... Momentum Relative
THE TREND RIDING STRATEGY
 THE TREND RIDING STRATEGY IMPORTANT : As an added bonus for downloading this report, you also received additional free training videos. To access your bonuses, go to: http://www.sublimeforexchampions.com/
1 P a g e. Table 1. Ideal wave tracker table for nano and micro-waves of minute-v
 Yesterday I concluded We may get some profit taking over the Holiday; but it should only be corrective (small 4 th waves). And today certainly looked like that with only a 5p range on the S&P. Hence the
Monthly Dairy Technical Commentary Thursday September 5, 2013
 Monthly Dairy Technical Commentary Thursday September 5, 2013 CME Class III Milk Futures The weekly price trend for Class III Milk points down from its August 2011 high, and the latest breakdown below
Chapter 24 DIVERGENCE DECISIONS
 Chapter 24 DIVERGENCE DECISIONS The subject of divergence is one that we will approach with the utmost caution. We hope we have made ourselves clear in the other volumes of this course that we have little
TRADE PLANNING WITH SIMPLE SUPPORT & RESISTANCE. Presented by Nabil Mattar FX Technical Analyst
 TRADE PLANNING WITH SIMPLE SUPPORT & RESISTANCE Presented by Nabil Mattar FX Technical Analyst 1 DISCLAIMER IG Asia Pte Ltd (Co. Reg. No. 20051002K) holds a capital markets services licence from the Monetary
Major support levels are estimated at the following levels such as 7000, (50 SMA), and 6500.
, and 6500.") 1-5 The Big Picture Source: Bloomberg PSEi Composite Index Index is still testing the overhead resistance provided by the downtrend line and the 200-day Simple Moving Average, and while doing so upward
1-5 The Big Picture Source: Bloomberg PSEi Composite Index Index is still testing the overhead resistance provided by the downtrend line and the 200-day Simple Moving Average, and while doing so upward
PRESENTS THE MAXTRADE DOMINATOR TRADING SYSTEM. By Toshko Raychev
 PRESENTS THE MAXTRADE DOMINATOR TRADING SYSTEM By Toshko Raychev RISK DISCLOSURE STATEMENT / DISCLAIMER AGREEMENT Trading any financial market involves risk. This report and all and any of its contents
Secrets of Forex Trading
 Secrets of Forex Trading www.elliott-wave.webs.com Spatial Trades 2/5/2013 Spatial Trades Inc. SURESH UPRETY Table of Contents CALENDAR ANALYSIS... 4 UNDERSTANDING OSCILLATORS AND VOLUME... 6 ELLIOTT WAVE
Presents. Forex Profit Boost
 Presents Forex Profit Boost Forex Profit Boost Published by Alzaiak Trading CC Nominee Old Tree Publishing CC Suite 509, Private Bag X503 Northway, 4065, KZN, ZA www.oldtreepublishing.com Copyright 2014
Lara s Weekly. S&P500 + GOLD + USOIL Elliott Wave & Technical Analysis. Lara Iriarte CMT 23 February, 2018
 Lara s Weekly S&P500 + GOLD + USOIL Elliott Wave & Technical Analysis Lara Iriarte CMT 23 February, 2018 S&P 500 Contents S&P 500 GOLD USOIL About Disclaimer 3 18 36 48 48 S&P 500 S&P 500 Upwards movement
The Strategies Working Best in Today s E-Mini Market
 The Strategies Working Best in Today s E-Mini Market Todd Mitchell Craig Hill Legal Disclaimer No claim is made by Trading Concepts, Inc. that the trading strategies shown here will result in profits and
RISK DISCLOSURE STATEMENT / DISCLAIMER AGREEMENT
 RISK DISCLOSURE STATEMENT / DISCLAIMER AGREEMENT Trading any financial market involves risk. This report and all and any of its contents are neither a solicitation nor an offer to Buy/Sell any financial
Star Search Strategy. Barbara Star, PhD. Wednesday 07/11/2018
 Learn a strategy for finding profitable trades in stocks and commodities using a variation of Bollinger Bands and another, less well-known, indicator that is available on most charting software. Both conservative
1 P a g e. Executive Summary
 Executive Summary My call two weeks ago to revoke the major-3 top for the S&P500 based on OEW downtrend confirmations on several indices including the S&P500. was the correct thing today as I was then
Real-time Analytics Methodology
 New High/Low New High/Low alerts are generated once daily when a stock hits a new 13 Week, 26 Week or 52 Week High/Low. Each second of the trading day, the stock price is compared to its previous 13 Week,
Presents. The Trading Information Revealed Here is not the Same as the WizardTrader.com Methods -- But Together They Pack a Powerful Punch
 Presents Killer Patterns Now You Can Have These Trading Gems -- Free! The Trading Information Revealed Here is not the Same as the WizardTrader.com Methods -- But Together They Pack a Powerful Punch 1
Technical Indicators that Really Work
 Technical Indicators that Really Work TECHNICAL INDICATORS Technical indicators have become more important than Fundamentals. With the proper use of technical indicators investors are able to determine
Bulkowski s Trading Quiz
 Bulkowski s Trading Quiz What chart patterns can you find? A hint appears below and answers on the next page. Hint. Look for the following chart patterns (If you find others, great!): Big M, 2 double tops,
Books & Trades # 191. March 31, Dr. Alexander Elder The Impulse System Education/ Traders Camp New Software Special.
 Books & Trades # 191 March 31, 2012 Dr. Alexander Elder www.elder.com The Impulse System Education/ Traders Camp New Software Special Dear Trader, I ve just returned from the Austrian Alps where I co-taught
Range Deviation Pivots (Historical) Philosophy. Interpretation
 Philosophy. Interpretation") Range Deviation Pivots (Historical) This study looks at the range over a user-defined look back period and places 1, 2, and 3 standard deviations around the opening, but with an in built propriety algorithm
Range Deviation Pivots (Historical) This study looks at the range over a user-defined look back period and places 1, 2, and 3 standard deviations around the opening, but with an in built propriety algorithm
HEIKIN-ASHI TREND NEWSLETTER
 HEIKIN-ASHI TREND NEWSLETTER #210 12.03.2017 EDUCOFIN 2013-2017. ALL RIGHTS RESERVED 25% DISCOUNT IMPROVE YOUR TRADING & INVESTING WHEN YOU ORDER BOTH HEIKIN-ASHI TRADING BOOKS TODAY To order: http://www.educofin.com/heikinashi-book.htm
Figure 1. Frost and Prechter
 Clearly it is a Bull till it isn t and I ve been re-iterating this -albeit Elliot Wave Theory-wise things started to look complete- every update (Just read the conclusion of last Thursday s daily update
The Professor s Position Trading Methodology Trading the Turns
 The Professor s Position Trading Methodology Trading the Turns Hank Swiencinski October 17, 2013 Disclaimer The statements, opinions, buy and sell signals, and analysis contained in this presentation are
The Hackett Money Flow Commodity Report October 28, 2016
 Growing Financial Success CONTENTS Look For Daily, Weekly and Monthly Breakdown Failure Reversal higher Buy Signals in Lean Hogs to Signal The Potential For A Major Low and Sizeable Advance With Possible
Inter-market Technical Analysis for April 29, Summary Chart TheoTrade LLC. All rights reserved.
 1 Weekly Inter-market Technical Report Summary Chart 1 2018 TheoTrade LLC. All rights reserved. 2 Intraday Intermarket Volatility and even trend is back in our markets! The main movement recently came
Expert Trend Locator. The Need for XTL. The Theory Behind XTL
 Chapter 20 C H A P T E R 20 The Need for XTL esignal does an excellent job in identifying Elliott Wave counts. When combined with studies such as the Profit Taking Index, Wave Four Channels, Trend Channels
Technical Analysis Workshop Series. Session 11 Semester 2 Week 5 Oscillators Part 2
 Technical Analysis Workshop Series Session 11 Semester 2 Week 5 Oscillators Part 2 DISCLOSURES & DISCLAIMERS This research material has been prepared by NUS Invest. NUS Invest specifically prohibits the
Walter Bressert, Inc.
 Walter Bressert, Inc. http://www.walterbressert.com mailto:info@walterbressert.com Copyright Walter Bressert, Inc. All rights reserved. 1 PROFITTRADER for METASTOCK END-OF-DAY AND INTRA VERSIONS The EOD
TDP-Academy Trading SetupGuide
 TDP-Academy Trading SetupGuide Version 1.1. March 2017 Author: Boris Nikolajew & Wiktor Majorkiewicz INDEX 1. Foreword 2. Charts 3. Timeframes 4. Indicators 5. Drawings 6. Chartpatterns 7. Analyzing the
stoictrading.wordpress.com November
 Come Into My Trading Room A Complete Guide to Trading by Dr. Alexander Elder Copyright 2002 by Dr. Alexander Elder, Published by John Wiley & Sons, Inc Book Review and Recommendation Come Into My Trading
Monthly Dairy Technical Commentary August 19, 2015
 Monthly Dairy Technical Commentary August 19, 2015 CME Class III Milk Futures Range contraction continues for Class III Milk as it continues to correct the September 2014 through January 2015 downdraft.
Technical Analysis Workshop Series. Session Eight Commodity Channel Index
 Technical Analysis Workshop Series Session Eight DISCLOSURES & DISCLAIMERS This research material has been prepared by NUS Invest. NUS Invest specifically prohibits the redistribution of this material
Presents. Trade Predator
 Presents RISK DISCLOSURE STATEMENT / DISCLAIMER AGREEMENT Trading any financial market involves risk. This report and all and any of its contents are neither a solicitation nor an offer to Buy/Sell any
4 Keys to Trend Trading Tech Analysis. There is no Holy Grail of Trading Only Tools & Rules
 4 Keys to Trend Trading Tech Analysis There is no Holy Grail of Trading Only Tools & Rules Disclaimer U.S. GOVERNMENT REQUIRED DISCLAIMER COMMODITY FUTURES TRADING COMMISSION FUTURES AND OPTIONS TRADING
1 P a g e. Executive Summary
 Executive Summary In last week s update I set a first target of SPX2428 for the S&P500, which was reached on Thursday. I expected from there a 10-15p correction, but instead the market decided to target
1. Introduction 2. Chart Basics 3. Trend Lines 4. Indicators 5. Putting It All Together
 Technical Analysis: A Beginners Guide 1. Introduction 2. Chart Basics 3. Trend Lines 4. Indicators 5. Putting It All Together Disclaimer: Neither these presentations, nor anything on Twitter, Cryptoscores.org,
1 P a g e. Executive Summary
 Executive Summary Over the past week we re-introduced some alternative counts, all of which bullish and some simple more bullish than others. The market keeps tracking them well; and we still can t eliminate
Gold Daily. Gold Benchmark. Gold pullback from 3-week high as US Dollar rebounds. Gold Prices
 Gold Daily Brought to you by Phillip Futures Pte Ltd (A member of PhillipCapital) Friday, 22 March 2019 Gold Benchmark Product Gold Prices Opening Price % Change from previous day OP XAU/USD ($) 1309.31-0.25%
Different Classes Of Divergence
 Russ Horn Presents Different Classes Of Divergence RISK DISCLOSURE STATEMENT / DISCLAIMER AGREEMENT Trading any financial market involves risk. This report and all and any of its contents are neither a
HEIKIN-ASHI NEWSLETTER
 HEIKIN-ASHI NEWSLETTER A WEEKLY SUMMARY FOR HEIKIN-ASHI AFICIONADOS Issue 96 January 12, 2014 Site: www.educofin.com Blog: http://heikinashi.wordpress.com Heikin-Ashi Book: http://www.educofin.com/heikinashi-book.htm
Hidden Divergence. Hello there, you will be excited about the information contained in this report.
 Hidden Divergence Hello there, you will be excited about the information contained in this report. Isn t it remarkable how people like us who are in the Trading business have taken frequently interesting
1 P a g e. Executive Summary
 Executive Summary We can keep the executive summary very simple, and repeat what we said last week: A break below SPX2405 is now needed to put the Bull-count in jeopardy. Until then we have to look up,
Market Maps. Bob Dickey, Technical Strategist, Portfolio Advisory Group. December RBC Capital Markets, LLC / Portfolio Advisory Group
 Market Maps Bob Dickey, Technical Strategist, Portfolio Advisory Group RBC Capital Markets, LLC / Portfolio Advisory Group All values in U.S. dollars and priced as of market close, December 1, 2017, unless
Market Overview. Key Market Commentaries. Daily Market Assessment. Today s Outlook: Mildly Bullish (WTI: ) Mid-Term Market Assessment
 Mid-Term Market Assessment") Energy Daily Brought to you by Phillip Futures Pte Ltd (A member of PhillipCapital) Friday, 22 February 2019 54. Energy Benchmark Product Crude Oil Prices Opening Price % Change from previous day OP ICE
Energy Daily Brought to you by Phillip Futures Pte Ltd (A member of PhillipCapital) Friday, 22 February 2019 54. Energy Benchmark Product Crude Oil Prices Opening Price % Change from previous day OP ICE
Morning Trading Comments
 Thursday, May 24, 2018 1 Morning Trading Comments SUMMARY OF TRADING VIEWS After two months of ultra-low intraday volatility, core European stockmarket indices corrected sharply yesterday with the overstretched