Notes: 1. Prior corresponding period (pcp) 12 months to 31 March Statutory EBITDA represents Net Profit After Tax (NPAT) + tax expense +
|
|
|
- Sheena Wood
- 5 years ago
- Views:
Transcription


1
2
3
4
5 Notes: 1. Prior corresponding period (pcp) 12 months to 31 March Statutory EBITDA represents Net Profit After Tax (NPAT) + tax expense + finance costs + depreciation, amortisation and impairment 3. Refer to slide 8 for a reconciliation of Cash EBITDA, being a non-ifrs disclosure
6 12 months to 12 months to Change ($mil) 31 Mar Mar 2013 ($mil) Boxed beef sales Cattle sales (43.7) Farming sales (10.4) Total External Sales (20.7) Branded Beef gross margin Pastoral gross margin (5.4) Farming gross margin (6.3) Gross operating margin Statutory EBITDA (19.9) (31.2) 11.3 Cash EBITDA NPBT (58.0) (76.8) 18.8 NPAT (39.9) (49.8) 9.9 Operating Cash Flow 18.5 (2.7) months to 12 months to Change Key Performance Indicators 31 Mar Mar 2013 (%) Branded Beef Total kg s sold (m) % Pastoral Operations Total kg s produced 3 (million lwt) (28.2%) Herd size (excluding calf accrual) ( 000 head) (15.5%) Brandings ( 000 head) (16.5%) Farming Cotton harvested ( 000 bales) (46.8%) Wheat harvested ( 000 tonnes) (37.7%) Notes: 1. Gross margin represents cattle sales plus growth less fair value adjustments less cost of cattle sold less direct cattle expenses 2. Refer to slide 8 for a reconciliation of Cash EBITDA, being a non-ifrs disclosure 3. Kg s produced is the inventory kg s produced on the stations including brandings
7 $mil (19.9) (50.0) Statutory EBITDA Deemed cost of sales Cattle fair value changes Farming fair value adjustment Cost of purchasing & selling cattle Cattle purchases at cost Cash EBITDA Movements in Working Capital Borrowing costs Operating Cash Flow
8 12 months to 12 months to ($ mil) 31 Mar Mar 2013 Change Statutory EBITDA 1 (19.9) (31.2) 11.3 Add back: non-cash Market Value Changes to Livestock 2 (11.9) 49.4 (61.3) EBITDA ex. Market Value Changes (31.8) 18.2 (50.0) Add back: other non-cash Fair Value Adjustments to Livestock Cash EBITDA Notes: 1. Earnings before interest, tax, depreciation and amortisation as per Directors Report 2. Market Value Changes arise due to non-cash mark-to-market adjustments to the AACo herd 3. Other non-cash Fair Value Adjustments consist of a combination of non-cash items including births, deaths and breeder-herd amortisation, cattle growth and inventory value of sales and purchases
9
10 kg mil $/kg Boxed Beef Sales Breakdown by Volume Boxed Beef Sales Breakdown by Value % FY13 FY % 80% 70% 60% 50% 40% 30% 20% 10% 0% 58% 42% FY13 63% 37% FY14 Shortfed/Other Av. Shortfed/Other $/kg Wagyu Av. Wagyu $/kg Shortfed/Other Wagyu Boxed Beef Sales Breakdown by Volume 45% 40% 35% 30% 25% 20% 15% 10% FY13 FY14 5% 0% North Asia Australia Pacific North America SE Asia EU and Russia MENA Other


11
12


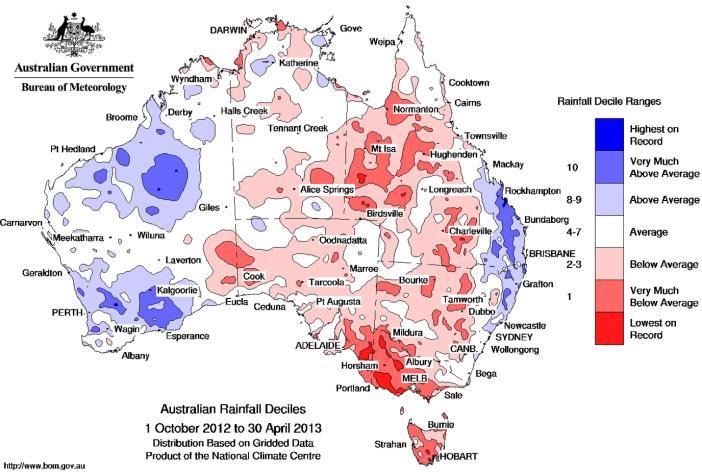
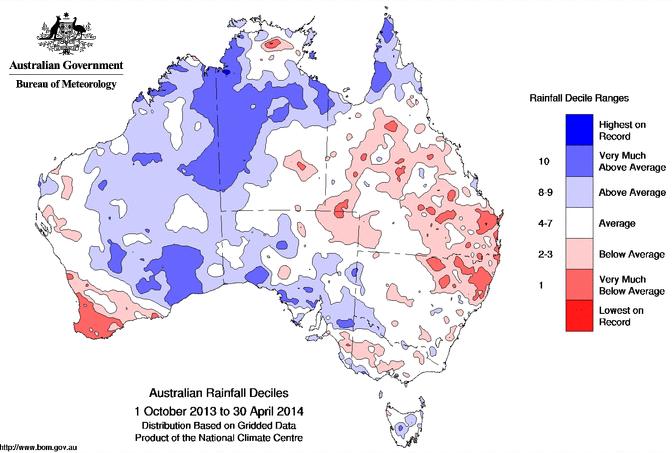

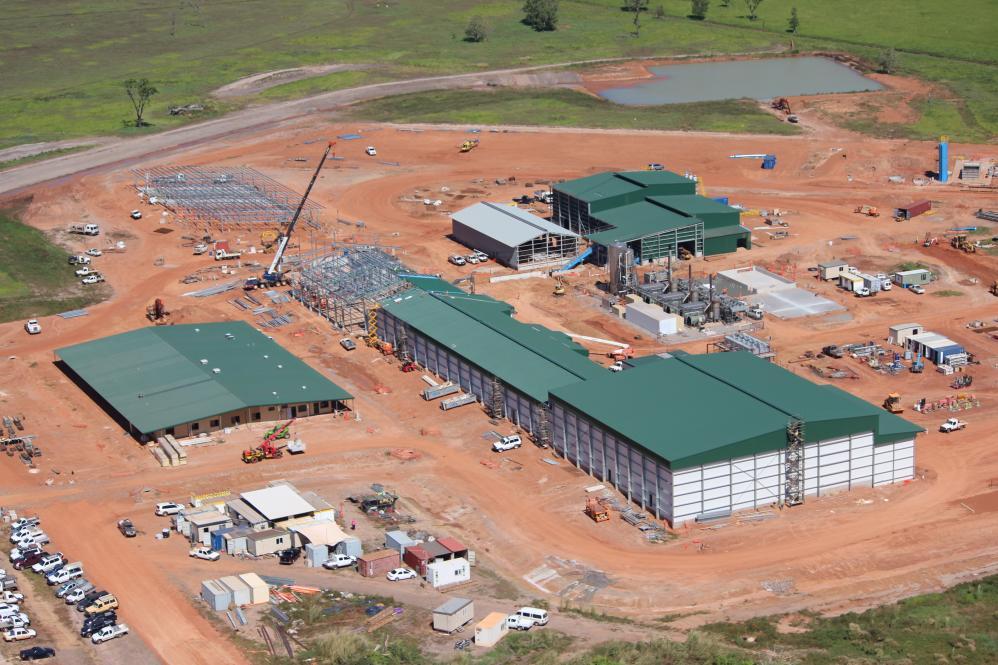
13 Northern Wet Season Northern Wet Season
14 Apr May Jun Jul Aug Sep Oct Nov Dec Jan Feb Mar Apr May Jun Jul Aug Sep Oct Nov Dec Jan Feb Mar Apr May Jun Jul Aug Sep Oct Nov Dec Jan Feb Mar A /kg cwt A /kg lwt EYCI (LHS) Indonesian Light Steer (RHS)
15 Head ( 000) head '000 head ('000) Branded Herd Composition FY14 Herd Movement Trading Feedlot Opening Opening Total Herd Calf Accrual Reversal Opening Branded Herd Purchases Natural Increase Cattle Sales / Transfers 14 Attrition 467 Closing Branded Herd 85 Calf Accrual 552 Closing Total Herd Mar-13 Breeder Herd Composition Mar Breeding/Stud Productive Cows Heifer Joiner Heifer Yearling Bulls Mar Mar 14
16 mil kg lwt $ mil Cattle Sales / Transfers (kg lwt) Cattle Sales / Transfers ($) FY13 External FY13 Internal FY14 External FY14 Internal Live Export Store Wagyu Shortfed Grassfed FY13 External FY13 Internal FY14 External FY14 Internal Live Export Store Wagyu Shortfed Grassfed
17 ($mil) At 31 Mar 2014 At 31 Mar 2013 Cash and cash equivalents Livestock Property, Plant and equipment Inventories Other assets Total assets 1, ,100.1 Interest bearing liabilities Other liabilities Total liabilities Net assets At 31 Mar At 31 Mar Key balance sheet metrics Gearing % 41.0% Net tangible assets/share $1.40 $1.90 Undiluted shares on issue (million) Notes: 1. Interest bearing liabilities includes bank debt, convertible notes and finance leases 2. Gearing based on net debt / (net debt + book equity)
18
19 12 months to 12 months to ($mil) Change 31 Mar Mar 2013 Net operating cash flow 18.5 (2.7) 21.2 Payments for property, plant and equipment (16.9) (20.5) 3.6 Purchase of La Belle and Welltree stations (28.6) - (28.6) Construction of Northern Beef Processing Facility (25.8) (20.6) (5.2) Proceeds from sale of property, plant and equipment (0.6) Proceeds from sale of stations Net investing cash flow (38.6) (39.9) 1.3 Proceeds from share issues Net proceeds from borrowings (133.8) 38.0 (171.8) Net financing cash flows Net change in cash 57.9 (3.5) 61.4
20


21
22 2013 Beef Demand
23
For personal use only
 Australian Agricultural Company Limited ABN 15 010 892 270 (ASX Code: AAC) 2014 Half Year Financial Report ASX Announcement No. 66/ 7 November Manager ASX Market Announcements Australian Securities Exchange
Introduction to Futures & Options Markets for Livestock
 Introduction to Futures & Options Markets for Livestock Kevin McNew Montana State University Marketing Your Cattle Marketing: knowing when and how to price your cattle. When Prior to sale At time of sale
XML Publisher Balance Sheet Vision Operations (USA) Feb-02
 Feb-02") Page:1 Apr-01 May-01 Jun-01 Jul-01 ASSETS Current Assets Cash and Short Term Investments 15,862,304 51,998,607 9,198,226 Accounts Receivable - Net of Allowance 2,560,786
Page:1 Apr-01 May-01 Jun-01 Jul-01 ASSETS Current Assets Cash and Short Term Investments 15,862,304 51,998,607 9,198,226 Accounts Receivable - Net of Allowance 2,560,786
Big Walnut Local School District
 Big Walnut Local School District Monthly Financial Report for the month ended September 30, 2013 Prepared By: Felicia Drummey Treasurer BIG WALNUT LOCAL SCHOOL DISTRICT SUMMARY OF YEAR TO DATE FINANCIAL
Spheria Australian Smaller Companies Fund
 29-Jun-18 $ 2.7686 $ 2.7603 $ 2.7520 28-Jun-18 $ 2.7764 $ 2.7681 $ 2.7598 27-Jun-18 $ 2.7804 $ 2.7721 $ 2.7638 26-Jun-18 $ 2.7857 $ 2.7774 $ 2.7690 25-Jun-18 $ 2.7931 $ 2.7848 $ 2.7764 22-Jun-18 $ 2.7771
Financial & Business Highlights For the Year Ended June 30, 2017
 Financial & Business Highlights For the Year Ended June, 17 17 16 15 14 13 12 Profit and Loss Account Operating Revenue 858 590 648 415 172 174 Investment gains net 5 162 909 825 322 516 Other 262 146
BEEF & VEAL MARKET SITUATION. "Single CMO" Management Committee 18 September 2014
 BEEF & VEAL MARKET SITUATION "Single CMO" Management Committee L I V E S T O C K JUNE SURVEY E.U. E V O L U T I O N T O T A L B O V I N E May/Jun %Var %Var %Var %Var TOT LIVESTOCK BOVINE < 1 Year BOVINE
Futures and Options Live Cattle Feeder Cattle. Tim Petry Livestock Marketing Economist NDSU Extension
 Futures and Options Live Cattle Feeder Cattle Tim Petry Livestock Marketing Economist NDSU Extension www.ndsu.edu/livestockeconomcs FutOpt-Jan2019 Price Risk Management Tools Cash forward contract Video
Economic Activity Index ( GDB-EAI ) For the month of May 2013 G O V E R N M E N T D E V E L O P M E N T B A N K F O R P U E R T O R I C O
 For the month of May 2013 G O V E R N M E N T D E V E L O P M E N T B A N K F O R P U E R T O R I C O") Economic Activity Index ( GDB-EAI ) For the month of May 2013 General Commentary May 2013 GDB-EAI for the month of May registered a 3.4% year-over-year ( YOY ) reduction May 2013 EAI was 126.7, a 3.4%
Economic Activity Index ( GDB-EAI ) For the month of May 2013 General Commentary May 2013 GDB-EAI for the month of May registered a 3.4% year-over-year ( YOY ) reduction May 2013 EAI was 126.7, a 3.4%
Department of Agricultural and Resource Economics
 D 34 Department of Agricultural and Resource Economics BASIS ESTIMATES FOR FEEDER CATTLE AND FED CATTLE February 2018 Andrew P. Griffith, Assistant Professor Becky Bowling, UT Extension Specialist Table
Fourth Quarter 2014 Earnings Conference Call. 26 November 2014
 Fourth Quarter 2014 Earnings Conference Call 26 November 2014 Safe Harbor Statement & Disclosures The earnings call and accompanying material include forward-looking comments and information concerning
Livestock Risk Protection (LRP)
") Livestock Risk Protection (LRP) A Price Risk Management Tool for Livestock Producers Tim Petry Extension Livestock Economist www.ndsu.edu/livestockeconomics November 14, 2017 FeedlotMgmtClass Nov2017.pptx
Livestock Risk Protection (LRP) A Price Risk Management Tool for Livestock Producers Tim Petry Extension Livestock Economist www.ndsu.edu/livestockeconomics November 14, 2017 FeedlotMgmtClass Nov2017.pptx
Futures and Options Live Cattle Feeder Cattle. Tim Petry Livestock Marketing Economist NDSU Extension Service
 Futures and Options Live Cattle Feeder Cattle Tim Petry Livestock Marketing Economist NDSU Extension Service FutOpt-Jan2018 Price Risk Management Tools Cash forward contract Video and internet auctions
Feeder Cattle Market Update AgriClear, All Rights Reserved.
 Feeder Cattle Market Update 1 2016 AgriClear, All Rights Reserved. Let s talk How many of you Have stressed over when to sell your calves especially this past fall? Have hoped to capture more value for
TERMS OF REFERENCE FOR THE INVESTMENT COMMITTEE
 I. PURPOSE The purpose of the Investment Committee (the Committee ) is to recommend to the Board the investment policy, including the asset mix policy and the appropriate benchmark for both ICBC and any
May Economic Activity Index ( FAFAA-EAI )
") May 2016 Economic Activity Index ( FAFAA-EAI ) About the interpretation of the FAFAA-EAI The FAFAA-EAI is an indicator of general economic activity, not a direct measurement of real GNP. The annual growth
May 2016 Economic Activity Index ( FAFAA-EAI ) About the interpretation of the FAFAA-EAI The FAFAA-EAI is an indicator of general economic activity, not a direct measurement of real GNP. The annual growth
2018 SECOND QUARTER FINANCIAL RESULTS
 2018 SECOND QUARTER FINANCIAL RESULTS July 30, 2018 0 SAFE HARBOR STATEMENT The 2018 second quarter news release, conference call webcast, and the following slides contain forward-looking statements. The
Pricing Considerations Cattle Pricing and Risk Management
 Pricing Considerations Cattle Pricing and Risk Management Risk Market Outlook Profit Target or Breakeven Derrell S. Peel Agricultural Economics Department Cash High risk/highest return potential Bullish
FULL YEAR RESULTS WE RE HERE FOR AUSTRALIAN FARMERS TM
 FULL YEAR RESULTS 2017 WE RE HERE FOR AUSTRALIAN FARMERS TM Pg. FY17 Highlights and Strategy Update 3 Financial Overview 6 Balance Sheet, Cash Flow & Funding 9 Review by Segment 14 Outlook 22 Appendices
Factor Leave Accruals. Accruing Vacation and Sick Leave
 Factor Leave Accruals Accruing Vacation and Sick Leave Factor Leave Accruals As part of the transition of non-exempt employees to biweekly pay, the UC Office of the President also requires standardization
FINANCIAL & OPERATIONAL RESULTS
 FINANCIAL & OPERATIONAL RESULTS HALF YEAR ENDED 31 DECEMBER 2018 26 February 2019 DISCLAIMER This presentation contains forward-looking statements. Forward-looking statements often include words such as
1Q of FY ending December 31, (0.2) (1.9) 11.3 (0.2) (0.2) (0.2) (0.2) (1.2) (89.2) 0.1
 (1.9) 11.3 (0.2) (0.2) (0.2) (0.2) (1.2) (89.2) 0.1") August 6, ISEKI & CO., LTD. Supplementary Information to Consolidated Financial Results (April 1, June 30, ) I. Consolidated business results for the three months ended June 30, (Billions of yen, %) Year-on
August 6, ISEKI & CO., LTD. Supplementary Information to Consolidated Financial Results (April 1, June 30, ) I. Consolidated business results for the three months ended June 30, (Billions of yen, %) Year-on
Review of Registered Charites Compliance Rates with Annual Reporting Requirements 2016
 Review of Registered Charites Compliance Rates with Annual Reporting Requirements 2016 October 2017 The Charities Regulator, in accordance with the provisions of section 14 of the Charities Act 2009, carried
HUD NSP-1 Reporting Apr 2010 Grantee Report - New Mexico State Program
 HUD NSP-1 Reporting Apr 2010 Grantee Report - State Program State Program NSP-1 Grant Amount is $19,600,000 $9,355,381 (47.7%) has been committed $4,010,874 (20.5%) has been expended Grant Number HUD Region
Fall 2017 Crop Outlook Webinar
 Fall 2017 Crop Outlook Webinar Chris Hurt, Professor & Extension Ag. Economist James Mintert, Professor & Director, Center for Commercial Agriculture Fall 2017 Crop Outlook Webinar October 13, 2017 50%
Six months of FY ending December 31, (0.4) (1.9) 22.5 (0.4) (0.3) (0.4) (0.1) (0.4) (0.7) (2.0) 0.9 (1.
 (1.9) 22.5 (0.4) (0.3) (0.4) (0.1) (0.4) (0.7) (2.0) 0.9 (1.") November 11, ISEKI & CO., LTD. Supplementary Information to Consolidated Financial Results (April 1, September 30, ) I. Consolidated business results for the six months ended September 30, (Billions of
November 11, ISEKI & CO., LTD. Supplementary Information to Consolidated Financial Results (April 1, September 30, ) I. Consolidated business results for the six months ended September 30, (Billions of
USING RISK MANAGEMENT TOOLS: A LIVESTOCK APPLICATION
 USING RISK MANAGEMENT TOOLS: A LIVESTOCK APPLICATION John Michael Riley AssistantExtension Professor Assistant Extension Professor Department of Agricultural Economics 1 Price Risk: Introduction Commodity
February Economic Activity Index ( GDB-EAI )
") February 2015 Economic Activity Index ( GDB-EAI ) General Commentary February 2015 In February 2015, the GDB-EAI registered a 1.6% year-over-year (y-o-y) reduction, and a month-over-month (m-o-m) increase
February 2015 Economic Activity Index ( GDB-EAI ) General Commentary February 2015 In February 2015, the GDB-EAI registered a 1.6% year-over-year (y-o-y) reduction, and a month-over-month (m-o-m) increase
Executive Summary. July 17, 2015
 Executive Summary July 17, 2015 The Revenue Estimating Conference adopted interest rates for use in the state budgeting process. The adopted interest rates take into consideration current benchmark rates
Fiscal Year 2018 Project 1 Annual Budget
 Fiscal Year 2018 Project 1 Annual Budget Table of Contents Table Page Summary 3 Summary of Costs Table 1 4 Treasury Related Expenses Table 2 5 Summary of Full Time Equivalent Table 3 6 Positions Cost-to-Cash
Dairy Outlook. July By Jim Dunn Professor of Agricultural Economics, Penn State University. Market Psychology
 Dairy Outlook July 2013 By Jim Dunn Professor of Agricultural Economics, Penn State University Market Psychology The CME block price fell by 5% in the last month, ending 8.75 /lb. lower at $1.665/lb. Most
Risk Management for Cattle Feedlots: Futures Buy and Sell Signals
 Risk Management for Cattle Feedlots: Futures Buy and Sell Signals John Lawrence and Sam Behrens 1 Iowa State University In recent years, the narrow feeding margin in cattle feeding has increased the need
SHEEP & GOAT - MARKET SITUATION - DASHBOARD Last update: 25/04/2018
 75 57 25 29 EU Trade 1 611 1 813 1 886 1 765 1 438 1 21 212 213 EU India (up to Jan) United States China + H. Kong EU India (up to Jan) United States China + H. Kong Iran Japan Iran Japan World Trade New
QUESTION 2. QUESTION 3 Which one of the following is most indicative of a flexible short-term financial policy?
 QUESTION 1 Compute the cash cycle based on the following information: Average Collection Period = 47 Accounts Payable Period = 40 Average Age of Inventory = 55 QUESTION 2 Jan 41,700 July 39,182 Feb 18,921
Risk Management for Cattle Feedlots: Futures Buy and Sell Signals
 Risk Management for Cattle Feedlots: Futures Buy and Sell Signals John Lawrence and Hillary Forristall 1 Iowa State University In recent years, narrow profit margins in the cattle feeding business have
Please scroll to find the 2018 and 2019 global fund holiday calendars.
 Please scroll to find the 2018 and 2019 global fund holiday calendars. 2018 Exchange-Traded fund holiday Vanguard Ireland-domiciled ETFs Jan Feb Mar Apr May Jun 1 2 5 12 15 25 9 12 14 15 16 19 28 20 29
Four Types of Price Variation: Applications for Marketing and Risk Management
 Four Types of Price Variation: Applications for Marketing and Risk Management Duane Griffith Montana State University - Emeritus Wyoming February 2015 Price Patterns Those caused primarily by fundamental
Japan Securities Finance Co.,Ltd
 Japan Securities Finance Co.,Ltd \ mil ( )ratio of OR Mar-13 Mar-14 Securities Finance Bussiness 14,093 16,363 Margin Loan Business 6,625 9,240 (37.5%) (47.2%) Interest on Loans 1,760 4,012 Interest
Business & Financial Services December 2017
 Business & Financial Services December 217 Completed Procurement Transactions by Month 2 4 175 15 125 1 75 5 2 1 Business Days to Complete 25 Jan Feb Mar Apr May Jun Jul Aug Sep Oct Nov Dec 217 Procurement
Tim Petry Livestock Economist Agribusiness and Applied Economics.
 Tim Petry Livestock Economist Agribusiness and Applied Economics www.ag.ndsu.edu/aginfo/lsmkt/livestock.htm Lean Hogs.ppt 2-19-08 www.ers.usda.gov Livestock, Dairy, Poultry Outlook www.nass.usda.gov Hog
Big Walnut Local School District
 Big Walnut Local School District Monthly Financial Report for the month ended September 30, 2012 Prepared By: Felicia Drummey Treasurer BIG WALNUT LOCAL SCHOOL DISTRICT SUMMARY OF YEAR-TO-DATE FINANCIAL
11 May Energy Coal
 11 May 217 Energy Coal Energy coal: dislocation from fundamentals Size of the Asia Pacific market 2 Energy Coal Market Volumes by Basin (Million Tonnes) 1, 9 8 7 6 5 4 3 2 1 The Asia-Pacific market is
Unrestricted Cash / Board Designated Cash & Investments December 2014
 Unrestricted Cash / Board Designated Cash & Investments December 2014 25.0 20.0 21.0 20.8 18.9 19.9 15.0 10.0 11.5 12.8 11.6 9.1 10.4 9.8 11.1 10.2 9.8 17.0 16.8 15.4 14.7 14.2 14.1 13.6 13.0 12.0 10.2
WESTWOOD LUTHERAN CHURCH Summary Financial Statement YEAR TO DATE - February 28, Over(Under) Budget WECC Fund Actual Budget
 Budget WECC Fund Actual Budget") WESTWOOD LUTHERAN CHURCH Summary Financial Statement YEAR TO DATE - February 28, 2018 General Fund Actual A B C D E F WECC Fund Actual Revenue Revenue - Faith Giving 1 $ 213 $ 234 $ (22) - Tuition $ 226
WESTWOOD LUTHERAN CHURCH Summary Financial Statement YEAR TO DATE - February 28, 2018 General Fund Actual A B C D E F WECC Fund Actual Revenue Revenue - Faith Giving 1 $ 213 $ 234 $ (22) - Tuition $ 226
31 December 2013 Half year results February 2014
 31 December 2013 Half year results February 2014 Disclaimer Important Notice The purpose of this presentation is to provide general information about Fortescue Metals Group Limited ("Fortescue"). It is
4-H Financial Forms. These forms match those in the 4-H Treasurer's Manual (4H1035, rev 5/2003)
") 4-H Financial Forms These forms match those in the 4-H Treasurer's Manual (4H1035, rev 5/2003) Form 6.1-4-H YDP Monthly Report Form Form 6.2 - Annual Inventory Report Form 6.3 - Annual Financial Report
4-H Financial Forms These forms match those in the 4-H Treasurer's Manual (4H1035, rev 5/2003) Form 6.1-4-H YDP Monthly Report Form Form 6.2 - Annual Inventory Report Form 6.3 - Annual Financial Report
Andrew P. Griffith Assistant Professor Livestock Extension Economist
 Andrew P. Griffith Assistant Professor Livestock Extension Economist Is it a disease outbreak? (BRD, Trich., etc.) Is it when the neighbors bull visits? Is it when a land lease is lost? Is it the loss
Margin Protection Program for Dairy Producers (MPP-Dairy) Dr. Marin Bozic
 Dr. Marin Bozic") Margin Protection Program for Dairy Producers (MPP-Dairy) Dr. Marin Bozic 2 Major Dairy Provisions of the Agricultural Act of 2014 REPEALED NEW Milk Income Loss Contract Dairy Product Price Support Program
Margin Protection Program for Dairy Producers (MPP-Dairy) Dr. Marin Bozic 2 Major Dairy Provisions of the Agricultural Act of 2014 REPEALED NEW Milk Income Loss Contract Dairy Product Price Support Program
Blackstone s 2Q 18 Supplemental Financial Data. July 19, 2018
 Blackstone s 2Q 18 Supplemental Financial Data July 19, 2018 Total Segments Year-to-Date (Dollars in Thousands) 1Q'16 2Q'16 3Q'16 4Q'16 1Q'17 2Q'17 3Q'17 4Q'17 1Q'18 2Q'18 2Q'17 2Q'18 Revenues Management
Positive trend in earnings and strong cash flow
 Positive trend in earnings and strong cash flow Presentation of the Q3/2017 result Martin Lindqvist, President & CEO Håkan Folin, CFO October 25, 2017 Agenda Q3/2017 and performance by division Financials
June Economic Activity Index ( GDB-EAI )
") June 2014 Economic Activity Index ( GDB-EAI ) General Commentary June 2014 In June 2014, the GDB-EAI registered a 1.0% year-over-year (y-o-y) reduction, after showing a 1.1% y-o-y decrease in June 2014.
June 2014 Economic Activity Index ( GDB-EAI ) General Commentary June 2014 In June 2014, the GDB-EAI registered a 1.0% year-over-year (y-o-y) reduction, after showing a 1.1% y-o-y decrease in June 2014.
Eurozone Economic Watch. February 2018
 Eurozone Economic Watch February 2018 Eurozone: Strong growth continues in 1Q18, but confidence seems to peak GDP growth moderated slightly in, but there was an upward revision to previous quarters. Available
FY12 Results 22 May 2012
 FY12 Results 22 May 2012 DISCLAIMER --- Important Notice This presentation has been prepared by Thorn Group Limited (Thorn). This presentation is not a financial product or investment advice or recommendation,
PRESS RELEASE. Securities issued by Hungarian residents and breakdown by holding sectors. January 2019
 7 March 2019 PRESS RELEASE Securities issued by Hungarian residents and breakdown by holding sectors January 2019 According to securities statistics, the amount outstanding of equity securities and debt
11 May Report.xls Office of Budget & Fiscal Planning
 Education and General Fund Actual Revenues and s by Month MTD YTD Change Revenue Jul Aug Sep Oct Nov Dec Jan Feb Mar Apr May Jun Per 14 Total over FY06 Enrollment Fees $ 8,211 $ 219 $ 41,952 ($ 818) $
12236/12 JR/fk 1 DG B 1
 COUNCIL OF THE EUROPEAN UNION Brussels, 10 July 2012 12236/12 AGRI 491 AGRIORG 116 NOTE from: to: Subject: Commission Council Report on the situation of the dairy market Delegations will find attached
FDD FIRM STORAGE SERVICE NORTHERN NATURAL GAS COMPANY
 FDD FIRM STORAGE SERVICE NORTHERN NATURAL GAS COMPANY FIRM STORAGE SERVICE OPTIONS Northern s firm storage service is provided pursuant to the FDD Rate Schedule located in Northern s FERC Gas Tariff. The
The Long Journey to Recovery. Russia Economic Report April 2016 Edition No. 35
 The Long Journey to Recovery Russia Economic Report April 216 Edition No. 35 1 2 3 The anticipated recovery was delayed and the economy adjusted through a sharp income drop. The government s policy response
SmallBizU WORKSHEET 1: REQUIRED START-UP FUNDS. Online elearning Classroom. Item Required Amount ($) Fixed Assets. 1 -Buildings $ 2 -Land $
 Fixed Assets. 1 -Buildings $ 2 -Land $") WORKSHEET 1: REQUIRED START-UP FUNDS Item Required Amount () Fixed Assets 1 -Buildings 2 -Land 3 -Initial Inventory 4 -Equipment 5 -Furniture and Fixtures 6 -Vehicles 7 Total Fixed Assets Working Capital
WORKSHEET 1: REQUIRED START-UP FUNDS Item Required Amount () Fixed Assets 1 -Buildings 2 -Land 3 -Initial Inventory 4 -Equipment 5 -Furniture and Fixtures 6 -Vehicles 7 Total Fixed Assets Working Capital
PRESS RELEASE. Securities issued by Hungarian residents and breakdown by holding sectors. April 2016
 10 June 2016 PRESS RELEASE Securities issued by Hungarian residents and breakdown by holding sectors April 2016 According to securities statistics data, the amount outstanding of equity securities and
Cost Estimation of a Manufacturing Company
 Cost Estimation of a Manufacturing Company Name: Business: Date: Economics of One Unit: Manufacturing Company (Only complete if you are making a product, such as a bracelet or beauty product) Economics
MIC. Fourth Quarter 2017 Earnings Conference Call Support Slides. February 2018
 MIC Fourth Quarter 2017 Earnings Conference Call Support Slides February 2018 Disclaimer This presentation by Macquarie Infrastructure Corporation (MIC) is proprietary and all rights are reserved. Any
GRAIN HEDGE POSITION REPORT
 GRAIN HEDGE POSITION REPORT CROP: Corn DATE: April 16, 2006 LONG POSITION SHORT POSITION Total Grain on Hand 753896 Grain in Transit Total Offsite Grain Total Stocks 753896 Unpriced Grain Storage 106375
Development of Economy and Financial Markets of Kazakhstan
 Development of Economy and Financial Markets of Kazakhstan National Bank of Kazakhstan Macroeconomic development GDP, real growth, % 116 112 18 14 1 113,5 11,7 216,7223,8226,5 19,8 19,8 19,3 19,619,7 199,
Agriculture & Natural Resources
 AG ECONOMIC SERIES TIMELY INFORMATION Agriculture & Natural Resources AGRICULTURAL ECONOMICS AND RURAL SOCIOLOGY, AUBURN UNIVERSITY, AL 36849-5639 DAERS 04-2 May 2004 Using The Futures Market Price To
Should I Buy Stocker Calves This Fall or a Fishing License?
 Should I Buy Stocker Calves This Fall or a Fishing License? Ona Report Webinar September 15, 2016 Chris Prevatt University of Florida Livestock and Forage Economist Stocker Marketing Options We must consider:
PHOENIX ENERGY MARKETING CONSULTANTS INC. HISTORICAL NATURAL GAS & CRUDE OIL PRICES UPDATED TO July, 2018
 Jan-01 $12.9112 $10.4754 $9.7870 $1.5032 $29.2595 $275.39 $43.78 $159.32 $25.33 Feb-01 $10.4670 $7.8378 $6.9397 $1.5218 $29.6447 $279.78 $44.48 $165.68 $26.34 Mar-01 $7.6303 $7.3271 $5.0903 $1.5585 $27.2714
1.2 The purpose of the Finance Committee is to assist the Board in fulfilling its oversight responsibilities related to:
 Category: BOARD PROCESS Title: Terms of Reference for the Finance Committee Reference Number: AB-331 Last Approved: February 22, 2018 Last Reviewed: February 22, 2018 1. PURPOSE 1.1 Primary responsibility
Capturing equity gains whilst protecting portfolios
 Capturing equity gains whilst protecting portfolios Edward Park Q2 2018 MSCI North America Total Return in USD (2017 Discrete Calendar Months) 4.00% 3.50% 3.00% 2.50% 2.00% 1.50% 1.00% 0% 0.00% Jan-17
Key IRS Interest Rates After PPA
 Key IRS Rates - After PPA - thru 2011 Page 1 of 10 Key IRS Interest Rates After PPA (updated upon release of figures in IRS Notice usually by the end of the first full business week of the month) Below
Common stock prices 1. New York Stock Exchange indexes (Dec. 31,1965=50)2. Transportation. Utility 3. Finance
2. Transportation. Utility 3. Finance") Digitized for FRASER http://fraser.stlouisfed.org/ Federal Reserve Bank of St. Louis 000 97 98 99 I90 9 9 9 9 9 9 97 98 99 970 97 97 ""..".'..'.."... 97 97 97 97 977 978 979 980 98 98 98 98 98 98 987 988
Digitized for FRASER http://fraser.stlouisfed.org/ Federal Reserve Bank of St. Louis 000 97 98 99 I90 9 9 9 9 9 9 97 98 99 970 97 97 ""..".'..'.."... 97 97 97 97 977 978 979 980 98 98 98 98 98 98 987 988
Black Swans and Dairy Markets
 November 2-4, 2015 Bellagio, Las Vegas IMAGINE INNOVATE ACHIEVE Black Swans and Dairy Markets Greg Bethard, Ph.D. CFO, Pagel Family Businesses Kewaunee, WI Restaurant Bar Market Deli Concepts We are in
Fertilizer market starts to crack India nabs lower prices in latest urea tender By Bryce Knorr, grain market analyst
 Fertilizer market starts to crack India nabs lower prices in latest urea tender By Bryce Knorr, grain market analyst When India talks in the fertilizer market, the world listens. The large importer of
Dairy Outlook and Utilizing MPP- and LGM-Dairy: Kenny Burdine University of Kentucky Agricultural Economics
 Dairy Outlook and Utilizing MPP- and LGM-Dairy: 2015 Kenny Burdine University of Kentucky Agricultural Economics Outline for Discussion Review of Current Market Conditions Cow numbers, production expectations,
Performance for Quarter & Year ended March 31, 2015
 Performance for Quarter & Year ended March 31, 2015 Jatin Dalal Sr. Vice President and CFO April 21, 2015 1 Financial Summary for the Year Ended March 31, 2015 (IFRS) Wipro Limited FY 15 (Rs million) YoY
PRESS RELEASE. Securities issued by Hungarian residents and breakdown by holding sectors. October 2018
 PRESS RELEASE 10 December 2018 Securities issued by Hungarian residents and breakdown by holding sectors October 2018 According to securities statistics, the amount outstanding of equity securities and
BILLABONG INTERNATIONAL LIMITED 30 August Investor presentation highlights
 BILLABONG INTERNATIONAL LIMITED 30 August 2010 Investor presentation highlights RESULTS FY10 Results in Constant Currency (AUD) 2010 $m 2009 $m 2010 Change % Sales Revenue 1,482.3 1,482.6 (0.0) EBITDA
Business Cycle Index July 2010
 Business Cycle Index July 2010 Bureau of Trade and Economic Indices, Ministry of Commerce, Tel. 0 2507 5805, Fax. 0 2507 5806, www.price.moc.go.th Thailand economic still expansion. Medium-run Leading
ANNOUNCEMENT OF PRELIMINARY RESULTS
 The leading high service distributor to engineers worldwide ANNOUNCEMENT OF PRELIMINARY RESULTS YEAR ENDED 31 MARCH 2009 29 May 2009 Agenda Overview and current trading Ian Mason Financial performance
Interim Results 2019 March 2019
 Interim Results 2019 March 2019 Disclaimer This presentation may contain forward-looking statements and projections. There can be no certainty of outcome in relation to the matters to which the forward-looking
Cattle Market And Controversy
 Cattle Market And Controversy Tri County Beef Cattle Merkting 2016 Jasper, TX April 21, 2016 David P. Anderson Professor and Extension Economist Overview Price Correction Increasing Beef Supply Price Relationships
OTHER DEPOSITS FINANCIAL INSTITUTIONS DEPOSIT BARKAT SAVING ACCOUNT
 WEIGHTAGES JAN FEB MAR APR MAY JUN JUL AUG SEPT OCT NOV DEC ANNOUNCEMENT DATE 19.Dez.14 27.Jän.15 24.Feb.15 26.Mär.15 27.Apr.15 26.Mai.15 25.Jun.15 28.Jul.15 26.Aug.15 23.Sep.15 27.Okt.15 25.Nov.15 MUDARIB
Monthly Mutual Fund Report
 July, Monthly Mutual Fund Report Statistics for May-June Sales and Redemptions Total assets for all funds increased in May by $9. billion, or., to $.7 trillion. Money market funds had a net cash outflow
PRESENTATION Q Oslo, 19 February 2013 John Binde, CEO Ola Loe, CFO
 PRESENTATION Q4 2012 Oslo, 19 February 2013 John Binde, CEO Ola Loe, CFO AGENDA: Highlights for the period Segment information Group financials Outlook 2 Highlights in Q4 2012: Significant improvement
Monthly US Lamb Market Update
 January 2018 Monthly US Lamb Market Update January 2018 Issue Prepared Exclusively for Meat & Livestock Australia - Sydney January 13, 2018 USA Domes c Lamb Market - Supply/Demand Situa on USDA will issue
February Economic Activity Index ( GDB-EAI )
") February 2014 Economic Activity Index ( GDB-EAI ) General Commentary February 2014 In February 2014, the GDB-EAI registered a 2.4% year-over-year (y-o-y) reduction (the lowest since May 2013), after showing
February 2014 Economic Activity Index ( GDB-EAI ) General Commentary February 2014 In February 2014, the GDB-EAI registered a 2.4% year-over-year (y-o-y) reduction (the lowest since May 2013), after showing
ACCT-112 Final Exam Practice Solutions
 ACCT-112 Final Exam Practice Solutions Question 1 Jan 1 Cash 200,000 H. Happee, Capital 200,000 Jan 2 Prepaid Insurance 10,000 Cash 10,000 Jan 15 Equipment 15,000 Cash 5,000 Notes Payable 10,000 Jan 30
Dairy Outlook. August By Jim Dunn Professor of Agricultural Economics, Penn State University. Market Psychology
 Dairy Outlook August 2014 By Jim Dunn Professor of Agricultural Economics, Penn State University Market Psychology The prices of all dairy products have been mixed since last month. The CME block cheese
2011 Interim Results. Keith Gordon, Managing Director & Chief Executive Officer Stephen Gobby, Chief Financial Officer
 2011 Interim Results Keith Gordon, Managing Director & Chief Executive Officer Stephen Gobby, Chief Financial Officer Emeco 2011 Interim Results Overview Financials Strategy & Outlook Questions Appendices
SUMMARY OF SELECTED ECONOMIC INDICATORS
 SUMMARY OF SELECTED ECONOMIC INDICATORS RECENT DATA GRAPHS HISTORICAL DATA GRAPHS P.E.I. CONSUMER PRICE INDEX P.E.I. LABOUR FORCE STATISTICS CANADA/P.E.I. GROSS DOMESTIC PRODUCT, INCOME-BASED CANADA /
Using projections to manage your programs
 Using projections to manage your programs To project total provider reimbursements To do what ifs based on caseloads or other metrics To project amounts of admin & support available for spending Based
For personal use only
 Australian Agricultural Company Limited ABN 15 010 892 270 AACO 2016 ANNUAL REPORT ASX Announcement No 15/2016 10 June 2016 Manager ASX Market Announcements Australian Securities Exchange Attached is the
Erdemir Group 2011 First Quarter Consolidated Financial Results. 06 May 2011
 Erdemir Group 2011 First Quarter Consolidated Financial Results 06 May 2011 2 / 26 DISCLAIMER Ereğli Demir Çelik Fabrikaları T.A.Ş. (Erdemir) may, when necessary, make written or verbal announcements about
Performance Report October 2018
 Structured Investments Indicative Report October 2018 This report illustrates the indicative performance of all Structured Investment Strategies from inception to 31 October 2018 Matured Investment Strategies
Integrated Financial Projections => replace by your own logo
 Integrated Financial Projections => replace by your own logo Company name WonderApp Ltd. Author PS Legal form Limited File name EFM DE WonderApp Ltd.xlsm Model name Fictitious 5 Year Forecast Last update
Financial Report for the Month of SEPTEMBER
 WILLOUGHBY, OH Financial Report for the Month of SEPTEMBER Month Ended SEPTEMBER 30, 2013 BOARD OF EDUCATION Mrs. Margaret Warner, President SUPERINTENDENT Mr. Steve Thompson Mrs. Sharon Scott, Vice President
For personal use only
 2016 Annual General Meeting 18 NOVEMBER 2016 YOUR BOARD Greg Ridder Ruslan Kogan David Shafer Harry Debney Independent, Non-Executive Chairman Founder & CEO CFO & COO Independent, Non-Executive Director
Weather targets fertilizer market too Heavy rains stall shipments, delay fall applications By Bryce Knorr, grain market analyst
 Weather targets fertilizer market too Heavy rains stall shipments, delay fall applications By Bryce Knorr, grain market analyst The Midwest is finally starting to dry out from heavy rains in the first
December 31, OVERVIEW 2 MAGELLAN 2017 ANNUAL REPORT
 1. OVERVIEW 2 MAGELLAN 2017 ANNUAL REPORT 2017 and Recent Updates MAGELLAN 2017 ANNUAL REPORT 3 Labour Matters 4 MAGELLAN 2017 ANNUAL REPORT Financing Matters 2. OUTLOOK MAGELLAN 2017 ANNUAL REPORT 5 TM
Beef Industry Risk Management: Alternatives and Resources for Producers
 Beef Industry Risk Management: Alternatives and Resources for Producers Glynn Tonsor Dept. of Agricultural, Food, and Resource Economics Michigan State University 2009 Michigan Cattlemen s Association