Global Connections Public Company Limited. Q1/2013 Performance Announcement Presentation May 2013
|
|
|
- Imogen Allen
- 5 years ago
- Views:
Transcription


1 Global Connections Public Company Limited Q1/2013 Performance Announcement Presentation May

2 Today Content Company Overview Plastic and Petrochemical Industry Q1/2013 Performance IR report & Investment Highlight Q&A 2
3 Company Overview MB Total Revenue 3,272 Listed to SET 6 th Dec ,665 3,793 3,710 GC has been founded since 1994 by 5 experienced management GC is the distributor of 32 leading producers of plastics and petrochemical raw materials from around the world Most of these producers are among the top 3 in the world in that product in terms of technology & production capacity. GC Revenue During Sales growth in Q1/2013 YoY QoQ Value % 6.59% Quantity % 3.49% Year GC is not an ordinary distributor. On top of ordinary distribution role, GC provide technical advice and useful information to customers since GC position itself to be Your best partner for solution and service in Industrial raw material supply. 3

4 GC s role and positioning in the market Leads the differentiation Economy of Scale to Suppliers Suppliers S1 S2 S3 S4 S5 Sn ) Global Connections Public Co., Ltd. Provided Logistic : Warehousing, small delivery, and repacking Sales & Marketing : Closely contact to end markets/customers Technical Services : Troubleshooting / Product and Market Development Financing & structuring solution : Extending our expertise to customer Customers C1 C2 C3 C4 C5 Cn Economy of Scope to Customers 4
 Polymer producers (PP, PE, PVC) Global Connections Compounders Master batch producers Converters 5")
5 Where we are in the value chain of Thai Petrochemical Industry Petrochemical and plastic producers Upstream Intermediate Downstream Compounders End users Olefin&Aromatic Producers Monomer producers (MEG, VCM) Polymer producers (PP, PE, PVC) Global Connections Compounders Master batch producers Converters 5
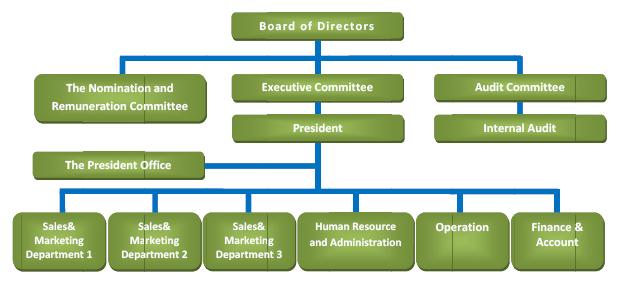
6 Organization Chart 6
7 Major Shareholders Free Float Overview As of Minor Shareholders (Free float) 989 % Shares in Minor Shareholders (% Free float) 31.06% Overview As of Total Shareholders 1,066 Rank Major Shareholders as of 24/08/2012 # Shares % Shares 1 Mr. Somchai Kulimakin 44,499, Mr. Aikachai Sirijantanan 28,470, Mr. Sumruay Tichachol 27,125, Mr. Bhiya Jriyasetapong 26,125, Mr. Somkiat Terdtultaveedey 9,200, Mr. Siri Thirawattanawong 8,226, Sub total 143,646,

8 Corporate Value Ethics Integrity Professional & Focus Partnership Strive for better 8
9 1996 Distributing agent of SCG Plastics Co., ltd. and Eastman Chemical, which was the start of specialty product distribution GC was established by 5 founders with initial registered capital of 2 MB Distributing agent of OCV Reinforcement Co., Ltd 1997 Distributing agent of DuPont Performance Polymers and Chi Mei Corporation Company History Current Start business with commodity plastic Diversify company portfolio from commodity to specialty plastic 2004 Distributing agent of ExxonMobil and Rio Tinto Mineral Asia Pte., Ltd Distributing agent of Nanocor Inc Distributing agent of Siam Polystyrene (Thailand) Co., ltd. and Cabot Plastic Hong Kong Ltd Listed company and paid-up capital to 200 MB More Product from Exxon : Butyl & Vistamaxx Create sustainable growth being the best partner for solution and service in industrial raw material supply 2008 Distributing agent of DIC Exxon Product : PE PP 2010 Distributing agent of BST Elastomers Co., Ltd Exxon Product : Vistamaxx for Film Distributing agent of Miliken Chemical, Imerys Meneral, Timcal Ltd. Exxon Product : ENABLE, EXCEED 2012 Change Distributing agent of SCG to PTTPM. Exxon Product : Special Compound
10 Corporate Strategy Maintain existing strong market positioning Become solid partner with supplier and customer Offer total professional solution Be leader in advanced technology product Grow towards the growing industries Develop new application/market from initial stage 10

11 2013 Corporate Strategy VALUE V : Versatile Staff A : Aggressive Move L : Lean and Learning Organization U : Unique Differentiation E : Eligible Payoff 11


 - Tire & Rubber")

12 GC Business Unit BU1 COMMODITY POLYMER BU2 SPECIALTY & ENGINEERING POLYMER BU3 SPECIALTY CHEMICALS & INTERMEDIATE 1. Polyolefin 2. PET & PVC 3. Specialty Polyolefin 1. Engineering Plastics 2. Industrial Products 1. Additives & Adhesives 2. Petro Chemicals & Intermediate - Automotive parts Car & Motorcycle : Interior and exterior parts Console, Bumper, Door trim, Body side Engine covered, Muffler covered, Trunk tray, Liner, etc. - Electronic and Appliance Parts Washing machine, Refrigerator, Air-Con, Fan - Transparency packaging - Cosmetic packaging - Office equipment - Compounding &color Master batch - Resin Producers - Refinery plant - Industrial product - Packaging Product - Adhesive Product (Solvent based, HMA) - Tire & Rubber House - Ink - Flexible Hose/Tube - Woven bag, Film - Toys, Furniture Plastic Pallet - House ware - Road Marking Paint - Industrial product -Tape & Label PSA


13 Marketing Structure GC Business Unit BU1 COMMODITY POLYMER Polyolefins PE: HDPE, LDPE, LLDPE (C4,C8) PP: Homo, Block Copo, Random PVC PET PU BU2 SPECIALTY & ENGINEERING POLYMER Nylon, POM, PBT, TEEE, PCT, LCP, PC Black/White MB EPDM, Butyl EO, EB Plastomer, PP-Plastomer TPVs, TPU PETG/PCTG, CA PS, HIPS, ABS, SAN, SBC TPE, FR, Reinforcement compound Talc, Zinc Borate FR, Nano-Clay Glass Fiber EVA for HMA, Hydrocarbon Resin BU3 SPECIALTY CHEMICALS & INTERMEDIATE Plastic Additive Intermediate chemical


14 Automotive E&E Appliance Packaging Toys & Stationery Personal Care Products Industrial Market furniture, construction, shoes, adhesive, Road marking
15 Plastic and Petrochemicals Industry 15


16 Crude Oil Price Chart

17 Economic Growth Rate by The National Economic and Social Development Board 18.0% 16.0% 16.4% 14.0% 12.0% 10.0% 8.0% 6.0% 4.0% 2.0% 0.0% 11.0% 6.4% 3.8% 5.0% 3.2% 3.2% 0.1% 3.0% e GDP Export Inflation As of Feb 18, 2013 Source : Office of The National Economic and Social Development Board 17


18 MPI and CAPU CAPU 2013 Q1/13= =65.2 Q1/12=62.6, Q2/12=64.3, Q3/12=66.1 Q4/12=67.0 Source: THE OFFICE OF INDUSTRIAL ECONOMICS 18


19 Key Strategic Market Automotive E&E Appliance Packaging Toys & Stationery Personal Care Products Industrial Market furniture, construction, shoes, adhesive, Road marking
 Q4/2013 Q3/2013 Q2/2013 Q1/2013 Total 721,460 721,460 Q4/2012 Q3/2012 Q2/2012 Q1/2012 Total 730,099 648,165 550,270 499,647")
20 Thailand Auto Production 2013 (E) 2013 (Q1) ,460 1,457,795 1,645, ,378 1,391,728 1,301,149 1,193,885 1,125, , , , , ,761 2,550,000 2,428,181 Production (Unit) Q4/2013 Q3/2013 Q2/2013 Q1/2013 Total 721, ,460 Q4/2012 Q3/2012 Q2/2012 Q1/2012 Total 730, , , ,647 2,428,181 Car Production Forecast for the year 2013 around 2.55 mil. Unit or around 4% growth. This figure target to 3 million in Production in Feb 2013 is equal 229,204 units or around 36.35% YOY increase due to the vehicle manufacturers accelerate production for the first car project Source : Thailand Automotive Institute

21 Thailand Auto Monthly Production Source: THE OFFICE OF INDUSTRIAL ECONOMICS 21
22 Electronic Appliances Industry MPI of Electrical and Electronics Source: THE OFFICE OF INDUSTRIAL ECONOMICS 22
23 Q1/2013 Performance 23
24 Statements of Comprehensive Income Unit : Million Baht Actual Q Change Sales , % COGS , % Gross Profit % Selling & A dmin Expenses % Reduction of inventory to net realisable value (Reversal) 0.00 (2.00) -100% EBITDA % Depreciation % Interest Expenses % Profit Before Other Income % Other Income % Gain (Loss) on exchange rate % Profit before Tax % Tax % Deferred Tax Expenses (0.14) % Net Profit % 24


25 Sales Structure BU3 BU2 BU Sales Quantity '000 T BU3 BU2 BU1 Sales Quantity in Percentage 0% 0% 0% 0% 0% 21% 20% 22% 29% 41% 100% 80% 60% % 80% 78% 71% 59% 40% 20% 0% Q1_ Q1_2013 BU3 BU2 BU1 4,500 4,000 3,500 3,000 2,500 2,000 1,500 1, Sales Value-Million Baht 2,647 3, ,786 3, ,157 1,357 1, ,779 2,426 2,416 2, Q1_2013 BU3 BU2 BU1 100% 80% 60% 40% 20% 0% Sales Value in Percentage 2% 2% 0% 1% 1% 31% 32% 36% 44% 56% 67% 66% 64% 55% 43% Q1_2013 2


26 BU3 BU2 BU1 Gross Profit By BU Q1_2013 Gross Profit Structure BU3 BU2 BU1 100% 80% 60% 40% 20% 0% Gross Profit in Percentage 8% 7% 1% 2% 2% 46% 59% 62% 66% 76% 46% 34% 37% 32% 22% Q1_ % 30% 25% 20% 15% 10% 5% 0% 26.2% 25.5% 11.5% 5.2% Gross Profit Margin by BU 14.6% 27.5% 12.4% 21.5% 22.3% 10.1% 11.3% 4.0% 4.1% 3.9% 4.2% Q1_2013 BU3 BU2 BU1 26

 Net Profit Margin (%) ROE (%) ROE 50 45 40 35 30 25 20 15 10 5 - Revenue and Net Profit In Q1/2013, Sales decreased from 2012 around 27% due to")
27 Revenue (Million Baht) Statements of Comprehensive Income Highlights Profit 2, Revenue & Net Profit 3,678 3,793 3, Profitability Ratio Q1_2013 Revenue Net Profit Q1_2013 Gross Profit Margin (%) Net Profit Margin (%) ROE (%) ROE Revenue and Net Profit In Q1/2013, Sales decreased from 2012 around 27% due to the dropping in sales value of BU 1 by 50% from the impact of changing in distributorship of it s main supplier with effective from mid of 2012 onwards. However, sales value of BU 2 was increased by 11% due to the success of development pipeline project. Profit Margin GC s gross profit margin of Q1/2013 has been increasing due to higher margin in BU2 as some product items had lower cost from big lot order. GC s net profit margin of Q1/2013 has been increasing due to higher gross profit margin and the gain on sales of investment properties and motor vehicles. 27
28 Statements of Financial Position Unit : Million Baht Asset Change % Trade Receivables % Inventory % Net Fixed Assets % Total Assets 1, , % Liabilities Short Term Loan % Trade Payables % Total Liabilities % Equity Paid up Capital % Share Premium % Retained Earnings % Total Equity % 28


29 Statements of Financial Position Highlight Debt to Equity Ratio Q1_2013 D/E ratio is relatively lower. D/E ratio drop less than 2.0 which was decreased after IPO proceeds. However, the higher D/E ratio in 2011-Q1/2013 were resulting from the increase in short-term loan and dividend payout Current Ratio Continuous increase in current ratio GC current ratio has been improving to higher than 1.0x since GC got more working capital from IPO proceed. This higher liquidity can reduce GC s financial costs Q1_
30 CASH FLOW STATEMENTS FOR THE THREE MONTH PERIODS ENDED 31 MARCH 2013 AND 2012 (Unit : Thousand Baht) Cash flows from operating activities Profit before tax 33,471 33,738 Adjustments to reconcile profit before tax to net cash provided 2,171 6,496 by (paid from) operating activities : Profit from operating activities before changes in operating assets and liabilities 35,642 40,234 Operating assets (increase) decrease Trade and other receivables (77,712) (208,352) Inventories (57,604) (95,836) Other current assets (4,373) (7,656) Operating liabilities increase (decrease) Trade and other payables 60, ,070 Other current liabilities 835 (1,007) Cash flows used in operating activities (43,183) (161,547) Cash paid for interest expenses (3,961) (3,898) Cash paid for income tax (60) (11) Net cash flows used in operating activities (47,204) (165,456) 30
31 CASH FLOW STATEMENTS (continued) FOR THE THREE-MONTH PERIODS ENDED 31 MARCH 2013 AND 2012 (Unit : Thousand Baht) Cash flows from investing activities Acquisition of equipment (2,353) (280) Acquisition of computer software (234) 0 Proceeds from sales of investment properties 7,830 0 Proceeds from sales of motor vehicles 2,477 0 Net cash flows from (used in) investing activities 7,720 (280) Cash flows from financing activities Increase in short-term loans from financial institutions 20, ,585 Cash paid for liabilities under finance lease agreements (652) (647) Net cash flows from (used in) financing activities 19, ,938 Net decrease in cash and cash equivalents (20,136) (22,798) Cash and cash equivalents at beginning of period 42,463 41,387 Cash and cash equivalents at end of period 22,327 18,589 31
32 120% 100% 80% 60% Dividend Payout Ratio 84% 83% 80% 99% 94% Dividend Payout To be top 50 dividend yield stock with continuous growth Positioning of GC Stock Dividend Payment Record Operation D iv id e n d Payment X-Date P ric e with X-D a te Dividend Yield Period (BPS.) Date before on x-date ( c a l. f r om be f or e X- D a t e P r i c e ) 31-D ec A pr A pr % 30-Jun Sep A ug % 31-D ec A pr A pr % 30-Jun Sep A ug % 31-D ec A pr A pr % 30-Jun Sep A ug % 31-D ec A pr A pr % 30-Jun Sep A ug % 31-D ec A pr A pr % 30-Jun Sep A ug % 32
33 Dividend Payment Record Operation Dividend Payment X-Date Price with X-Date Dividend Yield Period Ending (BPS.) Date before on x-date (cal. From before X-Date Price) 31-Dec Apr Apr % 30-Jun Sep Aug % 31-Dec Apr Apr % 30-Jun Sep Aug % 31-Dec Apr Apr % 30-Jun Sep Aug % 31-Dec Apr Apr % 30-Jun Sep Aug % 31-Dec Apr Apr % 30-Jun Sep Aug % 31-Dec Apr Mar % 30-Jun Sep Aug % 31-Dec Apr-07 9-Mar % 30-Jun Sep Aug % 31-Dec Apr Mar % Regular Dividend payment with high yield. 33

34 Source : SET News on March 13, 2012 GC s ranking at 22 nd - Dividend Paid 80MB - Dividend Yield 8.03% 2012 s GC dividend - Dividend Paid 72 MB - Dividend Yield 7.23% 34

 Average interest rate is a")
35 GC Dividend Yield 12.00% 10.00% 8.93% 10.45% 9.13% 9.78% 8.84% 8.00% 5.69% 7.30% 6.00% 4.00% 4.53% 4.67% 5.48% 3.28% 3.80% 7.23% 3.01% 2.00% 0.00% 1.72% 4.26% 2.80% 2.14% 2.56% 0.93% 1.00% -0.79% 2.40% 2.86% -2.00% Dividend Yield Average Inf. Rate* Average Int. Rate* Remark * Both of the rate are collected from Bank of Thailand (BOT) Average interest rate is a deposit interest rate for 12 months Annualize in
 SET INDEX Closing Price Month Q1-13 Q1-12 Apr-13 High 5.20 5.20 5.00 Low 4.76 4.")
36 Investor Relations Report 1,650 3 Month closing price perfomance 5.20 GC Average Petro Industrial 1,600 1,550 1, P/E Ratio Dvd Yield , ROE ,400 1, Source: SET s website as of Apr 30, , Stock Price Unit : BPS Volume Trade (3 months) SET INDEX Closing Price Month Q1-13 Q1-12 Apr-13 High Low Average , , , , , , ,000 90, ,900 shares on 12 Apr 13 Stock Volume Unit : Shares per day Month Q1-13 Q1-12 Apr-13 High 603,100 1,267, ,900 Low 19,700 1,600 36,200 Average 176,028 97, ,821 Total 10,913,746 6,022,000 3,188,600 Volume (share) 36
37 Investment Highlight A Leading and fast-growing with best solutions and service provider in Thai plastic and petrochemical Industry Exclusive distributorship from most of the world leading producers. Visionary, experienced, hands-on management team, Long term relation : Trade partner and also Financial Institute partner Diversified and well balanced sources of revenue from various industries Systematic risk control : Bad debt, foreign exchange exposure, price fluctuation No Fixed Cost ; due to all investment financing by long term loan (120 MB) already paid with in 4 years (2008) and no plan to investment in near term Regular Dividend payment with high yield. (Fully statutory reserve) Top 50 s dividend payment of SET Listing Companies Good Corporate Governance : with very good level in 2012 (Corporate Governance Report of Thai Listed Companies excellent ) 37
38 Summary Performance Press Release Unit : MB Q1/2013 Q1/2012 Increase (Decrease) % Changed Reason Net Profit % Increase of gross profit margin and gain on sales of investment properties and motor vehicles. Sale ,088.2 (296.0) -27% Due to the impact of changing in distributorship of Commodity polymer from mid of BU1 (Commodity) decrease 49.78% - BU2 (Specialty&Engineering) increase 10.73% - BU3 (Specialty Chemical) increase 60.29% Other Income % The company sold the old office building and vehicles total amount THB 5.2 Million which do not have these items last year. The rest of other income come form foreign exchange and commission income. Gross Profit (3.7) -6% Because of the decreasing in Commodity Plastic SG&A % This was due to a reversal of Allownace for diminution in value of inventory amounting to THB 2 Million in Q1/2012 Tax (1.2) -15% The corporate income tax rate was decreased from 23% in 2012 to be 20% in This was in accordance with the Royal Degree regarding corportate income tax reduction 38
39 Thank you, Questions are welcome 39
Global Connections Public Company Limited. Opportunity day Q1/2012 Performance Announcement May 14 th, 2012
 Global Connections Public Company Limited Opportunity day Q1/2012 Performance Announcement May 14 th, 2012 1 Today Content Company Overview Plastic and Petrochemical Industry Q1/2012 Performance IR report
The Siam Cement Public Company Limited Management s Discussion and Analysis (MD&A) Consolidated Financial Results: Q2/10 and H1/10
 Consolidated Financial Results: Q2/10 and H1/10") The Siam Cement Public Company Limited Management s Discussion and Analysis (MD&A) Consolidated Financial Results: Q2/10 and H1/10 Q2/10 Net Profit of 7,295 MB, up 6% q-o-q and 7% y-o-y. H1/10 Net Profit
The Siam Cement Public Company Limited Management s Discussion and Analysis (MD&A) Consolidated Financial Results: Q2/10 and H1/10 Q2/10 Net Profit of 7,295 MB, up 6% q-o-q and 7% y-o-y. H1/10 Net Profit
Meetings with Investors January, 2012
 2011 Leader: Building Material & Fixtures Sector Ranked Gold Class: 2011, 2010, 2009, 2008 DJSI member since: 2004 Ranking by SAM Meetings with Investors January, 2012 Agenda Slide 2 Snapshot Strategy
Economic outlook. Bangkok Bank position. Strategic priorities and targets
 20110603 1 Topics 1 2 3 Economic outlook Bangkok Bank position Strategic priorities and targets 2 GDP growth outlook remains strong 6 Baht trn 4 +2.5% 2.3% +7.8% +4 5% +3.0% 2 0 2008 2009 2010 2011f 1Q11(A)
Westlake Chemical Corporation. Acquisition of Eastman s Polyethylene Business and Ethylene Pipeline October 10, 2006
 Westlake Chemical Corporation Acquisition of Eastman s Polyethylene Business and Ethylene Pipeline October 10, 2006 Forward-Looking Statements Statements made during this presentation contain forward-looking
PTTGC Opportunity Day Q Performance
 PTTGC Opportunity Day Q2 2018 Performance 22 August 2018 1 Disclaimer This presentation includes forward-looking statements that are subject to risks and uncertainties, including those pertaining to the
Novel High Performance Polymers
 Novel High Performance Polymers Peter Heydasch, Dow Europe GmbH Dubai PlastPro April 23 rd to 25 th, 2007 Trademark of The Dow Chemical Company ( Dow ) or an affiliated company of Dow Page 1 Monomers and
Financial Summary. Mitsui Chemicals, Inc. November 1, Results of the 1 st Half of FY2018 & Outlook for FY2018
 Financial Summary Results of the 1 st Half of FY2018 & Outlook for FY2018 Mitsui Chemicals, Inc. November 1, 2018 FY2018 indicates the period from April 1, 2018 to March 31, 2019. Contents 1.
INEOS STYROLUTION. Q1/ 2018 Investor Earnings Call
 INEOS STYROLUTION Q1/ 2018 Investor Earnings Call Disclaimer The following presentation includes forward-looking statements, within the meaning of the US securities laws, based on our current expectations
August 8, 2018 Jefferies Industrial Conference
 August 8, 2018 Jefferies Industrial Conference Trademark of Trinseo S.A. or its affiliates Trademark of Trinseo S.A. or its affiliates 1 Introductions & Disclosure Rules Introductions Chris Pappas, President
Macroeconomic Assessment. 30 April 2015
 Macroeconomic Assessment 30 April Source : Office of Agricultural Economics, calculated by Bank of Thailand Supply Side Policy Team Tel. 0 2283 6190 2 200 150 100 50 0 (%YoY) P = Preliminary Data H1 H2
CONTENTS I. FINANCIAL HIGHLIGHTS II. COMMON STOCK INFORMATION III. FINANCIAL SUMMARY IV. CONSOLIDATED FINANCIAL STATEMENTS V. SEGMENT INFORMATION
 Fact Fact Fact Book Book Book 2015 May 2015 2 2 CONTENTS I. FINANCIAL HIGHLIGHTS II. COMMON STOCK INFORMATION III. FINANCIAL SUMMARY IV. CONSOLIDATED FINANCIAL STATEMENTS V. SEGMENT INFORMATION VI. PRODUCTION
Polyplex (Thailand) Public Limited Company
 Public Limited Company") Polyplex (Thailand) Public Limited Company Presentation at the SET Opportunity Day Monday, 19 th March 2012 Website : www.polyplexthailand.com Contents BOPET Film Industry Polyplex group Polyplex Competitive
Polyplex (Thailand) Public Limited Company Presentation at the SET Opportunity Day Monday, 19 th March 2012 Website : www.polyplexthailand.com Contents BOPET Film Industry Polyplex group Polyplex Competitive
Sri Trang Agro-Industry Public Company Limited
 Sri Trang Agro-Industry Public Company Limited Management Discussion and Analysis, Q1 2017 12 th May 2017 STA : The World s Leading Natural Rubber Player Financial result overview In Q1 2017, Natural rubber
Supply. Nominal Farm Income. Economic and Monetary Conditions, Febuary Real Farm Income. Manufacturing Production Index (MPI)
") Economic and Monetary Conditions, Febuary Supply Farm income continued to contract, attributed mainly to decreased agricultural prices which outweighed the expansion in agricultural production. Manufacturing
Economic and Monetary Conditions, Febuary Supply Farm income continued to contract, attributed mainly to decreased agricultural prices which outweighed the expansion in agricultural production. Manufacturing
Financial Report The 1st Half of FY2015 (From Apr. 1 to Sep. 30, 2014)
") Financial Report The 1st Half of FY2015 (From Apr. 1 to Sep. 30, ) November 6, Statement of Income (Consolidated) for 6 Months ended, 2013 Amount Percentage (JPY100m) Net sales 1,534 1,484 50 3 % Elastomer
Financial Report The 1st Half of FY2015 (From Apr. 1 to Sep. 30, ) November 6, Statement of Income (Consolidated) for 6 Months ended, 2013 Amount Percentage (JPY100m) Net sales 1,534 1,484 50 3 % Elastomer
Signet Industries Ltd BSE Scrip Code:
 Signet Industries Ltd BSE Scrip Code: 512131 Comm. Trading & Distribution September 21, 2012 Equity Statistics Current Market Price Rs. 52 Week High / Low Rs. Market Capitalisation Rs. crores Free Float
2.1 Supply. Bank of Thailand, January Nominal Farm Income. Manufacturing Production Index (MPI)
") Bank of Thailand, uary 2.1 Supply Farm income continually increased but concentrated in certain crops and regions. Service sector continued to expand, especially for tourism-related activities on the back
Bank of Thailand, uary 2.1 Supply Farm income continually increased but concentrated in certain crops and regions. Service sector continued to expand, especially for tourism-related activities on the back
Huhtamaki roadshow presentation. Investor Relations Q1 2009
 Huhtamaki roadshow presentation Investor Relations 2009 Huhtamaki in brief A leading manufacturer of consumer and specialty packaging with head office in Espoo, Finland Net sales EUR 2.3 billion in 65
2.1 Supply. Economic and Monetary Conditions, July Nominal Farm Income. Real Farm Income
 Economic and Monetary Conditions, y 2.1 Supply Farm income expanded from the same period last year as supported mainly by increased agricultural production, while agricultural prices slightly contracted.
2.1 Supply. Nominal Farm Income. Bank of Thailand, November Real Farm Income
 Bank of Thailand, November 2.1 Supply Farm income contracted from both decreased agricultural prices and production. Manufacturing and services sector activities expanded from the same period last year.
KASIKORNBANK. Investor Presentation. Monthly Economic Information By KASIKORN RESEARCH CENTER. June 2017
 KASIKORNBANK Investor Presentation Monthly Economic Information By KASIKORN RESEARCH CENTER June 7 For further information, please contact Investor Relations Unit or visit our website at www.kasikornbankgroup.com
Financial Report 1st Quarter of FY2016 (From Apr. 1 to Jun. 30, 2016)
") Financial Report 1st Quarter of (From Apr. 1 to Jun. 30, 2016) July 27, 2016 Statement of Income (Consolidated) for 3 Months ended June 30, 2016 Percentage Net sales 700 760-60 -8 % Comparative analysis
Financial Report 1st Quarter of (From Apr. 1 to Jun. 30, 2016) July 27, 2016 Statement of Income (Consolidated) for 3 Months ended June 30, 2016 Percentage Net sales 700 760-60 -8 % Comparative analysis
Thailand Macroeconomic Assessment Bank of Thailand, June Jun. (%MoM) -0.3% -4.2% +1.3% (%) (%MoM)
 -0.3% -4.2% +1.3% (%) (%MoM)") Thailand Macroeconomic Assessment Bank of Thailand, June Farm income increased due mainly to higher farm prices while farm production remained low. Manufacturing production expanded slightly from the previous
Thailand Macroeconomic Assessment Bank of Thailand, June Farm income increased due mainly to higher farm prices while farm production remained low. Manufacturing production expanded slightly from the previous
2.1 Supply. Nominal Farm Income. Bank of Thailand, October 2017
 Bank of Thailand, October 2.1 Supply Farm income contracted from both decreased agricultural prices and output. Manufacturing production remained unchanged from the same period last year. The overall services
Company Fundamentals
 Plastic Products November 01, 2012 CMP Rs. 14.4 BSE Code 531287 BSE ID NATPLASTI High/Low 1Y (Rs.) 18.70/13.40 Average Volume (3M) 1,075 Market Cap (Rs. Cr.) 8 Shareholding % Sep-12 Jun-12 Promoters 48.51
Supply. Bank of Thailand, December Nominal Farm Income. Real Farm Income. Manufacturing Production Index (MPI)
") Bank of Thailand, December Supply Farm income continued to decline from decreased agricultural prices which outweighed the expansion in agricultural production Manufacturing production expanded from the
Bank of Thailand, December Supply Farm income continued to decline from decreased agricultural prices which outweighed the expansion in agricultural production Manufacturing production expanded from the
PEER GROUPS CMP MARKET CAP EPS P/E (X) P/BV(X) DIVIDEND Company Name (Rs.) Rs. in mn. (Rs.) Ratio Ratio (%)
 P/BV(X) DIVIDEND Company Name (Rs.) Rs. in mn. (Rs.) Ratio Ratio (%)") BUY CMP 71.65 Target Price 85.00 CAPRIHANS INDIA LTD Result Update (PARENT BASIS): Q1 FY16 SEPTEMBER 9 th 2015 ISIN: INE479A01018 Index Details Stock Data Sector Plastic Products BSE Code 509486 Face Value
BUY CMP 71.65 Target Price 85.00 CAPRIHANS INDIA LTD Result Update (PARENT BASIS): Q1 FY16 SEPTEMBER 9 th 2015 ISIN: INE479A01018 Index Details Stock Data Sector Plastic Products BSE Code 509486 Face Value
Monthly Economic Insight
 Monthly Economic Insight Prepared by : TMB Analytics Date: 22 February 2018 Executive Summary Synchronized global economic growth continued to brighten global economic outlook and global trade outlook.
Financial Results for FY2017. (Ended March 31, 2018)
") Financial Results for (Ended March 31, 2018) Apr. 27, 2018 Statement of Income (Consolidated) for 12 Months ended Mar. 31, 2017 Amount Rate Remarks (JPY100m) Net sales 3,327 2,876 451 16 % Comparative
Financial Results for (Ended March 31, 2018) Apr. 27, 2018 Statement of Income (Consolidated) for 12 Months ended Mar. 31, 2017 Amount Rate Remarks (JPY100m) Net sales 3,327 2,876 451 16 % Comparative
Financial Results for FY2016 (Ended March 31, 2017)
") Financial Results for (Ended March 31, 2017) Apr. 28, 2017 Statement of Income (Consolidated) for 12 Months ended Mar. 31, 2017 Amount Percentage Remarks (JPY100m) Net sales 2,876 2,956-80 -3 % Comparative
Financial Results for (Ended March 31, 2017) Apr. 28, 2017 Statement of Income (Consolidated) for 12 Months ended Mar. 31, 2017 Amount Percentage Remarks (JPY100m) Net sales 2,876 2,956-80 -3 % Comparative
Huhtamaki roadshow presentation. Investor Relations Copenhagen Jan 8, 2010
 Huhtamaki roadshow presentation Investor Relations Copenhagen Jan 8, 2010 Huhtamaki in brief A leading manufacturer of consumer and specialty packaging with head office in Espoo, Finland Net sales EUR
Sri Trang Agro-Industry Public Company Limited
 Sri Trang Agro-Industry Public Company Limited Management Discussion and Analysis, Q3 2013 14 th November 2013 STA : A World Leading Natural Rubber Player Financial result overview Our strategic plan to
2011 Leader: Building Material & Fixtures Sector Ranked Gold Class: 2011, 2010, 2009, 2008 DJSI member since: 2004 Ranking by SAM
 2011 Leader: Building Material & Fixtures Sector Ranked Gold Class: 2011, 2010, 2009, 2008 DJSI member since: 2004 Ranking by SAM UBS GEM Conference New York City Nov 28-29, 2011 Agenda Slide 2 Snapshot
Market Capitalization $37.6 Billion
 BUY HOLD SELL A+ A A- B+ B B- C+ C C- D+ D D- E+ E E- F Annual Dividend Rate BUY BUY RATING SINCE 09/28/2004 TARGET PRICE $45.29 BUSINESS DESCRIPTION Provides chemical, plastic and agricultural products
Economic outlook. Bangkok Bank position. Strategic priorities and targets
 20110721 1 Topics 1 2 3 Economic outlook Bangkok Bank position Strategic priorities and targets 2 GDP growth outlook remains strong 6 Baht trn 4 +2.5% 2.3% +7.8% +4 5% +3.2% +2.6% 2 0 2008 2009 2010 2011f
Sep 2017 = 21.9 Bn USD Ex. Gold = 20.6 Bn USD. H1 H2 Q1 Q2 Q3 Aug Sep %MoM
 1 Aug = 21.0 Bn USD Ex. Gold = 20.0 Bn USD Source: Compiled from Customs Department s data P = Preliminary data Sep = 21.9 Bn USD Ex. Gold = 20.6 Bn USD P P Share %YoY P P H1 H2 Q1 Q2 Q3 Aug Sep %MoM sa
Revised October 17, 2016
 Revised October 17, 2016 60 ISM Manufacturing Purchasing Managers Index (September 2015 September 2016) 58 56 54 52 50 48 46 44 42 Sept-15 Oct Nov Dec Jan-16 Feb Mar Apr May Jun Jul Aug Sept Purchasing
Supply. Nominal Farm Income. Economic and Monetary Conditions, March Real Farm Income. Manufacturing Production Index (MPI)
") Economic and Monetary Conditions, March Supply Farm income continued to decline from the same period last year albeit at a decelerated rate, attributed mainly to decreased agricultural prices which outweighed
Economic and Monetary Conditions, March Supply Farm income continued to decline from the same period last year albeit at a decelerated rate, attributed mainly to decreased agricultural prices which outweighed
EASTMAN CHEMICAL COMPANY EMN January 26, :30 PM EDT. Table of Contents. TABLE 1 Statements of Earnings 1. TABLE 2 Other Sales Information 2-3
 FINANCIAL INFORMATION January 26, 2006 For use in the Eastman Chemical Company Conference Call at 8:00 AM (EDT), January 27, 2006. Table of Contents Item Page TABLE 1 Statements of 1 TABLE 2 Other Sales
! " " # #$ %" $ & # '(()
") )4() - &! " " # #$ %" $ & # '(()!" # $% &# ' %% % * +!, -+. /0, '(( 1 ()*+,-./0+1,-2".34,4-5$ % % % 6 3 % %6 % 7 %8 9 '% $ ' %'% ::; '%
)4() - &! " " # #$ %" $ & # '(()!" # $% &# ' %% % * +!, -+. /0, '(( 1 ()*+,-./0+1,-2".34,4-5$ % % % 6 3 % %6 % 7 %8 9 '% $ ' %'% ::; '%
Financial Summary. Mitsui Chemicals, Inc. May 12, Results of FY2016 & Outlook for FY2017. Copyright 2017 Mitsui Chemicals, Inc.
 Financial Summary Results of & Outlook for FY2017 Mitsui Chemicals, Inc. May 12, 2017 indicates the period from April 1, 2016 to March 31, 2017. Contents 1. Results of (April 1, 2016 March 31,
Oct 2017 = 20.0 Bn USD Ex. Gold = 19.9 Bn USD
 1 Sep = 21.9 Bn USD Ex. Gold = 20.6 Bn USD %YoY Oct = 20.0 Bn USD Ex. Gold = 19.9 Bn USD Share P P P H1 Q2 Q3 Sep Oct %MoM sa Agriculture 7.0-6.2 19.8 19.2 28.4 9.8 10.2-5.2 Fishery 1.0 15.1 6.5 10.4 11.5
Financial Summary Results of the First Half of FY2012 & Forecast for FY2012
 Financial Summary Results of the First Half of & Forecast for Mitsui Chemicals, Inc. November 1,, 2012 indicates the fiscal year starting on April 1, 2012 and ending on March 31, 2013 Contents
THIRD QUARTER FISCAL YEAR 2018 Earnings Conference Call & Presentation. August 7, 2018 at 9:00 a.m. CT (10:00 a.m. ET)
") THIRD QUARTER FISCAL YEAR 2018 Earnings Conference Call & Presentation August 7, 2018 at 9:00 a.m. CT (10:00 a.m. ET) 1 Third Quarter Fiscal Year 2018 Welcome to Nexeo s Earnings Conference Call and Presentation
THIRD QUARTER FISCAL YEAR 2018 Earnings Conference Call & Presentation August 7, 2018 at 9:00 a.m. CT (10:00 a.m. ET) 1 Third Quarter Fiscal Year 2018 Welcome to Nexeo s Earnings Conference Call and Presentation
Nielsen s FMCG Index & Fuel Index Jan 2014 = 100 Jan 2014 = 100. Service Index* & Net Tourist Spending Index Jan 2014 = 100
 1 = Nielsen s FMCG Index & Fuel Index = = 115 105 95 85 Durable and Semi-durable Indices Nielsen s FMCG Index sa, 3mma Fuel Index, sa Fuel Index sa, 3mma (RHS) Semi-durable Index sa,3mma Durable Index
Jul 2018 = 20.3 Bn USD Ex. Gold = 20.1 Bn USD. H1 H2 H1 Q1 Q2 Jun Jul
 1 Jun = 21.8 Bn USD Ex. Gold = 21.3 Bn USD %YoY Export Value Source: Compiled from Customs Department s data P = Preliminary data = 20.3 Bn USD Ex. Gold = 20.1 Bn USD P P Share P P H1 H2 H1 Q1 Q2 Jun %MoM
Thailand Macroeconomic Assessment Bank of Thailand, October 2015
 Thailand Macroeconomic Assessment Bank of Thailand, October Agricultural output picked up from last month as rice harvesting was delayed to this month by rain. However, farm income was still affected by
Second Quarter 2017 Financial Results August 3, 2017
 Second Quarter 2017 Financial Results August 3, 2017 Trademark of Trinseo S.A. or its affiliates Introductions & Disclosure Rules Introductions Chris Pappas, President & CEO Barry Niziolek, Executive Vice
ROADSHOW WITH UOB KAY HIAN : INVESTOR PRESENTATION
 ROADSHOW WITH UOB KAY HIAN : INVESTOR PRESENTATION SEPTEMBER 13, 2016 Disclaimer This presentation includes forward-looking statements that are subject to risks and uncertainties, including those pertaining
2.1 Supply. Nominal Farm Income. Economic and Monetary Conditions, June Real Farm Income. Manufacturing Production Index (MPI)
") Economic and Monetary Conditions, June 2.1 Supply Farm income expanded from the same period last year as supported mainly by increased agricultural production, while agricultural prices continued to contract
Economic and Monetary Conditions, June 2.1 Supply Farm income expanded from the same period last year as supported mainly by increased agricultural production, while agricultural prices continued to contract
Jun 2018 = 21.8 Bn USD Ex. Gold = 21.3 Bn USD
 1 May = 22.3 Bn USD Ex. Gold = 21.9 Bn USD %YoY Source: Compiled from Customs Department s data P = Preliminary data Jun = 21.8 Bn USD Ex. Gold = 21.3 Bn USD P P Share P P H1 H2 H1 Q1 Q2 May Jun %MoM sa
Nielsen s FMCG Index & Fuel Index Jan 2014 = 100 Jan 2014 = 100. Service Index* & Net Tourist Spending Index Jan 2014 = 100
 1 = Nielsen s FMCG Index & Fuel Index = = 115 15 95 85 Durable and Semi-durable Indices Nielsen s FMCG Index sa, 3mma Fuel Index, sa Fuel Index sa, 3mma (RHS) Semi-durable Index sa,3mma Durable Index sa,
1H of FY2013 (Apr. to Sep.) Earnings Presentation (Overview)
 Earnings Presentation (Overview)") 1 1H of FY2013 (Apr. to Sep.) Earnings Presentation (Overview) 1 Overview of 1H FY2013 Results [Billion, except for reference] 1H FY2013 1H FY2012 Difference 1H FY2013 Forecast Announced Aug. 1, 2013 Net
1 1H of FY2013 (Apr. to Sep.) Earnings Presentation (Overview) 1 Overview of 1H FY2013 Results [Billion, except for reference] 1H FY2013 1H FY2012 Difference 1H FY2013 Forecast Announced Aug. 1, 2013 Net
Financial Summary Results of Nine Months of FY2012 & Forecast for FY2012
 Financial Summary Results of Nine Months of & Forecast for Mitsui Chemicals, Inc. February 5,, 2013 indicates the fiscal year starting on April 1, 2012 and ending on March 31, 2013 Contents 1.Results
Consolidated Financial Results FY2017: Full-Year Ended December 31
 Securities Code:4631 Consolidated Financial Results FY: Full-Year Ended December 31 February 2018 2 Contents Quarterly trends in segment results (Reference) 2 Summary of financial results 3 Segment results
Vietnam Looking Forward
 Looking Forward 1 in Regional Perspectives Compared to its regional peers, economy, although the smallest in size, is the most dynamic in terms of growth. GDP growth (%) USD 395 Bn 8.0 7.0 6.0 5.0 4.0
Advanced Petrochemical Co.
 Advanced Petrochemical Co. Initiation of Coverage Recommendation Overweight Fair Value (SAR) 57.25 Price as of May 10, 2016 42.74 Expected Return 01.1% Company Data Tadawul Symbol 2330.SE 52 Week High
PTT Global Chemical Public Company Limited. FY 2014 Management Discussion and Analysis. (Translation) EXCELLENCE CREATES SUSTAINABLITIY
 EXCELLENCE CREATES SUSTAINABLITIY") PTT Global Chemical Public Company Limited FY 2014 Management Discussion and Analysis (Translation) EXCELLENCE CREATES SUSTAINABLITIY Executive Summary In 2014 PTT Global Chemical Public Company Limited
PTT Global Chemical Public Company Limited FY 2014 Management Discussion and Analysis (Translation) EXCELLENCE CREATES SUSTAINABLITIY Executive Summary In 2014 PTT Global Chemical Public Company Limited
Siamgas and Petrochemicals Public Company Limited. Presentation for Investors & Analysts. Quarter 4, 2013
 Siamgas and Petrochemicals Public Company Limited Presentation for Investors & Analysts Quarter 4, 2013 Disclaimer The information contained in this presentation is for information purposes only and does
11-Year Consolidated Financial Highlights
 11-Year Consolidated Financial Highlights As of March 31, 2017 2007.3 2008.3 2009.3 2010.3 Net Sales ( million) 1,376,958 1,487,496 1,660,162 1,415,718 Operating Profit ( million) 162,315 70,048 65,204
2Q/2011 2Q/2010 1Q/2011
 (Revised) PTT Chemical Public Company Limited Management's Discussion and Analysis Financial Result for the second quarter of 2011 1. Executive Summary In the second quarter of 2011, PTT Chemical Public
3Q17 Results Investor Presentation
 3Q17 Results Investor Presentation 09/11/2017 Ethylene Naphtha spread averaged US$ 681/ton in 3Q17 Ethylene Naphtha spread averaged US$ 705/ton in 2Q17 Ethylene-naphtha spreads decreased by 3% from the
BUY. NILKAMAL LIMITED Result Update(PARENT BASIS): Q1 FY 16 SYNOPSIS. CMP Target Price OCTOBER 12 th 2015 ISIN: INE310A01015
: Q1 FY 16 SYNOPSIS. CMP Target Price OCTOBER 12 th 2015 ISIN: INE310A01015") BUY CMP 974.25 Target Price 1100.00 NILKAMAL LIMITED Result Update(PARENT BASIS): Q1 FY 16 OCTOBER 12 th 2015 ISIN: INE310A01015 Index Details Stock Data Sector Plastic Products BSE Code 523385 Face Value
BUY CMP 974.25 Target Price 1100.00 NILKAMAL LIMITED Result Update(PARENT BASIS): Q1 FY 16 OCTOBER 12 th 2015 ISIN: INE310A01015 Index Details Stock Data Sector Plastic Products BSE Code 523385 Face Value
CIS DOWNSTREAM SUMMIT 20 Th Annual
 1 CIS DOWNSTREAM SUMMIT 20 Th Annual H.Alimorad Investment Director / National Petrochemical Company (NPC) Board Member of Persian Gulf Petrochemical Industries Company (PGPIC) 2 Iran 2 nd largest economy
Financial Report For the year ended March 31, 2014 (April 1, 2013 to March 31, 2014)
") Financial Report For the year ended March 31, 2014 (April 1, 2013 to March 31, 2014) May 8, 2014 Statement of Income (Consolidated) for 12 Months ended Mar.31, 2014 FY2013 FY2012 Amount Percentage (JPY100m)
Financial Report For the year ended March 31, 2014 (April 1, 2013 to March 31, 2014) May 8, 2014 Statement of Income (Consolidated) for 12 Months ended Mar.31, 2014 FY2013 FY2012 Amount Percentage (JPY100m)
Fourth Quarter and Full Year 2017 Financial Results February 19, 2018
 Fourth Quarter and Full Year 2017 Financial Results February 19, 2018 Trademark of Trinseo S.A. or its affiliates Introductions & Disclosure Rules Introductions Chris Pappas, President & CEO Barry Niziolek,
Summary of Consolidated Financial Results for First Quarter of FY2018
 Summary of Consolidated Financial Results for First Quarter of Aug 2, 2018 Mitsui Chemicals, Inc. 1. Summary of Income Statement Net sales Operating income Ordinary income Profit attributable to owners
2009 Hankook Tire 4th Quarter Result 2010 BusinessTarget IR
 2009 Hankook Tire 4th Quarter Result 2010 BusinessTarget IR 2010.01.15 English Ver. The information in this presentation is based upon management forecasts and reflects prevailing conditions and our views
Financial Summary Results of the First Half of FY2011
 Financial Summary Results of the First Half of & Outlook for Mitsui Chemicals, Inc. November 2,, 2011 indicates the fiscal year starting on April 1 of 2011 and ending on March 31 of 2012 Contents
Global Styrene Butadiene Rubber (SBR) Market Study ( )
 Market Study ( )") Global Styrene Butadiene Rubber (SBR) Market Study (2014 2025) Table of Contents 1. INTRODUCTION 1.1. Introduction to SBR Market Product Description Properties Industry Structure Value Chain Market Dynamics
Global Styrene Butadiene Rubber (SBR) Market Study (2014 2025) Table of Contents 1. INTRODUCTION 1.1. Introduction to SBR Market Product Description Properties Industry Structure Value Chain Market Dynamics
IRPC Public Company Limited and its Subsidiaries Management Discussion and Analysis (MD&A) For Quarter 2/2009
 For Quarter 2/2009") IRPC Public Company Limited and its Subsidiaries Management Discussion and Analysis (MD&A) For Quarter 2/ 1. Operating Performance Consolidated Income Statement 2Q09 2Q08 Change 1Q09 Change Sales Revenue
IRPC Public Company Limited and its Subsidiaries Management Discussion and Analysis (MD&A) For Quarter 2/ 1. Operating Performance Consolidated Income Statement 2Q09 2Q08 Change 1Q09 Change Sales Revenue
Financial Summary. Mitsui Chemicals, Inc. Aug 2, Results of the 1 st Quarter of FY2018 & Outlook for FY2018
 Financial Summary Results of the 1 st Quarter of FY2018 & Outlook for FY2018 Mitsui Chemicals, Inc. Aug 2, 2018 FY2018 indicates the period from April 1, 2018 to March 31, 2019. Contents 1. Results
KBank Capital Markets Perspectives 29 February 2016
 KBank Capital Markets Perspectives 29 February 2016 Thailand Economic Monitor and BoT Forecast : March 2016 Thailand s economy steadied in February, though domestic demand decelerated slightly from January
Nielsen s FMCG Index & Fuel Index Jan 2014 = 100 Jan 2014 = 100. Service Index* & Net Tourist Spending Index. Durable and Semi-durable Indices
 1 = Nielsen s FMCG Index & Fuel Index = = 115 15 95 Durable and Semi-durable Indices Nielsen s FMCG Index sa, 3mma Fuel Index, sa Fuel Index sa, 3mma (RHS) Semi-durable Index sa,3mma Durable Index sa,
Company Overview. Financial Performance
 Dec-14 Jan-15 Feb-15 Mar-15 Apr-15 May-15 Jun-15 Jul-15 Aug-15 Sep-15 Oct-15 Nov-15 CMP: 25.20 December 30, 2015 Stock Details BSE code 524440 BSE ID CAMEXLTD Face value ( ) 10 No of shares (m) 10.2 52
PETKİM PETROKİMYA HOLDİNG A.Ş. ANALYST PRESENTATION 14 August 2009
 PETKİM PETROKİMYA HOLDİNG A.Ş. ANALYST PRESENTATION 14 August 2009 2 AGENDA PETROCHEMICAL INDUSTRY & PETKİM OPERATIONAL ACTIVITIES FINANCIAL RESULTS GROWTH PLAN 3 AGENDA PETROCHEMICAL INDUSTRY & PETKİM
Analyst Meeting. 2Q09 Performance. Friday 14 August 2009
 Analyst Meeting 2Q9 Performance Friday 14 August 29 Agenda 2Q9 Management Highlights Operation Performance CAPEX Financial Performance Industry Outlooks 2 2Q9 Highlights Overview Operation Improving in
August 8, 2017 This document is a translation of the official Japanese version provided for information purpose only.
 Financial Results for 2Q FY2017 August 8, 2017 This document is a translation of the official Japanese version provided for information purpose only. Overview of Results for 2nd Quarter of FY2017 Scope
AIRA Capital Public Company Limited AC Group Opportunity Day FY16
 AIRA Capital Public Company Limited AC Group Opportunity Day FY16 27 March 2017 Group Structure AIRA Capital Public Company Limited ( AIRA Capital ) has incorporated as a holding company with investments
The Chemours Company Goldman Sachs Basic Materials Conference. May 17, 2017
 The Chemours Company Goldman Sachs Basic Materials Conference May 17, 2017 Safe Harbor Statement and Other Matters This presentation contains forward-looking statements, within the meaning of the federal
Financial Summary. Mitsui Chemicals, Inc. February 5, Results for 3 rd Quarter of FY2018 & Outlook for FY2018
 Financial Summary Results for 3 rd Quarter of FY2018 & Outlook for FY2018 Mitsui Chemicals, Inc. February 5, 2019 FY2018 indicates the period from April 1, 2018 to March 31, 2019. Contents 1.
Financial Summary Results of Nine Months of FY2011 & Outlook for FY2011
 Financial Summary Results of Nine Months of & Outlook for Mitsui Chemicals, Inc. February 3,, 2012 indicates the fiscal year starting on April 1, 2011 and ending on March 31, 2012 Contents 1.Results
Monthly Report on the Corporate Goods Price Index ( Preliminary Figures for August 2017 )
") Research and Statistics Department Bank of Japan Report on the Corporate Goods Price Index The Producer Price Index was und from the previous. The Export Price Index (contract currency ) rose 0.6 percent
Research and Statistics Department Bank of Japan Report on the Corporate Goods Price Index The Producer Price Index was und from the previous. The Export Price Index (contract currency ) rose 0.6 percent
Key developments and outlook
 1/17 Key developments and outlook Economic growths in 2016 and 2017 remain close to the previous assessment. Better-than-expected merchandise exports and private consumption compensate for weaker-than-expected
Vol. 5 : August Forward to Complex Refinery. The Bangchak Petroleum Public Company Limited
 Vol. 5 : August 2008 Forward to Complex Refinery The Bangchak Petroleum Public Company Limited Contents Editor s Note 2 Oil Price Situation 2Q 08 3 2Q 08 Performance Summary Product Quality Improvement
Company Focus. Polyplex (Thailand) Thailand. FV Bt3.04 SET: (Downgrade from Buy)
 Thailand. FV Bt3.04 SET: (Downgrade from Buy)") Thailand DBS Group Research. Equity FV Bt3.04 SET: 694.09 (Downgrade from Buy) Price Target : 1-year Bt3.00 (prev. Bt5.82) Reason for Report : Company visit ANALYST Vichitr Kuladejkhuna, CFA 66 (0) 2657
Thailand DBS Group Research. Equity FV Bt3.04 SET: 694.09 (Downgrade from Buy) Price Target : 1-year Bt3.00 (prev. Bt5.82) Reason for Report : Company visit ANALYST Vichitr Kuladejkhuna, CFA 66 (0) 2657
KAP INDUSTRIAL HOLDINGS LIMITED (KAP)
") KAP INDUSTRIAL HOLDINGS LIMITED (KAP) INVESTEC CEO CONFERENCE NOVEMBER 2016 UNAUDITED LONDON INTERIM RESULTS FOR THE SIX MONTHS ENDED 31 DECEMBER 2016 AGENDA KAP OVERVIEW SAFRIPOL OVERVIEW SAFRIPOL ACQUISITION
KAP INDUSTRIAL HOLDINGS LIMITED (KAP) INVESTEC CEO CONFERENCE NOVEMBER 2016 UNAUDITED LONDON INTERIM RESULTS FOR THE SIX MONTHS ENDED 31 DECEMBER 2016 AGENDA KAP OVERVIEW SAFRIPOL OVERVIEW SAFRIPOL ACQUISITION
WE HAVE ONLY SEEN THE BEGINNING OF WHAT FIBER-BASED MATERIALS AND SOLUTIONS CAN BE USED FOR
 WE HAVE ONLY SEEN THE BEGINNING OF WHAT FIBER-BASED MATERIALS AND SOLUTIONS CAN BE USED FOR JAN ÅSTRÖM, PRESIDENT AND CEO PPT HÖSTSEMINARIUM STOCKHOLM, NOVEMBER 28, 2017 We are one from April 1 st, 2017
LyondellBasell Acquisition of A. Schulman
 LyondellBasell Acquisition of A. Schulman Creating an Advanced Polymer Solutions Leader February 15, 2018 1 Cautionary Note Regarding Forward-looking Statements The statements in this communication relating
Service Index* & Net Tourist Spending Index. Nielsen s FMCG Index & Fuel Index Jan 2014 = 100 Jan 2014 = 100. Durable and Semi-durable Indices
 1 Nielsen s FMCG Index & Fuel Index = = 115 15 95 85 = Durable and Semi-durable Indices Nielsen s FMCG Index sa, 3mma Fuel Index, sa Fuel Index sa, 3mma (RHS) Semi-durable Index sa,3mma Durable Index sa,
Goldman Sachs Basic Materials Conference. Doug Pike VP, Investor Relations May 17, 2016
 Goldman Sachs Basic Materials Conference Doug Pike VP, Investor Relations May 17, 2016 Cautionary Statement The statements in this presentation relating to matters that are not historical facts are forward-looking
Q Operational and Financial Results. 15 May 2018
 Q1 2018 Operational and Financial Results 15 May 2018 DISCLAIMER The information contained herein pertaining to SIBUR (the "Company") has been provided by the Company solely for use at this presentation.
Investor Presentation. December 2013
 Investor Presentation December 2013 24.02.2014 Table of Contents 1. Thai economy 2. Strengthening bank and client base 3. BBL s financial results Thai economy in 2014-2015 Thailand is facing short-term
Deutsche Bank Global Industrials and Materials Summit
 Deutsche Bank Global Industrials and Materials Summit Doug Pike VP, Investor Relations June 9, 2016 Cautionary Statement The statements in this presentation relating to matters that are not historical
Financial Results for First Half of Fiscal 2008
 Financial Results for First Half of Fiscal Bridgestone Corporation August 8, 1 Business and Financial Performance 2 Consolidated Results for First Half of Fiscal Reference February 08 Announcement 1H Projection
Supplementary Information on Financial Summary for the Nine Months of FY2014
 Supplementary Information on Financial Summary for the Nine Months of FY2014 Mitsui Chemicals, Inc. February 4, 2015 Contents 1) Consolidated Financial Highlights of the Nine Month of FY2014 1 2) Increase/Decrease
Advisory Desk. TVS Srichakra Ltd. BUY CMP. `355 Target Price `468. Investment rationale. Outlook and valuation. Investment Period 12 Months
 Ltd. Ltd. (TVSSL), a part of TVS Group, is a leading manufacturer of two and three-wheeler tyres with a 25% market share. Two-wheeler demand growth (~16% yoy YTD) continues to be insulated from the current
Dow s Transformation In Action
 Dow s Transformation In Action Geoffery E. Merszei Executive Vice President & Chief Financial Officer December 2, 2008 Agenda Strengthening Basics Preferentially Investing in Performance Businesses Business
Morgan Stanley Global Chemicals Conference Sergey Vasnetsov Senior Vice President, Strategic Planning and Transactions November 2012
 Morgan Stanley Global Chemicals Conference Sergey Vasnetsov Senior Vice President, Strategic Planning and Transactions November 212 Cautionary Statement The information in this presentation includes forward-looking