Steps during first quarter 2011
|
|
|
- Dylan Bennett
- 5 years ago
- Views:
Transcription

1 Olof Sand CEO
2 Steps during first quarter January 2011: Storyflex with operations in Czech republic and Slovakia becomes a part of Proact on Pro forma revenue last 12 months: 108 MSEK 1 January 2011: 1 April: Databasement - specialist within Storage as a service with operations in The Netherlands, Belgium and Spain becomes a part of Proact Pro forma revenue last 12 months: 180 MSEK B2net - the biggest integrator within our niche in UK becomes a part of Proact Pro forma revenue last 12 months: 500 MSEK Organizational changes Managing and reporting the Proact Group per Business Unit
3 Which means: Proact is now 60% bigger than 2010 and have a pro forma revenue on 2.2 billion SEK and a potential to become a 3 billion SEK company in 24 months The acquisitions will contribute positive to Proact EPS in 2011 Proact is the largest independent storage and archiving specialist integrator in Europe Proact has operations in 13 countries Proact has the best services offer in the niche storage and archiving; Managing Cloud Services, Customer Support and Financing Services Proact will now and the rest of this year focus on integration and create synergies

4 Proact in brief Proact is a specialist company within services and solutions for storage and archiving The goal is to be established in most important markets in Europe within the next few years Run-rate revenue, 250M Euro with PBT on 5% The goal is to grow more than twice as fast as the market with a PBT on 7% level 570 employees, of which more than 350 within services Operations in 13 countries

5 Financial report January December 2010
6 Income statement January December 2010 (Mkr) Jan-Dec 2010 Jan-Dec 2009 System Sales Services Other Revenue Products and services Gross profit Sales and marketing Administration Operating profit Financial net Profit before tax Net margin 5.1% 4.8% Tax Profit after tax Profit margin 3.8% 4.2% Comments versus last year Revenue Total growth + 11 % Growth system sales + 15 % Growth services + 3 % Growth in pbt + 17 %
7 Cash flow January December 2010 Liquid Funds December 31, Cash-flow from current operations +64 Current operations +98 Change in working capital -34 Cash-flow from investment activities -41 Acquisition -1 Fixed assets -40 Cash-flow from financial activities -47 Buy-back of shares -19 Dividend -13 Dividend minority -2 Amortization of loan -2 Other -11 Change in liquid funds -24 Liquid Funds December 31,
8 Key ratios Balance sheet (MSEK) Dec Sep Dec Total Assets whereof Goodwill whereof Intangible fixed assets whereof Accounts receivable Equity Solidity % 21% 29% 24 % Cash and bank
9 Revenue and profit before tax January - December 2010 January - December 2009 (Mkr) Revenue P.b.t Net margin Revenue P.b.t Net margin Sweden % % Finland % % Norway % % Denmark % % Netherlands % % Lithuania % % Latvia % % Estonia Neg Neg. Other Group % %
10 Financial report January March 2011
11 Income statement January March 2011 (Mkr) Jan-Mar 2011 Jan-Mar 2010 System Sales Services Other Revenue Products and services Gross profit Sales and marketing Administration Operating profit Financial net Profit before tax Margin 0.8% 3.0% Tax Profit after tax Net margin 0.6% 2.2% Comments versus last year Revenue Organic growth +7 % Acquired growth + 18 % Total growth + 25 % Currency growth +8 % Total growth +33 % Growth system sales + 27 % Growth services + 19 % Profit old Proact: 11,5 (+21 %)
12 Revenue per industry 12 months April 2010 March 2011 Bank, finans; 5% Media; 4% Övrigt; 2% ; 0 Handel och tjänster; 24% Olja, energi; 12% Tillverkande industri; 13% Offentlig sektor; 22% Telekom; 19%
13 Cash flow January March 2011 (MSEK) Liquid Funds December 31, Cash-flow from operations -17 Current operations +11 Change in working capital -28 Cash-flow from investment activities -49 Fixed assets -10 Acquisitions -39 Cash-flow from financial activities +39 Bank overdraft facilities +43 Bank loans -4 Change in liquid funds -27 Liquid Funds March 31,
14 Key ratios Balance sheet (MSEK) 2011 Mar Dec Mar 31 Total Assets whereof Goodwill whereof Intangible fixed assets whereof Accounts receivable Equity Solidity % 19 % 21 % 26 % Cash and bank deposits Bank overdraft facilities, utilized Bank loans
15 Revenue and profit before tax per Business Unit January March 2011 January March 2010 (Mkr) Revenue P.b.t Net margin Revenue P.b.t Net margin North % % BeNeLux + Spain % Neg West Neg Neg East Neg % Proact Finance Neg Neg Other Group % % Group, organic %
16 Proact share Top 10 owners March 31 January 31 December Skandia Liv 10.4 % 10.4 % 10.4 % IGC Industrial Growth Co. AB 10.1 % 10.1 % 10.1 % Swedbank Robur Småbolagsfonder 8.7 % 8.7 % 8.7 % Skagen Fonder 7.8 % 7.8 % 7.9 % Thyra Hedge 5.4 % 5.3 % 5.3 % Öresund Investment AB 5.3 % 5.3 % 5.3 % SEB Fonder 4.6 % 4.6 % 4.6 % Nordea Fonder 3.0 % 2.6 % 2.6 % Didner & Gerge Småbolag 2.7 % 2.7 % 2.8 % Tangent 2.7 % 2.4 % 2.4 % Others 39.3 % 40.0 % 40.1 % Total 100 % 100 % 100 % After the buyback of own shares carried out during May 2010 March 2011, the company holds 154,300 own shares

17 Share price development since 18 May 2010

18 Share price development since 2 May 2008
19 Company Update
20 Business around the globe

21 Focus Areas

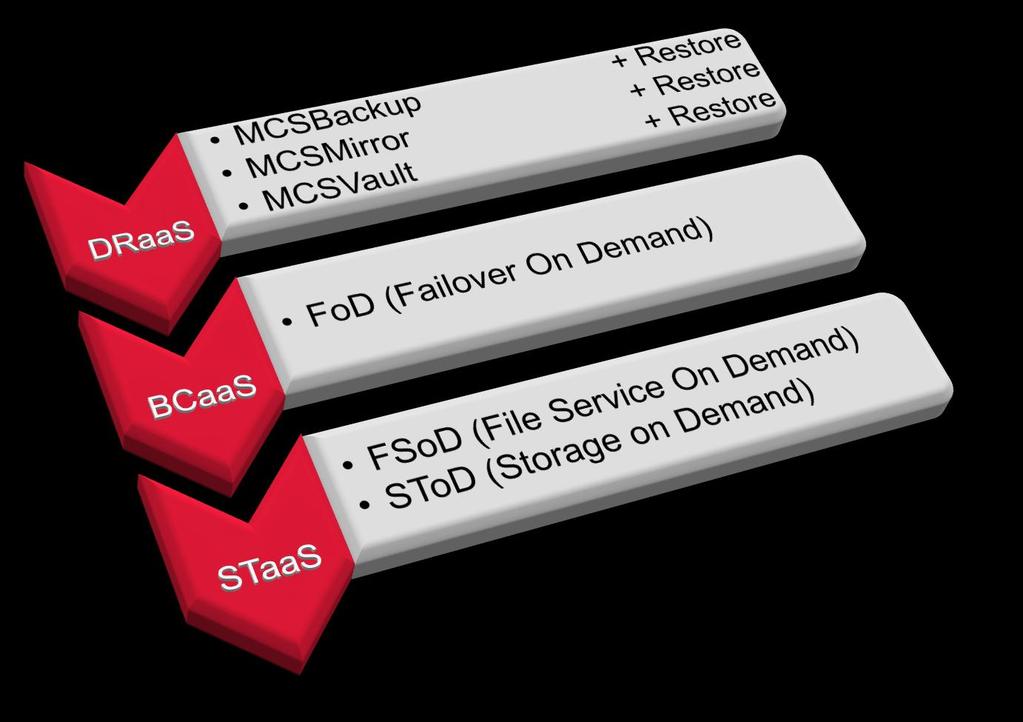
22 Hybrid model 5. mai 2011 page 22
23 Proact Services As an independent integrator we supply; Professional services Customer support Managed Cloud Services and Financial services Focus areas are; Storage, Backup/Recovery, Archiving and Disaster Recovery Complemented by broad expertise in the IT Infrastructure Proact Services an USP


24 5. mai 2011 page 24
25 The Storage and Archiving market, source: IDC 2009 the created volume of digital information increased to 800 billion gigabyte For the years to come, the volume of digital information is forecasted to grow every year by 44 times If that s true, only the growth of digital information in 2020 will be 35 zetabyte
26 But - How much is that?


27 Step 1: Take the books in the Millenium-trilogy by Stieg Larsson
28 Step 2: Put all three of them in a pile multiply by 707 billion
29 and they will reach from Planet Earth to Planet Pluto Pluto 16 times! Earth
30 that s a lot!


31 Storage market 4 year forecast, source: IDC/SNIA


32 Our industry focus and customers at a glance Lithuanian Parliament City of Tampere June 25, Page 32

33 Main focus areas Profitable growth Operational efficiency Leading innovation

34 The three phases of the innovation process Innovation and creation Bring it to the market Conceptualize and scale Will it work? Build up competence and experience Let us do it on all markets!

35 We secure mission-critical information
Steps during first quarter 2011
 Olof Sand CEO Steps during first quarter 2011 1 January 2011: Storyflex with operations in Czech republic and Slovakia becomes a part of Proact on Pro forma revenue last 12 months: 108 MSEK 1 January 2011:
Q Martin Ödman CEO
 Q1 2014 Martin Ödman CEO The first quarter in brief The total income in the quarter increased by 3 % compared with the same period last year» Taking into account the currency effects Adjusted for onetime
Q Martin Ödman CEO
 Q3 Martin Ödman CEO Proact Summit tember/october More than 1 000 participants Very good feedback from the customers many leads Increased interest from the customers with regards to Proact s own tracks
Financial report. January March 2018
 Financial report January March 2018 Strategy We are constantly working according to our established strategy, in order to meet the company s objectives and financial targets. The strategy is based on the
FINANCIAL REPORT January June 2018
 FINANCIAL REPORT January June Strategy We are constantly working according to our established strategy, in order to meet the company s objectives and financial targets. The strategy is based on the following
Financial Report January September 2018
 Financial Report January September 2018 Jonas Hasselberg, CEO, Proact IT Group jonas.hasselberg@proact.eu www.proact.eu Jonas Persson, CFO, Proact IT Group jonas.persson@proact.eu www.proact.eu Delivering
Interim Report, January March 2016
 Interim Report, January March 2016 The first quarter in brief Revenue remained unchanged, when adjusted for currency effects the revenue fell by 2% to SEK 723 (739) million. EBITDA fell by 9% to SEK 39.0
Interim Report, January March 2018
 SEK million per quarter SEK million rolling 12 months SEK per share ROE % Interim Report, January March 2018 The first quarter in brief As from January 1, 2018, the company applies the new accounting standard
SPP - Additional information. November 2005
 SPP - Additional information November 2005 SPP Overview 30 September 2005 Assets under management: SEK 83bn Premium income, Jan-Sep 2005: SEK 3.3bn Duration, commitments to policyholders: 17 years Policies:
Interim Report Second Quarter 2003 July 17, 2003
 Interim Report Second Quarter 23 July 17, 23 Q2 at a glance Structural changes vs 22 Tampere business consolidated from Q1 23 Respons (Eniro 118 118) consolidated from May 1, 23 Closure of Windhager in
Interim Report, January - March 2017
 MSEK SEK per share ROE % MSEK MSEK Interim Report, January - March 2017 The first quarter in brief Revenues increased by 21% to SEK 877 (723) million, the organic growth equals 7%. EBITDA increased by
Interim report January September. October
 Interim report January September October 29 2008 July September 2008 Highlights Norway is on rolling 12 months larger on online than on offline with continued high margins Operating revenues in Q3 amounted
Interim report, January September 2018
 SEK million per quarter SEK million rolling 12 months SEK per share ROE % Interim report, January September 2018 The third quarter in brief Revenues increased by 11% to SEK 725 (653) million. Growth in
Composition of capital IT044 IT044 POWSZECHNAIT044 UNIONE DI BANCHE ITALIANE SCPA (UBI BANCA)
") Composition of capital POWSZECHNA (in million Euro) Capital position CRD3 rules A) Common equity before deductions (Original own funds without hybrid instruments and government support measures other than
Composition of capital POWSZECHNA (in million Euro) Capital position CRD3 rules A) Common equity before deductions (Original own funds without hybrid instruments and government support measures other than
Interim report, January September 2017
 SEK million per quarter SEK million rolling 12 months SEK per share ROE % Interim report, January September 2017 The third quarter in brief Revenues increased by 11% to SEK 657 (594) million. Growth in
Year end report. January-December st of January 2018 Mikael Ericson, President and CEO Erik Forsberg, CFO
 Year end report January-December 2017 31 st of January 2018 Mikael Ericson, President and CEO Erik Forsberg, CFO Agenda 1. Highlights for the fourth quarter and FY 2017 2. Key messages from Capital Markets
Investor Presentation. Result presentation. January September 2010
 Investor Presentation Result presentation January September 2010 Highlights Income Seasonally slow quarter supported by diversified earnings Further improved asset quality Baltics back in black Profit
Chart pack to council for cooperation on macroprudential policy
 Chart pack to council for cooperation on macroprudential policy Contents List of charts... 3 Macro and macro-financial setting... 5 Swedish macroeconomic setting... 5 Foreign macroeconomic setting... Macro-financial
HL Display Group Fourth Quarter and Full-Year Report January December 2012
 PRESS RELEASE Contact: Gérard Dubuy, CEO Magnus Bergendorff, CFO Telephone: +46 (0)8-683 73 00 Internet including image archive: www.hl-display.com HL Display Group Fourth Quarter and Full-Year Report
Svenska Handelsbanken Second quarter 2002
 Svenska Handelsbanken Second quarter 2002 20 August 2002 Profit and loss account, January - June Handelsbanken Group Q2 Q2 Change SEKm 2002 2001 % Net interest income 7 025 6 464 9 Commission, net 2 549
Q3 Report Q3 report
 Q3 Report 2013 2013-10-25 1 Highlights Q3 Quiet but stable business period Improved profit Strong development in International and Finland Mixed market signals High potential in new contracts in public
UBS Nordic Financial Services Conference Stockholm
 Annika Falkengren President and CEO UBS Nordic Financial Services Conference Stockholm 10 September 2009 1 The starting point: SEB has a strong competitive position A long-term relationship bank How we
Anders Ek Executive Vice President, Head of Strategic and International Banking. Tokyo March 14, 2007
 Anders Ek Executive Vice President, Head of Strategic and International Banking Tokyo March 14, 2007 Swedbank - an introduction (2) A leading Nordic-Baltic bank Other markets, niche banking Denmark - Swedbank
Fact book Q April 2007
 Fact book Q1 27 25 April 27 Contents page General information 2 Mission, vision, values and markets 2 Financial objectives 3 Geographic reach and market shares 4 Macro economic indicators 5-6 Business
KNOW IT AB INTERIM REPORT JANUARY JUNE 2010
 We deliver the IT expertise of a big company with the soul of a small company and the commitment of the individual consultant KNOW IT AB INTERIM REPORT JANUARY JUNE 2010 Net sales and operating profit
% % SEK million per quarter % rolling 12 months 4.0% % % % %
 Year-end Report 2017 The fourth quarter in brief Revenues increased by 3% to SEK 895 (868) million. Growth in local currencies was 4%. The organic growth equals -6%. EBITDA decreased by 8% and amounted
Interim report January March 2018
 Interim report January March 2018 PERIOD JANUARY 1 MARCH 31, 2018 Net sales increased by 7 % to SEK 101.2 m (SEK 94.7 m) Software revenues increased by 9 % to SEK 66.2 m (SEK 61.0 m) Recurring revenue
Q4, February 2007
 16 February 27 Contents page Mission, vision, values and markets 2 Financial objectives 3 Geographic reach and market shares 4 Macro economic indicators 5 Cross selling, Internet bank and cards 6 Lending
Potential value of processing of telecom metadata for the European economy
 Potential value of processing of telecom metadata for the European economy If the processing of telecom metadata were authorized under the E-privacy Regulation in the same conditions than the processing
Facts. Q3, 2007 October 24, 2007
 Facts October 24, 27 24 October, 27 Contents page General information 2 Mission, vision, values and markets 2 Financial objectives 3 Geographic reach and market shares 4 Macro economic indicators 5-6 Business
BE Group Year-end report 2006
 BE Group Year-end report 2006 Håkan Jeppsson, CEO Torbjörn Clementz, CFO BE Group in Brief A leading supplier independent steel service company. Broad range of steel, stainless steel and aluminium products.
Composition of capital as of 30 September 2011 (CRD3 rules)
") Composition of capital as of 30 September 2011 (CRD3 rules) Capital position CRD3 rules September 2011 Million EUR % RWA References to COREP reporting A) Common equity before deductions (Original own funds
Composition of capital as of 30 September 2011 (CRD3 rules) Capital position CRD3 rules September 2011 Million EUR % RWA References to COREP reporting A) Common equity before deductions (Original own funds
Interim Report BE Group AB (publ) 2017 Malmö, October 24, Strongly improved underlying operating result
 2017 Malmö, October 24, Strongly improved underlying operating result") BE Q3 Interim Report BE Group AB (publ) Malmö, October 24, Strongly improved underlying operating result THIRD QUARTER Net sales increased by 9 percent to SEK 968 M (892), excluding operations under restructuring,
BE Q3 Interim Report BE Group AB (publ) Malmö, October 24, Strongly improved underlying operating result THIRD QUARTER Net sales increased by 9 percent to SEK 968 M (892), excluding operations under restructuring,
Bo Annvik. Patrik Johnson
 Q1 2018 Bo Annvik CEO Patrik Johnson CFO Highlights first quarter 2018 Continued positive demand, particularly in Sweden, UK and Benelux operations Easter effect and cold winter impacting invoicing and
Interim report, January June 2018
 SEK million per quarter SEK million rolling 12 months SEK per share ROE % Interim report, January June 2018 The second quarter in brief Revenues increased by 5% to SEK 868 (826) million. Growth in local
Interim report Q3 2017
 Q3 Solid portfolio acquisitions and strong earnings trend July September Total revenue was unchanged at SEK 666m (665). Profit before tax increased 40 per cent to SEK 182m (130). Diluted earnings per share
TELE2 AB ANNOUNCES STRONG GROUP CUSTOMER INTAKE, AND CONTINUED SIGNIFICANT IMPROVEMENT IN EBITDA MARGINS
 FOR IMMEDIATE RELEASE Monday, August 6, 2001 TELE2 AB ANNOUNCES STRONG GROUP CUSTOMER INTAKE, AND CONTINUED SIGNIFICANT IMPROVEMENT IN EBITDA MARGINS 63% Annualized increase in Pro forma Operating Revenue
Interim report January December 2018
 Interim report January December 2018 PERIOD OCTOBER 1 DECEMBER 31, 2018 PERIOD JANUARY 1 DECEMBER 31, 2018 Net sales decreased by 1 % to SEK 109.6 m Net sales increased by 4 % to SEK 406.4 m (SEK 390.2
Scania Financial Services FECMA Budapest May Claes Jacobsson Senior Vice President Financial Services
 Scania Financial Services FECMA Budapest May 2013 Claes Jacobsson Senior Vice President Scania Financial Services Credit Risk and Portfolio Performance 2 Just when you thought it was safe to go back into
INTERIM REPORT January-September 2016
 INTERIM REPORT January-September 2016 THE PERIOD IN BRIEF THE PERIOD JANUARY-SEPTEMBER 2016 COMPARED WITH JANUARY-SEPTEMBER 2015 Total operating income increased by 11.8 % to SEK 322.9 million The loan
Interim Report for New Wave Group AB (publ)
") Interim Report for New Wave Group AB (publ) Q3 january september 2004 Continued heavy growth in sales as well as profit. During Q3 sales increased by 27 % to SEK 525 (413) m. and profit after net financial
Interim Report for New Wave Group AB (publ) Q3 january september 2004 Continued heavy growth in sales as well as profit. During Q3 sales increased by 27 % to SEK 525 (413) m. and profit after net financial
Significant events during the first quarter of 2012
 Interim Report 1 January 31 2013 Increase in net sales and strong cash flow First quarter 2013 Net sales totaled SEK 370.7 (358.9) M, up 3 percent. EBITA amounted to SEK 28.6 (36.9) M, an EBITA-margin
Increased profit and net sales New ventures in Norway Continued actions in Finland
 01 INTERIM REPORT JANUARY SEPTEMBER 2014 Increased profit and net sales New ventures in Norway Continued actions in Finland JANUARY SEPTEMBER 2014 NET SALES INCREASED BY 3.4 PERCENT TO SEK 1,474.9 (1,425.8)
Investor Presentation. Annual Accounts
 Investor Presentation Annual Accounts SEB a unique Nordic Bank Relationships Corporates Stability 2 Unique corporate franchise Truly embedded corporate bank Mergers & Acquisitions Foreign Exchange Trade
Interim Report January June 2011
 Interim Report January June Lars Nyberg President and CEO 1 A united TeliaSonera shows strong profitability Net sales SEK 25,894 million (27,065) Increased 3.0 percent in local currencies EBITDA* SEK 9,9
NOTE. for the Interparliamentary Meeting of the Committee on Budgets
 NOTE for the Interparliamentary Meeting of the Committee on Budgets THE ROLE OF THE EU BUDGET TO SUPPORT MEMBER STATES IN ACHIEVING THEIR ECONOMIC OBJECTIVES AS AGREED WITHIN THE FRAMEWORK OF THE EUROPEAN
Capital Market Day. Group CEO and President Kari Stadigh. May 19 th, 2009
 Capital Market Day Group CEO and President Kari Stadigh May 19 th, 2009 Sampo Group s results AFS, Profit before taxes M-to-M profit before taxes EURm 200 EURm 100 1Q/2009 24 1Q/2008 150 0 100 169 142-100
Svenska Handelsbanken Third quarter 2002
 Svenska Handelsbanken Third quarter 2002 22 October 2002 Profit and loss account, January - September Handelsbanken Group Change SEKm 2002 2001 % Net interest income 10 611 9 856 8 Commission, net 3 782
UBS Global Financial Services conference New York, May 16, Jan Lidén CEO
 UBS Global Financial Services conference New York, May 16, 27 Jan Lidén CEO The leading bank in four small countries Sweden Total population: 9.m Private customers: 4.1m Corp. customers: 262, Organisations:
INTERIM REPORT - NINE MONTHS 1 December August 2004
 INTERIM REPORT - NINE MONTHS 1 December 2003-31 August 2004 H&M s Group turnover excluding VAT amounted to SEK 37,821 M (34,315), an increase of 10 per cent. In comparable currency rates the increase was
Knowit AB Interim report
 ... Knowit AB Interim report January September 2013... Important events... Increased earnings per share in third quarter Improved cash flow JANUARY SEPTEMBER 2013 JULY SEPTEMBER 2013 Net sales increased
Facts Q July, 2012
 Facts Q2 2012 18 July, 2012 44B 4B 44B 4B 44B 4B Contents page page General information 2 Asset quality 41 Swedbank in brief 2-3 Credit risks 41-42 Macro economic indicators 4-5 Asset quality 43-45 Income
Swedbank New York and Boston roadshow, September 24 26, Mikael Inglander, Chief Financial Officer
 Swedbank New York and Boston roadshow, September 24 26, 27 Mikael Inglander, Chief Financial Officer The leading bank in four small countries Sweden Total population: 9.m Private customers: 4.1m Corp.
Welcome to Kungsleden. First Quarter 2011
 Welcome to Kungsleden First Quarter 2011 Kungsleden in brief Owns and manages properties generating high and stable long-term returns Returns more important than property type and location Returns cannot
1 (19) Year-end report January December Tradedoubler year-end report January December 2016
 Year-end report January December Tradedoubler year-end report January December 2016") 1 (19) Year-end report January December 2016 Tradedoubler year-end report January December 2016 2 (19) Year-end report January December 2016 Improved financial performance THE FOURTH QUARTER OCTOBER -
1 (19) Year-end report January December 2016 Tradedoubler year-end report January December 2016 2 (19) Year-end report January December 2016 Improved financial performance THE FOURTH QUARTER OCTOBER -
Q PRESENTATION 7 FEBRUARY 2018
 Q4 2017 PRESENTATION 7 FEBRUARY 2018 Highlights Q4 2017 Record high revenue, operating profit, and cash flow from operations REVENUE of NOK 10.0 billion (up 10.1%) Change in currency rates positively impacts
Sales and results of operations Group
 Sales and results of operations Group Progress in the quarter Total income increased by 2% and operating profit increased by 126% to SEK 112 million The increase is driven by increased assets under management
Interim Report January - March 2015
 Interim Report January - March 2015 The period January - March 2015* Net sales increased by 23% in the period to SEK 1,848 (1,508) m. Adjusted EBITA improved by SEK 19 m, and amounted to SEK 100 (81) m.
The Swedish Social Insurance Inspectorate selected e-service from Ida Infront. New Business Area Manager for the business area Process Management.
 Interim report 1 January 30 June 2015 Strategic acquisition creates leading PLM supplier in Europe Summary of the second quarter, April June 2015 Net sales amounted to SEK 387.3 M (371.3), up 4 percent.
Name Organisation Date
 European Public Leadership Driving Innovation In Construction and Operations Name Organisation Date Construction: declining productivity and low digitalisation Productivity Digitalisation Other non-farm
Facts Q February, 2012
 Facts Q4 2011 14 February, 2012 44B 4B 44B 4B Contents page page General information 2 Asset quality 43 Swedbank in brief 2-3 Credit risks 43-44 Macro economic indicators 4-5 Asset quality 45-47 Income
Outline. Who are we? History The beginning Handelsbanken today Our Way Planning The Wheel Oktogonen Have we succeeded? Selection of awards
 Outline Who are we? History The beginning Handelsbanken today Our Way Planning The Wheel Oktogonen Have we succeeded? Selection of awards Handelsbanken in brief Founded in 1871 Higher profitability than
Year-end report January - December January 24, 2017 Mattias Ankarberg and Pernilla Walfridsson
 Year-end report January - January 24, 2017 Mattias Ankarberg and Pernilla Walfridsson Summary Q4 2016 Net sales increased +16.2 percent, compared with pro forma unchanged (0.0%). Net sales for comparable
EU BUDGET AND NATIONAL BUDGETS
 DIRECTORATE GENERAL FOR INTERNAL POLICIES POLICY DEPARTMENT ON BUDGETARY AFFAIRS EU BUDGET AND NATIONAL BUDGETS 1999-2009 October 2010 INDEX Foreward 3 Table 1. EU and National budgets 1999-2009; EU-27
Kungsleden AB (publ) Chief Executive Thomas Erséus Deputy Chief Executive Johan Risberg 24 April 2009
 Chief Executive Thomas Erséus Deputy Chief Executive Johan Risberg 24 April 2009") Kungsleden AB (publ) Chief Executive Thomas Erséus Deputy Chief Executive Johan Risberg 24 April 2009 Kungsleden in brief Kungsleden owns and manages properties generating high and stable long-term returns
Kungsleden AB (publ) Chief Executive Thomas Erséus Deputy Chief Executive Johan Risberg 24 April 2009 Kungsleden in brief Kungsleden owns and manages properties generating high and stable long-term returns
Interim report January-June July 15, 2016 Magnus Agervald and Pernilla Walfridsson
 Interim report January- July 15, 2016 Magnus Agervald and Pernilla Walfridsson Summary January- In the second quarter, s net sales increased 34 percent Net sales amounted to SEK 1,738.7 M (1,294.6), up
This is a translation of the Swedish interim report. If there should be any discrepancies, the Swedish language version governs.
 This is a translation of the Swedish interim report. If there should be any discrepancies, the Swedish language version governs. Net sales increased by 18.8% to MSEK 45.6 (38.4) Gross profit increased
Interim report Q August, 2007 Jan Lidén CEO and President
 Interim report Q2 27 7 August, 27 Jan Lidén CEO and President Summary Q2 27 (Q1 27) Continued improved results: SEK 3,112m (2,91 in Q1 27) Earnings per share increased 7% compared with Q1 27 Net interest
VINX 30 Index. More information about the Index can be found at
 VINX 30 Index The VINX 30 Index is the leading share index of the Nordic Exchanges and the Oslo exchange. The index consists of the 30 largest and most actively traded shares listed on NASDAQ OMX Nordic
1. About us. 2. Our market. 3. Our operations. 4. Financials. 5. Financing strategy. 6. Commercial paper programme. 7. Summary
 1. About us 2. Our market 3. Our operations 4. Financials 5. Financing strategy 6. Commercial paper programme 7. Summary 2 Joachim Hallengren, CEO CEO of NCC Housing 2012 2016 and a total of 16 years experience
EU-28 RECOVERED PAPER STATISTICS. Mr. Giampiero MAGNAGHI On behalf of EuRIC
 EU-28 RECOVERED PAPER STATISTICS Mr. Giampiero MAGNAGHI On behalf of EuRIC CONTENTS EU-28 Paper and Board: Consumption and Production EU-28 Recovered Paper: Effective Consumption and Collection EU-28 -
Electricity & Gas Prices in Ireland. Annex Business Electricity Prices per kwh 2 nd Semester (July December) 2016
 2016") Electricity & Gas Prices in Ireland Annex Business Electricity Prices per kwh 2 nd Semester (July December) 2016 ENERGY POLICY STATISTICAL SUPPORT UNIT 1 Electricity & Gas Prices in Ireland Annex Business
Electricity & Gas Prices in Ireland Annex Business Electricity Prices per kwh 2 nd Semester (July December) 2016 ENERGY POLICY STATISTICAL SUPPORT UNIT 1 Electricity & Gas Prices in Ireland Annex Business
TeliaSonera Interim Report January September 2015
 Solid core business THIRD QUARTER SUMMARY Net sales increased 6.3 percent to SEK 27,029 million (25,417). Net sales in local currencies, excluding acquisitions and disposals, increased 2.4 percent. Service
May 2012 Euro area international trade in goods surplus of 6.9 bn euro 3.8 bn euro deficit for EU27
 108/2012-16 July 2012 May 2012 Euro area international trade in goods surplus of 6.9 3.8 deficit for EU27 The first estimate for the euro area 1 (EA17) trade in goods balance with the rest of the world
Investor presentation. Result presentation
 Investor presentation Result presentation 21 Highlights Income Solid results given present macroeconomic climate Lower provisioning for credit losses and no new NPL formation Provisions for credit losses
Full year report January December 2017
 Full year report January December 2017 Telephone conference February 7, 2018 Thomas Berglund, CEO Olof Bengtsson, CFO Solid Q4 now speeding up the journey of specialization and digitalization Highlights
March 2005 Euro-zone external trade surplus 4.2 bn euro 6.5 bn euro deficit for EU25
 STAT/05/67 24 May 2005 March 2005 Euro-zone external trade surplus 4.2 6.5 deficit for EU25 The first estimate for euro-zone 1 trade with the rest of the world in March 2005 was a 4.2 billion euro surplus,
Year-end report Jan-Dec February, 2018
 1 Year-end report Jan-Dec 2017 1 February, 2018 Executive summary on development We follow our strategic plan Good sales growth continues Supply chain back on track Efficiency improvements according to
In 2004 Tele2 increased revenues by 16% to SEK 43 billion with EBITDA rising 11% to SEK 6.6 billion
 For immediate release, Wednesday, February 16, 2005 New York and Stockholm Wednesday, February 16, 2005 Tele2 AB ( Tele2, the Group ) (Nasdaq Stock Market: TLTOA and TLTOB and Stockholmsbörsen: TEL2A and
First estimate for 2011 Euro area external trade deficit 7.7 bn euro bn euro deficit for EU27
 27/2012-15 February 2012 First estimate for 2011 Euro area external trade deficit 7.7 152.8 deficit for EU27 The first estimate for the euro area 1 (EA17) trade in goods balance with the rest of the world
ENIRO Q3 REPORT Johan Lindgren, CEO Mattias Lundqvist, CFO Cecilia Lannebo, Head of IR
 ENIRO Q3 REPORT 2012-10-25 Johan Lindgren, CEO Mattias Lundqvist, CFO Cecilia Lannebo, Head of IR CEO INTRODUCTION & SUMMARY A digital media company with 74 percent of revenues being digital the transformation
Interim Report January June 2003
 Interim Report January June 2003 20 August 2003 April-June January - June Jan.-Dec. July-June Key figures 2003 2002 2003 2002 2002 2002/03 Net sales, SEK m 2,406 2,547 4,752 4,951 9,594 9,395 Operating
INTERIM REPORT - Q1 2016
 INTERIM REPORT - Q1 2016 FIRST QUARTER OF 2016 Revenues totalled EUR 7.46 million (1.96), an increase of 281 percent compared with the same quarter for the previous year. Adjusted operating profit excluding
June 2014 Euro area international trade in goods surplus 16.8 bn 2.9 bn surplus for EU28
 127/2014-18 August 2014 June 2014 Euro area international trade in goods surplus 16.8 bn 2.9 bn surplus for EU28 The first estimate for the euro area 1 (EA18) trade in goods balance with the rest of the
June 2012 Euro area international trade in goods surplus of 14.9 bn euro 0.4 bn euro surplus for EU27
 121/2012-17 August 2012 June 2012 Euro area international trade in goods surplus of 14.9 0.4 surplus for EU27 The first estimate for the euro area 1 (EA17) trade in goods balance with the rest of the world
January 2005 Euro-zone external trade deficit 2.2 bn euro 14.0 bn euro deficit for EU25
 42/2005-23 March 2005 January 2005 Euro-zone external trade deficit 2.2 14.0 deficit for EU25 The first estimate for euro-zone 1 trade with the rest of the world in January 2005 was a 2.2 billion euro
Nordax A Leading Niche Bank in Northern Europe Q1 REPORT 2017 APRIL 26
 Nordax A Leading Niche Bank in Northern Europe REPORT APRIL 26 88 MSEK NET PROFIT (93 MSEK) 0.80 SEK EARNINGS PER SHARE (0.84 SEK) 14% 14.3% LOAN PORTFOLIO GROWTH CET 1 RATIO (14.0% ) 2 131 MSEK ADJUSTED
Year-end report 2017 Press and analyst presentation
 Year-end report 2017 Press and analyst presentation 8 February, 2018 Per Strömberg, CEO Sven Lindskog, CFO In brief Good sales momentum in Sweden Robust underlying EBIT and cash flow Strong online growth
Macroeconomic overview SEE and Macedonia
 Macroeconomic overview SEE and Macedonia Zoltan Arokszallasi Chief Analyst, Macro & FX/FI Research Erste Group Bank Erste Investors Breakfast, 29 September, Skopje 02. Oktober SEE shows mixed performance
Specialist in a globally growing niche. NCAB GROUP 5 October 2018
 Specialist in a globally growing niche Agenda 1. NCAB in short 2. Our globally growing niche market 3. Focus on sustainability 4. Financials, strategy and goals 1. NCAB in short 15 companies 45 markets
SEK million
 Fourth quarter Full year SEK million 20 20 20 20 Group Net sales 26,489 23,180 101,221 87,174 Operating profit before depreciation/amortisation (EBITDA) 1,889 1,423 6,191 5,819 Operating profit (EBIT)
Communication on the future of the CAP
 Communication on the future of the CAP The CAP towards 2020: meeting the food, natural resources and territorial challenges of the future Tassos Haniotis, Director Agricultural Policy Analysis and Perspectives
Interim report Q April 25, 2007 Jan Lidén President and CEO
 Interim report Q1 2007 April 25, 2007 Jan Lidén President and CEO Highlights Q1 2007 Strong and stable results intact SEK 2,910m (2,270 Q1, 2006) Strong and stable results from all major business areas;
Nordax Bank. With a vision to become a Leading Niche Bank in Northern Europe Q3 REPORT 2017 OCTOBER 25 JACOB LUNDBLAD CEO & LENNART ERLANDSON CFO
 Nordax Bank With a vision to become a Leading Niche Bank in Northern Europe REPORT OCTOBER 25 JACOB LUNDBLAD CEO & LENNART ERLANDSON CFO Setting the future agenda CORE OPERATIONS BUSINESS DEVELOPMENT EFFICIENCY
Q4 report 2017, Avida Holding AB
 Q4 report 2017, Avida Holding AB Fourth quarter highlights Group results Continued strong volume growth of 76% YoY to SEK2,835m Revenues increased to SEK101m and profit increased to SEK21.9m Earnings before
Interim report January June 2018
 Interim report January June 2018 PERIOD APRIL 1 JUNE 30, 2018 Net sales increased by 3 % to SEK 100.0 m (SEK 97.1 m) Software revenues increased by 6 % to SEK 66.1 m (SEK 62.3 m) Recurring revenue amounted
In Q Tele2 increased revenues by 28% to SEK13.9 billion adding 1.2 million new customers.
 For immediate release, Friday, February 17, 2006 Stockholm Friday, February 17, 2006 Tele2 AB ( Tele2 ) (Stockholmsbörsen: TEL2A and TEL2B), Europe s leading alternative telecom operator, today announced
hms networks Fourth quarter Yearly Y E A R - E N D R E P O R T JANUARY - DECEMBER
 hms networks Y E A R - E N D R E P O R T 2 0 1 6 JANUARY - DECEMBER Yearly Net sales for the full year increased by 36 % reaching SEK 952 m (702), corresponding to a 34 % increase in local currencies.
H & M HENNES & MAURITZ AB FULL YEAR RESULTS
 H & M HENNES & MAURITZ AB FULL YEAR RESULTS 1 December 2004 to 30 November 2005 Group turnover excluding VAT for the financial year amounted to SEK 61,262 M (53,695), an increase of 14 per cent compared