Financial report. January March 2018
|
|
|
- Betty Reynolds
- 5 years ago
- Views:
Transcription

1 Financial report January March 2018

2 Strategy We are constantly working according to our established strategy, in order to meet the company s objectives and financial targets. The strategy is based on the following areas» The Power of together» Customer focus» Market leading offering independent of suppliers» Emphasis on innovation» Growth» Increased proportion of contracted revenues
3 Market trends The underlying growth of digital business-critical information remains high The rapid digitisation taking place in most industries and businesses and the increasing volume of business-critical information, means that the IT infrastructure is becoming increasingly complex and new demands are being made Applications, automation and security are fields of increasing strategic importance Customers want to offer IT as a service, where in-house and external users themselves order and consume different types of IT service based on the needs of each individual user. To facilitate the supply of IT as a service, companies and authorities are implementing a combination of private and public cloud services, known as hybrid clouds.
4 The first quarter in brief As from January 1, 2018, the company applies the new accounting standard IFRS 15» In total, these changes have had a negative effect on the quarter s revenues with 95 MSEK, adjusted for this change revenues has decreased by 2.6%.» The changed accounting principles have no impact on the company's business and cash flows System sales revenues» Decreased by 20% and amounted to 481 (598) MSEK. The decrease mainly relates to introducing a new accounting standard, whereby 95 MSEK, which had previously been recognized during the quarter, will be recognized over future periods of one to three years Service revenues» Total revenues continued to develop positively during the quarter and amounted to 276 MSEK, an increase of 1%» Revenues relating to cloud services amounted to 110 MSEK, an increase of 9%» Rolling 12 months cloud revenues amounted to 426 MSEK an increase of 14%
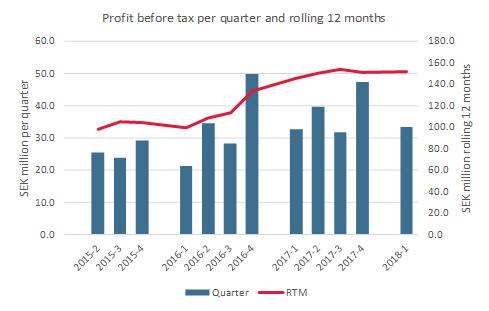
5 The first quarter in brief, cont d The company's gross margin has increased by 2 percentage points Sales and marketing expenses and administration expenses in total decreased by 5% Profit before tax increased by 10% to 35.8 MSEK Net margin 4.7% compared to 3.7% corresponding quarter previous year
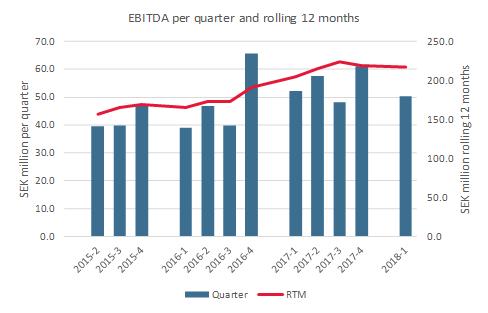
6 Income statement January March 2018 (MSEK) Jan-Mar 2018 Jan-Mar 2017 System Sales Services Other Revenue Products and services Gross profit Sales and marketing Administration Items affecting comparability Operating profit Financial net Profit before tax Margin 4.4% 3.7% Tax Profit after tax Net margin 3.3% 2.7% Revenue Growth Total revenue -13% if reversed change in accounting principles, for comparison: Jan-Mar Jan-Mar Growth, adjusted -2.6% System sales -20% if reversed change in accounting principles, for comparison: Jan-Mar Jan-Mar Growth, adjusted -3.7% Services 1% Jan-Mar 2018 Jan-Mar 2017 EBITDA % % EBITA % % EBIT % %
7 Income statement rolling 12 months (MSEK) Apr-Mar 2017/2018 Apr-Mar 2016/2017 System Sales 2, ,027.1 Services 1, ,042.3 Other Revenue 3, ,071.6 Products and services -2, ,346.0 Gross profit Sales and marketing Administration Items affecting comparability Operating profit Financial net Profit before tax Margin 4.8% 4.7% Tax Profit after tax Net margin 3.7% 3.4% Revenue Growth Total revenue 2% Growth in Local Currencies 2% System sales -1% Growth in Local Currencies 0% Services 6% Growth in Local Currencies 6% Apr-Mar 2018 Apr-Mar 2017 EBITDA % % EBITA % % EBIT % ,8%
8 Revenue and profit before tax per Business Unit January - March 2018 (MSEK) Revenue PBT Net margin January - March 2017 Revenue PBT Net margin Nordics % % UK % % West % % East % % Proact Finance % % Other Items affecting comparability Group % % Deferred income Q due to change in accounting principles: Nordics 47 MSEK, UK 18 MSEK, West 27 MSEK, East 3 MSEK
9 Revenue per industry 12 months Apr-Mar 2018 Other 14 (13) % Trading and services 24 (25) % Media 4 (2) % Bank and Finance 9 (9) % Oil and Energy 5 (6) % Public sector 18 (20) % Manufacturing 13 (11) % Telecom 13 (14) %
10 Cash flow January March 2018 Liquid Funds December 31, Cash-flow from current operations -13 Current operations 34 Change in working capital -47 Cash-flow from investment activities -50 Fixed assets -31 Acquisitions -19 Cash-flow from financial activities 8 Bank loans/bank overdraft facilities 23 Acquisitions from holdings without controlling influence -7 Buy back of own shares -8 Change in liquid funds -55 Currency translation difference in liquid funds 15 Liquid Funds March 31,
11 Key ratios Balance sheet (MSEK) 2018 Mar Dec Mar 31 Total Assets 1,997 1,941 1,865 whereof Goodwill whereof Intangible fixed assets whereof Accounts receivables Equity Solidity 21% 20% 20% Cash and bank deposits Bank loan, overdraft facilities etc Net cash (+)/Net debt (-) Bank overdraft facilities, unutilized Bank overdraft facilities, total


12 Summary rolling 12 months
13 Proact share Top 10 owners March 31, March December 31 AB Grenspecialisten 11.1 % 11.1 % Livförsäkrings AB Skandia 10.9 % 10.9 % UBS AG London Branch A/C Client 8.0 % 0.0 % Fondita Nordic Micro Cap SR 4.6 % 4.6 % Försäkringsaktiebolaget, Avanza Pension 4.1 % 1.4 % JP Morgan Bank Luxembourg S.A. 3.9 % 3.9 % Skandia Sverige 3.8 % 3.8 % HSBC Trustee of Marlborough, European 2.8 % 2.3 % Handelsbankens Nordiska Småbolag Sverige 2.7 % 1.8 % JPMEL Stockholm Branch 2.4 % 2.1 % Others 45.6 % 58.0 % Total 100 % 100 % After earlier buy back of own shares, the company holds as per March 31, 2018, shares
14 Q/A
FINANCIAL REPORT January June 2018
 FINANCIAL REPORT January June Strategy We are constantly working according to our established strategy, in order to meet the company s objectives and financial targets. The strategy is based on the following
Financial Report January September 2018
 Financial Report January September 2018 Jonas Hasselberg, CEO, Proact IT Group jonas.hasselberg@proact.eu www.proact.eu Jonas Persson, CFO, Proact IT Group jonas.persson@proact.eu www.proact.eu Delivering
Q Martin Ödman CEO
 Q3 Martin Ödman CEO Proact Summit tember/october More than 1 000 participants Very good feedback from the customers many leads Increased interest from the customers with regards to Proact s own tracks
Q Martin Ödman CEO
 Q1 2014 Martin Ödman CEO The first quarter in brief The total income in the quarter increased by 3 % compared with the same period last year» Taking into account the currency effects Adjusted for onetime
Steps during first quarter 2011
 Olof Sand CEO Steps during first quarter 2011 1 January 2011: Storyflex with operations in Czech republic and Slovakia becomes a part of Proact on Pro forma revenue last 12 months: 108 MSEK 1 January 2011:
Steps during first quarter 2011
 Olof Sand CEO Steps during first quarter 2011 1 January 2011: Storyflex with operations in Czech republic and Slovakia becomes a part of Proact on Pro forma revenue last 12 months: 108 MSEK 1 January 2011:
Interim Report, January March 2018
 SEK million per quarter SEK million rolling 12 months SEK per share ROE % Interim Report, January March 2018 The first quarter in brief As from January 1, 2018, the company applies the new accounting standard
Interim Report, January - March 2017
 MSEK SEK per share ROE % MSEK MSEK Interim Report, January - March 2017 The first quarter in brief Revenues increased by 21% to SEK 877 (723) million, the organic growth equals 7%. EBITDA increased by
% % SEK million per quarter % rolling 12 months 4.0% % % % %
 Year-end Report 2017 The fourth quarter in brief Revenues increased by 3% to SEK 895 (868) million. Growth in local currencies was 4%. The organic growth equals -6%. EBITDA decreased by 8% and amounted
Interim Report, January March 2016
 Interim Report, January March 2016 The first quarter in brief Revenue remained unchanged, when adjusted for currency effects the revenue fell by 2% to SEK 723 (739) million. EBITDA fell by 9% to SEK 39.0
Interim report, January September 2017
 SEK million per quarter SEK million rolling 12 months SEK per share ROE % Interim report, January September 2017 The third quarter in brief Revenues increased by 11% to SEK 657 (594) million. Growth in
KappAhl: Sales are increasing in both new and existing stores
 Interim report for the Second Quarter of financial year 2006/2007 KappAhl: Sales are increasing in both new and existing stores Second Quarter (December 2006 - February 2007) KappAhl s net sales for the
Interim Report January - March 2015
 Interim Report January - March 2015 The period January - March 2015* Net sales increased by 23% in the period to SEK 1,848 (1,508) m. Adjusted EBITA improved by SEK 19 m, and amounted to SEK 100 (81) m.
Q interim report 3 May 2018, CEO Robin Reed
 Q1 2018 interim report 3 May 2018, CEO Robin Reed Today s presenters Robin Reed Founder & CEO Opening up igaming, to make it fair & fun for all Tore Formo Group CFO 2 GiG overview Technology company providing
Interim report, January June 2018
 SEK million per quarter SEK million rolling 12 months SEK per share ROE % Interim report, January June 2018 The second quarter in brief Revenues increased by 5% to SEK 868 (826) million. Growth in local
Boule Diagnostics AB (publ) Interim report January September Earnings more than doubled and continued sales success
 Interim report January September Earnings more than doubled and continued sales success") Boule Diagnostics AB (publ) Interim report January September 2016 Earnings more than doubled and continued sales success Quarter July September 2016 Net sales amounted to SEK 108.5 million (88.8), up 22.2
Boule Diagnostics AB (publ) Interim report January September 2016 Earnings more than doubled and continued sales success Quarter July September 2016 Net sales amounted to SEK 108.5 million (88.8), up 22.2
BE Group Year-end report 2006
 BE Group Year-end report 2006 Håkan Jeppsson, CEO Torbjörn Clementz, CFO BE Group in Brief A leading supplier independent steel service company. Broad range of steel, stainless steel and aluminium products.
Interim report, January September 2018
 SEK million per quarter SEK million rolling 12 months SEK per share ROE % Interim report, January September 2018 The third quarter in brief Revenues increased by 11% to SEK 725 (653) million. Growth in
Interim report January March 2018
 Interim report January March 2018 PERIOD JANUARY 1 MARCH 31, 2018 Net sales increased by 7 % to SEK 101.2 m (SEK 94.7 m) Software revenues increased by 9 % to SEK 66.2 m (SEK 61.0 m) Recurring revenue
INTERIM REPORT January March "Everything we do, we do to enable our partners to achieve their full potential"
 INTERIM REPORT January March 2018 "Everything we do, we do to enable our partners to achieve their full potential" COMPANY OVERVIEW Aspire Global is a leading platform-provider to igamingoperators, providing
TODAY S PRESENTER. Opening up igaming, to make it fair and fun for all. Robin Reed CEO
 TODAY S PRESENTER Opening up igaming, to make it fair and fun for all Robin Reed CEO 2 OUTLINE Overview Highlights Strategic & Business Update Summary & Outlook Q/A 3 OVERVIEW Technology company providing
Makes it easier to be professional
 Makes it easier to be professional Handelsbanken Nordic Mid/small Cap Seminar June 8, 2017 President and CEO Johan Nilsson 2 2 Introduction One-Stop-Shop multi channel offering for professionals Branches
Interim Report (January March 2015)
") Opus Group AB (publ) Interim Report (January March 2015) Acquisition of Drew Tech implemented and good revenue growth and profitability during the quarter January March 2015 Net sales amounted to SEK 400,8
Opus Group AB (publ) Interim Report (January March 2015) Acquisition of Drew Tech implemented and good revenue growth and profitability during the quarter January March 2015 Net sales amounted to SEK 400,8
Interim report January September 2016
 Interim report January September 2016 PERIOD JULY 1 SEPTEMBER 30, 2016* Net sales SEK 83.2 m (SEK 83.5 m) System revenue SEK 56.2 m (SEK 56.3 m) Recurring revenue in percentage of net sales 54% (50%) EBITDA
YEAR-END REPORT for the period FULL YEAR Sales increased by 12.2 % to MSEK (MSEK 657.0) EBITDA amounted to MSEK 75.0 (MSEK 75.
 EBITDA amounted to MSEK 75.0 (MSEK 75.") FULL YEAR Sales increased by 12.2 % to MSEK 737.2 (MSEK 657.0) EBITDA amounted to MSEK 75.0 (MSEK 75.5) Profit before tax increased by 1.9 % to MSEK 68.3 (MSEK 67.0) Profit margin before tax amounted to
FULL YEAR Sales increased by 12.2 % to MSEK 737.2 (MSEK 657.0) EBITDA amounted to MSEK 75.0 (MSEK 75.5) Profit before tax increased by 1.9 % to MSEK 68.3 (MSEK 67.0) Profit margin before tax amounted to
Instrument sales remain strong
 [Skriv här] Boule Diagnostics AB (publ) Interim report January March 2017 Instrument sales remain strong Quarter January March 2017 Net sales amounted to SEK 106.6 million (84.4), up 26.3 percent. Adjusted
Makes it easier to be professional. Q report presentation January 26, 2017
 Makes it easier to be professional Q4 2017 report presentation January 26, 2017 1 Q4 in brief Strong fourth quarter High activity level Organic sales growth of 11% Growth in all segments Adj. EBITA of
INTERIM REPORT JULY- SEPTEMBER 2018
 CLAVISTER HOLDING AB (publ.) INTERIM REPORT JULY - SEPTEMBER 218 1 INTERIM REPORT JULY- SEPTEMBER 218 Clavister develops, produces and sells cybersecurity solutions. The company was founded in 1997 and
Interim report 1 January 31 March 2018 Actic Group AB
 Q1 Interim report 1 January 31 March Actic Group AB Efficiency enhancements and acquisitions strengthen results INTERIM REPORT 1 JANUARY 31 MARCH ACTIC GROUP AB 1 Interim report 1 January 31 March First
P R E S S R E L E A S E
 P R E S S R E L E A S E from ASSA ABLOY AB (publ) 27 April 2004 No. 5/04 ASSA ABLOY Q1: ORGANIC GROWTH AND IMPROVED MARGINS IN ALL DIVISIONS Sales in the first quarter increased organically by 3% to SEK
Managing cash in society.
 interim report January June 2012 Managing cash in society. Continued margin improvement January June 2012 Revenue during the period amounted to MSEK 5,720 MSEK (5,210). Real growth amounted to 6 percent
IAR Systems Group AB Interim report January-June IAR Systems Group AB Interim report January-March 2017
 IAR Systems Group AB Interim report January-June 217 IAR Systems Group AB Interim report January-March 217 IAR Systems Group AB Interim report January-June 217 Q1 Q2 Strong recovery in Asia and stable
Strong growth at Nolato Medical
 Nolato three-month interim report 2007, page 1 of 11 Nolato AB (publ) three-month interim report 2007 Strong growth at Nolato Medical First quarter 2007 in brief Sales totaled SEK 560 M (594) The acquisition
Very strong license sales
 Interim Report JANUARY MARCH 214 Very strong license sales License revenue for January-March increased with 27 percent to SEK 53.4 (42.) million Sales for January-March increased with 9 percent to SEK
2014/ /2014 Change 2014/ /2014 Change
 16 April 2015 Second quarter (Dec Feb) Half year (Sept-Feb) Change Change Net sales, SEK million 1 133 1 114 19 2 307 2 357-50 Operating profit, SEK million 9 3 6 104 102 2 Gross margin % 57.8 57,7 0,1
Ework commences year on-track
 Interim report Q1 2018 Ework commences year on-track First Quarter 2018 compared to Net sales increased by 10% to SEK 2,623 M (2,389). EBIT was down by 18% to SEK 22.5 M (27.4). Order intake fell by 5%
Interim report January December 2018
 Interim report January December 2018 PERIOD OCTOBER 1 DECEMBER 31, 2018 PERIOD JANUARY 1 DECEMBER 31, 2018 Net sales decreased by 1 % to SEK 109.6 m Net sales increased by 4 % to SEK 406.4 m (SEK 390.2
9 May 2016 Interim Report Rejlers AB January - March 2016
 Rejlers is one of the Nordic region's largest technical consultants. 2,100 experts work on projects in construction and property, energy, industry and infrastructure. We have specialist engineers with
Group statement of comprehensive income (IFRS) Restated
 Restated") Group income statement (IFRS) EUR million Q1-Q4 Q1-Q3 Q1-Q2 Q1 Net sales 2,321.2 1,745.6 1,161.3 546.8 Cost of goods sold -1,949.2-1,462.6-972.9-462.8 Gross profit 372.0 283.0 188.4 84.0 Other operating
Group income statement (IFRS) EUR million Q1-Q4 Q1-Q3 Q1-Q2 Q1 Net sales 2,321.2 1,745.6 1,161.3 546.8 Cost of goods sold -1,949.2-1,462.6-972.9-462.8 Gross profit 372.0 283.0 188.4 84.0 Other operating
hms networks Fourth quarter Yearly Y E A R - E N D R E P O R T JANUARY - DECEMBER
 hms networks Y E A R - E N D R E P O R T 2 0 1 6 JANUARY - DECEMBER Yearly Net sales for the full year increased by 36 % reaching SEK 952 m (702), corresponding to a 34 % increase in local currencies.
Q3 Report Q3 report
 Q3 Report 2013 2013-10-25 1 Highlights Q3 Quiet but stable business period Improved profit Strong development in International and Finland Mixed market signals High potential in new contracts in public
Interim report January June 2018
 Interim report January June 2018 PERIOD APRIL 1 JUNE 30, 2018 Net sales increased by 3 % to SEK 100.0 m (SEK 97.1 m) Software revenues increased by 6 % to SEK 66.1 m (SEK 62.3 m) Recurring revenue amounted
INTERIM REPORT for the period SIGNIFICANT BUSINESS EVENTS JANUARY-SEPTEMBER Sales increased by 15.6 % to MSEK (MSEK 470.
 JANUARY-SEPTEMBER SIGNIFICANT BUSINESS EVENTS Sales increased by 15.6 % to MSEK 544.1 (MSEK 470.5) EBITDA increased to MSEK 55.1 (MSEK 50.4) Profit before tax increased by 15.0 % to MSEK 49.7 (MSEK 43.2)
Makes it easier to be professional. Q report presentation July 19, 2018
 Makes it easier to be professional Q2 218 report presentation July 19, 218 1 Q2: High demand, successful initiatives and strong results Strong organic growth at 8% EBITA margin 8.4% (8.2) Sales up by 18%
CBTT A TECHNICAL TRADE COMPANY
 CBTT A TECHNICAL TRADE COMPANY AGENDA This is Christian Berner Tech Trade Our markets Our business areas How we create value for our customers Strategically important initiatives Financial information
Interim report January - June 2015
 Interim report January - June 2015 PERIOD APRIL 1 JUNE 30, 2015 Net sales SEK 95.8 m (SEK 84.2 m) System revenue SEK 61.9 m (SEK 54.7 m) EBITDA SEK 18.7 m (SEK 16.6 m) EBITDA margin 19.5 % (19.7 %) EBIT
Half year financial report. January June 2017
 Half year financial report January June 2017 Key figures 4-6/2017 4-6/2016 Change% 1-6/2017 1-6/2016 Change% 1-12/2016 Revenue, MEUR 196.0 192.4 1.9% 352.6 350.6 0.6% 775.8 Like-for-like revenue development,
Earnings remain strong with solid return on capital
 Nolato AB nine-month interim report 213, page 1 of 15 Nolato AB (publ) nine-month interim report 213 Earnings remain strong with solid return on capital Third quarter of 213 in brief Sales rose by 12%
PRESS RELEASE Observer AB is quoted on the Attract 40 section of Stockholmsbörsen s O-list and has approximately 25,000 shareholders.
 PRESS RELEASE Observer AB is quoted on the Attract 40 section of Stockholmsbörsen s O-list and has approximately 25,000 shareholders. Stockholm, August 5, 2004 Observer AB (publ) Interim report January
Strong quarter with good margins
 [Skriv här] Boule Diagnostics AB (publ) Interim report January September 2017 Strong quarter with good margins Quarter July September 2017 Net sales amounted to SEK 109.7 million (108.5), up 1.1 percent.
Strong quarter for the Nolato Group
 Nolato AB (publ) nine-month interim report 2007 Strong quarter for the Nolato Group Third quarter 2007 in brief Strong margin for Nolato Telecom and continued growth in sales for Nolato Medical Sales totaled
Boule Diagnostics AB (publ) Year-end report 2017
 Year-end report 2017") [Skriv här] Boule Diagnostics AB (publ) Year-end report 2017 Continued growth, increased profitability and strong cash flow Quarter October December 2017 Net sales amounted to SEK 107.2 million (104.6),
[Skriv här] Boule Diagnostics AB (publ) Year-end report 2017 Continued growth, increased profitability and strong cash flow Quarter October December 2017 Net sales amounted to SEK 107.2 million (104.6),
NOBINA AB Investor presentation, Interim report March 2018 May 2018
 1 NOBINA AB Investor presentation, Interim report March 2018 May 2018 FINANCIAL OVERVIEW ¹ NET SALES EBIT EBT CASH FLOW 2,361 (2,205) 104 (95) 72 (58) -74 (-60) FINANCIAL HIGHLIGHTS Net sales grew 7.1%
Statement by Carl-Magnus Månsson, CEO
 Price-sensitive information that has to be reported to the Financial Supervisory Authority INTERIM REPORT SECOND QUARTER APRIL 1 JUNE 30, 2015 Net sales of SEK 566 m (388) Operating profit SEK 38 m (6)
Positive development for all business areas
 Nolato AB three-month interim report 2012, page 1 of 14 Nolato AB (publ) three-month interim report 2012 Positive development for all business areas First quarter of 2012 in brief Sales increased by 10%
Interim Report. January September High sales growth continues with strengthened order book. July September January September 2015
 Q3 Interim Report January September Doro AB Corporate Identity Number 556161-9429 34.5% Net sales growth 6.7% EBIT margin High sales growth continues with strengthened order book July September Net sales
Interim Report for Duni AB (publ) 1 January 31 December 2010 (compared with the same period of the previous year)
 1 January 31 December 2010 (compared with the same period of the previous year)") Interim Report for Duni AB (publ) 1 January 31 (compared with the same period of the previous year) 16 February 2011 Improved operating margin of 14.8% for the quarter 1 January 31 Net sales amounted to
Interim Report for Duni AB (publ) 1 January 31 (compared with the same period of the previous year) 16 February 2011 Improved operating margin of 14.8% for the quarter 1 January 31 Net sales amounted to
Interim report. January September 2017
 Q3 Interim report. January September 2017 During the third quarter, Volati took a substantial growth leap with Akademibokhandeln as a new business area in the group. After the end of the period, we completed
Q1 Q Q3 Q EUR million Jan-Mar 2018 Jan-Mar 2017 Change, % EUR million Jan-Dec 2017
 Stockholm, Sweden, 4 May Eltel Group Interim report January March January March Group net sales decreased 10.5% to EUR 266.6 million (297.8), mainly as a result of divestments and on-going discontinuation
Strong organic growth
 lindab interim report Jan - March Strong organic growth First quarter Net sales increased by 32% to SEK 1,972 M (1,494) The operating profit (EBITA) increased by 121% to SEK 188 M (85) The operating margin
hms networks First quarter Last twelve months INTERIM REPORT 2017 JANUARY - MARCH
 hms networks INTERIM REPORT JANUARY - MARCH Last twelve months Net sales for the last twelve months amounted to SEK 1 030 m (732) corresponding to a 37 % increase in local currencies. The revaluation of
IAR SYSTEMS GROUP AB YEAR-END REPORT 2017
 IAR SYSTEMS GROUP AB YEAR-END REPORT 2017 Q4 NEW ALLIANCES AND STRONG FINANCIAL POSITION NET SALES FOR THE YEAR OF SEK 345M AND EBITDA OF SEK 127M OPERATING MARGIN OF 31% AND CASH FLOW OF SEK 124M PROFIT
CONSOLIDATED FINANCIAL STATEMENT YEAR ENDED DECEMBER
 CONSOLIDATED FINANCIAL STATEMENT YEAR ENDED DECEMBER 31 2016 BOURBONOFFSHORE.COM SUMMARY 1. Financial position statement...3 2. Statement of comprehensive income... 4 3. Statement of consolidated cash-flows...
MQ Holding AB - Interim Report
 MQ Holding AB - Interim Report MQ continues to capture market shares Second quarter (December 2011 - February 2012) Net sales amounted to SEK 422 million (414), up 1.9 percent. Sales in comparable stores
interim report iii, 2006/2007
 #3 interim report iii, 2006/2007 Interim period: 1st September 2006 31st May 2007 (9 months) Current reporting period: 1st March 2007 31st May 2007 (3 months) Svolder is a dedicated investment trust that
FULL YEAR REPORT. New phase of growth begins with increased sales and continued strong order bookings JANUARY DECEMBER 2017
 JANUARY DECEMBER 2017 FULL YEAR REPORT New phase of growth begins with increased sales and continued strong order bookings fourth quarter Net sales reached SEK 740 million (674), an increase of 9.8% on
Interim fourth quarter and Year-End Report 2017
 Ahlsell's Year-End Report January December 2017 Interim fourth quarter and Year-End Report 2017 Press release 26 January 2018 Fourth quarter 2017 Net sales increased by 10 percent to SEK 7,606 (6,902)
Half-year report January-June 2018 Published on July 18, 2018
 Half-year report January-June 2018 Published on July 18, 2018 Second quarter 2018 Increased sales and higher result Sales increased 7 per cent to 3,461 MSEK (3,230). Operating profit increased 9 per cent
Q1 INTERIM REPORT JANUARY - MARCH 2016
 Q1 INTERIM REPORT JANUARY - MARCH 2016 In the first quarter, Byggmax increased net sales by +30% and new financial targets have been set January 1 - March 31 Net sales amounted to SEK 737.9 M (570.0) up
Year-End Report 1 January 30 December 2017
 YEAR-END REPORT 1 JANUARY 30 DECEMBER 1 THIS IS A TRANSLATION OF THE SWEDISH ORIGINAL OF ADDNODE GROUP S YEAR-END REPORT FOR Year-End Report 1 January 30 December FOURTH QUARTER SUMMARY, OCTOBER DECEMBER
Interim Report. 1 January 30 September 2017
 Interim Report Hoist Group Holding Intressenter AB, 559094-0689, Parent Company for Hoist Group. Hoist Group is the complete hospitality partner for hotels, healthcare institutions and public operations.
Interim report January-March 2018 Published on April 24, 2018
 Interim report January-March 2018 Published on April 24, 2018 First quarter 2018 Increased sales and higher result Sales increased 5 per cent to 3,309 MSEK (3,138). Operating profit increased to 540 MSEK
Interim Report January March 2018
 Interim Report January March 2018 Loomis Interim Report January March 2018 2 January March 2018 Revenue SEK 4,486 million (4,279). Real growth 8 percent (3) and organic growth 3 percent (3). Operating
Statement by Carl-Magnus Månsson, CEO
 Price-sensitive information that has to be reported to the Financial Supervisory Authority YEAR-END REPORT FOURTH QUARTER OCTOBER 1 DECEMBER 31, 2014 Net sales of SEK 620 m (405) Operating profit before
E 2015E
 IAR Systems Group AB Q2 Upside earnings surprise Analyst: Johan Broström +46 70 428 31 74 Date: 22 August 2014 Margins for IAR Systems were an upside surprise in Q2, pushing operating profit to SEK 12.7
January September 2017 Net sales increased by 33.7 percent to SEK 2,178 (1,629) million. Organic growth was 1.5 percent.
 million. Organic growth was 1.5 percent.") Instalco Interim report January September Stable growth and favourable profitability July September Net sales increased by 27.3 percent to SEK 708 (556) million. Organic growth was 0.2 percent. Adjusted
Instalco Interim report January September Stable growth and favourable profitability July September Net sales increased by 27.3 percent to SEK 708 (556) million. Organic growth was 0.2 percent. Adjusted
MQ Holding AB - Interim report
 MQ Holding AB - Interim report INTERIM REPORT SEPTEMBER 2012 FEBRUARY 2013 Focus on gross margin, cash flow and product portfolio Second quarter (December 2012-February 2013) Net sales amounted to SEK
Interim report JANUARY JUNE 2015
 Interim report JANUARY JUNE 215 In light of the ongoing business transformation, I am satisfied with our overall second quarter performance, with organic growth of 1. per cent. This means that we have
TELE2 AB ANNOUNCES STRONG GROUP CUSTOMER INTAKE, AND CONTINUED SIGNIFICANT IMPROVEMENT IN EBITDA MARGINS
 FOR IMMEDIATE RELEASE Monday, August 6, 2001 TELE2 AB ANNOUNCES STRONG GROUP CUSTOMER INTAKE, AND CONTINUED SIGNIFICANT IMPROVEMENT IN EBITDA MARGINS 63% Annualized increase in Pro forma Operating Revenue
Media and Financial Analysts Meeting 2018 Carlo Gavazzi Holding AG
 Media and Financial Analysts Meeting 2018 Carlo Gavazzi Holding AG Media and Financial Analysts Meeting 2018 June 28, 2018 Media and Financial Analysts Meeting 2018 AGENDA FOR TODAY WELCOME & OVERVIEW
Interim report January September 2017
 Capio AB (publ) Interim report January September 2017 July September 2017 Net sales MSEK 3,455 (3,168). Organic sales growth 2.2% (2.6) and total sales growth 9.1% (3.7) EBITDA 1 MSEK 168 (200) and margin
Jan-March Jan-March 12-months rolling. Jan-Dec SEK m
 Instalco Interim report January - March Continued healthy growth and good profitability January March Net sales increased by SEK 45.2 million to SEK 689 (474) million. Organic growth was 9.3 percent. Adjusted
Strong EBITDA growth, expansion in Latin America and new add-on acquisitions during 2016
 Opus Group AB (publ) Year-end report 2016 Strong EBITDA growth, expansion in Latin America and new add-on acquisitions during 2016 January December 2016 Net sales amounted to SEK 1,697.2 million (1,650.2),
Vattenfall Capital Markets Day 2006
 Vattenfall Capital Markets Day 2006 Financial Review Presentation by Matts Ekman CFO Gothenburg, 9 August 2006 Content 2 1. Q2 results 2006 & Gap analysis 2. Regulated vs competitive business 3. Capital
INTERIM REPORT JANUARY JUNE 2018 APRIL JUNE 2018 SIGNIFICANT EVENTS. Net sales distribution January-June 2018 (2017) Quarterly net sales
 Quarterly net sales") INTERIM REPORT JANUARY JUNE 2018 Net sales amounted to SEK 184.2 (159.8) million EBITDA was SEK 13.7 (1.2) million Basic earnings per share were SEK -0.06 (-0.18) APRIL JUNE 2018 Net sales amounted to
INTERIM REPORT JANUARY JUNE 2018 Net sales amounted to SEK 184.2 (159.8) million EBITDA was SEK 13.7 (1.2) million Basic earnings per share were SEK -0.06 (-0.18) APRIL JUNE 2018 Net sales amounted to
Q Q1 IN BRIEF Jan - Mar Jan - Mar Jan - Dec
 Q1 2016 Q1 IN BRIEF Jan - Mar Jan - Mar Jan - Dec Net sales, MSEK 1,390 1,397 6,052 EBITDA excl. non-recurring items, MSEK 87 62 505 Operating profit (EBIT) excl. non-recurring items, MSEK 58 38 397 Operating
Full year report January December 2017
 Full year report January December 2017 Telephone conference February 7, 2018 Thomas Berglund, CEO Olof Bengtsson, CFO Solid Q4 now speeding up the journey of specialization and digitalization Highlights
Hexatronic Group AB (publ) Interim Report April-June 2017
 Interim Report April-June 2017") Hexatronic Group AB (publ) Interim Report April-June 2017 (Reporting period January-June 2017) The quarter (April-June 2017) Net sales amounted to MSEK 346.2 (274.9), which equates to 26% growth during
Hexatronic Group AB (publ) Interim Report April-June 2017 (Reporting period January-June 2017) The quarter (April-June 2017) Net sales amounted to MSEK 346.2 (274.9), which equates to 26% growth during
CONSOLIDATED FINANCIAL STATEMENT YEAR ENDED DECEMBER
 CONSOLIDATED FINANCIAL STATEMENT YEAR ENDED DECEMBER 31 2017 BOURBONOFFSHORE.COM SUMMARY 1. Financial position statement...3 2. Statement of comprehensive income... 4 3. Statement of consolidated cash-flows...
Interim Report. 1 January 31 March 2018
 Interim Report Hoist Group Holding Intressenter AB, 559094-0689, Parent Company for Hoist Group. Hoist Group is the complete hospitality partner for hotels and public operations. With more than 20 years
Strong sales and profit trend
 Nolato AB nine-month interim report 2012, page 1 of 14 Nolato AB (publ) nine-month interim report 2012 Strong sales and profit trend Third quarter of 2012 in brief Sales increased 39% to SEK 999 million
Interim report for the third quarter, 2005
 int e r i m re p o r t 2 5 Interim report for the third quarter, 25 THE LINDAB GROUP REVENUES DURING THE QUARTER INCREASED BY 13 PERCENT OPERATING PROFIT (EBITA), EXCLUDING ONE-TIME ITEMS INCREASED BY
Q3 Report October 25, 2017
 Q3 Report 2017 October 25, 2017 CEO s comments A weak operating profit, 49 MSEK (91). Different trends across the business. Organic sales growth: APAC +9% EMEA -5% Americas +/- 0 Overall the sales contracted
Betsson AB (publ) interim report, 1 January-31 March Continued strong growth in Casino EBIT amounted to SEK 241 million. Earnings per share
 interim report, 1 January-31 March Continued strong growth in Casino EBIT amounted to SEK 241 million. Earnings per share") JANUARY-MARCH Betsson AB (publ) interim report, 1 January-31 March 2017 Continued strong growth in Casino EBIT amounted to SEK 241 million QUARTER Revenue increased by 10.2 percent to SEK 1,102 million.
JANUARY-MARCH Betsson AB (publ) interim report, 1 January-31 March 2017 Continued strong growth in Casino EBIT amounted to SEK 241 million QUARTER Revenue increased by 10.2 percent to SEK 1,102 million.
Year end report. January-December st of January 2018 Mikael Ericson, President and CEO Erik Forsberg, CFO
 Year end report January-December 2017 31 st of January 2018 Mikael Ericson, President and CEO Erik Forsberg, CFO Agenda 1. Highlights for the fourth quarter and FY 2017 2. Key messages from Capital Markets
Interim Report January March 2017
 ALIG, SE715891 Interim Report January March 217 For more information contact: Per Ekstedt, CFO, Phone: +46 ()8 42 14 57 / Sofia Wretman, Head of IR, Phone: +46 ()8 42 14 41 217 - Solid performance FIRST
INTERIM REPORT January-September 2016
 INTERIM REPORT January-September 2016 THE PERIOD IN BRIEF THE PERIOD JANUARY-SEPTEMBER 2016 COMPARED WITH JANUARY-SEPTEMBER 2015 Total operating income increased by 11.8 % to SEK 322.9 million The loan
Interim report January-September 2017 Published on October 26, 2017
 Interim report January-September 2017 Published on October 26, 2017 Third quarter 2017 Increased sales and strong result Sales increased 7 per cent to 2,936 MSEK (2,742). Operating profit amounted to 470
Strong earnings and high margin
 Nolato AB nine-month interim report 214, page 1 of 15 Nolato AB (publ) nine-month interim report 214 Strong earnings and high margin Third quarter of 214 in brief Sales stood at SEK 1,95 million (1,119)
Nobina AB Group. Investor presentation Q2 Jun Aug 2010/2011
 Nobina AB Group Investor presentation Q2 Jun Aug 2010/2011 This presentation includes statements regarding current expectations going forward, but subject to risks and uncertainties. Examples of risks