Welcome to Kungsleden. First Quarter 2011
|
|
|
- Sabina Atkinson
- 5 years ago
- Views:
Transcription


1 Welcome to Kungsleden First Quarter 2011
2 Kungsleden in brief Owns and manages properties generating high and stable long-term returns Returns more important than property type and location Returns cannot be judged without considering risk levels 629 properties, of which 298 are part-owned via Hemsö, reported at SEK 25.5 (21.5) bn as of 31 March 2011 Commercial properties 52% (45) Public properties 42% (48) Modular buildings 6% (7) 22,400 shareholders. 36% of shares held by private individuals and approximately one-third by foreign shareholders. Ten largest shareholders control 19.4% of capital and votes

3 Profit for calculating dividends SEK m Gross profit Sales and administration costs Net financial position Sub-total Realised items Trading net on sale 3 3 Realised value changes, properties 0 25 Realised value changes, financial instruments -9 - Sub-total Taxes payable Profit for calculating dividends
4 First quarter in brief Net sales increase by 5% to SEK 601 m. Gross profit in line with the previous year after a severe winter. Positive value change on properties and financial instruments of SEK 455 m. Profit after tax increases to SEK 406 (58) m. A strong quarter for transactions. Kungsleden purchased 38 properties for approximately SEK 3.8 bn at a property yield of 9.9%. 36 of these properties were purchased from Nordic & Russia Properties, with completion on 31 March Kungsleden was recognised as Sweden s third-best workplace and the best property company in the Great Place to Work survey.

5 Current market conditions Kungsleden s lettings market Increasing new lettings Vacancy levels stabilising, likely to reduce Slight increase in rent levels with existing tenants Financial market Continued strong capital flows to the property sector New foreign mutual funds investing in properties Bank deal appetites increasing Transaction market Extremely strong fourth quarter 2011, good start to 2011 High competition over properties

6 Property portfolio


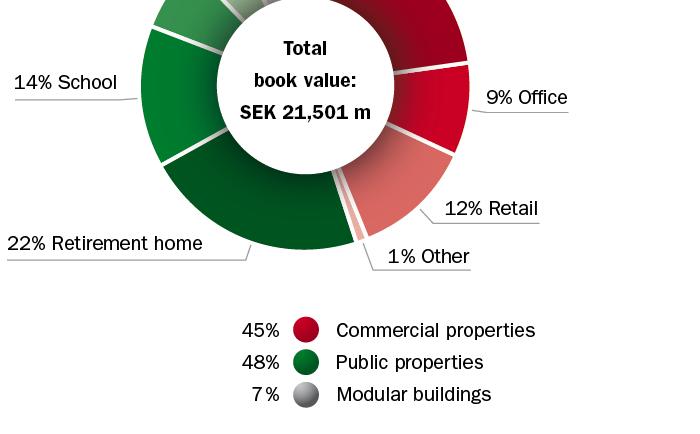
7 Our properties by type

8 Kungsleden 2011 Q1 in figures
9 Income Statement SEK m Jan- Mar Rental revenues Sales revenues, modular buildings Net sales Gross profit Trading net 3 3 Sales and administration costs Net financial position Unrealised value changes Profit before tax Tax Profit after tax for the period

10 Income Statement SEK m Jan- Mar Rental revenues Sales revenues, modular buildings Rental revenue comparable to previous year. Net sales Gross profit Trading net 3 3 Sales and administration costs Net financial position Unrealised value changes Profit before tax Tax Profit after tax for the period

11 Income Statement SEK m Rental revenues Sales revenues, modular buildings Net sales Sales revenues double thanks to greater interest in modules Gross profit Trading net 3 3 Sales and administration costs Net financial position Unrealised value changes Profit before tax Tax Profit after tax for the period

12 Income Statement SEK m Rental revenues Sales revenues, modular buildings Net sales Gross profit Gross profit comparable to previous year after another severe winter. Trading net 3 3 Sales and administration costs Net financial position Unrealised value changes Profit before tax Tax Profit after tax for the period

13 Income Statement SEK m Rental revenues Sales revenues, modular buildings Few sales in the period. Net sales Gross profit Trading net 3 3 Sales and administration costs Net financial position Unrealised value changes Profit before tax Tax Profit after tax for the period

14 Income Statement SEK m Rental revenues Sales revenues, modular buildings Net sales Higher administration costs mainly because of the split of Kungsleden and Hemsö into two separate organisations. Gross profit Trading net 3 3 Sales and administration costs Net financial position Unrealised value changes Profit before tax Tax Profit after tax for the period

15 Income Statement SEK m Rental revenues Sales revenues, modular buildings Net sales Gross profit Trading net 3 3 Sales and administration costs Negative change primarily explained by newly arranged bond loans with higher interest margins than bank loans and slightly higher loan volume. Net financial position Unrealised value changes Profit before tax Tax Profit after tax for the period

16 Income Statement SEK m Rental revenues Sales revenues, modular buildings Net sales Gross profit Trading net 3 3 Sales and administration costs Net financial position Unrealised value changes Positive value change mainly on public properties corresponding to 1% of book value. Positive value change on financial instruments resulting from rising long yields. Profit before tax Tax Profit after tax for the period

17 Income Statement SEK m Rental revenues Sales revenues, modular buildings Corresponds to 26.3% of profit before tax. Net sales Gross profit Trading net 3 3 Sales and administration costs Net financial position Unrealised value changes Profit before tax Tax Profit after tax for the period


18 Income Statement SEK m Rental revenues Sales revenues, modular buildings Net sales Gross profit The higher figure is mainly due to unrealised value changes on properties and financial instruments. Trading net 3 3 Sales and administration costs Net financial position Unrealised value changes Profit before tax Tax Profit after tax for the period
19 Statement of Financial Position SEK m Assets 31 Mar 31 Dec Goodwill Properties 25,540 21,501 Receivables, etc. 1,762 2,045 Cash and cash equivalents 1, Total assets 28,825 24,494 Equity and liabilities Equity 7,765 7,357 Interest-bearing liabilities 17,826 13,949 Non-interest-bearing liabilities 3,234 3,188 Total equity and liabilities 28,825 24,494
20 Maturity structure, interest fixings As of 31 March 2011 Loan, SEK m Interest derivatives, SEK m Ave. interest, % , , , , , , Average fixed interest term, years Total derivatives 14, Total loans 17, Market value of loans and derivatives 438 Total 18,291
21 Maturity structure, credits (including un-utilised credit facilities) As of 31 March 2011 Utilised credits, SEK m Un-utilised credits, SEK m Total credits, SEK m , , ,286 3,000 11, , , , , , , Total 17,853 3,454 21,307 Average conversion term, years Equity ratio 31 Dec 10 27% 30 Jun 10 30% 31 Dec 09 30% Mortgage ratio
22 Underlying profits, Q1
23 The share to the end of April
24 Total yield to first quarter 2011
 1.7 Norwegian Government 1.7 AP4 1.5 SEB Fonder 1.5 Swedbank Robur Fonder 1.3 Black Rock fonder (USA) 1.3 19.")
25 Ten largest shareholders (% of votes & capital) Nordea fonder 3.3 Länsförsäkringar fonder 2.9 Olle Florén and companies 2.3 SHB fonder 1.9 Pensioenfonds PGGM (NL) 1.7 Norwegian Government 1.7 AP4 1.5 SEB Fonder 1.5 Swedbank Robur Fonder 1.3 Black Rock fonder (USA) Source: SIS Ägarservice
26 Outlook for 2011 A strong Swedish economy paves the way for favourable years for property Focus on customer care, cash flow and enhancing the portfolio Broadening the base of alternative funding sources Kungsleden active on the transaction market and increased property portfolio Continued measures to reduce vacancy levels in a cluster of large properties Increasing rent levels High employee commitment creates good prospects Kungsleden at a new address
27 Any questions?


28 Any questions?
Welcome to Kungsleden
 Welcome to Kungsleden Chief Executive Thomas Erséus Deputy Chief Executive Johan Risberg 17 February 2011 Kungsleden in brief Owns and manages properties generating high and stable long-term returns Returns
Welcome to Kungsleden. 2nd Quarter 2011
 Welcome to Kungsleden 2nd Quarter 2011 Kungsleden in brief Owns and manages properties generating high and stable long-term returns Returns more important than property type and location Returns can not
Welcome to Kungsleden First quarter Thomas Erséus, Chief Executive Johan Risberg, CFO
 Welcome to Kungsleden First quarter 2012 Thomas Erséus, Chief Executive Johan Risberg, CFO Owning and managing properties with satisfied customers Always open to new opportunities regardless of property
Kungsleden AB (publ) Chief Executive Thomas Erséus Deputy Chief Executive Johan Risberg 24 April 2009
 Chief Executive Thomas Erséus Deputy Chief Executive Johan Risberg 24 April 2009") Kungsleden AB (publ) Chief Executive Thomas Erséus Deputy Chief Executive Johan Risberg 24 April 2009 Kungsleden in brief Kungsleden owns and manages properties generating high and stable long-term returns
Kungsleden AB (publ) Chief Executive Thomas Erséus Deputy Chief Executive Johan Risberg 24 April 2009 Kungsleden in brief Kungsleden owns and manages properties generating high and stable long-term returns
Welcome to Kungsleden s Financial Statement and strategy presentation
 Welcome to Kungsleden s Financial Statement and strategy presentation 15 February 2013 Thomas Erséus, Chief Executive Anders Kvist, Deputy Chief Executive Today s agenda 1. The lettings and property market
Welcome to Kungsleden Q3 2013
 Welcome to Kungsleden Q3 2013 25 October, 2013 Biljana Pehrsson, CEO Anders Kvist, Deputy CEO and CFO 2013 Kungsleden Aktiebolag Agenda 1. Q3 2013 results 2. Kungsleden's new strategy and targets 3. Portfolio
Welcome to Kungsleden! First quarter April 26th, 2013 Anders Kvist, interim Chief Executive and CFO
 Welcome to Kungsleden! First quarter 2013 April 26th, 2013 Anders Kvist, interim Chief Executive and CFO The quarter in brief Net sales decreased by 12 per cent to SEK 487 m chiefly due to a smaller property
KUNGSLEDEN. THIRD QUARTER EARNINGS AND INTERIM REPORT 24 October Biljana Pehrsson, CEO Anders Kvist, Deputy CEO and CFO
 KUNGSLEDEN THIRD QUARTER EARNINGS AND INTERIM REPORT 24 October 2014 Biljana Pehrsson, CEO Anders Kvist, Deputy CEO and CFO 1 Third quarter and interim period in summary Financial performance and key figures
Svenska Handelsbanken Second quarter 2002
 Svenska Handelsbanken Second quarter 2002 20 August 2002 Profit and loss account, January - June Handelsbanken Group Q2 Q2 Change SEKm 2002 2001 % Net interest income 7 025 6 464 9 Commission, net 2 549
SPP - Additional information. November 2005
 SPP - Additional information November 2005 SPP Overview 30 September 2005 Assets under management: SEK 83bn Premium income, Jan-Sep 2005: SEK 3.3bn Duration, commitments to policyholders: 17 years Policies:
Svenska Handelsbanken Third quarter 2002
 Svenska Handelsbanken Third quarter 2002 22 October 2002 Profit and loss account, January - September Handelsbanken Group Change SEKm 2002 2001 % Net interest income 10 611 9 856 8 Commission, net 3 782
Interim report January September. October
 Interim report January September October 29 2008 July September 2008 Highlights Norway is on rolling 12 months larger on online than on offline with continued high margins Operating revenues in Q3 amounted
Interim Report January March
 l 2012 Interim Report January March Profit from property management increased to SEK 125m (113), and rental income increased to SEK 453m (446). The year-on-year change was due to growth through positive
INTERIM REPORT, JANUARY MARCH 2008
 INTERIM REPORT, JANUARY MARCH 2008 Huddinge Myren 3 Catena shall own, effectively manage and actively develop commercial real estate in prime locations that offer the potential to generate steadily growing
Facts. Q3, 2007 October 24, 2007
 Facts October 24, 27 24 October, 27 Contents page General information 2 Mission, vision, values and markets 2 Financial objectives 3 Geographic reach and market shares 4 Macro economic indicators 5-6 Business
Fact book Q April 2007
 Fact book Q1 27 25 April 27 Contents page General information 2 Mission, vision, values and markets 2 Financial objectives 3 Geographic reach and market shares 4 Macro economic indicators 5-6 Business
Full-year report 2015 February Biljana Pehrsson, CEO Anders Kvist, Deputy CEO and CFO
 Full-year report 2015 February 2016 Biljana Pehrsson, CEO Anders Kvist, Deputy CEO and CFO AGENDA FOURTH QUARTER AND FULL YEAR IN SUMMARY FINANCIAL DEVELOPMENT AND KEY FIGURES BUSINESS PLAN 2020 WITH GROWTH
WELCOME TO FABEGE 20 SEPTEMBER 2018
 WELCOME TO FABEGE 20 SEPTEMBER 2018 Hammarby Sjöstad Solna Business Park Arenastaden Stockholms inner city Fabege owns and manages every ten square meters of office space in Greater Stockholm. FABEGE DEVELOPS
Annika Falkengren. Merrill Lynch Banking & Insurance CEO Conference. London. 30 September President and CEO
 Annika Falkengren President and CEO Merrill Lynch Banking & Insurance CEO Conference London 3 September 29 1 The starting point: SEB has a strong competitive position A long-term relationship bank Strong
Interim Report January March
 20 10 Interim Report January March Handelsbanken s Interim Report January - March Summary January March, compared with January March Profit after tax for total operations went up by 3 percent to SEK 2,853
New records set for fund savings in 2017
 Statistical release STOCKHOLM 218-1-18 New records set for fund savings in 217 In 217, a net total of SEK 112 billion was saved in investment funds. Together with an increase in value of nearly SEK 34
2012 Year-end Report. Key figures, SEKm 2012
 Year-end Report Rental income increased to SEK 1,869m (1,804). The year-on-year change was due to growth through positive net lettings and completed projects. Realised and unrealised value changes amounted
Annika Falkengren. President & CEO. Results 2009
 Annika Falkengren President & CEO Results 29 1 Highlights Q1 29 Strong underlying business SEK 4.8bn before provisions for credit losses and impairment charges Stable cost development Doubled collective
Significant events after the end of the period
 Q1 Interim Report January-March 216 Rental income rose by 54 percent to SEK 176.8 million (114.6). The operating surplus rose by 48 percent to SEK 126.6 million (85.8). Profit from property management
Danske Nordic Bank Seminar
 Jan Erik Back CFO Danske Nordic Bank Seminar Copenhagen 2 September 2009 1 SEB s competitive position A long-term relationship bank Strong income and balance sheet Q2-recap, liquidity and capital Asset
Welcome to Fabege s year-end report Jan-Dec Christian Hermelin, CEO & President Fabege Åsa Bergström, Vice President & CFO Fabege
 Welcome to Fabege s year-end report Jan-Dec 2016 Christian Hermelin, CEO & President Fabege Åsa Bergström, Vice President & CFO Fabege EARNINGS 2016-2012 SEKm 2016 2015 2014 2013 2012 Property Management
Press Conference Q2-17. Johan Torgeby President & CEO 14 July, 2017
 Press Conference Q2-17 Johan Torgeby President & CEO 14 July, 2017 Strong equity markets and improved market sentiment combined with low volatility and tightening of credit spreads CDS Spreads Swedish
The Mortgage Market in Sweden
 September 2018 The Mortgage Market in Sweden Contents Introduction 3 1. The economic situation in Sweden 4 2. The housing and construction market 4 3. Competition on the mortgage market 8 4. Residential
INTERIM REPORT JANUARY-MARCH 2011
 INTERIM REPORT JANUARY-MARCH 2011 SoliQ, a unique service concept for the Global Produce Supply Chain Billerud s subsidiary, Billerud Fresh Services, is now launching SoliQ, an optimised corrugated packaging
EBITDA for the period, adjusted for currency effects, was SEK 2.8 (-10.0) million.
 million.") INTERIM REPORT JANUARY MARCH 2015 Net sales were SEK 70.8 (44.5) million. EBITDA for the period, adjusted for currency effects, was SEK 2.8 (-10.0) million. Basic earnings per share amounted to SEK -0.06
INTERIM REPORT JANUARY MARCH 2015 Net sales were SEK 70.8 (44.5) million. EBITDA for the period, adjusted for currency effects, was SEK 2.8 (-10.0) million. Basic earnings per share amounted to SEK -0.06
Investor presentation. Results 2009
 Investor presentation Results 2009 1 Highlights 2009 Strong underlying business SEK 4.8bn before provisions for credit losses and impairment charges Stable cost development Doubled collective provisions
Interim report January June 2017
 Interim report January June 2017 Second quarter 2017 Net sales increased by 5 per cent in the second quarter, to SEK 1,900 (1,808) million. Organic growth excluding foreign exchange effects was 3 per cent.
Income statement - SEB Group
 Income statement - SEB Group Previously reported Change Restated Jan-Dec Jan-Dec Jan-Dec Jan-Dec Jan-Dec Jan-Dec SEK m 2014 2015 2014 2015 2014 2015 Net interest income 19,943 18,938 19,943 18,938 Net
Interim Report January - June
 20 09 Interim Report January - June Handelsbanken s Interim Report January - June Summary January june compared with January june Operating profit increased by 14% to SEK 7,251m (6,352) and the profit
Three Month Report We build for a better society. Slussen, Stockholm, Sweden
 Three Month Report We build for a better society. Slussen, Stockholm, Sweden Safety at Skanska May 5, Skanska Three Month Report 2 Skanska Safety Week May 5, Skanska Three Month Report 3 Three Month Report
Interim report January June 2018
 Interim report January June 2018 Second quarter 2018 First half 2018 Net sales increased by 25 per cent in the second quarter, to SEK 2,380 (1,900) million. Organic growth was 11 per cent and growth from
Summary, SEKm Oct-Dec Oct-Dec Jan-Dec Jan-Dec
 Q4 2016 Summary, SEKm 2016 2015 2016 2015 Oct-Dec Oct-Dec Jan-Dec Jan-Dec Rental income 532 505 2,105 1,998 N et operating income 382 349 1,507 1,429 Profit from property management -166 172 471 688 Profit
Interim Report JANUARY MARCH 2007
 Interim Report JANUARY MARCH 2007 The property market in St Petersburg has been characterized by continuing stepped-up activity from several players during the first quarter 2007, both within property
Project development of JM
 Project development of JM Acquisition Management Occupancy Construction Conception planning Pre-construction Financing Sale/lease 3 2018-08-13 ytf Financial targets Targets 2017 2016 2015 2014 Operating
Handelsbanken January - June July 2010
 Handelsbanken January - June 21 2 July 21 Accumulated dividends since 26 SEK Adjusted equity per share 2 175 15 125 1 75 5 2 Kv2 6 Kv3 6 Kv4 6 Kv1 7 Kv2 7 Kv3 7 Kv4 7 Kv1 8 Kv2 8 Kv3 8 Kv4 8 Kv1 9 Kv2
KUNGSLEDEN. FIRST QUARTER REPORT April Biljana Pehrsson, CEO Anders Kvist, Deputy CEO and CFO
 KUNGSLEDEN FIRST QUARTER REPORT 2015 23 April 2015 Biljana Pehrsson, CEO Anders Kvist, Deputy CEO and CFO AGENDA First quarter in summary Financial performance and key figures Business plan with growth
Facts. Q2, 2010 July 22, 2010
 Facts Q2, 21 July 22, 21 Q2, 21 22 July 21 Contents page General information 2 Geographic reach 2 Macro economic indicators 3-4 Business volumes 5 Business volumes 5 Lending 6-7 Savings and investments
By sector 12 Credit risk exposure 13 By country, end of period 14 o Savings and deposits. Capital base and capital requirement 17
 Fact book HANDELSBANKEN - FACT BOOK Contents This is Handelsbanken 3 Income statement o Income statement Handelsbanken Group 4 o EPS 4 o Key figures 5 o Consolidated statement of comprehensive income 5
Facts. Q1, April 2010
 Facts 27 April 21 27 April 21 Contents page General information 2 Geographic reach 2 Macro economic indicators 3-4 Business volumes 5 Business volumes 5 Lending 6-7 Savings and investments 8 Other products
FöreningsSparbanken. Nils-Fredrik Nyblæus. Deputy President and CFO
 FöreningsSparbanken Nils-Fredrik Nyblæus Deputy President and CFO 2 Group objectives Market position Customers Employees Financial position 3 Basics of sustainable profitability Customer satisfaction Human
Six Month Report We build for a better society. Linnaeus University, Kalmar, Sweden
 Six Month Report We build for a better society. Linnaeus University, Kalmar, Sweden Six Month Report Operating income SEK 3.3 bn (3.6) Write downs in U.S. civil and UK construction operations Strong performance
UBS Nordic Financial Services Conference Stockholm
 Annika Falkengren President and CEO UBS Nordic Financial Services Conference Stockholm 10 September 2009 1 The starting point: SEB has a strong competitive position A long-term relationship bank How we
Interim Report JANUARY - SEPTEMBER Operating profit rose by 9% to SEK 11.1bn (10.1) Profit after tax totalled SEK 8.0bn (7.
 Profit after tax totalled SEK 8.0bn (7.") Interim Report JANUARY - SEPTEMBER 2005 Operating profit rose by 9% to SEK 11.1bn (10.1) Profit after tax totalled SEK 8.0bn (7.3) Return on equity was 17.1% (16.6) Operating profit for the third quarter
Interim Report JANUARY - SEPTEMBER 2005 Operating profit rose by 9% to SEK 11.1bn (10.1) Profit after tax totalled SEK 8.0bn (7.3) Return on equity was 17.1% (16.6) Operating profit for the third quarter
K L Ö V E R N. Year end report 2005
 Year end report 2005 K L Ö V E R N Rental revenues amounted to SEK 639 million (485) Net profit for the year increased to SEK 379 million (213) Earnings per share increased to SEK 3.27 (2.30) The Board
Länsförsäkringar AB. Year-end report lansforsakringar.se FULL-YEAR 2014 COMPARED WITH FULL-YEAR 2013
 10 FEBRUARY 2015 Länsförsäkringar AB Year-end report FULL-YEAR COMPARED WITH FULL-YEAR The Group s operating profit amounted to SEK 1,469 M (923). The Group s operating income amounted to SEK 22,780 M
Fact Book January June 2013
 Fact Book January June STOCKHOLM 15 JULY SEB Fact Book January June 1 Table of contents About SEB... 4 Financial targets... 4 Rating... 4 Organisation...5 Full-time equivalents, end of quarter... 5 Corporate
Interim report Q April 25, 2007 Jan Lidén President and CEO
 Interim report Q1 2007 April 25, 2007 Jan Lidén President and CEO Highlights Q1 2007 Strong and stable results intact SEK 2,910m (2,270 Q1, 2006) Strong and stable results from all major business areas;
Annika Falkengren. President and CEO. Result presentation. January September 2010
 Annika Falkengren President and CEO Result presentation January September 2010 Highlights Income Seasonally slow quarter supported by diversified earnings Further improved asset quality Baltics back in
The Mortgage Market in Sweden
 The Mortgage Market in Sweden 217-9-25 September 217 Blasieholmsgatan 4B, Box 763 SE-13 94 Stockholm t: +46 ()8 453 44 info@swedishbankers.se www.swedishbankers.se Contact: Tel: E-mail: Christian Nilsson
Swedbank New York and Boston roadshow, September 24 26, Mikael Inglander, Chief Financial Officer
 Swedbank New York and Boston roadshow, September 24 26, 27 Mikael Inglander, Chief Financial Officer The leading bank in four small countries Sweden Total population: 9.m Private customers: 4.1m Corp.
Fact Book January September 2013
 Fact Book January September STOCKHOLM 24 OCTOBER SEB Fact Book January-September 1 Table of contents About SEB... 4 Financial targets... 4 Rating... 4 Organisation...5 Full-time equivalents, end of quarter...
KLÖVERN INTERIM REPORT JANUARY JUNE / 1
 INTERIM REP OR T JANUARY JUNE 20 0 9 Income increased to SEK 631 million (603) Profit from property management increased by 38 per cent to SEK 252 million (183), equivalent to SEK 1.57 per share (1.11)
Annika Falkengren CEO. UBS conference. May 14, 2007
 Annika Falkengren CEO UBS conference May 14, 2007 What we are How we differ Growth opportunities 2 SEB history Longstanding customer relationships Entrepreneurship International outlook Same major owners
Year-End Report 2006
 Year-End Report Profit for the year after tax amounted to SEK 3,423.2 million (1,333.9), equivalent to SEK 16.60 per share (6.47). The sale of the World Trade Center Stockholm, including management profits,
Q4, February 2007
 16 February 27 Contents page Mission, vision, values and markets 2 Financial objectives 3 Geographic reach and market shares 4 Macro economic indicators 5 Cross selling, Internet bank and cards 6 Lending
Nomura Financial Services Conference London, 29 August Jan Erik Back, CFO
 Nomura Financial Services Conference London, 29 August 2012 Jan Erik Back, CFO SEB s strategy remains firm Universal bank in Sweden and the Baltics Corporate bank in the Nordics, Germany and internationally
2014/ /2014 Change 2014/ /2014 Change
 16 April 2015 Second quarter (Dec Feb) Half year (Sept-Feb) Change Change Net sales, SEK million 1 133 1 114 19 2 307 2 357-50 Operating profit, SEK million 9 3 6 104 102 2 Gross margin % 57.8 57,7 0,1
Fact Book January June 2014
 Fact Book January June STOCKHOLM 14 JULY SEB Fact Book January June 1 Table of contents About SEB... 4 Financial targets... 4 Rating... 4 Organisation...5 Full-time equivalents, end of quarter... 5 Corporate
Interim Report January March 2017
 Interim Report January March 2017 First quarter 2017 Net sales increased by 4 per cent in the first quarter, to SEK 1,930 (1,859) million. Organic growth excluding foreign exchange effects was 1 per cent.
YEAR-END REPORT FEBRUARY 2017 BILJANA PEHRSSON CEO ANDERS KVIST DEPUTY CEO AND CFO
 YEAR-END REPORT 2016 16 FEBRUARY 2017 BILJANA PEHRSSON CEO ANDERS KVIST DEPUTY CEO AND CFO AGENDA Full year in summary Property portfolio Financial performance and key figures Proposed rights issue 2017
Interim report January March 2018
 Interim report January March 2018 First quarter 2018 Net sales increased by 15 per cent in the first quarter, to SEK 2,127 (1,857) million. Organic growth was 10 per cent, growth from acquisitions 4 per
Year-end Report January December 2018
 Year-end Report January December Increased number of sold and started units 1 OCTOBER 31 DECEMBER amounted to SEK 6,26 M (6,55) Operating profit was SEK 899 M (82), of which profit from sales of land totalled
FöreningsSparbanken Q Jan Lidén, CEO
 FöreningsSparbanken Q4 2005 Jan Lidén, CEO Highlights 2005 2 The market share for total new savings from Swedish households rose to 19 percent (17) For new household deposits, the Swedish market share
Interim Report January September
 DELÅRSRAPPORT JANUARI SEPTEMBER 20 10 Interim Report January September 1 Handelsbanken INTERIM REPORT JANUARY SEPTEMBER Handelsbanken s Interim Report January September Sammanfattning january september,
Interim report. Continued growth throughout the Nordic region and important contract extensions in place
 Interim report January September 2018 Third quarter of 2018 January September 2018 Net sales increased by 28 per cent in the third quarter, to SEK 2,369 (1,853) million. Organic growth was 10 per cent
Interim report 1 January 31 March 2017 Actic Group AB
 Q1 Interim report 1 January 31 March Actic Group AB Continued growth and strengthened position INTERIM REPORT 1 JANUARY 31 MARCH ACTIC GROUP AB 1 Interim report 1 January 31 March First quarter January
Strong online sales and improved margins
 FIRST QUARTER SEPTEMBER 1, 2016 NOVEMBER 30, 2016 Strong online sales and improved margins Interim Report September November 2016 First quarter Net sales for the quarter increased 7.5 per cent to SEK 2,284
STRONG RESULT IN A DEMANDING MARKET
 INTERIM REPORT january march 2013 STRONG RESULT IN A DEMANDING MARKET CEO Comment: Håkan Buskhe The year started strong with an increase in order bookings in all business areas and the order backlog grew
Q3 July September 2018
 Q3 July September 2018 16 November 2018 Q3 financial highlights Revenue Operating revenue increased 6.8% to SEK 1,677m (1,613) when excluding for the home care operations divested last year (when included
Svenska Handelsbanken
 25 August 1998 Press release Handelsbanken's interim report January June 1998 In the comparative figures for 1997, Stadshypotek is included in the Handelsbanken Group from 26 February 1997. Summary The
Interim Report January September 2017
 Interim Report January September 2017 Third quarter of 2017 Net sales increased by 7 per cent in the third quarter, to SEK 1,853 (1,740) million. Adjusted EBITA increased by 7 per cent to SEK 104 (97)
Årsredovisning YEAR-END REPORT JANUARY-DECEMBER Exclusive cooperation agreement with Chesapeake
 Årsredovisning YEAR-END REPORT JANUARY-DECEMBER 2009 2010 NULLA DIES SINE LINEA Inte en dag utan framsteg! Exclusive cooperation agreement with Chesapeake Exclusive cooperation agreement with Chesapeake
Lindab Group presentation Q2 2010
 lindab group presentation Lindab Group presentation Q2 2010 David Brodetsky, CEO Nils-Johan Andersson, CFO Agenda Highlights Group Business Areas Strategy Trends and outlook Q & A 2 Lindab Group Highlights
INTERIM REPORT JANUARY JUNE 2007
 INTERIM REPORT JANUARY JUNE 2007 Income totalled SEK 614 million (375) Net profi t for the period increased to SEK 659 million (315) Earnings per share increased to SEK 3.96 (2.6 Property sales amounted
Svenska Handelsbanken Full-year result February 2002
 1 Svenska Handelsbanken Full-year result 2001 12 February 2002 Profit & loss account, January - December Handelsbanken Group SEK m 2001 2000 Change % Net interest income 13 385 11 791 14 Commission, net
Interim report Q October 2008 Jan Lidén President and CEO
 Interim report Q3 2008 23 October 2008 Jan Lidén President and CEO Content Highlights in Q3 results The macro-economic environment Comments on issues in focus Funding and liquidity Credit quality Business
Länsförsäkringar Bank January March 2012
 23 APRIL Länsförsäkringar Bank January The period in brief, Group Operating profit increased 39% to SEK 131 M (94). Return on equity amounted to 6.2% (5.0). Net interest income increased 23% to SEK 482
Keefe, Bruyette & Woods 2012 European Financials Conference 19 September Niklas Ekvall Head of Group Treasury
 Keefe, Bruyette & Woods 2012 European Financials Conference 19 September 2012 Niklas Ekvall Head of Group Treasury Disclaimer This presentation contains forward-looking statements that reflect management
HUFVUDSTADEN Interim Report January September 2013
 3 HUFVUDSTADEN Interim Report January 2013 Interim Report January 2013 GROUP RESULTS Gross profit from property management increased by 6 per cent and amounted to SEK 851 million (800), which can be attributed
Interim report January-June Significant events in the second quarter
 Q2 Interim report January-June 216 Rental income rose by 66 percent to SEK 378. million(227.6). The operating surplus rose by 61 percent to SEK 277.9 million (173.). Profit from property management rose
Fact Book January September 2010
 Fact Book January September STOCKHOLM 28 OCTOBER SEB Fact book January September N Table of contents Table of contents...2 About SEB...3 SEB History...3 Financial targets...3 Organisation...4 Corporate
Fabege s Interim report January - June Christian Hermelin, CEO Åsa Bergström, CFO
 Fabege s Interim report January - June 2018 Christian Hermelin, CEO Åsa Bergström, CFO Strong contribution first half of the year to future value creations NET LETTINGS SEK 123m RETURN ON PROJECTS 121%
Handelsbanken January June July 2013
 Handelsbanken January June 2013 17 July 2013 Q307 Q407 Q108 Q208 Q308 Q408 Q109 Q209 Q309 Q409 Q110 Q210 Q310 Q410 Q111 Q211 Q311 Q411 Q112 Q212 Q312 Q412 Q113 Q213 Handelsbanken Group Average annual growth
SEB Enskilda Nordic Seminar 7 January Erkki Raasuke, CFO
 SEB Enskilda Nordic Seminar 7 January 2010 Erkki Raasuke, CFO Continued focus on short-term priorities Asset quality Signs of growth rate of impaired loans levelling off Ektornet to protect long-term shareholder
Alfa Laval AB (publ) Interim report July 1 September 30, 2005
 Interim report July 1 September 30, 2005") Alfa Laval AB (publ) Interim report July 1 September 30, 2005 "The order intake during the third quarter 2005 was very strong and increased with 25 percent, excluding exchange rate variations. Driving
Alfa Laval AB (publ) Interim report July 1 September 30, 2005 "The order intake during the third quarter 2005 was very strong and increased with 25 percent, excluding exchange rate variations. Driving
Anders Ek Executive Vice President, Head of Strategic and International Banking. Tokyo March 14, 2007
 Anders Ek Executive Vice President, Head of Strategic and International Banking Tokyo March 14, 2007 Swedbank - an introduction (2) A leading Nordic-Baltic bank Other markets, niche banking Denmark - Swedbank
Goldman Sachs Financials Conference. Sustaining profitability despite challenging funding conditions. Frans Lindelöw
 Goldman Sachs Financials Conference Sustaining profitability despite challenging funding conditions Frans Lindelöw Group Executive Management Berlin, 13 June 2008 Disclaimer This presentation contains
Banks in Sweden. Facts about the Swedish banking market. Contents
 Facts about the Swedish banking market Contents The Swedish financial market 1 Structure of the banking industry 2 Deposits and lending 3 The major banking groups 4 Banks in Sweden 5 Mortgage credit institutions
Boule Diagnostics AB (publ) Year-end report 2017
 Year-end report 2017") [Skriv här] Boule Diagnostics AB (publ) Year-end report 2017 Continued growth, increased profitability and strong cash flow Quarter October December 2017 Net sales amounted to SEK 107.2 million (104.6),
[Skriv här] Boule Diagnostics AB (publ) Year-end report 2017 Continued growth, increased profitability and strong cash flow Quarter October December 2017 Net sales amounted to SEK 107.2 million (104.6),
Carnegie Nordic Large Cap Seminar Stockholm 4 March 2008 Mikael Inglander, CFO
 Carnegie Nordic Large Cap Seminar Stockholm 4 March 28 Mikael Inglander, CFO The leading bank in four small countries Sweden Total population: 9.2m Employees: 8,75 Private customers: 4.1m Corp. customers:
in brief. Activities in 2002
 Annual Report 2002 Agenda Page 1. 2002 in brief 3 2. Financial highlights 5 3. Business trends 10 4. Status of capitalisation 20 5. Trends in business areas 21 6. Corporate governance 39 7. Outlook for
Facts. Q3, 2006 October 26, 2006
 Facts October 26, 26 Contents page 1. Market position 2 2. Strategy 4 3. Financial targets 5 4. Savings and investments 6 5. Lending 7 6. Profit trend and key figures 8 7. Income 1 8. Expenses 11 9. Profit
Q1 January 1 31 March May 2016
 Q1 January 1 31 March 2016 19 May 2016 Humana at a glance Humana highlights Clear focus on full responsibility 1 Leading Nordic care company founded in 2001 with four strong business areas Focus on full
Year-end report January - December January 24, 2017 Mattias Ankarberg and Pernilla Walfridsson
 Year-end report January - January 24, 2017 Mattias Ankarberg and Pernilla Walfridsson Summary Q4 2016 Net sales increased +16.2 percent, compared with pro forma unchanged (0.0%). Net sales for comparable
interim report january march
 interim report january march 1 2 3 4 interim report January-March RESULTS AND summary january march RESULTS JANUARY march : Order bookings amounted to 4,000 (5,215) and the order backlog at the end of