WELCOME TO FABEGE 20 SEPTEMBER 2018
|
|
|
- Pamela McLaughlin
- 5 years ago
- Views:
Transcription

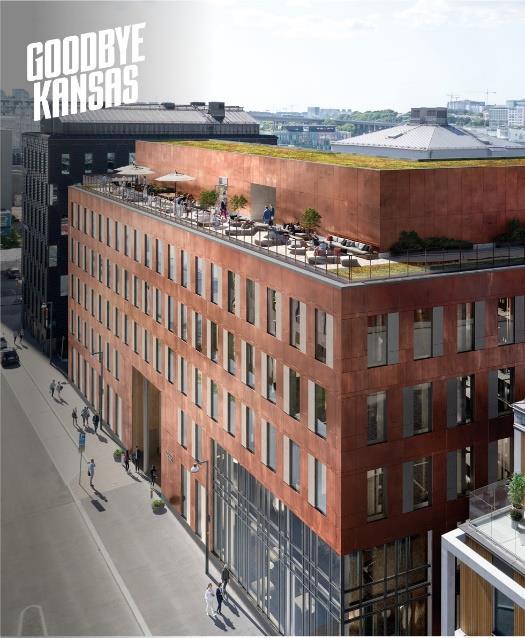
1 WELCOME TO FABEGE 20 SEPTEMBER 2018 Hammarby Sjöstad Solna Business Park Arenastaden Stockholms inner city

2 Fabege owns and manages every ten square meters of office space in Greater Stockholm.

3 FABEGE DEVELOPS Over 50% of the office production in the Stockholm region

4 VALUE CREATING CITY DISTRICT DEVELOPMENT CUSTOMER Property management: low risk with stable cash flow Property development: creates value imprives quality of portfolio Transaction: finance projects boost potential of portfolio Fabege s concentrated property portfolio provides us with good opportunities to influence the development of entire city districts


 Increasing")


5 MARKET CONDITIONS Strong rental market Increasing rental levels Renegotiation + 29% (H1) Net letting SEK 123 (H1) Increasing property values Decreasing yields Value creation through project development growth and relocation to quality favor rental increase in our city districts

6 MARKET OUTLOOK Stockholm is growing More and more people emplyed in office use Limited new production pipe line Very low vacancies in attractive locations New construction can not meet demand Increasing rental levels Decreasing or stable yields
7 Project portfolio

8 INCREASED RETURN ON PROJECTS Our low building rights costs Rising rents Declining yields 10 years average return: 52% WHAT CAN HAPPEN? Our low building rights costs consists Even with a rent reduction of SEK 500/sqm and a increase in yieds with of 0.5 %, gives a margin of 50 % NEW TARGET RETURN ON PROJECTS = 50 %

9 INCREASED INVESTMENT VOLUME Building rights in attractive areas Many alternative areas Strong demand 10 years average investment volume: SEK 1.8bn WHAT CAN HAPPEN Our areas are likely to be only more attractive Our office building rights last for 10 years Demand is likely to be strong in the long term NEW TARGET INVESTMENT VOLUME SEK 2.5 BN/YEARLY


10 Quality Hotell Friends Råsunda Centralskola Paradiset Ongoing projects


11 Farao 15, 16, 17 35,000 sqm office Possible start 2020 #Park1 30,000 sqm office Possible start 2020 Haga Norra 55,000 sqm office Possible start 2020 Kairo 40,000 office Possible start 2020 Sliparen 1 in Solna Business Park 25,000 office Possible start 2020 Possible projects Bostäder Residential building rights in the portfolio 290,000 sqm

12 V I S I ON FLEMINGSBERG: STOCKHOLM SOUTH BUSINESS DISTRICT

13 Common prerequisites Flemingsberg 2018 och Arenastaden 2008 Track bound hub Large volume of land Effective municipality

14 Success factor: Stockholm south travel hub

15 Success factor: Vibrant city district WORKING LIVING VISITING

16 Result and financing
17 KEY FIGURES Q jan-jun 2018 jan-jun 2017 jan-dec 2017 Target Equity per share, SEK EPRA NAV, SEK per share Total return properties, % 10,8 4,7 15,0 Return on projects, % Min 50 Surplus ratio, % (2020) Equity/assets ratio, % Min 35 Loan-to-value ratio, % Max 50 Debt ratio, multiple 14,5 16,1 15,5 Max 13 (long term) Interest coverage ratio, multiple 3,4 3,0 3,2 Min 2.2

18 FINANCING 30 JUNE 2018 Activities during the first half-year Investment grade rating from Moody s Issued SEK 2.3bn in Fabege s MTN Expanded MTN-program from SEK 5bn to SEK 8bn Expanded total facilities with aprrox SEK 900m Reduced some on outstanding certificates in favor of longer-term bonds Extended capital maturity from 4.0 to 4.7 years Extended fixed-rate period from 2.5 years to 3.1 through new long-term interest rate swaps, totaling SEK 2.2 bn at maturities between 7 and 10 years Swap expiery reduced the average interest rate significantly Total facilities SEK 28.5 bn Total loans SEK 24.9 bn Of which, bonds SEK 7.2 bn Of which, commercial paper SEK 3.2 bn Green financing totalled 53 per cent of outstanding loans Unutilized SEK 3.5 bn Capital maturity period: 4.7 years Fixed-rate period: 3.1 years Average interest 1.83%

19 THANK YOU FOR YOUR ATTENTION

20 Appendix
21 LARGEST SHAREHOLDERS N umber of sha res* Proportion of equity, % Proportion of votes,% Erik Paulsson with family, privately and company 51,021, Fourth AP-fund 13,947, BlackRock 12,794, Länsfötrsäkringar Funds 12,314, Investment AB Öresund 11,520, Vanguard 8,404, Mats Qviberg with family 7,495, E.N.A City AB 6,068, Handelsbanken Funds 4,949, Principal Global Investors 4,908, Swedbank Robur Funds 4,848, SEB Funds 4,062, AFA Försäkringar 4,256, TR Property Investment Trust 3,946, Pensionskassan SHB Försäkringsförening 3,840, Total 15 largest shareholders 154,378, Other 176,404, Total no. of shares outstanding 330,783, Treasury shares Total no. of registrated shares 330,783,

22 OUR BUILDING RIGHTS 30 JUNE 2018 Commercial building rights sqm ( sqm in Arenastaden) Approx 36 % legally bindning Booked value: approx SEK 3 000/sqm Residential building rights sqm Approx 34 % legally bindning Booked value: < SEK 8 000/sqm
Fabege s Interim report January - June Christian Hermelin, CEO Åsa Bergström, CFO
 Fabege s Interim report January - June 2018 Christian Hermelin, CEO Åsa Bergström, CFO Strong contribution first half of the year to future value creations NET LETTINGS SEK 123m RETURN ON PROJECTS 121%
Welcome to Fabege s year-end report Jan-Dec Christian Hermelin, CEO & President Fabege Åsa Bergström, Vice President & CFO Fabege
 Welcome to Fabege s year-end report Jan-Dec 2016 Christian Hermelin, CEO & President Fabege Åsa Bergström, Vice President & CFO Fabege EARNINGS 2016-2012 SEKm 2016 2015 2014 2013 2012 Property Management
Welcome to Fabege s Interim Presentation for Jan June Christian Hermelin, CEO & President Fabege Åsa Bergström, Vice President & CFO Fabege
 Welcome to Fabege s Interim Presentation for Jan June 2017 Christian Hermelin, CEO & President Fabege Åsa Bergström, Vice President & CFO Fabege CONDENSED INCOME STATEMENT SEKm Jan-June 2017 Jan-June
Summary, SEKm Oct-Dec Oct-Dec Jan-Dec Jan-Dec
 Q4 2016 Summary, SEKm 2016 2015 2016 2015 Oct-Dec Oct-Dec Jan-Dec Jan-Dec Rental income 532 505 2,105 1,998 N et operating income 382 349 1,507 1,429 Profit from property management -166 172 471 688 Profit
CREATING THE RIGHT CONDITIONS. Summary, SEKm. January December 2017¹
 Q4 2017 Summary, SEKm Oct-Dec Oct-Dec Jan-Dec Jan-Dec Rental income 592 532 2,280 2,015 Net operating income 450 382 1,680 1,507 Profit from property management 279-166 992 471 Profit before tax 1,962
Tax expenses for the period amounted to SEK -416m (-123). Operating taxes are calculated at a rate of 22 per cent on taxable earnings.
. Operating taxes are calculated at a rate of 22 per cent on taxable earnings.") During the period, Fabege s investment-property portfolio contributed to the favourable earnings through both a positive cash flow and value growth. Growth in net asset value was healthy, with EPRA NAV
During the period, Fabege s investment-property portfolio contributed to the favourable earnings through both a positive cash flow and value growth. Growth in net asset value was healthy, with EPRA NAV
Interim Report January March
 l 2012 Interim Report January March Profit from property management increased to SEK 125m (113), and rental income increased to SEK 453m (446). The year-on-year change was due to growth through positive
2012 Year-end Report. Key figures, SEKm 2012
 Year-end Report Rental income increased to SEK 1,869m (1,804). The year-on-year change was due to growth through positive net lettings and completed projects. Realised and unrealised value changes amounted
CREATING THE RIGHT CONDITIONS. Summary, SEKm. January September 2018¹ Jul-Sep Jul-Sep Jan-Sep Jan-Sep
 Q3 2018 Summary, SEKm 2018 2017 2018 2017 Jul-Sep Jul-Sep Jan-Sep Jan-Sep Rental income 627 580 1,864 1,688 Net operating income 481 435 1,389 1,230 Profit from property management 323 264 895 713 Profit
Interim Report January March 2003
 Interim Report January March 2003 Interim Report January March 2003 The profit after financial items increased to SEK 192 million (141) EPS after tax increased to SEK 2.21 (1.60) Wihlborgs owns 7,186,500
Welcome to Kungsleden. First Quarter 2011
 Welcome to Kungsleden First Quarter 2011 Kungsleden in brief Owns and manages properties generating high and stable long-term returns Returns more important than property type and location Returns cannot
The surplus ratio remains very strong, at 72 per cent during the period, the best in Fabege s history.
 We have seen fantastic net lettings during the year, with our major project lettings. Nevertheless, I am not satisfied with the outcome for the third quarter, which was weaker than anticipated. We will
Project development of JM
 Project development of JM Acquisition Management Occupancy Construction Conception planning Pre-construction Financing Sale/lease 3 2018-08-13 ytf Financial targets Targets 2017 2016 2015 2014 Operating
Welcome to Kungsleden Q3 2013
 Welcome to Kungsleden Q3 2013 25 October, 2013 Biljana Pehrsson, CEO Anders Kvist, Deputy CEO and CFO 2013 Kungsleden Aktiebolag Agenda 1. Q3 2013 results 2. Kungsleden's new strategy and targets 3. Portfolio
Welcome to Kungsleden. 2nd Quarter 2011
 Welcome to Kungsleden 2nd Quarter 2011 Kungsleden in brief Owns and manages properties generating high and stable long-term returns Returns more important than property type and location Returns can not
Fastighets AB Balder Interim report
 Fastighets AB Balder Interim report January-March Profit from property management attributable to parent company shareholders amounted to SEK 683m (631), corresponding to an increase per share by 18 %
Year-End Report, January December 2013
 Q4 Year-End Report, January December 13 Property income during the year totalled SEK 316.8m (286.2m). Operating profit was SEK 221.3m (184.9m). Profit for the year amounted to SEK 138.4m (2.3m), corresponding
Delarka Holding AB (publ)
") Delarka Holding AB (publ) Interim Report First half of 2016 January June 2016 CONTACT INFORMATION Delarka Holding AB (publ) a company managed by Pareto Business Management AB Sven I Hegstad, CEO +47 2201
Delarka Holding AB (publ) Interim Report First half of 2016 January June 2016 CONTACT INFORMATION Delarka Holding AB (publ) a company managed by Pareto Business Management AB Sven I Hegstad, CEO +47 2201
Significant events after the end of the period
 Q3 Interim report January September 215 Rental income rose by 9 percent to SEK 345.1 million (317.). The operating surplus increased by 1 percent to SEK 264.9 million (241.9). Profit from property management
Kungsleden AB (publ) Chief Executive Thomas Erséus Deputy Chief Executive Johan Risberg 24 April 2009
 Chief Executive Thomas Erséus Deputy Chief Executive Johan Risberg 24 April 2009") Kungsleden AB (publ) Chief Executive Thomas Erséus Deputy Chief Executive Johan Risberg 24 April 2009 Kungsleden in brief Kungsleden owns and manages properties generating high and stable long-term returns
Kungsleden AB (publ) Chief Executive Thomas Erséus Deputy Chief Executive Johan Risberg 24 April 2009 Kungsleden in brief Kungsleden owns and manages properties generating high and stable long-term returns
INTERIM REPORT, JANUARY MARCH 2008
 INTERIM REPORT, JANUARY MARCH 2008 Huddinge Myren 3 Catena shall own, effectively manage and actively develop commercial real estate in prime locations that offer the potential to generate steadily growing
Welcome to Kungsleden
 Welcome to Kungsleden Chief Executive Thomas Erséus Deputy Chief Executive Johan Risberg 17 February 2011 Kungsleden in brief Owns and manages properties generating high and stable long-term returns Returns
Welcome to Kungsleden s Financial Statement and strategy presentation
 Welcome to Kungsleden s Financial Statement and strategy presentation 15 February 2013 Thomas Erséus, Chief Executive Anders Kvist, Deputy Chief Executive Today s agenda 1. The lettings and property market
Delarka Fastighet AB (publ)
") Delarka Fastighet AB (publ) Interim Report First half of 2015 January June 2015 CONTACT INFORMATION Delarka Fastighet AB (publ) a company managed by Pareto Business Management AB Sven I Hegstad CEO +47
Delarka Fastighet AB (publ) Interim Report First half of 2015 January June 2015 CONTACT INFORMATION Delarka Fastighet AB (publ) a company managed by Pareto Business Management AB Sven I Hegstad CEO +47
NORDIC REAL ESTATE CONSTRUCTION CONFERENCE Henrik Saxborn and Ulrika Danielsson September 20, 2018
 NORDIC REAL ESTATE CONSTRUCTION CONFERENCE Henrik Saxborn and Ulrika Danielsson September 20, 2018 Strong focus on value creation from four perspectives Market outlook and business focus incl. rental market
HUFVUDSTADEN Interim Report January September 2013
 3 HUFVUDSTADEN Interim Report January 2013 Interim Report January 2013 GROUP RESULTS Gross profit from property management increased by 6 per cent and amounted to SEK 851 million (800), which can be attributed
»» Net profit increased by 4 per cent to SEK 1,149 million (1 102), corresponding to SEK 1.07 (1.02) per ordinary share.
, corresponding to SEK 1.07 (1.02) per ordinary share.") INTERIM REPORT JANUARY JUNE 16»» Income increased by 6 per cent to SEK 1,43 million (1,346).»» The operating surplus increased by 8 per cent to SEK 943 million (873).»» Profit from property management
INTERIM REPORT JANUARY JUNE 16»» Income increased by 6 per cent to SEK 1,43 million (1,346).»» The operating surplus increased by 8 per cent to SEK 943 million (873).»» Profit from property management
Amounts in SEK millions Jan Dec 2016 Jan Dec 2015 Oct Dec 2016 Oct Dec 2015
 1 Year-end report 216 Rental revenue increased in total to SEK 6,251 (6,9) million. For comparable property holdings, the increase is 3 percent. The occupancy rate was 94.2 (92.6) percent. Property expenses
Eastnine Q August
 Eastnine Q2 2017 30 August Agenda Key highlights and NAV development Our portfolio and quarterly performance Update on our holdings Focus going forward Q&A Welcome to today s conference call Today s presenters
Market value of properties 77,633 66,383 77,633 66,383
 Vasakronan Year-end Report Year-end Report Rental revenues rose to SEK 5,508 M (5,367). Occupancy rate improved to 92.8% (91.9). Net surplus rose to SEK 3,706 M (3,579). Income before changes in value
Wihlborgs Fastigheter AB Interim report. Ulrika Hallengren, CEO and Arvid Liepe, CFO January June, 2018
 Wihlborgs Fastigheter AB Interim report Ulrika Hallengren, CEO and Arvid Liepe, CFO January June, 2018 Summary January-June 2018 Rental income increased by 20 percent to SEK 1,330 million (1,106) Operating
Quarterly Report January March 2013
 ÄLVSJÖ TRAVEL CENTER Älvsjö Quarterly Report January March 2013 Operative net sales amounted to SEK 9,210 million (9,868) Operative operating profit amounted to SEK 70 million (144) Earnings per share
Wihlborgs Fastigheter AB Interim report. January June Rental income increased by 7 per cent to SEK 621 million (579)
") Wihlborgs Fastigheter AB Interim report January June 2009 2 Rental income increased by 7 per cent to SEK 621 million (579) Net operating income increased by 8 per cent to SEK 443 million (409) The income
Wihlborgs Fastigheter AB Interim report January June 2009 2 Rental income increased by 7 per cent to SEK 621 million (579) Net operating income increased by 8 per cent to SEK 443 million (409) The income
Year-End Report 2014
 HUFVUDSTADEN Year-End Report 2014 4 Year-End Report 2014 GROUP RESULTS Gross profit from property management amounted to SEK 1,145 million (1,135), the increase can be attributed mainly to higher rents.
JANUARY TO DECEMBER PRELIMINARY FINANCIAL STATEMENT 2017
 JANUARY TO DECEMBER PRELIMINARY FINANCIAL STATEMENT INTERIM REPORT 1 JANUARY 31 DECEMBER NET SALES increased to SEK 2,563 million (SEK 2,299 m) of which rental income increased to SEK 2,389 million (SEK
Income amounted to SEK 772 million (762). The operating surplus amounted to SEK 507 million (503).
. The operating surplus amounted to SEK 507 million (503).") INTERIM REPORT 18 JANUARY MARCH Income amounted to SEK 772 million (762). The operating surplus amounted to SEK 57 million (53). Profit from property management amounted to SEK 319 million (319). Profit
INTERIM REPORT 18 JANUARY MARCH Income amounted to SEK 772 million (762). The operating surplus amounted to SEK 57 million (53). Profit from property management amounted to SEK 319 million (319). Profit
Our customers and our locations are central in everything we do.
 Our customers and our locations are central in everything we do. ANNUAL REPORT 2012 Contents Fabege Introduction The business Sustainability report Financial reporting The Group The Parent Company Other
Strong first quarter for Wihlborgs
 Wihlborgs Interim report 2017 January March Strong first quarter for Wihlborgs Rental income increased by 9 percent to SEK 540 million (497) Operating surplus increased by 9 percent to SEK 388 million
Fastighets AB Balder Year-end report January December 2012
 Fastighets AB Balder Year-end report January December Profit from property management before tax amounted to SEK 691m (516) corresponding to SEK 3.73 per ordinary share (3.00) Rental income amounted to
YEAR-END REPORT JANUARY DECEMBER 2017 Q4:2017. The new Kungsleden delivers strong result for 2017 BILJANA PEHRSSON, CEO
 YEAR-END REPORT JANUARY DECEMBER Q4: The new Kungsleden delivers strong result for BILJANA PEHRSSON, CEO KUNGSLEDEN YEAR-END REPORT 1 JANUARY - 31 DECEMBER Kungsleden is a long-term property owner that
Net profit for the year in brief
 Fastighets AB Balder Interim report January March Profit from property management before tax amounted to SEK 234m (161), corresponding to SEK 1.15 per ordinary share (0.82) Rental income amounted to SEK
PRELIMINARY FINANCIAL STATEMENT 2016 JANUARY DECEMBER
 PRELIMINARY FINANCIAL STATEMENT JANUARY DECEMBER INTERIM REPORT 1 JANUARY 31 DECEMBER NET SALES totalled SEK 2,299 million (SEK 2,468 m), of which rental income increased to SEK 2,150 million (SEK 2,122
MARCH 7, 2018 PARETO SECURITIES NORDIC CORPORATE BOND CONFERENCE
 MARCH 7, 2018 PARETO SECURITIES NORDIC CORPORATE BOND CONFERENCE AGENDA PART 1 COMPANY PRESENTATION & BUSINESS RATIONALE PART 2 FINANCIAL REPORT FULL YEAR 2017 PART 3 GROWTH CONTINUE 2 PART 1 COMPANY PRESENTATION
HUFVUDSTADEN Year-End Report 2017
 Q4 HUFVUDSTADEN Year-End Report Year-End Report Gross profit rose by 3 per cent to SEK 1,301 million (1,262). The increase can be attributed mainly to higher rental revenue. Net revenue amounted to SEK
JANUARY TO MARCH INTERIM REPORT 2017
 JANUARY TO MARCH INTERIM REPORT 2017 INTERIM REPORT 1 JANUARY 31 MARCH 2017 NET SALES increased to SEK 591 million (SEK 564 m) of which rental income increased to SEK 567 million (SEK 524 m). Rental income
Akelius Fastigheter AB. Interim report January to June 2010
 Akelius Fastigheter AB Interim report January to June 2010 Akelius Fastigheter AB (publ) Registered company number: 556156-0383 Interim Report January to June 2010 Rental income amounted to SEK 1,239 m
YEAR-END REPORT 2008
 YEAR-END REPORT 2008 Catena s property in Drammen, which was upgraded in 2008 to a modern automotive facility, was opened for business by Bilia in December 2008. Catena shall own, effectively manage and
Income increased by 4 per cent to SEK 1,585 million (1,518). The operating surplus increased by 3 per cent to SEK 1,066 million (1,032).
. The operating surplus increased by 3 per cent to SEK 1,066 million (1,032).") INTERIM REPORT 18 JANUARY JUNE»» Income increased by 4 per cent to SEK 1,585 million (1,518).»» The operating surplus increased by 3 per cent to SEK 1,66 million (1,32).»» Profit from property management
INTERIM REPORT 18 JANUARY JUNE»» Income increased by 4 per cent to SEK 1,585 million (1,518).»» The operating surplus increased by 3 per cent to SEK 1,66 million (1,32).»» Profit from property management
Interim Report. January - September
 Interim Report January - September 2018 JM Group 1) Revenue: SEK 16.6 billion 2) Total assets: SEK 16.1 billion No. of building rights: 36,700 No. of employees: 2,610 Market Cap: SEK 11.2 billion 3) 21
Fastighets AB Balder Interim report January September 2012
 Fastighets AB Balder Interim report January September Profit from property management before tax amounted to SEK 508m (370), corresponding to SEK 2.74 per ordinary share (2.21) Rental income amounted to
FEBRUARY 23, 2018 PRESENTATION CARNEGIE
 FEBRUARY 23, 2018 PRESENTATION CARNEGIE AGENDA PART 1 COMPANY PRESENTATION & BUSINESS RATIONALE PART 2 FINANCIAL REPORT FULL YEAR 2017 PART 3 GROWTH CONTINUE 2 PART 1 COMPANY PRESENTATION & BUSINESS RATIONALE
Interim Report, January September 2013
 Q3 Interim Report, January September 213 Catena s financial position Property income during the period totalled SEK 227.1m (217.4m). The operating surplus was SEK 156.6m (139.7m). Interim profit amounted
Contents. The View, Jakobsgatan 6
 Year-end Report Contents Vasakronan in brief 1 Vasakronan 2 Market overview 3 Consolidated income statement 4 Comments on the income statement 5 Consolidated balance sheet 8 Comments on the balance sheet
Year-End Report 2015
 HUFVUDSTADEN Year-End Report 2015 4 Year-End Report 2015 Profit for the year before tax increased by SEK 1,928 million, totalling SEK 4,449 million (2,521). The increase can be attributed to higher unrealized
INTERIM REPORT JANUARY SEPTEMBER 2015
 Q3 INTERIM REPORT JANUARY SEPTEMBER 2015 OVERVIEW OF THE PERIOD JANUARY SEPTEMBER 2015 c Rental income for the period was SEK 967 million (969) c Property management income was SEK 383 million (323) c
Quarterly report. January - March Operative net sales SEK 9,001 million (9,194) Operative operating profit SEK 171 million (155)
 Operative operating profit SEK 171 million (155)") Quarterly report January - March 2015 VÅGHOLME AND PIER Västerås Operative net sales SEK 9,001 million (9,194) Operative operating profit SEK 171 million (155) Operative operating margin improved to 1.9
Quarterly report January - March 2015 VÅGHOLME AND PIER Västerås Operative net sales SEK 9,001 million (9,194) Operative operating profit SEK 171 million (155) Operative operating margin improved to 1.9
interim report january september 2014
 q3 interim report january september 2014 OVERVIEW OF THE PERIOD January-September 2014 c Rental income for the period was SEK 969 million (971) c Property management income was SEK 323 million (275) c
Interim report January September 2008
 Wihlborgs Fastigheter AB Interim report January September The result for the period amounted to SEK 307 million (504) which corresponds to SEK 8,21 per share (13,12) Rental income for the period increased
YEAR-END REPORT FEBRUARY 2017 BILJANA PEHRSSON CEO ANDERS KVIST DEPUTY CEO AND CFO
 YEAR-END REPORT 2016 16 FEBRUARY 2017 BILJANA PEHRSSON CEO ANDERS KVIST DEPUTY CEO AND CFO AGENDA Full year in summary Property portfolio Financial performance and key figures Proposed rights issue 2017
Full-year report 2015 February Biljana Pehrsson, CEO Anders Kvist, Deputy CEO and CFO
 Full-year report 2015 February 2016 Biljana Pehrsson, CEO Anders Kvist, Deputy CEO and CFO AGENDA FOURTH QUARTER AND FULL YEAR IN SUMMARY FINANCIAL DEVELOPMENT AND KEY FIGURES BUSINESS PLAN 2020 WITH GROWTH
JM Group Real Estate & Construction Conference, September 20, 2018 Claes Magnus Åkesson, CFO
 JM Group January - June 2018 Real Estate & Construction Conference, September 20, 2018 Claes Magnus Åkesson, CFO JM Group 1) Revenue: SEK 16.5 billion 2) Total assets: SEK 16.6 billion No. of building
Interim Report January to September 2011
 Akelius Fastigheter AB Interim Report January to September 2011 Holländische Reihe, Hamburg Akelius Fastigheter AB Registered company number: 556156-0383 Interim report January to September 2011 Rental
DIÖS FASTIGHETER AB INTERIM REPORT JANUARY MARCH
 Q1 INTERIM REPORT JANUARY MARCH 2016 1 HIGHLIGHTS JANUARY-MARCH 2016 c Rental income for the period was SEK 331 million (325) c Property management income was SEK 119 million (101) c Unrealised changes
DIÖS FASTIGHETER AB INTERIM REPORT JANUARY JUNE
 Q2 INTERIM REPORT JANUARY JUNE DIÖS FASTIGHETER AB INTERIM REPORT JANUARY JUNE 1 HIGHLIGHTS JANUARY JUNE c Rental income for the period was SEK 661 million (647) c Property management income was SEK 259
HUFVUDSTADEN Half-year Report January June 2017
 Q2 HUFVUDSTADEN Half-year Report January June Half-year Report January June Gross profit rose by 4 per cent to SEK 643 million (616). The increase can be attributed mainly to higher rental revenue. Net
W i h l b o r g s F a s t i g h e t e r A B y e a r - e n d r e p o r t j a n u a r y d e c e m b e r Oct-Dec
 Wihlborgs Fastigheter AB Year-end report January December W i h l b o r g s F a s t i g h e t e r A B y e a r - e n d r e p o r t j a n u a r y d e c e m b e r The profit of the year increased by SEK 435
Fastighets AB Balder Interim report
 Fastighets AB Balder Interim report January-June Profit from property management attributable to parent company shareholders amounted to SEK 1,485m (1,296), corresponding to an increase per share by 24
INTERIM REPORT 2016 JANUARY JUNE
 INTERIM REPORT 2016 JANUARY JUNE INTERIM REPORT 1 JANUARY 30 JUNE 2016 NET SALES totalled SEK 1,139 million (SEK 1,187 m), of which rental income increased to SEK 1,062 million (SEK 1,037 m). THE LETTING
Highlights of Annual Report 1997
 17 February 1998 Press release Highlights of Annual Report 1997 Stadshypotek has been part of the Handelsbanken Group since 26 February 1997. It is not included in the comparative figures for 1996. Summary
Delarka Holding AB (publ)
") Delarka Holding AB (publ) Interim Report first half of 2014 January June 2014 CONTACT INFORMATION Delarka Holding AB (publ) a company managed by Pareto Business Management AB Sven I Hegstad CEO +47 2201
Delarka Holding AB (publ) Interim Report first half of 2014 January June 2014 CONTACT INFORMATION Delarka Holding AB (publ) a company managed by Pareto Business Management AB Sven I Hegstad CEO +47 2201
KLÖVERN INTERIM REPORT JANUARY JUNE / 1
 INTERIM REP OR T JANUARY JUNE 20 0 9 Income increased to SEK 631 million (603) Profit from property management increased by 38 per cent to SEK 252 million (183), equivalent to SEK 1.57 per share (1.11)
K L Ö V E R N. Interim Report January March Properties in seven localities have been sold for MSEK 39 for a gain of MSEK 3.4.
 K L Ö V E R N May 15, 2003 Interim Report January March 2003 Profit after taxes amounted to MSEK 13.2. Properties in seven localities have been sold for MSEK 39 for a gain of MSEK 3.4. Klövern s shares
Net profit increased by 78 per cent to SEK 712 million (400), corresponding to SEK 0.69 (0.35) per ordinary share.
, corresponding to SEK 0.69 (0.35) per ordinary share.") INTERIM REPORT JANUARY MARCH 16»» Net profit increased by 78 per cent to SEK 712 million (400), corresponding to SEK 0.69 (0.35) per ordinary share.»» Income increased by 7 per cent to SEK 714 million
INTERIM REPORT JANUARY MARCH 16»» Net profit increased by 78 per cent to SEK 712 million (400), corresponding to SEK 0.69 (0.35) per ordinary share.»» Income increased by 7 per cent to SEK 714 million
JANUARY TO JUNE INTERIM REPORT 2017
 JANUARY TO JUNE INTERIM REPORT 2017 INTERIM REPORT 1 JANUARY 30 JUNE 2017 NET SALES increased to SEK 1,262 million (SEK 1,139 m) of which rental income increased to SEK 1,191 million (SEK 1,062 m). Rental
Interim Report January June 2018
 1 Interim Report January June 2018 Rental revenue increased to SEK 3,333 million (3,246). For comparable property holdings, the increase was 6% and was mainly attributable to positive effects from new
Year-End Report 2006
 Year-End Report Profit for the year after tax amounted to SEK 3,423.2 million (1,333.9), equivalent to SEK 16.60 per share (6.47). The sale of the World Trade Center Stockholm, including management profits,
Wihlborgs Fastigheter AB Year-end report. Ulrika Hallengren, CEO and Arvid Liepe, CFO January December, 2018
 Wihlborgs Fastigheter AB Year-end report Ulrika Hallengren, CEO and Arvid Liepe, CFO January December, 2018 Summary January December 2018 Rental income increased by 14 percent to SEK 2,684 million (2,351)
K LÖV ERN IN T ERIM REP O R T J A NUA RY M A RCH
 K LÖV ERN IN T ERIM REP O R T J A NUA RY M A RCH Klövern January March Income increased by 19 per cent to SEK 399 million (334) Operating surplus increased by 27 percent to SEK 242 million (191) Profit
Income statement - SEB Group
 Income statement - SEB Group Previously reported Change Restated Jan-Dec Jan-Dec Jan-Dec Jan-Dec Jan-Dec Jan-Dec SEK m 2014 2015 2014 2015 2014 2015 Net interest income 19,943 18,938 19,943 18,938 Net
DIÖS FASTIGHETER AB FINANCIAL STATEMENT JANUARY DECEMBER
 Q4 FINANCIAL STATEMENT JANUARY DECEMBER DIÖS FASTIGHETER AB FINANCIAL STATEMENT JANUARY DECEMBER 1 OVERVIEW OF THE YEAR JANUARY DECEMBER c Rental income for the year was SEK 1,323 million (1,295) c Property
Interim report January-June 2006
 Interim report January-June 2006 Profit for the period amounted to SEK 264 million (243), which is the equivalent of a result per share of SEK 6,87 (6,42). Rental income for the period was SEK 414 million
Year-end. report. January December 2018
 Q4 Year-end report January December Key figures Oct Dec Jan Dec Continuing operations 2017 2017 Rental income, 683 545 2,525 2,103 Net operating income, 509 378 1,792 1,484 Surplus ratio, % 74.6 69.4 71.0
Wihlborgs market leader in growth
 Wihlborgs Interim report 2012 January September Wihlborgs market leader in growth Result for the period amounts to SEK 445 million (505), corresponding to earnings per share of SEK 5.79 (6.57) Rental income
Wihlborgs earnings keep growing
 Wihlborgs Interim report 2016 January September Wihlborgs earnings keep growing Rental income rose 5 percent to SEK 1,505 million (1,435) Operating surplus* improved 6 percent to SEK 1,134 million (1,065)
Income increased by 6 per cent to SEK 2,397 million (2,261). The operating surplus increased by 6 per cent to SEK 1,646 million (1,553).
. The operating surplus increased by 6 per cent to SEK 1,646 million (1,553).") INTERIM REPORT 18 JANUARY SEPTEMBER»» Income increased by 6 per cent to SEK 2,397 million (2,261).»» The operating surplus increased by 6 per cent to SEK 1,646 million (1,553).»» Profit from property management
INTERIM REPORT 18 JANUARY SEPTEMBER»» Income increased by 6 per cent to SEK 2,397 million (2,261).»» The operating surplus increased by 6 per cent to SEK 1,646 million (1,553).»» Profit from property management
Interim January September 2018
 Q3 Interim report January September 2018 > Hemfosa s extraordinary general meeting on 13 September 2018 resolved in accordance with the proposal of the Board of Directors to distribute all shares in the
DIÖS FASTIGHETER AB YEAR-END REPORT JANUARY DECEMBER 2015
 Q4 YEAR-END REPORT JANUARY DECEMBER 2015 1 OVERVIEW OF THE YEAR JANUARY DECEMBER 2015 c Rental income for the year was SEK 1,295 million (1,291) c Property management income was SEK 508 million (421) c
SPP - Additional information. November 2005
 SPP - Additional information November 2005 SPP Overview 30 September 2005 Assets under management: SEK 83bn Premium income, Jan-Sep 2005: SEK 3.3bn Duration, commitments to policyholders: 17 years Policies:
Q INTERIM REPORT JANUARY MARCH 2016
 Q1 2016 INTERIM REPORT JANUARY MARCH 2016 INTERIM REPORT JANUARY MARCH 2016 INTERIM REPORT Q1 2016 FIRST QUARTER JANUARY MARCH 2016 Rental income increased to SEK 309 million (296) Net operating income
Contents. Subsidiaries and other major shareholders
 2010 Contents This is a translation of the original Swedish Annual Report. In the event of differences between the English translation and the Swedish original, the Swedish Annual Report shall prevail.
Interim report. Akelius Residential. Summary. January to March 2014
 Interim report Akelius Residential January to March 2014 Rental income increased by 5.1 per cent (5,8) for comparable properties Operating surplus increased by 5.1 per cent (6,7) for comparable properties
Eastnine Q November
 Eastnine Q3 2017 9 November Agenda Our portfolio and quarterly performance Update on our holdings Focus going forward Key financials and NAV development Welcome to today s presentation Today s presenters
INTERIM REPORT JANUARY MARCH. » income increased by 36 per cent to sek 541 (399) million.
 million.") REPORT JANUARY MARCH INTERIM REPORT JANUARY MARCH 13 I» income increased by 36 per cent to sek 541 (399) million.» the operating surplus increased by 33 per cent to sek 321 million (242).» Profit from
REPORT JANUARY MARCH INTERIM REPORT JANUARY MARCH 13 I» income increased by 36 per cent to sek 541 (399) million.» the operating surplus increased by 33 per cent to sek 321 million (242).» Profit from
SEK million
 Fourth quarter Full year SEK million 20 20 20 20 Group Net sales 26,489 23,180 101,221 87,174 Operating profit before depreciation/amortisation (EBITDA) 1,889 1,423 6,191 5,819 Operating profit (EBIT)
VASAKRONAN YEAR-END REPORT 2017
 1 Year-end report 2017 Rental revenue increased in total to SEK 6,490 (6,251) million. For comparable holdings, the increase was 5 percent, primarily attributable to the positive effect of new leases and
Strong value growth and high rate of investment
 Strong value growth and high rate of investment Interim report January March 2018 24 April 2018 CEO Peter Strand CFO Tommy Åstrand In the event of discrepancies between this Presentation and the Swedish
JANUARy SEPTEMBER 2009.
 PEAB AB INTERIM report JANUARy SEPTEMBER 2009. Net sales increased by 4 percent to SEK 25,614 million (24,724). Compared with pro forma including Peab Industri net sales fell by 12 percent Operating profit
Year-end report January December 2013
 UARDA 1 Solna Year-end report January December 2013 Operative net sales amounted to SEK 42,733 million (45,997) Operative operating profit was SEK 593 million (1,004). One-off costs of SEK -920 million
Q INTERIM REPORT JANUARY JUNE 2017
 Q2 INTERIM REPORT JANUARY JUNE INTERIM REPORT JANUARY JUNE INTERIM REPORT Q2 JANUARY JUNE SECOND QUARTER Rental income increased to SEK 702 million (630) Net operating income increased to SEK 352 million
K L Ö V E R N. Year end report 2005
 Year end report 2005 K L Ö V E R N Rental revenues amounted to SEK 639 million (485) Net profit for the year increased to SEK 379 million (213) Earnings per share increased to SEK 3.27 (2.30) The Board