TECHNICAL ASSISTANCE REPORT NATIONAL ACCOUNTS STATISTICS MISSION. Copies of this report are available to the public from
|
|
|
- Duane Caldwell
- 6 years ago
- Views:
Transcription

1 IMF Country Report No. 17/187 July 2017 SURINAME TECHNICAL ASSISTANCE REPORT NATIONAL ACCOUNTS STATISTICS MISSION This Technical Assistance report on Suriname was prepared by a staff team of the International Monetary Fund. It is based on the information available at the time it was completed on February Copies of this report are available to the public from International Monetary Fund Publication Services PO Box Washington, D.C Telephone: (202) Fax: (202) publications@imf.org Web: Price: $18.00 per printed copy International Monetary Fund Washington, D.C International Monetary Fund
2 Caribbean Regional Technical Assistance Centre SURINAME TECHNICAL ASSISTANCE REPORT ON THE NATIONAL ACCOUNTS STATISTICS MISSION (February 7 17, 2017) Prepared by Zia Abbasi Real Sector Statistics Advisor March 2017
3 2 The contents of this report constitute technical advice provided by the staff of the International Monetary Fund (IMF) to the authorities of Suriname (the TA recipient) in response to their request for technical assistance. This report (in whole or in part) or summaries thereof may be disclosed by the IMF to IMF Executive Directors and members of their staff, as well as to other agencies or instrumentalities of the TA recipient, and upon their request, to World Bank staff, and other technical assistance providers and donors with legitimate interest, members of the Steering Committee of CARTAC, unless the TA recipient specifically objects to such disclosure (see Operational Guidelines for the Dissemination of Technical Assistance Information). Publication or Disclosure of this report (in whole or in part) or summaries thereof to parties outside the IMF other than agencies or instrumentalities of the TA recipient, World Bank staff, other technical assistance providers and donors with legitimate interest members of the Steering Committee of CARTAC, shall require the explicit consent of the TA recipient and the IMF s Statistics Department.
4 3 Contents Page Abbreviations... 4 Executive Summary... 5 Action Plan for Expanding and Improving the National Accounts... 7 I. Introduction II. Statistics Prerequisites A. Legal and Institutional Environment B. Staff Capacity and Other Resources C. Financing and Technical Assistance III. Data Sources IV. Supply and Use Tables V. GDP by Economic Activity VI. GDP by Expenditure A. Government Final Consumption Expenditure B. Final Consumption Expenditure of NPISHs C. Household Final Consumption Expenditure D. Gross Capital Formation E. Exports and Imports of Goods and Services Appendices I. Draft Timetable II. Assessment of Data Sources III. Methodology for Compiling GDP by Economic Activity IV. List of Products and Industries for the 2015 SUT... 59
5 4 ABBREVIATIONS 2008 SNA 2008 System of National Accounts, United Nations BM Benchmark CARTAC Caribbean Regional Technical Assistance Centre CBS Central Bank of Suriname CFC Consumption of fixed capital COE Compensation of employees COICOP Classification of Individual Consumption According to Purpose CPI Consumer price index CPV Current price value e-gdds Enhanced General Data Dissemination System FCE Final consumption expenditure FISIM Financial intermediation services indirectly measured FPIs For-profit institutions GBS General Bureau of Statistics GDP-E Gross domestic product by expenditure GDP-P Gross domestic product by economic activity GFCE Government final consumption expenditure GFCF Gross fixed capital formation GVA Gross value added HBS Household Budget Survey HFCE Household final consumption expenditure IBR Integrated Business Register IC Intermediate consumption I/O ratio Intermediate consumption to output ratio ISIC International Standard Industrial Classification of All Economic Activities KPV Constant price values LFS Labor Force Survey MOF Ministry of Finance MOU Memorandum of understanding MPI Import price indices NPIs Non-profit institutions NPISHs Non-profit institutions serving households PIM Perpetual inventory method PPI Producer price index PRASC Project for the Regional Advancement of Statistics in the Caribbean RSA Real Sector Statistics Advisor SUT Supply and use tables TA Technical assistance WIP Work-in-progress
6 5 EXECUTIVE SUMMARY In response to a request from the General Bureau of Statistics (GBS) of Suriname and in consultation with IMF s Western Hemisphere Department (WHD), the Real Sector Statistics Advisor (RSA) at the Caribbean Regional Technical Assistance Centre (CARTAC) undertook a technical assistance (TA) mission to Paramaribo during February 7 17, 2017, to review and provide advice on improving the national accounts of Suriname, including consistency with the System of National Accounts The GBS currently produces annual estimates of GDP by economic activity (GDP-P) at current and constant 2007 prices; as well as annual current price estimates for GDP by expenditure (GDP-E) that are broadly consistent with the System of National Accounts Annual estimates of Gross National Income and Gross National Disposable Income are also compiled. Quarterly GDP estimates are not compiled. The mission conducted a comprehensive review of the statistics prerequisites, concepts, data sources, and methods used to produce the national accounts. Areas for improving the source data were identified and recommendations have been made to expand the use of administrative data, especially from the Tax Department, Ministry of Finance (MOF) and the Central Bank of Suriname (CBS); update the business register going forward using both the results of the 2015 Establishment Census and regulatory data; redevelop the annual and quarterly business surveys; expand subannual collection of prices and volume data; and conduct the construction industry, trade and transport margin studies needed to compile the 2015 SUT and in rebasing the GDP. There is scope to improve the annual GDP-P methodology, including implementing the 2008 SNA methodology for calculating and fully allocating financial intermediation services indirectly measured; work-in-progress methodology for agriculture and construction; discontinuing the use of fixed intermediate consumption (IC) to output ratios for current price estimates; improving deflation/reflation of IC; implementing the International Standard Industry Classification Revision 4 (ISIC Rev.4) for national accounts; and volume extrapolation of deflated imports and outputs at a more detailed level to derive taxes less subsidies on products in constant prices. The mission provided broad methodological advice on developing quarterly GDP-P estimates, even though any development is subject to additional budget. In addition, the mission provided methodological advice on compiling the annual GDP-E estimates. This advice included using the benchmark-indicator approach to develop independent estimates of household final consumption expenditure; using the commodity flow approach at the detailed product level for gross fixed capital formation and changes in inventories; adding biological assets, research and development, database and software development, intellectual property, and net acquisition of valuables to gross capital formation; and deflating expenditure components at the detailed product level.
7 6 Advice was also provided on the data sources and methodology to produce the 2015 SUT and rebase GDP. A draft SUT frame of 127 industries and 164 product groups was developed. Training was provided on all recommended changes in source data and methodology. Following discussions with the Director, GBS staff, the CBS and other Government departments; a draft medium-term action plan to improve and expand the national accounts aggregates has been prepared and is provided in the next section. A draft timetable was also prepared and is included in Appendix I. Further staff capacity building is required. Also, the budget of the GBS needs to be expanded to improve data collection and compilation. An additional two prices statisticians and two economic statisticians need to be recruited by January In terms of the way forward, the GBS is expected to implement the recommendations of the mission progressively over a five-year period. Improvements in methodology and 2008 SNA changes that can be implemented using existing source data will be made for the 2007 GDP series and with the rebasing of the GDP to the 2015 base year; while those requiring additional data collection and further investigation will need to be implemented following the rebase. Given the staff time wasted on data entry and potential transcription errors, the GBS should give high priority to requesting the MOF to provide the Government accounts data in Excel format for 2015 onward. There is currently no data provided to the GBS by the Tax Department. With the support of the Minister of Finance, the GBS needs to implement a formal agreement with the Department to share tax registration data, company income tax returns and sales tax returns. The Director is expected to share the mission s final report and arrange missions with Statistics Canada as part of the Project for the Regional Advancement of Statistics in the Caribbean (PRASC). Statistics Canada will be requested to assist with the quality assuring the various administrative and survey data to be used in compiling the SUT, development of the GDP-E and the SUT compilation. CARTAC will provide remote TA as needed. A follow-up CARTAC mission is tentatively planned for August 2018 to review the balanced 2015 SUT and help finalize the rebased GDP estimates for dissemination. The RSA worked closely with the GBS staff during the mission. Their cooperation is very much appreciated.
8 7 ACTION PLAN FOR EXPANDING AND IMPROVING THE NATIONAL ACCOUNTS PROJECT DESCRIPTION This section sets out in tabular form the draft action plan to expand and improve the national accounts statistics for Suriname, including compiling the SUT and rebasing the GDP estimates. This action plan is to be reviewed and finalized by the GBS by May 31, 2017, following further discussions with Statistics Canada on PRASC TA. PROJECT OBJECTIVES Objectives Verifiable Indicators Completion Date Assumptions Expansion and improvement of the national accounts. The national accounts are consistent with the 2008 SNA and meet e- GDDS requirements. 12/31/2021 The authorities will ensure that appropriate staff and other resources, including financing and TA, are available to implement this action plan. PROJECT ACTIVITIES/OUTPUTS DQAF Priority Outputs Verifiable Indicators 0.1 and 0.2 H Improve institutional infrastructure and operational capacity to compile national accounts M Improve data reporting enforcement procedures for the monthly and annual enterprise surveys H Implement formal data coordination through developing or updating memoranda of understanding (MOU) with key data providers M Implement a data quality assurance framework. Institutional infrastructure and operational capacity to compile national accounts improved. Improved survey response rates and quality of reported data; by redesigning the sample and improving follow-up procedures. Comprehensive MOU on data sharing and classifications with key data providers in place; and effectiveness of coordination and data sharing increased. Data quality assurance framework implemented. Completion Date 12/31/2021 Assumptions/ Implementation Status 12/31/2018 GBS to request PRASC TA. 12/31/2017 Need to implement or revise the MOU for key data providing agencies. GBS to request PRASC TA. 12/31/2019 Continue collaboration with the
9 8 DQAF Priority Outputs Verifiable Indicators H Increase GBS staffing by two prices and two economic statisticians by January 2019; and review alignment of GBS staff with operational and development workloads H Train the GBS staff on the use of improved source data and compilation methods H Secure additional budget and development partner financing to implement the project (i.e., expanding and improving data collection, compilation and dissemination) H Secure additional TA from PRASC and any other interested development partners in order to implement the project H Establishment of the Technical Committee of key data providers and users to improve data coordination/project implementation. 3.1 H Ensure appropriate source data are available to compile the SUT, expand the national accounts and rebase the GDP H GBS to update business register using the Establishment Census data for H GBS to gross up the 2015 enterprise survey responses using the updated register. GBS staffing increased and staff redeployed in line with forward work plan requirements. Staff has the appropriate capacity and skills to compile expanded and improved statistics. Additional financing secured for the project. Additional TA secured for the project. Technical Committee established and meeting on a quarterly basis. The required source data are available and fit for use. Completion Date Assumptions/ Implementation Status CARICOM Secretariat. GBS to request PRASC TA. 01/31/2019 GBS to recruit a prices and an economic statistician in both January 2018 and January /31/2021 Ongoing. In-house training; CARTAC and PRASC TA. 12/31/2018 Expect financing to increase in line with the expanding work program. 12/31/2018 GBS to request PRASC TA. 12/31/ /31/2021 Business register updated. 04/30/2017 Revised production estimates for 2015 produced. 05/31/2017
10 9 DQAF Priority Outputs Verifiable Indicators H Extract data from the 2012 Census and the annualized LFS to compile informal sector production estimates H Extract data from the 2012 Census and the HBS to compile estimates of subsistence farming and production for own consumption H Collect additional data and ratios for crops, livestock, forestry and fisheries H Collect construction industry data to produce adjustment factors and indicators H Conduct trade and freight transport margins studies to produce adjustment factors and indicators H Collect expanded merchandise commodity and trade in services data from the CBS H Improve data sources, price indices and indicators used to compile annual GDP-P estimates H If necessary, improve the Consumer Price Index (CPI) data collection and compilation methodology H Produce the Producer Price Index (PPI) for mining and quarrying, manufacturing and utilities (including the BPI) H Produce export (XPI) and import (MPI) price indices using unit-value trade data H Improve data sources and indicators needed to compile annual GDP-E in current and constant prices. Informal sector estimates of output, IC and GVA compiled. Estimates of subsistence farming and production for own consumption compiled. I/O ratios for crop groups, average price and live carcass weight, farm slaughter and other data collected. Adjustment factors and indicators available for construction industry. Adjustment factors and indicators available for trade and transport margins. Expanded merchandise trade and trade in services data collected. Improved annual enterprise survey; and access to and quality of administrative data improved. Completion Date 06/15/ /15/ /31/ /31/ /15/2017 Assumptions/ Implementation Status 05/31/2017 GBS to request the data from CBS. 06/30/2018 Request PRASC TA for enterprise survey. CPI improved. 06/30/2018 CARTAC to provide advice during August 2017 mission. PPI and BPI compiled. 06/30/2018 CARTAC to provide advice during August 2017 mission. XPI and MPI compiled. 06/30/2018 Request PRASC TA. The indicators are representative and provide adequate coverage for each expenditure component. 06/30/2018
11 10 DQAF Priority Outputs Verifiable Indicators H GBS to work with relevant agencies to establish the Integrated Business Register (IBR) H Availability of data sources and indicators needed to compile quarterly GDP-P at current and constant prices M Improve classification and quality of International Merchandise Trade Statistics (IMTS), as needed H Conduct of the Agriculture Survey by Agriculture Department for reference year 2018 onward H Conduct of the Fisheries Survey by Fisheries Department for reference year H Conduct of the HBS for reference year 2019/20, including the Informal Sector Survey module H Conduct of the large-scale Enterprise Survey, including all the large NPISHs for reference year H Expand and improve compilation, including the SUT and rebase the GDP. IBR established, with continuous feedback and updating of ceased and new businesses. Quarterly enterprise survey data improved; and other indicators are representative and provide good coverage for economic activities. Data classification and quality of IMTS improved; and data extracted for compilation purposes. Survey conducted and output data available. Survey conducted and output data available for compiling the 2020 SUT estimates. Survey conducted and output available for compiling the 2020 SUT estimates. Survey conducted and output available for compiling the SUT estimates. National accounts statistics expanded, improved and rebased H Further develop the 2015 SUT template. SUT product and industry list developed H Amend the 2018 SUT templates, as appropriate, based on feedback from data users and providers. SUT activities and products modified, as appropriate. Completion Date Assumptions/ Implementation Status 06/30/2019 Request PRASC TA. 12/31/2019 Expect to use quarterly enterprise survey and regulatory data for compilation. 03/31/2018 PRASC TA. 12/31/2019 PRASC TA. 12/31/2021 PRASC TA. 12/31/2021 PRASC TA. 12/31/2021 PRASC TA. 09/30/ /17/2017 Draft frame developed during CARTAC mission. 07/31/2017 Request PRASC TA.
12 11 DQAF Priority Outputs Verifiable Indicators H Improve the methodology for compiling annual GDP-P at current and constant prices H Fill in the I-O and SUT sector and total tables with the initial estimates H Adjust initial estimates to overall size of the different activities using the employment, turnover and other control data. Annual GDP-P methodology improved. Tables compiled using initial estimates. The initial estimates adjusted to the overall size of the different activities H Balancing of the SUT estimates. SUT balanced and finalized BM estimates produced H BM estimates incorporated into the redeveloped compilation system H Redevelop the national accounts compilation system with 2015 base year H Compile the rebased annual GDP-P estimates H Compile annual GDP-E at current and constant prices H Rebased GDP 2015 series linked to the 2007 series H Compile quarterly GDP-P at current and constant prices. 4.0/5.0 H Improve dissemination of national accounts H Release of improved annual GDP series by economic activity at current and constant 2007 prices. Completion Date Assumptions/ Implementation Status 08/30/2018 Review completed. CARTAC TA. 03/31/2018 PRASC TA. 05/31/2018 PRASC TA. 07/31/2018 PRASC TA. CARTAC to review final estimates. BM estimates incorporated. 07/31/2018 CARTAC and PRASC TA. Compilation system redevelopment 07/31/2018 CARTAC and completed. PRASC TA. Rebased GDP estimates compiled. 08/31/2018 CARTAC TA. Annual GDP-E methodology developed and estimates compiled. 08/31/2018 Methodology developed. GBS to request PRASC TA. Linked series compiled. 09/15/2018 CARTAC and PRASC TA. Quarterly GDP-P at current and 08/31/2020 Review completed. constant prices compiled. CARTAC TA. Dissemination of national 09/30/2020 accounts improved. Improved annual GDP series 08/31/2017 Implement shortterm disseminated. improvements as recommended.
13 12 DQAF Priority Outputs Verifiable Indicators H Release of rebased 2015 series by economic activity based on ISIC Rev. 4 and by expenditure H Release of quarterly GDP by economic activity at current and constant 2015 prices H Release national accounts concepts, sources and methods manual. Rebased 2018 GDP series disseminated via press release, publication and website. Quarterly GDP by economic activity at current and constant 2015 prices disseminated. Updated national accounts manual disseminated. Completion Date Assumptions/ Implementation Status 09/30/2018 CARTAC and PRASC TA. 09/30/2020 CARTAC TA. 09/30/2020 CARTAC and PRASC TA. Priority Scale: H - High M - Medium
14 13 I. INTRODUCTION 1. In response to a request from the General Bureau of Statistics (GBS) of Suriname and in consultation with IMF s Western Hemisphere Department (WHD), the Real Sector Statistics Advisor (RSA) at the Caribbean Regional Technical Assistance Centre (CARTAC) undertook a technical assistance (TA) mission to Paramaribo during February 7 17, 2017, to review and provide advice on improving the national accounts of Suriname, including consistency with the System of National Accounts 2008 (2008 SNA). 2. The GBS currently produces annual estimates of GDP by economic activity (GDP-P) at current and constant 2007 prices; as well as annual current price estimates for GDP by expenditure (GDP-E) that are broadly consistent with the System of National Accounts Annual estimates of Gross National Income and Gross National Disposable Income are also compiled. Quarterly GDP estimates are not compiled. The other real sector statistics being produced on a regular basis is the monthly Consumer Price Index (CPI) and the quarterly labor force statistics. Annual population estimates/projections distributed by age and gender are also produced. While the GBS is also responsible for producing the International Merchandise Trade Statistics (IMTS), these are currently compiled by the Central Bank of Suriname (CBS). 3. Advice was provided to the Director in relation to meeting the Enhanced General Data Dissemination System (e-gdds) requirements for real sector statistics. The GDP estimates need to be rebased to a more contemporary base year (i.e., 2015); and independent annual estimates of GDP-E at current and constant prices need to be produced. In addition, the e-gdds encourages production of quarterly GDP at current and constant prices, a monthly Producer Price Index (PPI) and a monthly production volume index, as relevant. The Director is considering the development of the quarterly GDP and a quarterly PPI. The GBS will also need to include an advance release calendar on its website. 4. The mission reviewed and provided advice to improve the annual GDP-P and GDP-E estimates, and to develop the quarterly GDP-P methodologies. In addition, advice was provided on the methodology and source data to be used in compiling the supply and use tables (SUT), and in rebasing the GDP to Training was provided to the GBS staff on the recommended changes in data sources and methodologies, and a medium-term action plan to improve, rebase, and expand the national accounts was drafted (see previous section). A draft timetable was also prepared. In addition to increased budget and staffing, further staff capacity building is required. 5. In terms of the way forward, the GBS is expected to implement the recommendations of the mission progressively over a five-year period. Improvements in methodology and 2008 SNA changes that can be implemented using existing source data will be made for the 2007 GDP series and with the
15 14 rebasing of the GDP to the 2015 base year; while those requiring additional data collection and further investigation will need to be implemented following the rebase. The Director is expected to share the mission s final report and arrange missions with Statistics Canada as part of the Project for the Regional Advancement of Statistics in the Caribbean (PRASC) project. Statistics Canada will be requested to assist with the quality assuring the various administrative and survey data to be used in compiling the SUT, development of the GDP-E methodology and the SUT compilation. CARTAC will provide remote TA as needed. A follow-up CARTAC mission is tentatively planned for August 2018 to review the balanced 2015 SUT and help finalize the rebased annual GDP estimates for dissemination. 6. To assist the reader, this report includes an Executive Summary on the main findings and a draft Action Plan. Following this introduction, Section II provides an assessment of the statistics prerequisites and recommended improvements. Section III includes the main findings and recommendations to improve data sources; and Section IV outlines the development of the SUT framework. Section V includes the main findings and recommendations to expand and improve the GDP-P estimates; while Section VI includes the main findings and recommendations to further develop the GDP-E estimates. A draft timetable is provided in Appendix I. An assessment of data sources is provided in Appendix II; while the detailed findings and recommendations to improve the annual and develop the quarterly GDP-P estimates are included in Appendix III. The proposed list of products and industries for the 2015 SUT is provided in Appendix IV. II. STATISTICS PREREQUISITES A. Legal and Institutional Environment 7. A review of the statistics capacity and infrastructure of the GBS was completed during the mission. The Statistics Act for Suriname assigns primary responsibility as well as the authority to the GBS for the collection, processing, and dissemination of real sector statistics as well as a wide range of other economic and socio-demographic statistics. Current working arrangements are largely consistent with its areas of responsibility. There are a number of other statistics producing units within government, for example, the CBS produces external sector and financial sector statistics; and the Ministry of Finance (MOF) produces the fiscal sector statistics. Individual reporters data are kept confidential and used for statistical purposes only. 8. While the legislation provides for mandatory reporting the GBS s approach is to rely on creating goodwill to improve response rates. However, this does not appear to be producing the desired results as the response rates for the Quarterly National Accounts Survey (QNAS) averages around 40 percent and the Annual National Accounts Survey (ANAS) averages around 65 percent. The GBS is aware of the need to strengthen the legislation, especially the penalties for non-compliance, and to enforcement in order to improve response rates. Data sharing between the
16 15 various agencies and the GBS needs to be strengthened and formalized using memorandum of understanding (MOU). The GBS currently has MOU with the CBS, Planning Office and Tourism Foundation that may need to be reviewed and updated. The MOU should allow for support by the GBS on classifications, standards and methods; more regular contact through technical working groups; improving understanding of data requirements; and avoiding duplication in order to reduce reporting burden. There is also a need to work with the key data providing agencies on developing the Integrated Business Register (IBR). Given that the quality of the national accounts is directly related to the adequacy in coverage and quality of administrative and survey data; no GBS censuses or surveys should be designed without the input of the national accounts team. The team has the ability to assess quality and data gaps by reviewing supply and use, as well as linkages to other macroeconomic indicators that survey staff focusing on one topical area may not. Recommendations Amend the legislation to strengthen penalties and streamline enforcement for non-compliance. Provide a pamphlet to new survey units identifying the uses of the data requested. Provide survey respondents with industry specific output and intermediate consumption (IC) and compensation of employees (COE) data (i.e., so they can calculate market share, industry cost ratios) in order to help improve response rates. GBS censuses or surveys should not be designed or conducted without the input and sign-off of the national accounts team. Access to data from within the GBS by national accounts compilers should be routine and not require Director level approval. Establish a technical working group on economic statistics that meets quarterly to improve data coordination for national accounts and improve internal access to GBS data for national accounts compilers. Update the memorandum of understanding (MOU) between the GBS and the CBS and establish MOU with all other key data producing agencies (e.g., Agriculture Department, Customs, Fisheries Department, Tax Department). B. Staff Capacity and Other Resources 9. While the current staffing level for the national accounts compilation is adequate, the staffing and other resources of the GBS for data collection and producing economic statistics are inadequate. Regular updating of the business register; expanding data collection for the PPI, including the Building Inputs Price Index (BPI); producing the BPI, PPI, exports (XPI) and imports (MPI) price indices; and redeveloping and improving the national accounts compilation systems and worksheets will require additional budget and four statisticians. While the national
17 16 accounts compilers have some experience in compilation work, there is a need to strengthen their technical knowledge and system development skills. More time needs to be spent on introducing methodological improvements, undertaking more data analysis, and quality assurance of the estimates. 10. Some of the GBS economic statisticians have benefited from training workshops on national accounts and prices statistics provided by the CARTAC and other technical assistance (TA) providers over recent years, and this training will continue to be provided in the future. However, these staff members require additional training on 2008 SNA implementation issues. In order to improve compilation and to undertake further development work, it will be necessary to build the capacity of the newer staff members. Office facilities and space, Internet access, computers, and other equipment are generally adequate but will need to be increased in line with the recruitment of additional staff. Recommendations Recruit a prices statistician and an economic statistician in both January 2018 and January Introduce more selective editing to reduce staff workloads given that Customs is also auditing import manifests for outliers. GBS approach Statistics Canada to assist with developing a quality assurance framework to strengthen the staff focus on data quality. 1 Build staff capacity through in-house coaching and mentoring, having alternate compilers checking and studying the worksheets updated by the compiler responsible, and conducting 1 2 hours training sessions on a weekly basis. C. Financing and Technical Assistance 11. The current funding for data coordination, necessary survey activities and improving economic statistics is inadequate. As mentioned earlier, there is a need to increase staffing and funding to expand the range of statistics and associated data collection activities. The current funding model for the GBS requires bidding for additional resources for each major survey like the Household Budget Survey (HBS). This can often result in delays in financing that then adversely impacts on the frequency of the rebasing of the CPI and GDP. The implementation of a continuous survey program, with one large survey each year is recommended. Specifically, this would involve a five-yearly cycle of conducting an Integrated Labor Force/Informal Sector Survey, Establishment Census, HBS, National Social Survey (e.g., education, health), and the Census of Population and Housing (Census) or the Inter-Census Demographic Survey. This approach would smooth out the GBS s funding requirements (except for the Census). It would provide more certainty in terms of rebasing the CPI and GDP, as well as meeting the benchmark monitoring needs of 1 The IMF s Data Quality Assessment Framework should be one of the reference documents used in developing the GBS s data quality assurance framework.
18 17 various key data users (e.g., Sustainable Development Goals) and policymakers on a regular basis. 12. In addition, several recommendations have been made to expand and improve the regular data collection, including improving the ANAS and QNAS. Establishing MOU with the main data providing agencies will involve assisting these agencies with improving registration, classifications, data quality assurance and developing reporting templates; as well as developing the IBR. All of these data collection and coordination activities will require additional financing and TA. In addition to the expectation of the PRASC providing remote TA and TA missions on compilation, data collection and dissemination, CARTAC is expected to undertake around 4-5 national accounts and prices statistics missions to assist with implementing the medium-term action plan (subject to the authorities providing the additional staffing, financing and other resources). However, further technical support will need to be secured from other TA providers (e.g., US Department of Agriculture) to assist with surveys for the agriculture and fishing industries. Recommendations Increase the GBS budget in 2018 and 2019 to cover additional data collection, coordination and staffing costs for this project. Secure budget and implement a continuous survey program, with one large survey each year. Secure PRASC TA to assist with improving the business register, enterprise and household surveys; quality assuring the output data; compilation of the SUT and GDP-E estimates; and development of the XPI and MPI. III. DATA SOURCES 13. The mission reviewed the data sources (i.e., annual and subannual value, volume, indicator and prices data) that are available for use and/or are used for national accounts compilation purposes and identified areas for improvement. The limited budget of the GBS has constrained data collection and the development of a coordinated national statistical system. There is scope to expand data collection and to improve response rates. 14. The proposed data strategy is to make greater use of administrative data and conduct benchmark (BM) studies and surveys to address data gaps in compiling SUTs and BM estimates going forward. The benchmark-indicator approach is to be implemented for the ongoing annual and quarterly compilation, leveraging administrative datasets, using the GBS surveys to address data gaps and in order to adjust the administrative data to align with the 2008 SNA concepts and definitions. The main data sources reviewed during the mission are discussed in Appendix II of the report.
19 18 Recommendations Assist key data providing agencies to improve the classifications and quality of administrative data systems. Make greater use of administrative data from regulatory agencies. Develop the IBR in coordination with the Tax Department, business licensing agencies and CBS in order to facilitate continuous updating of the register. Implement data collection for the BPI and PPI, redesign the ANAS and QNAS samples and questionnaires, and strengthen response follow-up procedures. Conduct of a five-yearly cycle of BM studies and surveys needed to compile the SUT and in rebasing the CPI and GDP. IV. SUPPLY AND USE TABLES 15. The current GBS staff does not have experience in producing SUTs. There is an urgent need to rebase the GDP estimates from the 2007 base year to the 2015 base year. Given current resource constraints, it is possible that a SUT for the whole economy, based on product commodity flow balances and industry balances; and the input-output matrix can be compiled. There is insufficient source data to produce satellite accounts (e.g., tourism) or institutional sector accounts. 16. The SUT developed by previous CARTAC missions in 2015 was reviewed. It is essentially a commodity flow framework without the input-output matrix. The intention was to use the SUT to produce annual balanced estimates of GDP-P and GDP-E. However, this has not been possible to do in a timely manner due to staff and source data constraints (e.g., timeliness issues, data gaps). There are 2,342 products classified by the Central Product Classification, Version 2 (CPC) and 32 industries classified according to the International Standard Industry Classification of All Economic Activities, Revision 3 (ISIC Rev. 3). While it is necessary to use the CPC to align the different classification systems used for the Customs imports and exports, and detailed HBS data; the products cannot be balanced at that level as production and Government consumption data are not available at that disaggregated level. The CPC products are aggregated to 32 product groups according to the Classification of Products by Activity (CPA). While this makes product balancing much easier, there is not enough detail. 17. In order to adapt the SUT for use in producing the 2015 BM estimates, a list of 164 product groups based on the CPA and 127 industries based on the ISIC Rev. 4 was developed during the mission. The current industry gross value-added (GVA) estimates are based on ISIC Rev. 3 and the intention is to redevelop the compilation worksheets to align with ISIC Rev 4 and 2008 SNA requirements. The process of implementing the required changes was discussed during the mission. 18. The RSA provided training on compiling the SUT, product balance and industry balance worksheets. Separate SUT templates have been provided in Excel
20 19 for corporations, Government, non-profit institutions serving households (NPISHs), households and the rest of the World, and the whole of the economy; as well as templates for industry balances and product balances to be used by the compilers to develop worksheets for each product and economic activity. The aggregation process and main SUT templates were demonstrated. A copy of the new SUT balancing software developed by the IMF s Statistics Department was also provided. 19. The compilation of the industry balances was explained. That is, compiling output, IC and GVA by institutional sector for each industry to derive total industry output and IC estimates that can then be reconciled with the same aggregates derived from the product balances. The product balances are compiled using the commodity flow approach at basic and purchaser prices for each product that can then be aggregated to get the total flow components for the whole economy. The need to be as detailed as the available source data can support in terms of selecting industries and products; and to ensure outputs from one industry used as inputs to other industries are clearly identified was explained. 20. The mission assessed data availability and provided advice on the input data needed to compile the 2015 SUT estimates. The main data gaps were identified and advice provided on the additional BM studies that will need to be conducted. The SUT will be compiled using the external trade data; 2013/14 HBS expenditure data that needs to be price and volume adjusted to 2015, and 2012 Census of Population and Housing data to update the household final consumption expenditure (HFCE) estimates; the 2015 ANAS and Labor Force Survey (LFS) data; external sector and financial sector data from the CBS; and Government accounts data from the MOF. 21. In order to improve coverage for the informal sector, the proposed approach is to calculate values per informal sector worker by industry multiplied by the number of these workers. The LFS and 2012 Census data can be used to identify own-account workers. The data per worker by industry will then be multiplied by the number of informal sector workers (i.e., own-account workers with or without unpaid family workers) from the 2012 Census rated forward to 2015 using the LFS data. The 2013/14 HBS is expected to provide partial estimates for backyard and other production for own consumption. The coverage of illegal activities can be improved using information from Customs and the Police Departments, on the value and quantity of drug seizures and percentage estimates of seizures compared to the estimated supply. The police would also be a good source of information on other illegal activities. In addition, legal betting/gambling establishments may be able to provide information on the level of illegal gambling. It is better to develop conservative estimates, given the limited data available for use. Recommendations Calculate freight transport margins and trade margins using CPI prices and equivalent import and producer prices. Update the BM ratios for construction project inputs and mark-ups.
21 20 V. GDP BY ECONOMIC ACTIVITY 22. The compilation methodology and worksheets for producing the annual GDP-P estimates were reviewed during the mission. There is considerable scope to improve the annual compilation methodology. The detailed findings and advice on improving the annual and developing the quarterly GDP-P estimates are provided in Appendix III. 23. Most of the data required to compile the quarterly GDP-P estimates are being collected. However, access to these data and the timeliness of providing the data to the national accounts compilers needs to be significantly improved. Most of the industry estimates are to be compiled using single value (e.g., QNAS output data) or volume indicators (e.g., output quantities, LFS employment) benchmarked to the annual output and IC estimates using the Excel Proportional Denton Method Benchmarking software. The resulting estimates are to be deflated or reflated using relevant CPI, PPI or other price indices and benchmarked to derive the equivalent constant price value (KPV) or current price value (CPV) estimates. A more disaggregated commodity flow approach will be used for the construction industry and wholesale and retail trade. 24. As far as possible, an integrated compilation system for producing the annual and quarterly GDP-P estimates is to be developed. In addition, the RSA explained that all compilers should use the same input data files for the various industry and expenditure component compilation workbooks, for example, 2015=100 price indices developed using the BPI, CPI, MPI, PPI and XPI; other current price indicators; and population, employment and other volume indicators to be used in compiling the annual and quarterly estimates. This will ensure consistent use of survey data, price indices and indicators. The quarterly indicators would still be benchmarked to the more comprehensive annual estimates. However, where subannual indicator and prices data are being used to compile the annual estimates, the quarterly estimates would be compiled first with the annual estimates being the sum of the relevant quarterly estimates. 25. The dissemination of the annual estimates can be improved by adding separate tables on output and IC by economic activity in current and constant prices; tables of implicit price deflators for GVA, output, and IC; and revision tables. In addition, the metadata documentation of the annual national accounts concepts, sources and methods needs to be updated and disseminated via the GBS s website. Recommendations Rebase the GDP-P estimates to the 2015 base year in order to compile KPV estimates using contemporary industry cost structures. Discontinue the use of fixed IC to output ratios for CPV estimates. Develop composite weighted IC price indices, using the weights based on 2015 SUT input-output matrix to select at least 5 6 adjusted CPI/PPI-based price
22 21 indices, to reflate the KPV IC to derive the CPV IC estimates or to deflate CPV estimates to derive the KPV estimates. Transition from ISIC Rev. 3 to ISIC Rev. 4. Revise the industries for which annual estimates are compiled, including increasing the level of detail that services industry estimates are compiled (e.g., business and personal services), while ensuring compilation is still done at a minimum two-digit ISIC Rev. 4 level for all relevant industries. Use the benchmark-indicator approach to extrapolate the BM estimates using partial data as value and volume indicators, instead of attempting to develop actual annual estimates by adjusting the partial data using limited information. Converting business financial year data to calendar year using subannual indicators (e.g., revenue) and benchmarking. Introduce the 2008 SNA work-in-progress (WIP) methodology for construction in the 2015 GDP series and for agriculture in the medium-term. Improving the coverage of the informal sector activities in the 2015 GDP series; and production for own consumption of non-agriculture produce and illegal activities (where feasible) in the medium-term. Revise the current trade margins applied in the construction and trade worksheets. Implement the 2008 SNA methodology for calculating financial services indirectly measured (FISIM) and improve its allocation by industry and expenditure component. Split out non-profit institutions serving households (NPISHs) production by economic activity. Implement volume extrapolation of deflated imports and outputs at a more detailed level to derive taxes on products in constant prices. VI. GDP BY EXPENDITURE 26. The GBS compiles annual GDP-E estimates at current prices, with private consumption derived as a residual. This private consumption residual includes elements of gross fixed capital formation (GFCF), changes in inventories, as well as final consumption expenditure (FCE) by NPISHs. Several of the 2008 SNA recommendations need to be implemented (e.g., biological assets, artistic originals) as part of the development process. The mission conducted a training session on the concepts, data sources and methodologies for compiling estimates of various expenditure components. Further assistance on developing the GDP-E methodology and worksheets, and producing the estimates is to be requested from the PRASC project.
23 The difference between the sum of the GDP-E components and GDP-P is the statistical discrepancy. Given the GDP-P estimates are more robust than those for the expenditure components, the discrepancy should be shown explicitly on the expenditure side. This provides transparency to data users that the GDP-P estimates are more robust than the GDP-E estimates, as well as demonstrating the need to increase budget and staffing in order to address input data limitations. A. Government Final Consumption Expenditure 28. The Government final consumption expenditure (GFCE) CPV estimates are based on Government accounts data, to which an estimate for FISIM is added. Sales revenue needs to be deducted from output. The KPV GFCE estimates are to be derived by adding the deflated components. The KPV estimate for compensation of employees (COE) can be derived by deflating the CPV estimate using the weighted wage index. The KPV estimates would be derived separately for consumption of fixed capital (CFC) and IC components (to include FISIM) at a more detailed level. The detailed expenses on other goods and services in the Government accounts should be aggregated into broad expenditure groups with the best proxy adjusted CPI (i.e., 2015 = 100) used to deflate the estimates to derive the KPV estimates. 29. Advice was provided on developing a new workbook including the detailed estimates of Government output, IC, GVA (to include CFC) and GFCE by Classification of the Functions of Government and ISIC Rev. 4 based on Government accounts data. 30. For example, the relevant prices indices could be used to deflate CPV estimates of electricity (CPI electricity), water (CPI water charges), supplies and materials (goods CPI), communications (CPI for communications); buildings and roads repairs and maintenance (construction industry implicit price deflator (IPD)), vehicle maintenance and repairs (CPI for vehicle repairs and maintenance), actual rents CPI for rental of assets (as this is mainly rental of office space), insurance CPI for insurance, land transport CPI for local travel, air transport CPI for international travel, CPI education for training, restaurants IPD for hosting and entertainment, a services CPI for professional and other services, and the goods CPI for other/sundry expenses. The deflators should be discussed with the MOF before use. The CPV and KPV estimates for GFCE would then be derived by deducting Government sales revenue from the Government output estimates at the function/industry level, using the IPD for Government output to deflate Government sales to derive the KPV sales estimates. B. Final Consumption Expenditure of NPISHs 31. Separate estimates of FCE by NPISHs are not currently compiled. The CPV estimates can be produced using the output estimates that are currently compiled using data from the ANAS, adjusted for sales data. The KPV output estimates can be
24 23 derived by deflating the CPV COE estimates using a wage index and a composite price index be used for IC to deflate the CPV estimates to derive the KPV estimates. C. Household Final Consumption Expenditure 32. The CPV estimates are derived at the 1 to 2-digit level of the Classification of Individual Consumption According to Purpose (COICOP) using average expenditure per household in 2007 multiplied by the number of households adjusted for CPI price changes or a broad level commodity flow approach. Both methods overestimate HFCE. The first method assumes poorer rural households in the interior have similar expenditure to richer coastal households. The second method includes tax rates and trade margins that are not adjusted to reflect actual tax collected or the percentage actually purchased from traders as opposed to purchases directly from producers. It also assumes no compositional change and that a fixed proportion of each group of good and services being supplied is HFCE (based on the base year weights) as it is derived as a residual. The method also assumes that the supply side estimates are correctly calculated and that the proportion of other uses of each product does not change. In addition, compositional change in urban and rural household numbers is not accounted for (i.e., net migration from rural to urban areas). 33. It is recommended that the HFCE estimates be compiled independently for the 2015 GDP series, using relevant value or volume indicators to extrapolate the base year estimates using the detailed COICOP (4-6 digit) rather than using a commodity flow approach directly. 34. The mission provided an HFCE template that can be used to compile separate CPV and KPV estimates of own-produced, domestically produced purchases, and purchases of imported goods and services at the detailed COICOP level. The commodity flow approach at a more detailed product level can be used to derive value indicators that can be used to extrapolate the benchmark estimates. The available sources need to be investigated to assess feasibility, including the detailed value (e.g., data on sales to residents from utility companies) and volume (e.g., household formation, population by gender, electricity connections, student enrolments) to produce the annual estimates. The same approach could be used in developing the quarterly estimates, with the annual estimates then being compiled by summing the relevant quarters estimates. 35. For consumption of own-produced goods, the CPV and KPV estimates can be compiled using the CPV and KPV output for the relevant agriculture, forestry, fishing and manufacturing industries as the value and volume indicators. The same approach would be used for owner-occupied dwellings. 36. For purchases of domestic produced goods and services, the KPV estimates can be compiled using the KPV output from the production side at the detailed industry level as volume indicators to extrapolate the base year estimates, and then reflate using the relevant CPI to derive the CPV estimates. That way the KPV
25 24 estimates reflect the base period margins for goods and product taxes. As the CPI would include any changes in margins and product taxes, reflation to derive the CPV estimates would reflect these changes. 37. Imports valued at c.i.f. adjusted for re-exports, classified according to the detailed Standard International Trade Classification can be used to derive the relevant imported consumer goods estimates that could be used as value indicators in the compilation of the CPV estimates for the imported component. The c.i.f. values would need to be adjusted for import duties, excise and other product taxes and fees; and trade margins. The imports of services would be based on the balance of payments estimates. The detailed CPI would then be used to deflate these estimates to derive the equivalent KPV estimates. D. Gross Capital Formation 38. The GFCF estimates are based on the ANAS output data. However, the level of reporting of GFCF is inadequate. The estimates can be improved by compiling the estimates using the commodity flow approach at a more detailed product level. The construction GFCF should be compiled by adjusting the output by deducting repairs and maintenance and adding relevant taxes and transfer of ownership costs. The same methodology can be used to compile the annual and quarterly estimates. Ownproduced GFCF for agriculture (e.g., dams, fences, irrigation canals) also needs to be included as farmers may not use modern building materials. Improvements to the methodology for calculating construction output and deflating the CPV estimates are discussed in the construction industry section in Appendix III. 39. For machinery, transport and other equipment, the CPV estimates can be improved by adding imports and domestic production of capital goods plus taxes and margins, less exports and HFCE, at a disaggregated product level. The KPV estimates can then be derived by deflating the detailed CPV commodity values using the relevant MPI. As there are likely to be significant variations in the unit valuebased MPI indices, the unit values will need to be trimmed for outliers. 40. The production output relating to mining and petroleum exploration needs to be added to GFCF. The estimates for biological assets, for example, breeding livestock and fruit trees; intellectual property products; database and software development; artistic originals; and any scientific research and development will need to be compiled in the production worksheets and then used here. The GBS will need to work with the Agriculture Department to develop the WIP compilation methodology needed to compile the estimates for biological assets. 41. The CFC estimates can be compiled by adjusting the depreciation data from the ANAS and using the perpetual inventory model (PIM). The survey data along with data on net imports of various industry specific machinery and equipment and loans can be used to develop a detailed PIM to compile estimates of the stock of GFCF by activity and then apply CFC rates to derive the CFC estimates. In the short
26 25 term, it may be possible to develop estimates of CFC using percent ratios, based on the estimated useful age of the assets, applied to the GFCF estimates by type of building and structure, machinery, equipment and other durables. 42. For inventories, data on changes in inventories reported on the ANAS forms or extracted from financial statements can be included but should not be grossed up using the business register turnover data unless the response rates are over 90 percent. As the Agriculture Department annual bulletin includes inventories of livestock numbers by type of animal, it should be possible to calculate changes in inventories for livestock. 43. The estimates for acquisition less disposals of valuables can be compiled using the commodity flow approach, using the external trade, HBS, ANAS and Government accounts data for the 2015 SUT. The GBS view is that households do not hold precious gems, metals or jewelry as a store of wealth. Quarterly imports of precious metals and stones, antiques and collectibles (adjusted for international visitors purchases) can be used to extrapolate the base year estimate to derive the quarterly CPV estimates. The general CPI can be used to deflate the CPV estimates to derive the KPV estimates. E. Exports and Imports of Goods and Services 44. The CPV estimates for imports and exports of goods and services are compiled using the Customs trade data and balance of payments services credits and debits estimates. It would be better to use the CBS merchandise trade data as it is adjusted for change of ownership, coverage and timing. The FISIM on exports and imports need to be included in services credits and debits. There is a need to conduct regular surveys to collect expenditure data for resident expenditure abroad. 45. The KPV estimates for goods can be compiled using unit value-based MPI and XPI. As the travel credits are to be allocated across products in the HFCE compilation, the relevant product level CPI should be used for deflation purposes. 46. For imports of freight and insurance services, cargo volumes of imports could be used as volume indicators to extrapolate the BM estimates to derive the KPV estimates. A weighted price index of the CPIs for the main countries visited abroad can be used to deflate travel debits. For other exports and imports of services, the equivalent implicit price deflator from the production worksheets can be used. 47. There is a need to collect balance of payments income and services data by predominant country from the CBS. This would help identify the main partner countries and weighted price indices that can be developed using the relevant price indices for those countries, as well as identifying the most relevant inter-bank lending rate to apply to FISIM imports.

27 Appendix I. Draft Timetable 26
28 27 Appendix II. Assessment of Data Sources 1. The mission reviewed the data sources that are available for use and/or are used for national accounts compilation purposes and identified areas for improvement. The main data sources reviewed during the mission are discussed in this section of the report. Administrative Data 2. A wide range of administrative and regulatory data are being produced by various Government agencies and departments that are being used or could potentially be used by the General Bureau of Statistics (GBS), including agriculture and fisheries data for the Agriculture and Fisheries Departments; foreign trade, cargo and shipping data from the Customs Department; balance of payments and banking data from the Central Bank of Suriname (CBS); and fiscal and tax revenue data from the Ministry of Finance (MOF). The mission met with representatives from the Agriculture Department, Fisheries Department, Customs Department, CBS and the Tourism Foundation to discuss data coverage, classification, quality and sharing arrangements. The meetings were useful in identifying new data that can be used to improve the national accounts (e.g., updated intermediate consumption-output (I/O) ratios). Agriculture Department data 3. The routine data collection system promoted by the Food and Agriculture Office (FAO), using agriculture extension officers, is used by the Agriculture Department to collect data on crop production quantities; and area cultivated. The data are used to extrapolate the 2008 Agriculture Census benchmark estimates. The coverage of the data collection is limited to the coastal areas but does include subsistence farming. The Department also conducts an annual survey of fruit and vegetable growers but this was last conducted in Intermediate consumption (IC) and labor costs data are not collected. Prices are collected from farmers and assumed to be farm-gate, although some farmers do sell their produce directly to final consumers. The Department provides data to the GBS on an annual basis but has subannual data. 4. The GBS will need to meet with the Department s technical staff to collect updated I/O ratios for the three major crop groupings being used. The data for the rural coastal areas needs to be used to ratio estimate production in the interior based on average production and 2012 Census data on farming households; the production data needs to be checked to see if it is adjusted for post-harvest loss; as backyard production for own consumption is not covered, it will need to be estimated using the 2013/14 Household Budget Survey (HBS) and the 2015 Supply and Use Tables (SUT). In addition, the Department should be requested to provide quarterly production data.
29 28 5. The RSA advised that the conduct an ongoing large-sample Seasonal Agriculture Survey would provide more accurate and complete data at around the same cost as an Agriculture Census over a 10-year period. The US Department of Agriculture multi-cropping area sample survey implemented in Ethiopia and Rwanda was explained and the Department was encouraged to discuss this option with the FAO and the US Department of Agriculture. 6. In addition, the mission discussed the development of work-in-progress (WIP) estimates and requested crop calendar and cost structure data by major crop type to develop the estimates. Given that there is abundant rainfall and adequate irrigation, production is continuous for most fruit and vegetables, so the WIP methodology is not required. However, there are a few crops like onions and yams that are seasonal and the Department should be requested to provide the crop calendars and cost data to the GBS staff. The need to develop gross fixed capital formation (GFCF) estimates for fruit trees was also discussed. The main difficulty is that most trees are not in orchards, being planted and not necessarily cared for in backyards. It is suggested that the GBS staff work with the Department staff to develop the WIP estimates for inclusion in the 2020 SUT. The mission recommended using the next Population Census to collect data on number of fruit trees (by type) owned by households. 7. The Livestock Division provides annual data to the GBS on estimated stocks and animals slaughtered (i.e. cattle, goats, sheep and pigs); as well as poultry (i.e. broilers and layers) and eggs production. The livestock inventories and poultry are estimated using a basic perpetual inventory method (PIM). FAO is assisting the Division to collect data to develop the standard FAO PIM over the next year. Cost structure and related data are collected from the main producers or estimated at the industry level using known output and imported (e.g., animal feed) inputs. The current estimated I/O ratios for cattle are 75 percent; sheep and goats, 44 percent; pigs, 80 percent; and poultry, 50 percent. 8. The latest surveyed inventory of livestock is the 2008 Agriculture Census; but the coverage is not considered to be good. For other livestock, meat inspection data are used for animals slaughtered. It was felt that the coverage for cattle and pigs slaughtered was quite comprehensive, but not so for goats, sheep, poultry, ducks and rabbits. It is estimated by the Division that as a percent of recorded inventories and in addition to the recorded data, a further 50 percent of goats and sheep, and 25 percent of chicken are slaughtered on farm. Ducks are estimated to be 50 percent of chicken in terms of inventories and slaughter; with around 12,000 a year sold to supermarkets and the rest slaughtered on farm. There are approximately 1 to 1.5 million rabbits; the dairy herd is 4,200 heads (3,000 cows); 500 horses and 3 donkeys. There is domestic honey production for which data also needs to be collected. It will be important to ensure full coverage in the 2015 SUT. The estimates should be cross-checked using the data on average consumption of beef and pork (5.5 Kgs each), goats and sheep (0.5 Kgs each) and 14.5 chicken.
30 29 9. The mission advised using the next Population Census to collect stocks of male and female animals by type (i.e., cattle, sheep, goats, pigs, poultry, rabbits and other animals) as is done in some countries and noted that the US Department of Agriculture survey was also used to collect data on livestock birth rates, age, gender, farm slaughter and other information. It is strongly recommended that the GBS support the Agriculture Department in implementing a similar Agriculture Survey for Suriname. Fisheries Department data 10. A separate meeting was held with the Fisheries Department to discuss its data collection of landed fish catch. The Department uses two methods to collect production data; a census of 80 large industry vessels and a sample of the around 1,000 smaller artisanal vessels at the main landing sites. The Department is tracking 40 percent of the smaller vessels. An annual census of fishing vessels by size is conducted and used to gross up the sample fish catch by type of vessel. It was agreed that the landed catch of fishing vessels licensed in Suriname should be included in the production estimates, including fish landed in Guyana. The catch landed in Guyana (by 60 vessels a day) will be included from 2017, so needs to be estimated back to Fish landed by foreign registered/licensed vessels normally operating in Suriname waters would be included; but the landed catch of foreign vessels not resident in Suriname and caught on the high seas is an import. Subsistence fishing is not covered and needs to be estimated, using the HBS consumption of own caught fish data. Illegal fishing is considered to be minimal. There is also a need to measure the value of recreational/charter fishing and fishing competitions in the national accounts. 11. With the exception of the larger vessels that make fishing trips longer than a day, most fishers go out on a daily basis. Most of the fishing is geared towards shrimp and coastal fish. The industry vessels catch more shrimp and snapper and operate beyond the 80 leagues coastal boundary. Due to resource constraints, the collected data are being processed annually to produce estimates for the annual report. There is a need to process the volume and prices data on a monthly or quarterly basis to derive values that fluctuate through the year in order to improve the annual estimates and produce quarterly estimates. Based on a cost structure survey for artisanal vessels conducted in 2014 and information available on industry vessels, the Department estimates an I/O ratio of 40 percent. It is recommended that the GBS support the Fisheries Department in securing budget funding to conduct a large sample Fisheries Survey in 2020 for the subsequent rebasing exercise. Customs Department data 12. The mission met with Customs Department staff to discuss the availability and quality of international trade data. Customs is using ASYCUDA World and customs declarations and ship manifests are lodged electronically by exporters and importers at all ports. The move to ASYCUDA World was not smooth. The
31 30 classification codes developed and used in the previous system were not transferable to the new system and had been stored in an old server that stopped functioning; resulting in there being no overlap between the old and new datasets. The codes in the new system did not include the supplementary (local) codes from the old system and the coding had to amended in order to ensure full coverage of transactions. 13. The main focus for Customs risk management is the value data being reported for imports that are subject to import duties and quantities for imported and domestically produced that are subject to excise. However, other imports and exports are also checked on a sample basis. The current process is to physically inspect only around ten percent of containers and other cargo using various risk criteria at all ports. This is around half the sample that of other countries in the region use. The Customs Department s main concern appears to be deliberate undervaluation. There is limited misclassification of imported products to similar or other products with lower tariffs. In terms of smuggling, the main seizures appear to relate to alcohol and tobacco but this is not considered significant. However, there is limited monitoring of the land borders or coastal landing sites in rural areas so there could be significant smuggling (exports and imports) depending on the level of taxes charged in neighboring countries compared to the Suriname taxes. There is transshipment of illegal drugs (e.g., 900 kilograms of cocaine were seized recently) but domestic use is considered insignificant. The level of domestic use of imported drugs needs to be investigated further. 14. The mission discussed the need for Customs to utilize the valuation module of the ASYCUDA system and allow outlier analysis to be used to assess and compare unit-values of products with the previous month s average price; so attention can then be paid to quantities as well as values. In addition, the thresholds being used can be updated on a regular basis using commodity prices data from major trading partners. Given the current quality assurance measures, there are some data quality concerns, especially for exports and low duty imports. The GBS staff needs to focus on quality assuring commodities that are not already being checked by Customs officers. Customs valuation of imports is based on cost and freight as not all importers report insurance and Customs does not insist on it. 15. There also appears to be differences in codes used by GBS and Customs that were discussed regarding re-exports and need to be resolved. For compilation purposes, the timing of recording should be at point of import and valued when the ownership changes from non-residents to resident traders. Similarly, Customs reexports should be reclassified as exports if there is a change of ownership (i.e., when the trader sells the products). The CBS has also noted areas where coverage, valuation and timing (e.g. goods exported on a consignment basis) need to be improved. The smaller gold producers sell to middleman that report to the CBS, and the new entrant started exporting gold in November 2016 but none of these exports are reflected in the Customs data. Exports of crude oil and imports of refined petroleum products also appear to be under recorded. Going forward, Customs needs
32 31 to provide better coverage and data quality on international freight and insurance to improve the c.i.f. /f.o.b. ratios at commodity level. 16. Industry coding of registered units is needed to identify direct imports versus imports sold by traders, as the latter are included in the commodity flow estimates used to extrapolate trade margins in the production account. It is recommended that the GBS assist the Customs Department in implementing International Standard Industry Classification for All Economic Activities, Revision 4 (ISIC Rev. 4). Central Bank of Suriname and other financial sector data 17. The GBS is provided by the CBS with annual balance of payments and financial data on the activities of the CBS and commercial banks. The GBS uses the trade in services, income and current transfers data in compiling the GDP-E, Gross National Income and Gross Disposable Income estimates. 18. The CBS uses its own International Transactions Reporting System, survey of traders covering 90 percent of exports and 60 percent of imports, and Foreign Exchange Commission data; along with the Custom trade data to produce the balance of payments estimates. Adjustments are made for change of ownership, coverage, valuation and timing adjustments to the Customs data in producing the international merchandise trade f.o.b. estimates at commodity group level. The CBS staff and GBS trade statisticians need to work together to reconcile the trade statistics each produce. The GBS needs to formally request the CBS to provide more detailed commodity level data for merchandise trade, as well as detailed services data to use in compiling GDP-E. 19. The CBS combines its data with that of the commercial banks but this needs to be reported separately as separate estimates need to be compiled. Neither the CBS nor the GBS have information on the activities of credit unions and cooperatives. The CBS needs to expand its coverage of these and other financial institutions. For foreign exchange dealers activities, the CBS staff indicated that the Foreign Exchange Commission should be approached for the data. 20. Data for banks on stocks of deposits are provided by broad institutional sector and industry, and loans and advances by industry, households, and nonresidents that are used in allocating financial intermediation services indirectly measured (FISIM). The GBS should request data from the CBS on interest payable on deposits and interest receivable on loans and advances by industry and households; to provide a split of non-profit institutions serving households (NPISHs) and others for deposits; and provide data on the value of deposits and loans (other investment) and related interest receivable/payable by residents by main countries of the non-resident banks, as the data are needed to properly calculate and allocate FISIM (including imports of FISIM). 21. The CBS also conducts a monthly survey of 200 businesses in order to produce monthly economic indicators. It takes over a month for the survey response
33 32 rate to be around 60 percent before the monthly indicators are compiled and provided to management. Ministry of Finance and Tax Department data 22. Annual provision by the MOF of the Government accounts data is generally timely and the data are considered of good quality, in terms of coverage and classification of revenue and expenditure items. However, the data are provided in hard copy publications for each department/agency. Given the staff time wasted on data entry and potential transcription errors, the GBS should give high priority to request that the data to be provided in Excel format for 2015 onward. There is no data provided to the GBS by the Tax Department. With the support of the Minister of Finance, the GBS needs to implement a formal agreement with the Department to share tax registration data, company income tax returns and sales tax returns. Tourism Foundation immigration data 23. Monthly Immigration data on the number of stay-over tourists are available from the Tourist Foundation covering purpose of visit by home country by accommodation type and by length of stay. As a national may be resident in a different country, the GBS needs to check that residency (i.e., Question 16 on home country) data are used not the nationality (Question 9a). The GBS is provided with the number of stay-over tourists by type of accommodation. The length of stay should also be requested, as this is seasonal and can also vary over the years. Tourist numbers by actual length of stay are a better volume indicator than just using tourist arrival numbers multiplied by the 2007 average length of stay. Business Register and Surveys 24. The mission discussed the sample design and questionnaires of the Establishment Census (conducted in 2016 for the 2015 reference year), the Annual National Accounts Survey (ANAS) and the Quarterly National Accounts Survey (QNAS), as well as the design of the business register that includes around 13,000 establishments. The register is based on registration data from various institutions but not the Tax Department. 25. The Establishment Census also collected the same registration data for units classified by primary industry (ISIC Rev. 4), along with employment and turnover data that will be used to update the register. The RSA explained that farmers selling their animals or crops directly at markets should not be classified as retailers given that most of the value added comes from agriculture activities not selling. However, fishers selling fish to final consumers could be classified as retailers. For these fishers, volume data is needed to adjust the fishing industry output else there would be double-counting. The Establishment Census included all units with a fixed location. The response rate was approximately 89 percent. Annual targeted unit surveys are not conducted. The Establishment Census and surveys include for-profit institutions (FPIs), public corporations and non-profit institutions (NPIs), but exclude
34 33 the agriculture, forestry and fishing industries and Government agencies/departments. The QNAS sample is a census of all businesses with ten or more employees (around 1,000 units). The ANAS also includes these large business units. The largest units by industry are completely enumerated, while the smaller units with less than ten employees are sampled (i.e., 1 in 4 or 1 in 5 depending on the survey budget). The response rate for the QNAS averages around 40 percent. The total response rate for the ANAS averages around 65 percent; with the response rates for the large units still around 40 percent and higher response rates for the smaller units (over 70 percent). 26. The mission has recommended moving to an Integrated Business Register (IBR) and using reported output or turnover in preference to employment for rating up businesses. The IBR should be based on various registry data, especially Tax Department registration that is likely to be the most comprehensive for the corporate sector. The proposed strategy is to use the resources and feedback from the other institutions to help keep the register up to date. Units on the register (i.e., businesses registered for tax and self-employed professionals) would constitute the formal sector; with other units on the IBR (from the irregular Establishment Census data) and the Census of Population and Housing, HBS and Labor Force Survey (LFS) data used to identify and measure informal sector and subsistence activities. The shared registration data should not be too detailed but would at least include the statistics registration number, contact person and business address and contact details, institutional sector, primary and secondary industry, latest year s employment, and latest year s output/turnover data. 27. The ANAS can be improved by moving to sampling using turnover as the main criterion for FPIs and level of funding for NPIs. Turnover by economic activity should be used to sort institutional units into large (i.e., those contributing 80 percent of the industry s turnover); medium (i.e., the next 10 percent) and small (i.e., the remainder). Level of funding should be used for NPIs, with the fall back options of other less representative indicators (e.g., student enrolments, membership numbers, employment). The largest 470 FPIs and the largest 30 NPIs should be completed enumerated (and this would also be the new reduced sample for the QNAS). The medium-sized business stratum (contributing the next 10 percent of output by industry) would include around 500 units (sample 1 in 5) and the remaining units being in the small business stratum (sample 1 in 10). Assuming the register would have around 13,000 active employing units (i.e., employers with paid employees) this would provide a sample of around 2,000 units. Note that own account workers (with or without unpaid family workers) should be excluded from the grossing up process else there will be duplication with the estimates derived from the LFS. A separate questionnaire should be used for NPIs and the registered agriculture corporations should be included in the survey (as cost structure information is needed). 28. As respondents tend to provide annual data based on their own financial year, it will be necessary to adjust the annual estimates to a calendar year basis using
35 34 quarterly turnover from the QNAS and benchmarking for the large units. There unlikely to be any off-calendar year companies in the other strata and the impact would be insignificant anyway. If this practice of reporting off calendar year cannot be changed, it makes sense to stagger the ANAS data collection for the large units through the year to align with the respondents financial year end (i.e., by sending the questionnaires to the businesses 2 3 months after the financial year end). This would also help smooth out operational workloads and allow more follow-up action. 29. The current response rates for the ANAS and QNAS are too low. The Impact methodology discussed during the mission should be implemented to improve response rates, where follow-up action is four times greater for large units and twice more for medium sized units than for the small units. As explained during the mission, the QNAS response rate targets for these large units needs to be 100 percent even if the data provided is partial (e.g., sales revenue for the quarter). The ANAS response rates for these units in terms of completed forms should be 90 percent for preliminary results (as opposed to getting basic indicators/partial data) within 6 months after the reference year and 100 percent for final results. For medium sized units in the ANAS, it needs to be around 70 percent for preliminary and 80 percent for final results, and for small units (that will be largely homogenous for most industries) around 50 percent for preliminary results and 60 percent for final results. 30. Non-response estimation should be based on the growth and movements for other similar sized businesses. Revision studies can be used to adjust the preliminary data. As the survey results will be used as indicators to extrapolate the benchmarks, the data quality emphasis will be on growth rates rather than actual levels. Access to the monthly survey data compiled by CBS should be requested, as it would be useful to cross-check the quarterly estimates or to use as movement indictors where there is non-response. In order to compile quarterly GDP estimates, it will be necessary for the GBS to work with the CBS to collaborate in collecting monthly and quarterly value and volume data from administrative sources (e.g., Fisheries Department, Ministry of Finance), the telecommunication companies, and the utility companies. Household Surveys 31. The mission reviewed the data from the 2013/14 HBS that has been used for the Consumer Price Index (CPI) rebasing exercise. The HBS data will be essential for compiling the 2015 SUT and rebasing the GDP. However, the coverage of the survey did not include the interior, just coastal urban and rural areas. So, there is a need to ratio estimate the expenditure for households in the interior using 80 percent of the expenditure of rural households in coastal areas as a proxy. This is because the GBS staff estimate that average incomes of households in the interior are around 80 percent of those in coastal rural areas. In addition, grossing up needs to be done separately for urban, coastal rural and for interior households. 32. The LFS is conducted on a quarterly basis. The sample size is 2,400 households. The households are located in 4 Districts namely Paramaribo,
36 35 Wanica, Nickerie and Commewijne. The survey response rates are around 58 percent to 65 percent; with no overlap of sample. A range of data are collected on employment and income for employers, employees, own-account workers and unpaid family workers classified by ISIC Rev. 4. The annualized sample results should be grossed up to estimate formal sector employment in the services and other industries not adequately covered by the ANAS and informal sector employment (i.e., own-account and unpaid family workers). While the income data are not grossed up or published due to lower response rates; the data should be used to calculate average incomes (i.e. output) per worker for use in the national accounts compilation. Tourism Surveys 33. The mission reviewed the questionnaire for the Visitor Exit Survey. The form is well-designed; succinct, easy to complete and with good sequencing of questions. A question asking for the total estimated in-country cost of the visit and persons covered should be asked towards the front of form, as this will aid cross-checking the more detailed expenditures reported later in the form. The only concern is that the survey will be conducted twice a year (i.e., December 19, 2016 to January 31, 2017 and later in 2017 during the low season). It would be better to conduct the survey continuously through the year, with a minimum monthly sample of around 500 completed forms. Benchmark Studies 34. Two BM studies have also been recommended to be conducted in early 2017 to collect data by product group on the trade margins and freight transport margins. The preferred approach is to collect margins data from a small sample of the largest supermarkets and specialty stores for broad categories of goods as classified in the SUT. Similarly, the freight transport margins study will collect data on freight costs associated with these broad product groups. However, given the current budget constraints, it may be necessary to deduct import prices paid by traders and producer prices, and associated tax/duty rates from the equivalent CPI prices for 2015 to derive proxies for the combined trade and transport margin by product group. These would then be adjusted for the percentage of these goods traded. 35. The third study normally recommended is for the construction industry. However, there is already a study underway to update construction costs and markups by type of construction to collect more contemporary data for the 2015 SUT. It is important that this study collects the relevant data to enable the GBS to produce separate BM estimates for residential dwelling construction, commercial property construction, and civil works.
37 36 Prices and Price Indices 36. The new monthly CPI (April June 2016 = 100) was released in mid-2016, with expenditure weights based on the 2013/14 HBS data and is classified using the Classification of Individual Consumption according to Purpose (COICOP) and the Central Product Classification. A CARTAC prices statistics mission is confirmed for August 21 to September 1, 2017 to conduct a comprehensive review and provide advice on improving data collection, compilation and dissemination. It is imperative that the national accounts compilers be given access to the detailed CPI prices and price indices in order to improve the quality of the GDP estimates. The previous CPI series (April June 2009) for January 2015 onwards needs to be combined with the new series at all levels of COICOP (i.e., 1 to 8 digit) and adjusted to 2015=100 for use in compiling the national accounts. The methodology was explained and an example was provided to GBS staff for their use. The worksheet also shows how to compile the non-food goods CPI and the services CPI. 37. The GBS is currently redeveloping the building inputs price indices (BPI). The BPI is actually a retail price index, based on sale prices reported by hardware stores. The RSA has recommended that the GBS start collecting monthly producer prices covering mining, manufacturing and utilities, as well as prices paid by hardware stores for imported building materials to produce quarterly BPI and Producer Price Index (PPI) by June The GBS is planning to develop export price indices (XPI) and import price indices (MPI) using unit-value data; and using smoothing techniques applied to data for the main trading partner countries. These indices also need to be compiled by June 2018.
38 37 Appendix III. Methodology for Compiling GDP by Economic Activity 1. The compilation methodology and worksheets for producing the annual GDP by economic activity (GDP-P), output, intermediate consumption (IC) and gross value added (GVA) estimates were reviewed during the mission. The estimates are broadly consistent with the 1993 System of National Accounts and compiled using the International Standard Industry Classification Revision 3 (ISIC Rev. 3) for 2007 onward on an annual basis. The mission s findings and detailed advice on improving the annual and developing the quarterly GDP-P estimates are provided in this appendix. There is considerable scope to improve the annual compilation methodology, including: Rebase the GDP-P estimates to the 2015 base year in order to compile constant price value (KPV) estimates using contemporary industry cost structures. Discontinuing the use of fixed IC to output (I/O) ratios for current price value (CPV) estimates for industries where these are used. Developing composite weighted IC price indices, using weights based on the 2015 Supply and Use Tables (SUT) to select at least 5 6 price indices (i.e., adjusted Consumer Price Index (CPI) or other price indices), to reflate the KPV IC to derive the CPV IC estimates or to deflate CPV estimates to derive the KPV estimates. Transitioning from ISIC Rev. 3 to ISIC Rev. 4. Revising the industries for which annual estimates are compiled, including increasing the level of detail that services industry estimates are compiled (e.g., business and personal services), while ensuring compilation is still done at a minimum two-digit ISIC Rev. 4 level for all relevant industries. Using the benchmark-indicator approach to extrapolate the base year benchmark (BM) estimates using partial data as value and volume indicators, instead of attempting to develop actual annual estimates by adjusting the partial data using limited information or commodity flows that use fixed ratios. Converting businesses financial year data to calendar year using subannual indicators and benchmarking. Introducing the 2008 System of National Accounts (2008 SNA) work-in-progress (WIP) methodology for construction in the 2015 GDP series, and for agriculture crops and livestock in the medium term. Improving the coverage of the informal sector activities; production for own consumption of non-agriculture produce; and illegal activities (where feasible). Using a more disaggregated commodity flow approach for the construction industry and wholesale and retail trade. Revising the current wholesale to retail trade margins applied in the construction and trade worksheets.
39 38 Implementing the 2008 SNA methodology for calculating financial services indirectly measured (FISIM) and improving its allocation by industry and expenditure component. Splitting out non-profit institutions production by economic activity. Volume extrapolation of deflated imports and outputs at a more detailed level to derive taxes on products in constant prices. 2. Subject to additional budget and staffing of the GBS, quarterly GDP-P estimates can be compiled in both current and constant 2015 prices over the mediumterm. Most of the industry estimates can be compiled using single value or volume indicators benchmarked to the annual output and IC estimates using the Excel Proportional Denton Method Benchmarking software. The resulting estimates can then be deflated or reflated using relevant CPI or other price indices and benchmarked to derive the equivalent KPV or CPV estimates. 3. As far as possible, an integrated compilation system for producing the annual and quarterly GDP-P estimates should be developed. In addition, all compilers should use the same input data files for the various industry and expenditure component compilation workbooks, for example, 2015 = 100 price indices developed using the CPI, producer (PPI), export (XPI) and import (MPI), and building inputs price (BPI) indices; current price indicators; and population, employment and other volume indicators to be used in compiling the annual and quarterly estimates. This will ensure consistent use of survey data, price indices and indicators. The quarterly indicators would still be benchmarked to the more comprehensive annual estimates. However, where subannual indicator and prices data are being used to compile the annual estimates, the quarterly estimates would be compiled first with the annual estimates being the sum of the relevant quarterly estimates. ISIC A - Agriculture, Forestry and Fishing 4. Agriculture and forestry accounted for 5.6 percent of GDP in For growing of crops, the Agriculture Department provides annual data on area cultivated, production quantities and average basic farm gate (and producer) prices for 20 crop types. The CPV output for crops is estimated by multiplying the average basic price by the production quantity for each crop and aggregation, while the KPV output is estimates by multiplying the average basic price for 2007 by the production quantities for each crop and then aggregated. The value of imports of agricultural inputs is used to estimate the CPV IC, with the GVA derived as a residual. The BM I/O ratio for 2007 of 25 percent is used to derive the KPV IC and GVA. 5. The RSA demonstrated the crop and livestock WIP models to the GBS staff and discussed the data required to produce the production estimates. The WIP approach can also be used to measure output equivalent to gross fixed capital formation (GFCF) for fruit trees.
40 39 6. Suggested improvements to the methodology include using the value and volume estimates derived as indicators to extrapolate the 2015 SUT BM estimates; requesting monthly or quarterly data on quantities and prices to calculate monthly or quarterly values and aggregate the months/quarters for the annual estimates; adding a coverage adjustment for backyard production for own consumption using data from 2015 SUT based on the Household Budget Survey (HBS) data. Use household formation rates for extrapolation; ensuring the production data is adjusted for post-harvest loss and includes subsistence and production for own consumption by farmers; adding a coverage adjustment for other small crop types based on the 2015 SUT; using the 2015 SUT values for each IC component divided by total hectares cultivated to calculate 2015 KPV of IC per hectare and use that multiplied by the number of hectares cultivated to estimate KPV IC; updating the 2015 value of IC components using price indices in order to compile CPV IC or continue to use value of imports of inputs for crops but as a value indicator to extrapolate the BM estimate. In the longer-term, it would be better to use the WIP approach to compile separate quarterly IC and output estimates at current and constant prices for seasonal crops, with GVA derived as a residual. 7. For raising of livestock, separate data on animals slaughtered (i.e., cattle, goats, sheep and pigs), and production data for poultry, eggs and milk are obtained from the Agriculture Department, along with the CPI price movement of meat, to compile the CPV output estimates. The base year price is used to estimate KPV output. Fixed BM I/O ratios of 50 percent is used to compile the CPV and KPV IC and GVA estimates. 8. The GBS needs to collect the livestock production data from the Livestock Division on a quarterly basis and use separate I/O ratios by type of animal provided during the mission (i.e., cattle 75 percent, sheep and goats 44 percent, pigs 80 percent, and poultry and eggs chicken and ducks 50 percent), as well as collecting annual data for the CPV I/O ratios. The 50 percent I/O ratio would continue to be used for rabbits, horses and donkeys. The coverage for cattle and pigs slaughtered is quite comprehensive, but needs to be increased for other animals that are slaughtered on farm (i.e., by a further 50 percent for goats and sheep, and 25 percent of chicken). The coverage also needs to be improved for honey production, chicken manure, ducks, rabbits and equines. As most butchers buy live animals from farmers and pay the abattoir a slaughter fee, the abattoir should be requested to provide quarterly data on average live carcass weight and price paid farmers by type of animal. It would be better to use these value and volume estimates as indicators to extrapolate the 2015 SUT BM estimates. The output data should be cross-checked using the average consumption per capita data provided by the Livestock Division (see Appendix II). The annual KPV output, IC and GVA estimates would be derived as the sum of the quarterly KPV estimates. This would also be the case for CPV output estimates. The quarterly CPV output estimates would be benchmarked to the annual CPV IC estimates to derive the quarterly CPV IC estimates, with the GVA derived as the residual.
41 40 9. In the medium-term, it is recommended that the WIP approach be used to compile separate quarterly IC and output estimates at current and constant prices, with GVA derived as a residual. The perpetual inventory model (PIM) demonstrated during the mission needs to be implemented to improve output estimates to include growth in live animals and slaughter of animals; as well as for estimating GFCF of breeding animals. This will require data on livestock inventories and data on birth and death rates that should be available from the Livestock Division; as well as imports of breeding and other animals. 10. There are currently no estimates compiled for hunting and trapping activities. The value of this activity should be investigated for inclusion in the 2015 SUT and rebased GDP series. The main source for the benchmark estimate of output would be the HBS data on household consumption and exports data relating to the export of live wild animals (especially birds). The 2012 Census may also identify hunting households. 11. The agriculture support services provided to the sector are mainly by the Government and not significant. 12. Production data on forestry cover logging of poles and round logs; traditional charcoal production and firewood gathering provided by the Forestry Department, along with export prices for logs and a fixed I/O ratio of 25 percent are used to compile annual CPV and KPV estimates. It would be better to compile the estimates for each of the three products separately using the benchmark-indicator approach as the I/O ratios are different for each. The national accounts compiler needs to contact the Forestry Department to get best estimates of these ratios for the 2015 SUT, as well as collecting prices data for charcoal and firewood. Own account gathering of firewood and poles by rural households is not covered and needs to be included, using HBS data or asking the Forestry Department for under coverage adjustment ratios. Provision of data on a quarterly basis should also be requested. Imported charcoal prices could also be used to construct a proxy price index to reflate the KPV estimates to derive the CPV estimates. 13. For fishing, the GBS receives annual data on total landed fish and shrimp catch quantities from the Fisheries Department and uses the annual average CPI price for fresh fish and the global shrimp price to compile the CPV and KPV output estimates. The BM I/O ratio of 50 percent is used to derive the CPV and KPV IC and GVA estimates. As fishing accounted for 4.8 percent of GDP in 2015, it is necessary to compile the estimates at a more disaggregated level. 14. The GBS needs to work with the Fisheries Department to improve the value and volume information by fish species and to update cost structure information on an annual basis. Use of fixed I/O ratios for CPV estimates should be discontinued. The 50 percent I/O ratio needs to be replaced by the 40 percent estimated by the Fisheries Department.
42 The coverage of output needs to be improved to include sale of fish bladders (estimated value to be provided by the Department) and subsistence fishing based on HBS data. Fish output needs to be estimated by species for the main fish types at least. There is a need to collect the volume data on a monthly or quarterly basis from the Department and apply monthly or quarterly average prices (using CPI prices for fish and shrimp adjusted to remove margins and taxes) to derive values that fluctuate through the year in order to improve the annual estimates and produce quarterly estimates. The quarterly volume indicators would be used to extrapolate the base year value of output to derive quarterly KPV estimates, with the annual estimate being the sum of the quarterly estimates. The annual KPV output estimates would be reflated using the weighted prices to derive the annual CPV estimates, with the quarterly value indicators being benchmarked to the annual estimates to derive the quarterly CPV estimates. ISIC B - Mining and Quarrying 16. For mining, the ANAS data are used to compile the CPV estimates for the bauxite, crude oil and gold extraction and exploration activities. The company annual reports are used to ensure that output, IC and GVA is correctly split between the mining and the manufacturing activities. Weighted volume data and the 2007 BM I/O ratio are used to derive the KPV estimates. For gold extraction, the volume of pre-sifted earth is used as a volume indicator. It would be better to use the actual gold production quantities from gold manufacturing, as the amount of gold extracted per ton of earth is variable. 17. Separate I/O ratios for each sub-industry based on the 2015 SUT should be used. As the ANAS does not include the production of small gold producers, it would be better to use the quantity of gold exports, adjusted for gold for domestic use as the volume indicator. This should be discussed with CBS staff. The value of own account exploration needs to be separately calculated to add to GFCF. The output, IC and GVA relating to mining exploration by informal operators and the petroleum exploration offshore by the 8-9 operators identified by the CBS and not covered in the ANAS needs to be added to the production and GFCF estimates. 18. The CPV estimates for quarrying of sand, gravel and stone are based on the ANAS data but the response rate is poor and a lot of the activity is informal. It would be better to estimate sand, gravel and stone quantities using construction industry average ratios from the study being done to weight the BPI. The ratios are generally around four parts sand to one-part cement and two parts gravel to one-part cement. It may be better to collect the purchase prices for sand, gravel and stone from hardware stores and use that to construct the price indices. ISIC C - Manufacturing 19. The manufacturing activities include production of alumina, processed gold, refined petroleum products, processed shrimps, rice, and other manufacturing; with
43 42 the CPV estimates based on the ANAS data. With the exception of other manufacturing, the KPV output estimates are derived by extrapolating the 2007 BM estimate using quantities of production. For other manufacturing a volume index based on quantities imported raw materials is used. It would be better to use LFS employment data for these industries. The 2007 I/O ratios are used to derive the KPV IC and GVA estimates. The manufacturing industries are significant, accounting for 9.7 percent of GDP in 2015, so more resources need to be devoted to the estimates and coverage of meat processing, non-metallic products and fabricated metal products needs to be explicit and measurable. 20. For the 2015 SUT and ISIC Rev. 4 series, separate estimates are to be produced using the benchmark-indicator approach for 20 industries (i.e., meat processing; fish and shrimp processing; processing of fruit, vegetables and edible oils; dairy products; rice, grain mill and animal feed products; bakeries; other food manufacturing; alcoholic beverages; soft drinks and bottled waters; wearing apparel; wood products; printing and recorded media; refined petroleum products; non-metallic manufacturing; gold processing; alumina production (if revived); fabricated metal production; furniture; other manufacturing; and repair and installation of machinery and equipment. The coverage for manufacturing will need to be improved to include informal sector and production for own use (e.g., fabricated metals, furniture). The publishing activities will be reclassified to communication and information services. 21. Other improvements needed include adding hides and skins output (secondary output of meat manufacturing); reducing the paddy volume data as a proxy of rice produced to 82 percent (rice/paddy ratio) and an estimate for animal feed produced based on the 18 percent residual; and adjusting the shrimp quantities based on Fisheries Department data to remove domestic consumption of fresh shrimp. In the absence of appropriate prices use the export price of the producers or CPI prices for rice and shrimp adjusted to remove margins and taxes. Currently, both industries are overestimated. Refined petroleum products manufacturing needs to be split into the four component products and estimated separately, especially the KPV using product quantities as composition of output has changed considerably. In the medium-term, the quarterly value indicator from the QNAS would be benchmarked to the annual CPV estimates based on the improved ANAS. 22. The development of the PPI has been recommended. In the interim, more detailed level CPI should be used for deflation or reflation purposes. For example, use the CPI for jams/jellies as a deflator for preserved fruit and vegetables; CPI for bakery products for bakeries; CPI for soft drinks; CPI for alcoholic beverages; CPI for wearing apparel; CPI text books for printing; CPI cement for concrete products and the CPI for wood furniture. Similarly, data on more detailed level volume indicators needs to be collected and used where prices data may not be available to compile the KPV estimates. To the extent possible, the quarterly estimates should be compiled at the same level of detail as done for the annual compilation. For cases where a quarterly volume indicator is not available, use the QNAS data as a value
44 43 indicator to extrapolate the BM estimates in order to derive the quarterly CPV estimates; with the relevant CPI used to deflate the CPV estimates to derive the annual KPV estimates. 23. If there are delays in receiving the latest volume or value data, a number of data options are available to estimate the movement for the latest month s missing output data. For example, imported volume of flour and the adjusted CPI for bakeries can be used for bakery products; imports of malt and other ingredients and the relevant adjusted CPI for alcoholic and non-alcoholic beverages; imports of textiles and adjusted clothing CPI for wearing apparel; imports of paper and CPI for text books for printing; or LFS employment data by industry for KPV and reflated using the relevant proxy CPI for that industry. ISIC D - Electricity, Gas, Steam and Air Conditioning Supply 24. Financial data from the ANAS are used to compile the CPV output, IC and GVA estimates; with kilowatt hours of electricity generated and distributed used to compile the annual KPV output estimates. The GVA estimates include the generating company, as well as the electricity distributor. As the output for the industry is the value and volume of electricity distributed, and the GVA is the sum of GVA for generators and the distributor; it is necessary to calculate the IC for the generating companies separately and deduct this from their output to derive the GVA. The industry IC is derived as industry output less GVA of the generator and the distributor. 25. The quarterly KPV estimates can be compiled by using quarterly data on kilowatt hours distributed as a volume indicator benchmarked to the annual KPV estimates. These quarterly KPV estimates would then be reflated using quarterly prices information provided by the distributor or the CPI for electricity to derive a value indicator to be benchmarked to the annual CPV estimates to derive the quarterly CPV estimates (if QNAS value data are not available). ISIC E - Water Supply, Sewerage and Waste Management Activities 26. For water supply, ANAS data are used to compile the annual CPV estimates; with the annual KPV estimates being derived using fixed I/O ratios and quantities of water supplied. Estimates for sewerage and waste collection are not produced. Water collection by households in the interior and rural areas needs to be included using data from the HBS and 2012 Census to identify the number of households, and the labor input or water pricing approaches used to value output and GVA. There would be no IC unless water pumps are used. It will be necessary to collect quarterly financial data for the CPV estimates and volume data on water distributed through the QNAS to use as a volume indicator to extrapolate the BM estimates to compile the quarterly KPV output, IC and GVA estimates, with the annual estimates being the sum of the quarterly estimates. The sewerage and waste collection activities should
45 44 be estimated separately. The number of consumers billed for sewerage can be used as the volume indicator for sewerage. 27. The estimates for the private industrial and solid waste management and recovery companies should be included here in ISIC Rev. 4. In addition to ANAS data, the value and volume of exports of scrap metals and other materials recovered can also be used. ISIC F - Construction 28. The CPV estimates for construction are compiled using a high level construction material inputs commodity flow approach. All imports of the relevant product codes for construction materials are included using the Customs value data, including product cost and freight plus import duties rates of 6 percent less 9 percent of paint imports (based on a company s report for the International Comparison Program (ICP)) plus domestic output of poles and wood products plus trade margins (3 percent) and 12 percent for services inputs (also based on a company s report for the ICP). The taxes data do not reflect exemptions or actual tax revenue collected. The effective margins and tax rates will need to be derived from the 2015 SUT. The poles are actually used for scaffolding and should be in GFCF rather than IC as they are used again for other projects. These inputs make up total IC. A 40-percent- GVA-to-60-percent-IC ratio is used to derive the GVA. The total BPI is used as the deflator to derive the KPV estimates. The absence of the BPI for the most recent years has resulted in the general CPI being used for 2011 onwards. It would be better to use the CPI for building repairs and maintenance. 29. There are several improvements that can be made to the methodology in for the 2015 GDP series. The trade margin of 3 percent is low and needs to be reviewed, although the larger construction companies do import directly or buy directly from local producers. The local production of gravel, sand, stone, concrete products, fabricated metal products need to be added, in addition to the wood products. Deductions need to be made from the building material imports for materials used in producing domestic paints, ready mix cement, concrete, wood and fabricated metal products, and for wood and metals used for furniture manufacturing. These estimates should be based on extrapolating the 2015 BM estimates using the CPV and KPV IC for those industries. The data from the SUT should be used to split the GVA into labor costs, consumption of fixed capital (CFC), other taxes less subsidies on production and net operating surplus. 30. The GBS is currently undertaking a construction industry study to rebase the BPI, working with an industry consultant and the Department of Public Works to develop updated estimates of materials, services and labor inputs; as well as profit margins by type of construction project. It is important that the projects selected include residential dwellings, other buildings and civil works.
46 The commodity flow estimates need to be compiled at a more detailed level. The RSA explained the methodology in detail and provided a worksheet template for compiling construction quarterly CPV and KPV estimates, with the annual estimates derived by summing the quarterly estimates; as well as the related repairs and maintenance and GFCF estimates. The methodology groups the CPV construction materials and services to align with the product level price indices from the BPI (e.g., sand, gravel, stone, timber, plywood, paint, PVC pipes, cement, concrete products, steel bars, iron sheets, nails, equipment repairs and maintenance, equipment hire, fuel, labor). For other goods and services not covered by the BPI, the proposed composite price index of non-food goods CPI and the services CPI can be used. The profit margin can then be applied to the aggregated COE and IC components to derive the remainder of the CPV and KPV GVA. The same methodology can be used to compile the quarterly estimates; with the annual estimates being the sum of the quarters estimates. ISIC G - Motor Vehicle Sales and Repairs, and Wholesale and Retail Trade 32. The annual CPV output estimates for wholesale and retail trade are compiled using the ANAS data. However, the response rates are not good and there is some double-counting resulting from including farmers that sell at markets here as their output is already included in the crops and livestock production estimates. The CPV estimates are deflated using a price index derived from deflating a subset of imports by the equivalent group level CPI for four CPI groups (i.e., food and non-alcoholic beverages, alcohol and tobacco, clothing and footwear, and household furnishings). Due to the partial coverage and high level CPI used to derive the price deflator, the real growth rates are not likely to be accurate. A fixed I/O ratio is applied to the output estimates to derive the IC and GVA estimates. There is a need to separate the motor vehicle sales and repairs industry from other wholesale and retail trade in line with ISIC Rev. 4. As most wholesalers also sell retail and some retailers sell in bulk, it is not feasible to separate the two types of traders. 33. The estimation methodology can be improved by implementing the commodity flow approach to compile the quarterly and annual estimates at a disaggregated product group level. Annual or quarterly CPV and KPV output estimates for crops, livestock, forestry, fishing, mining and quarrying, and the various manufacturing industries would be adjusted to remove the non-traded component (i.e., own consumption or where sold and delivered by the producer to the final user directly) and then used to extrapolate the 2015 BM estimate of output sold through traders domestically or exported to derive the current and constant price value indicators. The non-refundable product taxes would then be added. To this would be added the CPV of traded imports (i.e., adjusted to remove imports by end users directly, with excise, import duties and other non-refundable taxes added). As with the construction model, the traded imported goods would be grouped into categories corresponding to the equivalent proxy CPI and deflated to derive the equivalent KPV estimates until unit-value based MPI are available. Different margin rates should be applied by type of broad product group (e.g., fresh fruit and
47 46 vegetables versus building materials) derived from the 2015 SUT. The domestic and imported components would then be added and used as value and volume indicators to extrapolate the BM gross trade margins to derive quarterly and annual CPV and KPV gross margin estimates. The ANAS data would be used to derive and apply the I/O ratios to derive CPV IC and GVA; with the base period 2015 I/O ratio used to derive the KPV IC and GVA estimates. 34. Sales of motor vehicles and motorcycles are included under general wholesale and retail trade in the current estimates but are to be separated in the ISIC Rev. 4 estimates. The compiler can use the CPI for purchases of vehicles to deflate the quarterly CPV estimates based on the ANAS or imports data (adjusted for taxes and margins) to derive the KPV estimates. The annual estimates can be compiled by summing the quarterly estimates. 35. Vehicle maintenance and repairs are mainly done by car dealers when the vehicles are under warranty and by informal sector mechanics after the warranty expires. Volume extrapolation using the stock of registered vehicles can be used to derive the KPV estimates, and the CPI for vehicle repairs and maintenance to compile the total CPV estimates. ISIC H - Transport and Storage 36. The CPV output estimates for road passenger transport are derived using the ANAS output data as a value indicator; with the CPI for bus fares used to derive the KPV estimates. The 2007 I/O ratio is used to derive the CPV and KPV IC and GVA ratios as the ANAS response rates are not adequate. Separate estimates should be compiled for buses, taxis and freight transport. Bus, taxi and freight vehicle registration or licenses numbers can be used as volume indicators to extrapolate the 2015 benchmark estimates. Another option is to use non-fuel cargo volumes for exports and imports from the Airport and Port Authority as a volume indicator for freight transport. The CPI for buses, CPI transport services and CPI transport can be used to reflate the KPV estimates to derive the CPV estimates, if the ANAS and QNAS data is not good enough for value indicators. 37. There are no estimates produced for water transport. There is a ferry service operating between Suriname and Guyana, but it is not known if the operator is a resident. The residency of the ferry operator needs to be investigated. The 2012 Census data should be checked to see if there are any coastal or river boat/taxi operators. The KPV estimates for water transport can be compiled by extrapolating the 2015 SUT estimate using passenger movements and cargo volumes, with the transport CPI used for reflation to derive the CPV estimates. 38. The CPV estimates for the domestic airlines and the local branches of nonresident airlines are compiled using ANAS data. Total air passenger numbers by kilometers flown are used as the volume indicator to extrapolate the BM estimate to derive the KPV output estimates. The BM I/O ratio is used to derive the KPV IC and
48 47 GVA estimates. If accessible, it would be better to use domestic air fares or actual passenger numbers carried by the resident airlines. For branch operations, the treatment should be consistent with the balance of payments treatment, and so should be discussed with the CBS. Resident departures on these non-resident carriers would be the preferred volume indicator. For quarterly estimates, the same methodology and the QNAS data can be used. 39. The ANAS value and employment/wages data and the 2007 I/O ratio are used to compile the CPV and KPV estimates for transport support services. There is considerable scope to improve the estimates. For the Airport and any other air transport support activities, a weighted volume indicator of air cargo volumes, aircraft movements and passenger arrivals and departures should be used to extrapolate the 2015 estimate to derive the KPV estimates. For the Ports, a weighted volume indicator of cargo volumes exported and imported, ship movements and arrivals and departures should be used to extrapolate the 2015 estimate to derive the KPV estimates. The same methodology and the QNAS data can be used for quarterly estimates. 40. For freight forwarders and agents, the CPV estimates would be derived using the ANAS and QNAS; with the cargo volumes as the KPV indicator to derive the KPV estimates. Tour operators and travel agents will need to be reclassified to Division 79 for ISIC Rev. 4. For the KPV estimates for tour operators, stay-over tourist numbers can be used as a volume indicator; while for travel agents, resident departures would be the preferred volume indicator. If the survey data are not adequate, the KPV estimates can be reflated using the services CPI to derive the CPV estimates. 41. For quarterly estimates, the same volume indicators can be used to compile the quarterly KPV estimates. The proposed services CPI can be used to reflate the quarterly KPV output estimates to derive value indicators to benchmark to the annual CPV output to derive the quarterly estimates. For quarterly CPV IC, the quarterly CPV output estimates can be used as value indicators benchmarked to the annual CPV IC estimates to derive the quarterly IC estimates; with the quarterly CPV GVA derived as residuals. 42. The ANAS value and employment data are used to compile CPV and KPV estimates for postal services using the sum of costs approach. The QNAS data can be used to compile the quarterly estimates. For courier services, the ANAS value and employment data are used for the CPV and KPV estimates. As the ANAS response rates are low and Director level intervention may be required to improve compliance. The QNAS data can be used as a quarterly value indicator benchmarked to the annual CPV estimates to derive the quarterly CPV estimates. It would be better to use the transport CPI to deflate the CPV estimates to derive the quarterly KPV estimates.
49 48 ISIC I - Accommodation and Food Service Activities 43. The CPV output estimates for hotels and restaurants are based on ANAS data; with the KPV output estimates derived using stay-over tourist arrivals as a volume indicator. The 2007 I/O ratio is used to derive CPV and KPV IC and GVA estimates. A number of improvements can be made to the methodology. The compilation needs to be done separately for accommodation services (e.g., hotels, resorts, guest houses, camping grounds and other short-term accommodation) and food and beverage catering services (e.g., restaurants, cafes, canteens, bars and other establishments whose main income is derived from catered food and drinks). Given the concerns about the coverage and quality of the ANAS, the demand side approach should be used to estimate the production of these industries. 44. For accommodation services (including income from meals, drinks and other goods and services that cannot be separated from room revenue), the preferred approach is to use immigration data processed by the Tourist Foundation on the annual or quarterly number of stayover tourists using hotels or other rented shortterm accommodation by average length of stay as a volume indicator to extrapolate the 2015 SUT estimate of tourist expenditure and industry I/O ratio to derive the KPV estimates. The 2015 SUT estimate of tourist expenditure should be extrapolated using a value indicator based on the average expenditure on accommodation per night per tourist from the planned annual Visitor Exit Survey multiplied by the annual or quarterly number of stayover tourists using hotels or other rented shortterm accommodation by average length of stay to derive the CPV output attributable to international tourists. Even though resident personal and business IC use of hotels may be small, household expenditure (i.e., 2015 SUT benchmark extrapolated forward using number of households and the IPD for tourist spend), business financial statements and Government accounts data should be used to derive the BM estimates. The annual ANAS I/O ratio applied to the total CPV output would be used to derive the CPV IC and GVA ratios. 45. The KPV estimates for food and beverage catering services provided to international tourists should be based on extrapolating the relevant 2015 SUT estimate extrapolated using the annual or quarterly number of stayover tourists by length of stay. The 2015 SUT estimate of tourist expenditure should be extrapolated using a value indicator based on the average expenditure on catered food and drinks away from the accommodation per night per tourist multiplied by the annual or quarterly number of stayover tourists by average length of stay to derive the CPV output attributable to international tourists. For the resident expenditure component, the population growth rates should be used to extrapolate the relevant 2015 SUT benchmark to derive the KPV estimates that are then reflated using a composite price index to derive the CPV estimates. The CPI for meals away from home does not include soft drinks or alcoholic beverages, and so does not fully represent restaurants or bars and taverns. A weighted composite price index of the meals away from home CPI, non-alcoholic beverages CPI and alcoholic beverages CPI (using weights from the 2015 SUT) should be used. The same methodology can be used to
50 49 derive quarterly estimates. The annual estimates would be derived by summing the quarterly estimates. As with accommodation services, the output coverage for this industry also needs to be improved to include expenditure by business and Government on hospitality. The annual ANAS I/O ratio applied to the total CPV output would be used to derive the CPV IC and GVA ratios. ISIC J - Information and Communication 46. For telecommunications, the CPV and KPV estimates are compiled using the ANAS value and employment data. For 2015, call minutes were used as the volume indicator. This should be continued for the 2016 estimates. The BM I/O ratio is used to derive the KPV IC and GVA estimates. It would be better to estimate the KPV output for fixed phones, mobile phones, Internet usage and cable TV separately; using annual (and quarterly) volume data on fixed phone call minutes, mobile call minutes, Internet downloads and cable TV subscriptions to extrapolate the 2015 benchmark revenue for each product. The data should be requested from the relevant companies and the Government regulator. The CPI for communications is not accurate, given that it is extremely difficult to collect and compile good price indices due to the continuous change in technology and packages offered. For quarterly estimates, the QNAS data can be used to compile value and volume indicators to benchmark to the annual higher level aggregates to derive the equivalent quarterly CPV and KPV estimates. 47. Publishing activities will need to be reclassified from manufacturing to communication and information services. The CPV estimates are based the ANAS value and employment data. For the KPV estimates, it would be better to use the CPI for newspapers to deflate rather than using employment data to extrapolate the BM. 48. For audio-visual production and distribution activities, broadcasting and programming (i.e., the TV and radio stations), the ANAS and QNAS value data and LFS employment data can be used as value and volume indicators to compile the CPV and KPV estimates. It may be necessary to collect data on rates for advertising slots and take up rates for slots to better estimate CPV output and to derive a more representative price index. The LFS employment data and the services CPI can be used for the remainder. 49. The KPV and CPV estimates for computer and related activities can also be derived using the ANAS and QNAS value data and LFS employment data as value and volume indicators. If response rates are inadequate, it may be necessary to compile the annual and quarterly KPV estimates using the LFS employment as a volume indicator, with the services CPI used to reflate the KPV estimates to derive the CPV estimates. ISIC K - Financial and Insurance Activities 50. Combined data for the CBS and commercial banks is used to compile the CPV estimates. The imputed bank services charges method (i.e. interest receivable
51 50 less interest payable) is used as a proxy for the estimating FISIM. The KPV FISIM estimates are derived by extrapolating the benchmarks using deflated loans and deposits of commercial banks that are deflated using the general CPI. Then explicit fees and charges and other operating income CPV and KPV (again using general CPI) are added to compile the total CPV and KPV output. The CPV IC and GVA are based on CBS data; with the KPV IC and GVA derived by extrapolating the BM estimates using the KPV output movement. The CBS needs to provide separate data for itself and the commercial banks on profit and loss; deposits, loans and advances; and interest payable and receivable by industry/businesses, households, Government and non-residents. There is also a need to improve the coverage of, and collect deposits and loans data for, non-bank financial institutions (e.g. credit unions, cooperatives). 51. Note that the Government accounts show that the CBS is paying a sizable annual dividend to the Government. This implies that its operating income exceeds its costs, so the sum of costs approach may not be appropriate. In the short-term, until CBS provide the required data, it may be necessary to increase the output and GVA for the CBS by the amount of the divided (i.e., sum of costs plus dividend). 52. The RSA provided training on calculating and allocating FISIM, including imports of FISIM. The 2008 SNA states that a general measure of inflation should be used to deflate deposits and loans, so the general CPI is appropriate to deflate the value of deposits and loans to derive volume indicators. Assuming the same information collected annually can be collected quarterly (including profit and loss statements) from the CBS, the following methodology can be used to compile the quarterly estimates; with the annual estimates compiled by summing the quarterly estimates. 53. The mission explained how to derive a proxy of the SNA interest rate using the mid-point of the interest rates on deposits and loans (as done in Australia and New Zealand). The CBS interbank lending rate is probably not used by banks as most of the foreign-owned banks would borrow or lend from their own overseas affiliates. The SNA rate is applied to the average of the opening and closing stocks of deposits for the quarter to derive the pure interest payable for the quarter. From this estimate the actual interest payable is deducted to derive the FISIM on deposits. Similarly, the SNA rate is applied to the average of the opening and closing stocks of loans and advances for the quarter to derive the pure interest receivable for the quarter that is then deducted from the actual interest receivable to derive the FISIM on loans and advances. The respective 2015 BM of FISIM on deposits and FISIM on loans and advances should be extrapolated using the deflated value of deposits and loans and advances using the general CPI to derive the respective KPV FISIM estimates. 54. To the CPV FISIM would be added the other CPV operating income to derive CPV output estimates. The general or the proposed services CPI can be used to deflate other operating income, depending on the type of income, to derive the
52 51 KPV of other operating income to compile total KPV output. The CPV IC estimates can then be compiled from the source data and a composite IC price index used to derive the KPC IC estimates; with the CPV and KPV GVA estimates derived as residuals. 55. FISIM is being allocated by industry, Government and households. However, business FISIM on deposits is not allocated by industry and some of the FISIM on deposits and loans is attributable to NPISHs and non-residents so needs to be reallocated. Industry output can be used as a proxy to allocate business FISIM on deposits. FISIM on mortgages should be added to real estate IC. FISIM for Government and NPISHs is added to IC and output in the public administration and other relevant workbooks as the final consumption expenditure for Government and NPISHs is calculated using the output adjusted for sales. FISIM attributable to nonresidents and to households for deposits and non-mortgage loans are to be allocated to exports of services and household final consumption expenditure respectively. 56. For other financial services, the CPV estimates should be based on ANAS and QNAS data; with the KPV estimates derived using LFS employment and the 2015 I/O ratio. The coverage of pension and other fund managers, financial brokers, foreign exchange dealers and remittance companies needs to be improved. The CBS and Foreign Exchange Commission should be able to provide data if not covered by GBS surveys. 57. The CPV output for insurance companies is being estimated using ANAS data on net premiums (adjusted for net reinsurance premiums) plus investment income less adjusted claims for insurance. Life and non-life insurance need to be separated and calculated according to the 2008 SNA recommendations, as explained during the mission. Reinsurance premiums paid and claims received need to be separated out and treated consistent with the balance of payments. The KPV output estimates derived using a volume indicator (derived by deflating the value of net premiums by the general CPI). A fixed I/O ratio is used to compile the KPV IC and GVA estimates. It may be better to derive the annual and quarterly KPV estimates using the stock of registered motor vehicles, dwellings and deflated value of life insurance policies as volume indicators. The commission fees paid by insurance companies and shown in their financial statement that are paid to local insurance agents are included in the output and GVA estimates. However, a portion of the fees received would be IC and this needs to be estimated (even if it is only percent). The services CPI can be used as a deflator or LFS employment used as a volume indicator to derive the KPV estimates. ISIC L - Real Estate Activities 58. For owner-occupied dwellings, the KPV estimates are derived by extrapolating the 2007 BM estimate using the 2004 and 2012 Census data on number of dwellings extrapolated forward using building permits data. The 2000 HBS average estimate of imputed rents per dwelling is price adjusted using the general
53 52 CPI to derive the CPV estimates. For rented dwellings, the methodology for deriving the KPV estimates is also based on Census numbers but these are extrapolated forward using the household formation rates. The two volume indicators need to be consistent. For real estate agents and property managers, the CPV and KPV estimates are derived by using the ANAS value and average wages data. 59. The methodology can be improved by using the actual rents CPI, redeveloping the volume indicators and adding estimates for rental of commercial property as these are not currently covered. As discussed with the compilers, the stock of owner-occupied and rented dwellings needs to be checked and updated for all years from 2012 Census data on dwellings. It would be better to use adjusted electricity connections to consistently extrapolate both owner-occupied and rented dwellings. The LFS data can be used to adjust the ratio of owner-occupied and rented dwellings on an annual basis. The mission provided a copy of a compilation worksheet for real estate activities and explained the methodology to the GBS staff. The estimated value of commercial rentals in 2015 will be derived in the SUT. The number of electricity connections for commercial and industrial properties can be used as a volume indicator to extrapolate the BM estimate to derive the KPV estimates. The actual rents CPI can be used as a proxy to reflate the KPV estimates to derive the CPV output estimates; with the partial ANAS data used to update the annual I/O ratio to derive the IC and GVA estimates. ISIC M - Professional, Scientific and Technical Activities 60. The ANAS value and employment data are used to compile the CPV and KPV estimates for all business services; with the BM I/O ratios used to derive the CPV and KPV IC and GVA estimates. Veterinarian and photographic services need to be reclassified here in ISIC Rev As this industry includes accounting, auditing, legal and other professional services, it should be possible to use the ANAS and QNAS value and employment data to compile the annual and quarterly CPV output, IC and GVA, and KPV output estimates. The BM I/O ratios would be used to derive the annual and quarterly KPV IC and GVA estimates. The ANAS data would be used to update the annual CPV I/O ratios to derive the annual CPV IC and GVA estimates, with the quarterly CPV output estimates benchmarked to the annual CPV IC to derive the quarterly CPV IC and GVA estimates. If the ANAS and QNAS data are not adequate, the LFS employment data can be used along with the fixed I/O ratios to derive the KPV estimates; and the adjusted services CPI used to reflate the KPV output estimate to derive a value indicator to benchmark to the annual CPV output and IC estimates to derive the quarterly CPV output, IC and GVA estimates. ISIC N - Administrative and Support Service Activities 62. The ANAS value and employment data are used to compile the CPV and KPV estimates for all business services; with the BM I/O ratios used to derive the
54 53 CPV and KPV IC and GVA estimates. Tour operators and travel agents are currently included under land transport but will need to be reclassified here under ISIC Rev As this industry includes rental of durable goods, machinery and equipment; security services; and other business services, it should be possible to use the ANAS and QNAS value and employment data to compile the annual and quarterly CPV output, IC and GVA, and KPV output estimates. The BM I/O ratios would be used to derive the annual and quarterly KPV IC and GVA estimates. The ANAS data would be used to update the annual CPV I/O ratios to derive the annual CPV IC and GVA estimates, with the quarterly CPV output estimates benchmarked to the annual CPV IC to derive the quarterly CPV IC and GVA estimates. If the ANAS and QNAS data are not adequate, the LFS employment data can be used along with the fixed I/O ratios to derive the KPV estimates; and the adjusted services CPI used to reflate the KPV output estimate to derive a value indicator to benchmark to the annual CPV output and IC estimates to derive the quarterly CPV output, IC and GVA estimates. 64. Note that travel agents provide services mainly to residents, so using tourist arrivals is not an appropriate indicator. Resident departures should be used for travel agents as they sell tickets to residents and not to non-resident arrivals; or if not available, use employment data. The CPV output would then be deflated to derive the KPV output estimates and the BM I/O ratio used to derive the KPV IC and GVA estimates. 65. For rentals of vehicles, the main companies should be included in the ANAS and QNAS, with the survey data used to compile the annual and quarterly CPV estimates; deflated using the adjusted land transport CPI and a composite IC price index to derive the KPV estimates. Registration of rental vehicles could also be used as a volume indicator for the KPV estimates. Data on the number of patents and copyrights and royalty payments can be used as the volume and value indicators benchmarked to the 2015 estimates to produce the annual and quarterly estimates for licensing of intangible assets. 66. For the other administrative and support service activities, the ANAS data should be used for the larger units (e.g., security services) to derive the annual and quarterly CPV estimates, with the LFS employment data used as a volume indicator to produce the quarterly KPV estimates. For the informal units, the LFS employment data and adjusted services CPI and composite IC price index can be used to produce the quarterly value and volume indicators to extrapolate the BM estimates to produce the annual and quarterly CPV and KPV estimates. ISIC O - Public Administration; Compulsory Social Security Activities 67. For Government, the CPV estimates by function are compiled, using the Classification of the Functions of Government (COFOG), using Government accounts data from hard copy publications for each department/agency. Given the
55 54 waste of staff time in data entry and potential errors, the GBS should ask for the data to be provided in Excel format. Data on COE is used for GVA. There is no estimate made for consumption of fixed capital (CFC) to add to the GVA. A weighted wage index is used to deflate the CPV GVA to compile the KPV GVA estimates. The same methodology is used for public education, health and social work. A PIM needs to be developed to compile CFC, as well as producing separate output and IC by economic activity for the General Government sector. 68. As discussed during the mission, the compilation workbook needs to be redeveloped to include detailed annual and quarterly CPV estimates of Government output, IC, GVA and Government final consumption expenditure by COFOG that can then be aggregated to the relevant ISIC Rev. 4 industry (i.e., public administration, public education, public health and social work) based on quarterly and annual Government accounts data. The KPV estimates would be derived by separately for COE and IC components, including FISIM. The weighted wage index would be used to extrapolate the BM COE estimates to derive the KPV COE estimates. The detailed expenses on other goods and services in the Government accounts can be aggregated into broad expenditure groups, with the best proxy adjusted CPI (i.e., 2015 = 100) used to deflate the estimates to derive the KPV estimates. 69. The relevant prices indices could be used to deflate CPV estimates. For example, electricity charges CPI for electricity, CPI water charges for water use, supplies and materials (goods CPI), communications (CPI for communications), buildings and roads repairs and maintenance (construction industry implicit price deflator (IPD)), vehicle maintenance and repairs (CPI for vehicle repairs and maintenance), actual rents CPI for rental of assets (as this is mainly rental of office space), insurance CPI for insurance, land transport CPI for local travel, air transport CPI for international travel, CPI education for training, restaurants IPD for hosting and entertainment, a services CPI for professional and other services, and the goods CPI for other/sundry expenses. The deflators should be discussed with the MOF before use. The CPV and KPV estimates for GFCE would then be derived by deducting Government sales revenue from the Government output estimates at the function/industry level, using the IPD for Government output to deflate Government sales to derive the KPV sales estimates. The same methodology can be used for the annual and quarterly estimates. ISIC P - Education 70. The CPV and KPV estimates for non-government private education are based on the ANAS value and employment/average wages data. However, the LFS employment movement for this industry and the CPI for education have been used for 2013 onwards due to low ANAS response rates. The BM I/O ratio is used to derive both CPV and KPV IC and GVA estimates. The same methodology can be used to produce quarterly estimates but improved to produce output, IC and GVA estimates by level of education and by updating the CPV I/O ratio annually. In
56 55 addition to redesigning the sample of the ANAS and QNAS, possible data sources include the Universities websites and student visa data. The volume indicator can be improved using student enrolments data by level for both the annual and quarterly KPV estimates and the adjusted CPI for pre-primary and primary, secondary and tertiary education can be used to reflate the quarterly KPV output estimates to derive a value indicator to benchmark to the annual CPV output and IC estimates, with the GVA estimate derived as a residual. The coverage needs to be improved to include private tutoring, adult and other education using the 2015 SUT benchmark data. 71. To align with ISIC Rev. 4, public education should be included under education. The annual CPV estimates for public education are compiled using the same approach as for public administration. The same improvements can be made and the quarterly estimates then compiled using the improved methodology. ISIC Q - Human Health and Social Work Activities 72. The ANAS value and employment data are used as value and volume and value indicators to compile the CPV and KPV estimates respectively; although the LFS employment movement for this industry and the general CPI have been used for 2014 onwards due to low ANAS response rates. It would be better to use the medical services CPI. The coverage needs to be improved to include ambulance services and traditional healers/mid wives. The methodology can be improved to produce output, IC and GVA estimates at a more detailed level by type of medical service and by updating the CPV I/O ratio annually. 73. Separate estimates should be compiled for hospital services, doctors, dentists, laboratories/paramedical services and traditional healers/midwives. For hospital services, ANAS data should be used to compile the annual CPV estimates. The CPV output estimates can be deflated using the adjusted CPI for hospital services to derive the KPV output estimates. The fixed BM I/O ratio can be used to derive the KPV IC and GVA estimates. For doctors, dentists and paramedical services, ANAS data could be used to compile the annual CPV estimates. The CPV output estimates can be deflated using the adjusted CPI for doctors, dental and paramedical services respectively to derive the three KPV output estimates. The BM I/O ratios can be used to derive the respective KPV IC and GVA estimates. If ANAS data are inadequate, LFS employment data by sub-industry can be used to derive the KPV estimates first and then the relevant CPI can be used to reflate the KPV to derive the CPV estimates. 74. The quarterly KPV estimates can be compiled using QNAS and LFS employment data benchmarked to the annual KPV estimates. QNAS value or LFS income data (or the same CPI can be used to reflate the KPV output estimates) to produce a quarterly value indicator to benchmark to the annual CPV estimates. A composite IC price index can be used to reflate the KPV IC to derive the value indicator to benchmark to the annual CPV IC to derive the quarterly CPV IC and GVA estimates.
57 Separate estimates for private social work are not currently compiled and the coverage can be improved. As most will be NPISHs, the KPV estimates can be compiled using LFS employment as a volume indicator to derive the KPV estimates; with the adjusted CPI for social protection or hired care being used to reflate the KPV output estimates to derive the CPV output estimates if the ANAS response rates are inadequate. 76. To align with ISIC Rev. 4, public human health and social work should be included here. The annual CPV and KPV estimates for public health and social work are compiled using the same approach as for public administration. The same improvements can be made and the quarterly estimates then compiled using the improved methodology. ISIC R - Arts, Entertainment, and Recreation 77. This industry is currently included in the other community, social and personal services industry. The ANAS value and employment data are used as volume and value indicators to compile the KPV and CPV estimates respectively; although the LFS employment movement for this industry and the general CPI have been used for 2014 onwards due to low ANAS response rates. There is a need to measure the value of recreational/charter fishing and fishing competitions and add that here. Where possible, ANAS data should be used as a value indicator to derive the quarterly and annual CPV output estimates. The redesigned ANAS should be used to collect data to update the annual CPV I/O ratios. Where more representative volume indicators (e.g., gym and sports club memberships) are not available, the LFS employment data can be used as a volume indicator to extrapolate the BM estimates to compile the quarterly KPV output estimates, with the BM I/O ratios used to derive the KPV IC and GVA estimates. Where value data are not available, the quarterly KPV output estimates can be reflated using representative adjusted CPI price indices (e.g., CPI for cultural services, recreational services, gambling, gym memberships and sports CPI) to produce quarterly value indicators to benchmark to the annual CPV output and IC estimates in order to compile the quarterly CPV estimates. ISIC S - Other Service Activities 78. This industry is currently included in the other community, social and personal services industry. The ANAS value and employment data are used as volume and value indicators to compile the KPV and CPV estimates respectively; although the LFS employment movement for this industry and the general CPI have been used for 2014 onwards due to low ANAS response rates. The methodology can be improved by compiling the estimates at the 2-digit ISIC level. 79. Where possible, ANAS and QNAS data should be used as a value indicator to derive the quarterly and annual CPV output estimates. The redesigned ANAS should be used to collect data to update the annual CPV I/O ratios. Where more
58 57 representative volume indicators are not available, the LFS employment data can be used as a volume indicator to extrapolate the BM estimates to compile the annual and quarterly KPV output estimates, with the BM I/O ratios used to derive the KPV IC and GVA estimates. Where value data are not available, the quarterly KPV output estimates can be reflated using representative adjusted CPI price indices to produce quarterly value indicators to benchmark to the annual CPV output and IC estimates in order to compile the quarterly CPV estimates. 80. Volume indicators based on the number of members (or population projections as the fallback option) can be used for religious and other membership organizations. For repairs of personal and household goods, the annual and quarterly estimates will need to be compiled using employment data. The number of deaths should be used as a volume indicator for funeral services; and population growth rates for hair and beauty salons, laundry and dry-cleaning, and other services. In the absence of value data, the services CPI can be used for religious and other membership organizations and other services; repairs of personal and household goods CPI for repairs of personal and household goods; CPI for haircuts and personal care for hair and beauty salons; and funeral services CPI for funerals. Composite IC price indices should be used to calculate independent CPV IC estimates. ISIC T - Activities of Households as Employers 81. This industry is implicitly included in the other community, social and personal services industry. The ANAS value and employment data are used as volume and value indicators to compile the KPV and CPV estimates respectively; although the LFS employment movement for this industry and the general CPI have been used for 2014 onwards due to low ANAS response rates. The LFS employment data should be used as a volume indicator to extrapolate the BM to derive the KPV output and GVA estimates; reflated using the domestic services CPI if available or the proposed services CPI. There is no IC for this activity as those costs are part of HFCE. The same method can be used for the quarterly estimates. Taxes less Subsidies on Products 82. The CPV estimates are compiled from annual Government accounts data for taxes on products less subsidies for baby formula. KPV estimates are compiled using the GDP deflator. The RSA discussed improvements to the methodology with the GBS staff. A new workbook will need to be developed with annual and quarterly product taxes and subsidies compiled at a disaggregated level, so that corresponding volume indicators can be used to produce the annual and quarterly KPV estimates. For the product sales taxes on manufactured goods, the BM can be extrapolated using the KPV output for the relevant manufacturing industries. For the product taxes on services, the KPV output for the respective services industries should be used to extrapolate the BM taxes. Use the general CPI to deflate stamp duties in the absence of suitable volume indicators; use passenger arrivals and departures as
59 58 volume indicators, as appropriate, for the airport and passenger taxes; use the equivalent deflated imports for import duties, import service charges and excise; and use the equivalent KPV output estimates for domestic excise tax. 83. The volume of baby formula imported can be used as a volume indicator to extrapolate the 2015 benchmark value of the subsidy to derive the KPV estimates for subsidies. However, there are more subsidies on products that need to be deducted, where regular transfers by Government to public corporations are included in the output and value added. This is certainly the case for the Post Office (as the sum of cost approach has been used to estimate output and GVA). The national accounts compilers need to check for other public corporations and deduct the subsidies from total GVA of industries accordingly.

60 59 Appendix IV. List of Products and Industries for the 2015 SUT
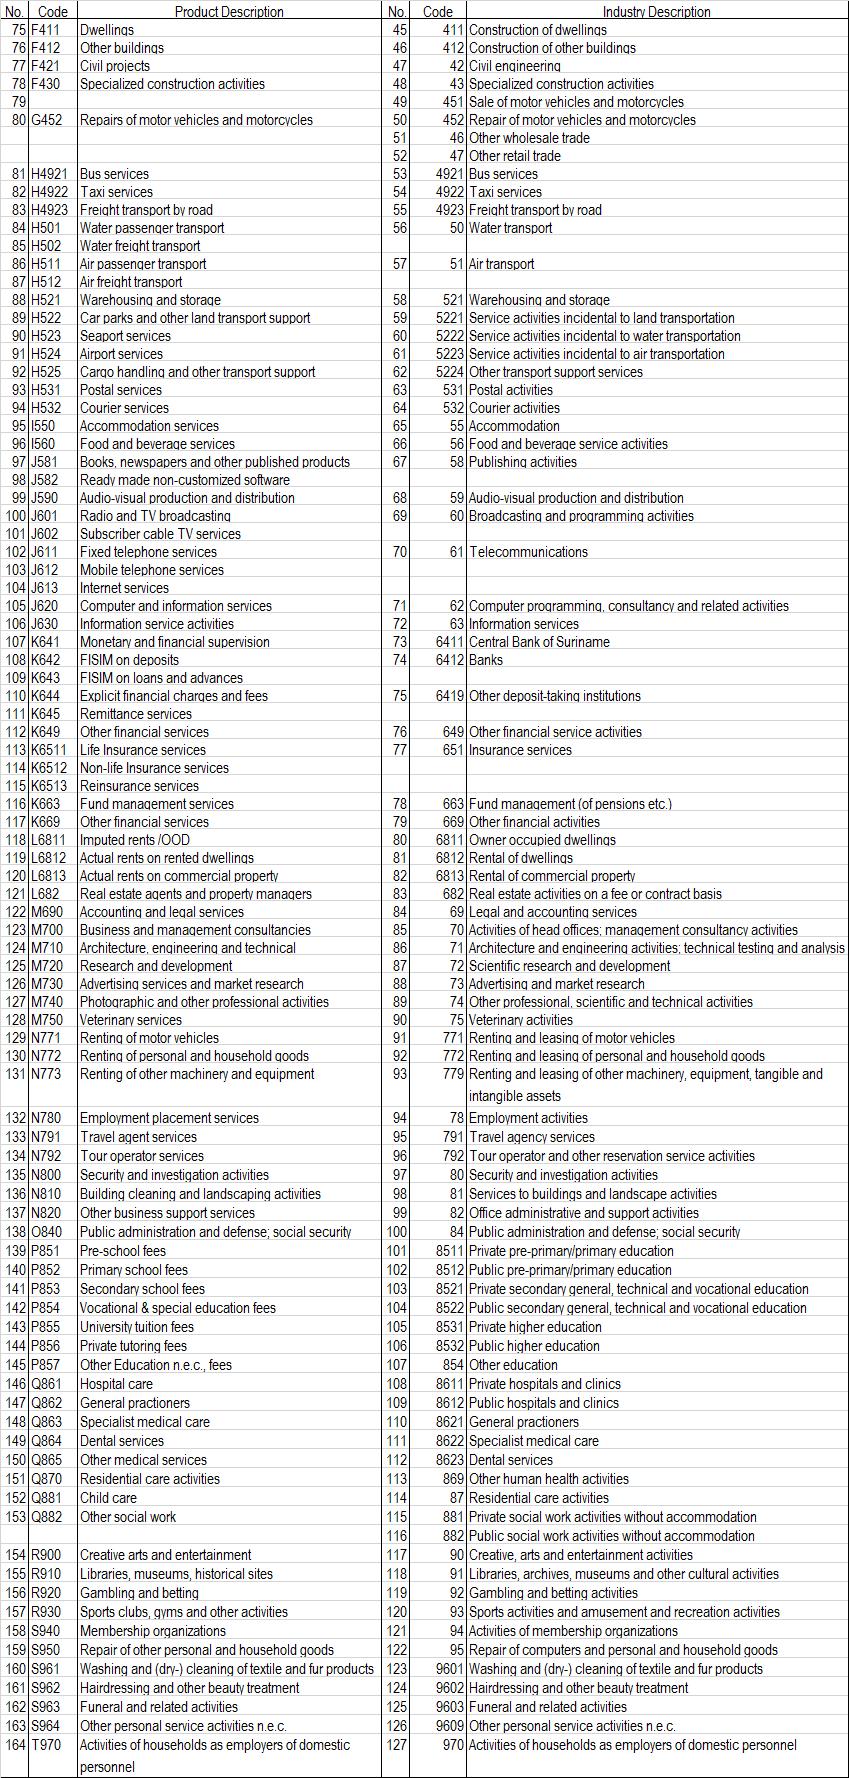
61 60
Compilation of Use Table in MYANMAR
 International Workshop on Supply and Use Tables 11-13 September 2018, Beijing, China Compilation of Use Table in MYANMAR Kyin Htay Director Planning Department 1 Outline of the Presentation Current Situation
NATIONAL ACCOUNTS STATISTICS
 SDT: 35-06 KINGDOM OF TONGA NATIONAL ACCOUNTS STATISTICS 2010 October 2010 Statistics Department P.O. Box 149, Nuku alofa Government of Tonga Telephone: (676) 23-300 / 23-913 Fax : (676) 24-303 Email :
Quarterly National Accounts Inventory Croatia
 Quarterly National Accounts Inventory Croatia IPA 2011 Multi-beneficiary Statistical Co-operation Programme Contact persons: Verica Roknić (RoknicV@dzs.hr) - GDP by Expenditure Approach Department Natalija
Guidelines for the Notes on National Accounts Methodology
 Guidelines for the Notes on National Accounts Methodology In addition to the national accounts data, metadata on the national accounts methodology is published in the United Nations publication: National
Compilation of Quarterly GDP: Methods, Problems, and Solution The case of Thailand
 Strengthening Regional Capacities for Statistical Development in Southeast Asia Project Sponsored by UNSD, ESCAP and ASEAN Secretariat Bangkok, 6-10 August 2001 Compilation of Quarterly GDP: Methods, Problems,
NATIONAL ACCOUNTS STATISTICS TO KINGDOM OF TONGA. May Price: T$25.00
 SDT: 35-07 KINGDOM OF TONGA NATIONAL ACCOUNTS STATISTICS 2001-02 TO 2009-10 May 2011 Statistics Department P.O. Box 149, Nuku alofa Government of Tonga Telephone: (676) 23-300 / 23-913 Email: dept@stats.gov.to
Croatian Quarterly National Accounts Inventory based on ESA 2010 methodology
 Croatian Quarterly National Accounts Inventory based on ESA 2010 methodology Grant agreement 04121.2015.002-2015.168 Contact persons: Natalija Krunić (KrunicN@dzs.hr) - QGDP by Production and Income Approach
Gross domestic product of Montenegro for period
 MONTENEGRO STATISTICAL OFFICE RELEASE No: 211 Podgorica, 30. September 2015 When using these data, please name the source Gross domestic product of Montenegro for period 2010-2014 Real growth rate of gross
MONGOLIA: ACTIVITIES AIMED AT IMPROVING MACROECONOMIC STATISTICS
 High-level Meeting for Coordinated Implementation of International Standards for Macroeconomic Statistics, Vladivostok 3-4 Sep, 2014 MONGOLIA: ACTIVITIES AIMED AT IMPROVING MACRO B.BADAMTSETSEG NSO, Mongolia
Norma Chhab Alperin World Bank-ECLAC May 2018
 Norma Chhab Alperin World Bank-ECLAC May 2018 Relevance of ICP results depend on their frequent and timely availability Recommendation: a frequency of at least every two or three years with extrapolations
Gross domestic product of Montenegro in 2011
 MONTENEGRO STATISTICAL OFFICE R E L E A S E No: 257 Podgorica, 28 September 2012 When using the data please name the source Gross domestic product of Montenegro in 2011 Real growth rate of gross domestic
BOSNIA AND HERZEGOVINA
 IMF Country Report No. 18/49 February 2018 BOSNIA AND HERZEGOVINA TECHNICAL ASSISTANCE REPORT GOVERNMENT FINANCE STATISTICS This Technical Assistance report on Bosnia and Herzegovina, The Republic of Srpska
COUNTRY REPORT - MAURITIUS
 COUNTRY REPORT - MAURITIUS ORGANISATION OF ECONOMIC STATISTICS General overview of the organization of economic statistics 1. The Central Statistics Office (CSO) is the official organisation responsible
Validation of National Accounts Expenditures
 Chapter 21 Validation of National Accounts Expenditures Price data and accounts data are the two pillars of the Inter Comparison Program (ICP). Because purchasing power parities (PPPs) are derived from
Quarterly National Accounts of the Kyrgyz Republic
 Quarterly National Accounts of the Kyrgyz Republic COUNTRY REPORT Asanbekova Asel Main specialist of National Accounts and Economic Balance Division Regional Course on SNA 2008 (Special Topics): Improving
Contents. Oeur Sophal, Deputy Director of Department
 National Accounts of Cambodia Oeur Sophal, Deputy Director of Department \\csng14p20101\covsea$\ibduser\cambodia\project Tiger\Ratings Review\S&P\Ratings Review_22Oct2007_sent.ppt /1 Contents 1. Background
Country Report UZBEKISTAN
 Regional Course on SNA 2008 (Special Topics): Improving Exhaustiveness of GDP Coverage 22 30 August 2016 Daejeon, Republic of Korea Country Report UZBEKISTAN Data sources and estimation methods for compiling
Gross domestic product of Montenegro in 2016
 MONTENEGRO STATISTICAL OFFICE R E L E A S E No:174 Podgorica 29 September 2017 When using the data pleaase name the source Gross domestic product of Montenegro in 2016 Real growth rate of gross domestic
Supply and Use Tables for Macedonia. Prepared by: Lidija Kralevska Skopje, February 2016
 Supply and Use Tables for Macedonia Prepared by: Lidija Kralevska Skopje, February 2016 Contents Introduction Data Sources Compilation of the Supply and Use Tables Supply and Use Tables as an integral
Outline of presentation. National Accounts Office September 2016 Chiba, Japan
 25-27 September 2016 Chiba, Japan National Accounts Office Office of the National Economic and Social Development Board (NESDB) Outline of presentation Short Term Indicator Quarterly Gross Domestic Product
Accounts, Indicators and Policy Use with 2008 SNA Framework
 Accounts, Indicators and Policy Use with 28 SNA Framework Regional Seminar on Developing a Programme for the Implementation Programme of the 28 SNA and the Implementation Strategy for the SEEA Central
National Accounts
 Republic of Namibia National Accounts 1996 2006 Sectoral Contribution to GDP, 2006 Primary Sector 22.1% Tertiary Sector 51.6% Secondary Sector 18.4% Central Bureau of Statistics National Planning Commission
PRESS RELEASE: THE DEPARTMENT OF STATISTICS RELEASES GROSS DOMESTIC PRODUCT (GDP) 2017 FIGURES
 2017 FIGURES") PRESS RELEASE: THE DEPARTMENT OF STATISTICS RELEASES GROSS DOMESTIC PRODUCT (GDP) 2017 FIGURES The National Accounts Section of the Department of Statistics announces the release of a revised data series
PRESS RELEASE: THE DEPARTMENT OF STATISTICS RELEASES GROSS DOMESTIC PRODUCT (GDP) 2017 FIGURES The National Accounts Section of the Department of Statistics announces the release of a revised data series
PDCOUNTRY DEMOGRAPHICS
 PDCOUNTRY DEMOGRAPHICS The population, GDP (and its breakdown), value added by economic activity, implicit price deflator, GNI, and exchange rate demographics provided are among the most important parts
Kathmandu, Nepal, September 23-26, 2009
 Session Number: Session 8b (Parallel) Time: Friday, September 25, 14:00-15:30 Paper Prepared for the Special IARIW-SAIM Conference on Measuring the Informal Economy in Developing Countries Kathmandu, Nepal,
National Accounts Statistics Report 2015
 National Accounts Statistics Report 2015 Private Bag 0024, Gaborone. Tel: 3671300 Fax: 3952201 E-mail: info@statsbots.org.bw Website: http://www.statsbots.org.bw 2. Preface Published by STATISTICS BOTSWANA
Business cycle. Outline Presentation: Outline
 Business cycle Govinda Prasad Nyaupane Statistics Officer Central Bureau of Statistics Nepal Outline Presentation: Outline Nepal and its Statistical System Concept of business cycle. Nepalese practices
Title of Paper: Impact of SNA 1993 on India's National Accounting System and Potential Implications of the Revised SNA
 Session Number: Session Title: Session Organiser (s): Session Chair: 6A SNA(1) Michael Ward and Carol Carson Carol Carson, USA Paper prepared for the 29 th General Conference of the International Association
Fiscal Year 2015 Statistical Appendices. August, 2016
 Fiscal Year 2015 Statistical Appendices August, 2016 Acknowledgements This FY2015 Statistical Compendium was prepared by the Graduate School USA, Pacific Islands Training Initiative, Honolulu, Hawaii in
Reviving the Production of National Accounts and Implementing the System of National Accounts (SNA 2008)
") Reviving the Production of National Accounts and Implementing the System of National Accounts (SNA 2008) Moffat Nyoni, Zimbabwe National Statistics Agency Paper Prepared for the Special IARIW-SSA Conference
Reviving the Production of National Accounts and Implementing the System of National Accounts (SNA 2008) Moffat Nyoni, Zimbabwe National Statistics Agency Paper Prepared for the Special IARIW-SSA Conference
National Bureau of Statistics Ministry of Finance Dar-es-Salaam
 THE UNITED REPUBLIC OF TANZANIA National Bureau of Statistics Ministry of Finance Dar-es-Salaam October, 2013 PREFACE The publication National Accounts of Tanzania Mainland 2001-2012 is the fifth in the
COUNTRY REPORT HONG KONG, CHINA. Regional Course on SNA 2008 (Special Topics): Improving Exhaustiveness of GDP Coverage
: Improving Exhaustiveness of GDP Coverage") COUNTRY REPORT HONG KONG, CHINA Regional Course on SNA 2008 (Special Topics): Improving Exhaustiveness of GDP Coverage 22-30 August 2016 Daejeon, Republic of Korea Background Statistics on Gross Domestic
COUNTRY REPORT HONG KONG, CHINA Regional Course on SNA 2008 (Special Topics): Improving Exhaustiveness of GDP Coverage 22-30 August 2016 Daejeon, Republic of Korea Background Statistics on Gross Domestic
3rd ICP 2011 Technical Advisory Group Meeting at the OECD, Paris 10, 11 June 2010
 3rd ICP 2011 Technical Advisory Group Meeting at the OECD, Paris 10, 11 June 2010 Some Background Situation in 2005 Emphasis was on price collection Belated attention to National Accounts Different estimates
In 2013 the African Development Bank
 BANQUE AFRICAINE DE DEVELOPPEMENT AFRICAN DEVELOPMENT FUND FONDS AFRICAIN DE DEVELOPPEMENT Statistics Department December 2014 www.afdb.org/statistics Table of Contents Chief Economist Complex Preface
UPDATE OF QUARTERLY NATIONAL ACCOUNTS MANUAL: CONCEPTS, DATA SOURCES AND COMPILATION 1 CHAPTER 4. SOURCES FOR OTHER COMPONENTS OF THE SNA 2
 UPDATE OF QUARTERLY NATIONAL ACCOUNTS MANUAL: CONCEPTS, DATA SOURCES AND COMPILATION 1 CHAPTER 4. SOURCES FOR OTHER COMPONENTS OF THE SNA 2 Table of Contents 1. Introduction... 2 A. General Issues... 3
National Accounts GROSS DOMESTIC PRODUCT BY PRODUCTION, INCOME AND EXPENDITURE APPROACH
 TB 01 Thematic Bulletin ISSN 2232-7789 National Accounts GROSS DOMESTIC PRODUCT BY PRODUCTION, INCOME AND EXPENDITURE APPROACH Bosnia and Herzegovina BHAS Agency for Statistic of Bosnia and Herzegovina
INTERNATIONAL MONETARY FUND. Ecuador. Detailed Assessments Using the Data Quality Assessment Framework (DQAF) Prepared by the Statistics Department
 Prepared by the Statistics Department") INTERNATIONAL MONETARY FUND Ecuador Detailed Assessments Using the Data Quality Assessment Framework (DQAF) Prepared by the Statistics Department Approved by Carol S. Carson and Anoop Singh March 5, 2003
INTERNATIONAL MONETARY FUND Ecuador Detailed Assessments Using the Data Quality Assessment Framework (DQAF) Prepared by the Statistics Department Approved by Carol S. Carson and Anoop Singh March 5, 2003
National Accounts Estimates ( ) March 2018 issue
 March 2018 issue") National Accounts Estimates (2015 2018) March 2018 issue 1. INTRODUCTION This issue of Economic and Social Indicators presents National Accounts estimates for the period 2015 to 2018. Concepts and definitions
National Accounts Estimates (2015 2018) March 2018 issue 1. INTRODUCTION This issue of Economic and Social Indicators presents National Accounts estimates for the period 2015 to 2018. Concepts and definitions
GDP REBASING REPORT BASE YEAR 2015
 REVOLUTIONARY GOVERNMENT OF ZANZIBAR OFFICE OF THE CHIEF GOVERNMENT STATISTICIAN GDP REBASING REPORT BASE YEAR 2015 November, 2018 PREFACE This report is the second GDP rebasing publication that presents
National Accounts Estimates ( ) September 2018 issue
 September 2018 issue") National Accounts Estimates (2015 2018) September 2018 issue 1. INTRODUCTION This issue of Economic and Social Indicators presents National Accounts estimates for the period 2015 to 2018. Concepts and
National Accounts Estimates (2015 2018) September 2018 issue 1. INTRODUCTION This issue of Economic and Social Indicators presents National Accounts estimates for the period 2015 to 2018. Concepts and
Quarterly National Accounts, part 4: Quarterly GDP Compilation 1
 Quarterly National Accounts, part 4: Quarterly GDP Compilation 1 Introduction This paper continues the series dedicated to extending the contents of the Handbook Essential SNA: Building the Basics 2. In
Introduction to Supply and Use Tables, part 1 Structure 1
 Introduction to Supply and Use Tables, part 1 Structure 1 Introduction This paper continues the series dedicated to extending the contents of the Handbook Essential SNA: Building the Basics 2. The aim
Introduction to the SNA 2008 Accounts, part 1: Basics 1
 Introduction to the SNA 2008 Accounts, part 1: Basics 1 Introduction This paper continues the series dedicated to extending the contents of the Handbook Essential SNA: Building the Basics 2. The aim of
METHODOLOGY OF COMPILING QUARTERLY GDP ESTIMATES
 METHODOLOGY OF COMPILING QUARTERLY GDP ESTIMATES The Central Statistical Organisation (CSO) introduced the quarterly estimates of Gross Domestic Product (GDP) on 30.6.1999. Quarterly Releases include GDP
Lesson: VII Expenditure Components of GDP: Part I
 An Introduction to System of National Accounts Lesson: VII Expenditure Components of GDP: Part I Fourth Intermediate-Level e-learning Course on 2008 System of National Accounts September - November 2014
Sources for Other Components of the 2008 SNA
 4 Sources for Other Components of the 2008 SNA This chapter presents an overview of the sequence of accounts and balance sheets of the 2008 SNA. It is designed to give the compiler of the quarterly GDP
Price and Volume Measures Rebasing & Linking
 Regional Course on 2008 SNA (Special Topics): Improving Exhaustiveness of GDP coverage 31 August 4 September 2015 Daejeon, Republic of Korea Price and Volume Measures Rebasing & Linking Alick Nyasulu Statistical
Guidelines for the Notes on National Accounts Methodology
 Guidelines for the Notes on National Accounts Methodology In addition to the national accounts data, metadata on the national accounts methodology is published in the United Nations publication: National
Republic of Namibia. Quarterly Gross Domestic Product. First Quarter 2009
 Republic of Namibia Quarterly Gross Domestic Product First Quarter 2009 National Planning Commission Central Bureau of Statistics Mission Statement As the producer and coordinator of official statistics
REPORT TO THE STANDING COMMITTEE OF CARIBBEAN STATISTICIANS
 REPORT TO THE STANDING COMMITTEE OF CARIBBEAN STATISTICIANS 38 th MEETING, Frigate Bay, St. Kitts & Nevis 28-30 October 2013 Algemeen Bureau voor de Statistiek van Suriname (ABS) General Bureau of of Suriname
E-Training on GDP Rebasing
 1 E-Training on GDP Rebasing October, 2018 Session 3: Rebasing national accounts (Part I) Economic Statistics and National Accounts Section ACS, ECA Content of the presentation Rebasing national accounts
International Monetary Fund Washington, D.C.
 2012 International Monetary Fund March 2012 IMF Country Report No. 12/58 Georgia: Report on Observance of Standards and Codes Data Module This Report on the Observance of Standards and Codes on Data Module
International Monetary Fund Washington, D.C.
 2006 International Monetary Fund August 2006 IMF Country Report No. 06/308 Malta: Report on the Observance of Standards and Codes Data Module; Response by the Authorities; and Detailed Assessments Using
COUNTRY PAPER - CAMBODIA
 COUNTRY PAPER - CAMBODIA Khin Song 1 September 2009 1 Deputy Director General, National Institute of Statistics, Cambodia I. BACKGROUND Since 1979, Cambodia had adopted a decentralized statistical structure.
S Y S T E M O F N A T I O N A L A C C O U N T S REPORT 2016
 T H E CAYMAN ISLANDS S Y S T E M O F N A T I O N A L A C C O U N T S REPORT 2016 NOVEMBER 2017 T H E ECONOMICS AND STATISTIC S OFFICE TABLE OF CONTENTS Page ACKNOWLEDGEMENT... i ABBREVIATIONS AND ACRONYMS...
Marshall Islands, Republic of the
 Key Indicators for Asia and the Pacific 2017 1 POPULATION Total population a thousand; as of 1 July 51.2 50.5 49.7 50.0 50.5 51.2 51.5 51.8 52.5 52.3 52.9 53.2 53.4 53.6 53.8 54.0 54.2 Population density
Fiscal Year 2017 Statistical Appendices
 Fiscal Year 2017 Statistical Appendices August, 2018 Acknowledgements This FY2017 Statistical Compendium was prepared by the Graduate School USA, Pacific Islands Training Initiative, Honolulu, Hawaii in
TECHNICAL ASSISTANCE REPORT REPORT ON THE PRICES STATISTICS MISSION. Copies of this report are available to the public from
 IMF Country Report No. 17/323 October 2017 MONGOLIA TECHNICAL ASSISTANCE REPORT REPORT ON THE PRICES STATISTICS MISSION This technical assistance report on Mongolia was prepared by a staff team of the
E-TRAINING ON COMPILATION OF SUT
 E-TRAINING ON COMPILATION OF SUT IN AFRICA ACS/ESNA 2017 Session 10: GDP exhaustiveness Introduction Production boundary Outline Links between production and income approach GDP Links between production
Support to the Statistics. Kosovo MISSION REPORT
 TWINNING CONTRACT Support to the Statistics Kosovo MISSION REPORT on 2.5.3. Continued support to implementation of Action Plan - Annual national accounts and QNA Component no 2 National Accounts Mission
The Spanish economy registered a growth in volume of 3.3% in 2016 The GDP of 2016 stood at 1,118,522 million euros
 12 September 2017 Spanish National Accounts. Base 2010. Update of accounting series 2014 2016 The Spanish economy registered a growth in volume of 3.3% in 2016 The GDP of 2016 stood at 1,118,522 million
COUNTRY REPORT ON IMPLEMENTED SNA IN VIETNAM
 August 15, 2015 COUNTRY REPORT ON IMPLEMENTED SNA IN VIETNAM Name: Nguyen Thi Mai Hanh National Account Department GSO Viet Nam 1. Introduction Since 1989, the System of National Account have been studied
International Monetary Fund Washington, D.C.
 2007 International Monetary Fund August 2007 IMF Country Report No. 07/289 Eastern Caribbean Central Bank: Report on Observance of Standards and Codes Data Module, Response by the Authorities, and Detailed
Use of PPIs for service industries as deflators in an index of services production
 Use of PPIs for service industries as deflators in an index of services production The 18 th Voorburg Group Meeting, Tokyo, October 2003 Eun-Pyo HONG and Richard MCKENZIE, OECD Abstract 1. One of the main
Exhaustiveness, part 1 - Main issues 1
 Exhaustiveness, part 1 - Main issues 1 Introduction This paper continues the series dedicated to extending the contents of the Handbook Essential SNA: Building the Basics 2. One of the main themes in this
International Monetary Fund Washington, D.C.
 2008 International Monetary Fund February 2008 IMF Country Report No. 08/56 Republic of Kazakhstan: Report on the Observance of Standards and Codes Data Module, Response by the Authorities, and Detailed
Annual National Accounts 2016
 Annual National Accounts 2016 Namibia Statistics Agency P.O. Box 2133, FGI House, Post Street Mall, Windhoek, Namibia Tel: +264 61 431 3200 Fax: +264 61 431 3253 Email: info@nsa.org.na www.nsa.org.na Annual
GROSS DOMESTIC PRODUCT THIRD QUARTER 2017
 Gross Domestic Product - Third Quarter 2017 GROSS DOMESTIC PRODUCT THIRD QUARTER 2017 1 www.nsa.org.na Namibia Statistics Agency, P. O. Box 2133, Windhoek, FGI House, Post Street Mall Tel: +264 61 431
REGIONAL COURSE ON SNA 2008 : Improving Exhaustiveness of GDP Coverage FINANCIAL SERVICES. 31 Aug 4 Sept 2015 Daejeon, Republic of Korea
 REGIONAL COURSE ON SNA 2008 : Improving Exhaustiveness of GDP Coverage FINANCIAL SERVICES 31 Aug 4 Sept 2015 Daejeon, Republic of Korea Percentage Share of GDP at Constant 2010 Prices, for year 2014 1.1%
The primary purpose of the International Comparison Program (ICP) is to provide the purchasing
 is to provide the purchasing") CHAPTER 3 National Accounts Framework for International Comparisons: GDP Compilation and Breakdown Process Paul McCarthy The primary purpose of the International Comparison Program (ICP) is to provide
CHAPTER 3 National Accounts Framework for International Comparisons: GDP Compilation and Breakdown Process Paul McCarthy The primary purpose of the International Comparison Program (ICP) is to provide
GROSS DOMESTIC PRODUCT SECOND QUARTER 2015 SEPTEMBER Namibia Statistics Agency. Gross Domestic Product Second Quarter 2015
 GROSS DOMESTIC SEPTEMBER 2015 PRODUCT SECOND QUARTER 2015 Gross Domestic Product Second Quarter 2015 Namibia Statistics Agency 1 Forth coming issue Expected release date Gross Domestic Product Third Quarter
TECHNICAL ASSISTANCE REPORT GOVERNMENT FINANCE STATISTICS
 IMF Country Report No. 18/351 December 2018 THAILAND TECHNICAL ASSISTANCE REPORT GOVERNMENT FINANCE STATISTICS This Technical Assistance report on Thailand was prepared by a staff team of the International
Outline of presentation
 Statement of strategy Developing a programme for the implementation of the 2008 SNA and supporting statistics Seminar on developing the capacity to produce economic statistics, including national accounts
Implementation of 2008 System of National Accounts - Challenges
 Statistics and Applications {ISSN 2454-7395 (online)} Volume 16, No. 2, 2018 (New Series) pp 1-19 Implementation of 2008 System of National Accounts - Challenges A.C. Kulshreshtha 208 E, MIG Flats, Rajouri
REPORT ON OBSERVANCE OF STANDARDS AND CODES (ROSC) DATA MODULE
 DATA MODULE") IMF Country Report No. 15/159 June 2015 OMAN REPORT ON OBSERVANCE OF STANDARDS AND CODES (ROSC) DATA MODULE This Report on the Observance of Standards and Codes Data Module for Oman was prepared by a staff
IMF Country Report No. 15/159 June 2015 OMAN REPORT ON OBSERVANCE OF STANDARDS AND CODES (ROSC) DATA MODULE This Report on the Observance of Standards and Codes Data Module for Oman was prepared by a staff
COUNTRY REPORT OF INDONESIA
 COUNTRY REPORT OF INDONESIA Regional Course on SNA 2008 (Special Topics): Improving Exhaustiveness of GDP Coverage by : Sri Setyarini, S.Si., MM. 22 30 August 2016, Daejeon, Republic of Korea Outline I.
Organisation responsible: Hellenic Statistical Authority (ELSTAT)
") Greece A: Identification Title of the CPI: National Consumer Price Index Organisation responsible: Hellenic Statistical Authority (ELSTAT) Periodicity: Monthly Index reference period: 2009 = 100 Weights
Greece A: Identification Title of the CPI: National Consumer Price Index Organisation responsible: Hellenic Statistical Authority (ELSTAT) Periodicity: Monthly Index reference period: 2009 = 100 Weights
This Press Release is embargoed against publication, telecast or circulation on internet till 5.30 pm today i.e. 28th February
 . PRESS NOTE ON SECOND ADVANCE ESTIMATES OF NATIONAL INCOME 2017-18 AND QUARTERLY ESTIMATES OF GROSS DOMESTIC PRODUCT FOR THE THIRD QUARTER (Q3) OF 2017-18 CENTRAL STATISTICS OFFICE MINISTRY OF STATISTICS
Quarterly National Accounts, part 1: Main issues 1
 Quarterly National Accounts, part 1: Main issues 1 Introduction This paper continues the series dedicated to extending the contents of the Handbook Essential SNA: Building the Basics 2. One of the main
Annual National Accounts
 Annual National Accounts 2013 Est. by Statistics Act 9 of 2011 Namibia Statistics National Accounts : 2013 Agency 1 OUR MISSION In a coordinated manner we produce and disseminate relevant, quality and
QUARTERLY NATIONAL ACCOUNTS INVENTORY
 Statistical Service of Cyprus QUARTERLY NATIONAL ACCOUNTS INVENTORY Nicosia April 2008 2 Table of contents Page Chapter 1: Overview of the system...5 1.1 Organisation and institutional arrangements...5
Current practice and status of the national accounts compilation in Uzbekistan
 Current practice and status of the national accounts compilation in Uzbekistan Regional Course on SNA 2008 (Special Topics): Improving Exhaustiveness of GDP Coverage 22 30 August 2016 Daejeon, Republic
A STRUCTURED APPROACH TO PRICE AND VOLUME MEASURES IN THE NATIONAL ACCOUNTS
 A STRUCTURED APPROACH TO PRICE AND VOLUME MEASURES IN THE NATIONAL ACCOUNTS Presentation to the Regional Seminar on Developing a Programme for the Implementation of the 2008 SNA in the Pacific Region Carl
Paper Prepared for the Special IARIW-SSA Conference on. Measuring National Income, Wealth, Poverty, and Inequality in African Countries
 National Accounts for Malawi: The Effect on GDP of Integrating Supply and Use Tables in the National Accounts and the Requirements for Periodically Main Revisions Lizzie Chikoti (National Statistical Office,
International Monetary Fund Washington, D.C.
 2007 International Monetary Fund May 2007 IMF Country Report No. 07/179 Suriname: Statistical Appendix This Statistical Appendix for Suriname was prepared by a staff team of the International Monetary
Impact of 2008 SNA changes on GDP
 Impact of 2008 SNA changes on GDP Regional Course on 2008 SNA (Special Topics): Improving Exhaustiveness of GDP Coverage 31 August-4 September 2015 Daejeon, Republic of Korea United Nations Statistics
GROSS DOMESTIC PRODUCT SECOND QUARTER 2017
 Gross Domestic Product - Second Quarter 2017 GROSS DOMESTIC PRODUCT SECOND QUARTER 2017 1 www.nsa.org.na Namibia Statistics Agency, P. O. Box 2133, Windhoek, FGI House, Post Street Mall Tel: +264 61 431
Nigerian Gross Domestic Product Report
 Issue 03 Quarter: Three Year: Nigerian Gross Domestic Product Report Quarter Three NATIONAL BUREAU OF STATISTICS Preface This publication provides data on Quarterly Gross Domestic Product (GDP) estimates
Quarterly National Accounts Inventory. Sources and methods of the Quarterly National Accounts for Denmark
 Quarterly National Accounts Inventory Sources and methods of the Quarterly National Accounts for Denmark by Timmi Rølle Graversen Carmela Moreno Baquero Bahar Dudus Daníel Freyr Gústafsson Rasmus Rold
2004 ZANZIBAR BUSINESS CENSUS
 REVOLUTIONARY GOVERNMENT OF ZANZIBAR OFFICE OF CHIEF GOVERNMENT STATISTICIAN 2004 ZANZIBAR BUSINESS CENSUS VOLUME II COMPARISON BETWEEN 2001 CENTRAL REGISTER OF ESTABLISHMENTS AND 2004 ZANZIBAR BUSINESS
Handbook on data template and metadata for short-term statistics
 Handbook on data template and metadata for short-term statistics i Expert Group Meeting on Short-Term Economic Statistics in Western Asia 16-1818 February 2016 Amman, Jordan United Nations Statistics Division
Gross domestic product, 2008 (Preliminary estimation)
") Internet publication www.ksh.hu Hungarian September 2009 Central Statistical Office ISBN 978-963-235-266-4 Gross domestic product, 2008 (Preliminary estimation) Contents Summary...2 Tables...4 Methodological
Internet publication www.ksh.hu Hungarian September 2009 Central Statistical Office ISBN 978-963-235-266-4 Gross domestic product, 2008 (Preliminary estimation) Contents Summary...2 Tables...4 Methodological
TRADE ENTERPRISES CHARACTERISTICS: COSTA RICAN EXPERIENCE
 TRADE ENTERPRISES CHARACTERISTICS: COSTA RICAN EXPERIENCE ABSTRACT International trade statistics are critical economic variables for any country. In order to obtain data of companies involved in international
Economic Statistics Division
 Economic Statistics Division December, 2014 TABLE OF CONTENTS Table of Contents... i List of Tables... iv List of Figures... vi Acknowledgement... vii Abbreviations... viii Chapter 1... 1 1.0 Introduction...
FDI and FATS statistics and tourism
 Regional Workshop on Travel and International Tourism Consumption FDI and FATS statistics and tourism Roseau, Dominica, 14-17 May 2013 1 Value added in Hotels and Restaurants in selected CARICOM Members
TIMOR-LESTE COUNTRY REPORT
 TIMOR-LESTE COUNTRY REPORT SUMMARY At constant prices (2015=100), in 2015 the non- Oil GDP increased 4.0%, following the GDP expenditure (e) approach, as the headline GDP (GDP (e) = GDP). For the other,
National Income and Expenditure 2016
 1. INTRODUCTION National Income and Expenditure 2016 This document accompanies the preliminary estimates of the national accounts for the year 2016 together with revised estimates for the years 2011 to
This Press Release is embargoed against publication, telecast or circulation on internet till 5.30 pm today i.e. 6 th January 2017 PRESS NOTE
 PRESS NOTE ON FIRST ADVANCE ESTIMATES OF NATIONAL INCOME 2016-17 CENTRAL STATISTICS OFFICE MINISTRY OF STATISTICS & PROGRAMME IMPLEMENTATION GOVERNMENT OF INDIA 2 GOVERNMENT OF INDIA MINISTRY OF STATISTICS
This Press Release is embargoed against publication, telecast or circulation on internet till 5.30 pm today i.e. 8th February
 . PRESS NOTE ON ADVANCE ESTIMATES OF NATIONAL INCOME 2015-16 AND QUARTERLY ESTIMATES OF GROSS DOMESTIC PRODUCT FOR THE THIRD QUARTER (Q3) OF 2015-16 CENTRAL STATISTICS OFFICE MINISTRY OF STATISTICS & PROGRAMME
STRATEGIC PLAN
 STRATEGIC PLAN 2010-2012 Skopje, October 2009 Trustworthy official statistics are an indispensable condition for development of the country s democracy and economy. The statistical data are not only numbers,