Economic Statistics Division
|
|
|
- Pauline Brooks
- 6 years ago
- Views:
Transcription


1 Economic Statistics Division December, 2014
2 TABLE OF CONTENTS Table of Contents... i List of Tables... iv List of Figures... vi Acknowledgement... vii Abbreviations... viii Chapter Introduction... 1 Chapter Concepts and Definitions The System of National Accounts (SNA) National Accounts Aggregates Geographical, Gender and Periodic Coverage... 6 Chapter Classification of Economic Activities Agriculture, Hunting and Forestry Crops Livestock Forestry and Hunting Fishery Mining and Quarrying Manufacturing Electricity, Gas and Water Supply Construction Wholesale, Retail Trade and Repairs Hotels and Restaurants Transport, Storage and Communication... 9 i
3 3.10 Financial Intermediation Real Estate, Renting and Business Services Real Estate and Renting Business Services Public Administration and Defense Education Health and Social Work Other Community, Social and Personal Service Activities Non-profit institutions serving households (NPISH) Financial Intermediation Indirectly Measured (FISIM) Taxes less Subsidies on Products Chapter GDP Compilation Methodology Overview of GDP Compilation Production Approach Expenditure Approach Income Approach Chapter Compilation by Activity Agriculture and Fishing Mining and Quarrying Manufacturing Electricity, Gas and Water Supply Construction Wholesale, Retail Trade, and Repairs Hotels and Restaurants Transport, Storage and Communication Financial Intermediation Real Estate, Renting and Business Services Real Estate and Renting ii
4 Business Services Public Administration and Defense Education Health and Social Work Other Community and Personal Services Non-profit institutions serving households (NPISH) Financial Intermediation Indirectly Measured (FISIM) Net Indirect Taxes on Products Rebasing of GDP from base year Chapter Data Analysis of National Aggregates Background Trends in GDP Series Gross Domestic Product at Constant2006 Prices Shares of GDP at Current Market Prices Chapter Expenditure on Gross Domestic Product Chapter Disposable Income Chapter External Transactions Primary Income Exports Imports Exports and Imports of Goods and Services Chapter Capital Formation Appendixes iii
5 LIST OF TABLES Table 1: Table 2: Table 3: Table 4: Table 5: Table 6: Table7: Table 8: Table 9: Table 10: Table 11: Table 12: Table 13: Table 14: Table 15: Gross Domestic Product and Some Allied Aggregates Page Summary Table..24 Selected Important Ratios at Current Prices.25 Gross Domestic Product Estimates at Current Prices (in Million Leones) by Economic Activity..26 Gross Domestic Product at Constant 2006 Prices (in Million Leones) by Economic Activities.27 Annual Growth Rates of Real Goss Domestic Product (Percent) by Economic Activity 28 Implicit Deflators of Gross Domestic Product by Economic Activities (2006 = 100)..29 Shares of Gross Domestic Product (percent) at 2006 Prices by Economic Activity..30 Percentage Contribution to the Gross Domestic Product Growth Rate by Economic Activity (Supply-side Analysis).31 Gross Domestic Product of Agriculture and Fishing at Current and Constant 2006 Prices..32 Gross Domestic Product of Industry & Construction at Current and Constant 2006 Price..32 Gross Domestic Product of Services at Current and Constant 2006 Prices.33 Gross Domestic Product by Type of Expenditure at Current Market Prices..35 Gross Domestic Product by Type of Expenditure at Constant 2006 Market Prices..35 Implicit Deflators of Gross Domestic Product by Type of Expenditure (2006 = 100)..35 National Disposable Income and Its Appropriation at Current Market Prices.37 iv
6 Table 16: Table 17: Table 18: Table 19: Capital Finance at Current Prices.37 Relation among National Accounting Aggregates at Current Basic Prices 37 International Trade Transactions at Current Prices (Le. Millions) 39 Gross Capital Formation at Current Prices 40 v
7 LIST OF FIGURES Pages Figure 1: Figure 2: Figure 3: Figure 4: Figure 5: Figure 6: Figure 7: Gross Domestic Product (GDP) Growth Annual Rates (%)..21 Per Capita GDP (Current US $).20 Average Annual Rates Growth of GDP at 2006 Prices...20 Average Annual Rates Growth of Agriculture & Fishing GDP at 2006 Prices..21 Average Annual Rates Growth of Industry GDP at 2006 Prices...22 Average Annual Rates of Growth of Service GDP at 2006 Prices...22 Composition of Real GDP at 2006 Prices. 23 Figure 8: Composition of GDP by Broad Group s at Current Market Prices in Figure 9: Figure 10: Figure 11: Percentage Composition of Expenditure on GDP at Current Prices.34 Composition of Net National Disposable Income at Current Market Prices..36 Percentage Shares of Export and Imports of Goods and Services to GDP at Current Market Prices..39 Figure 12: Gross Capital Formation at current prices by Public and Private Sector-share of GDP.40 vi
8 ACKNOWLEDGEMENT This publication is the first edition in the series of the publications that records volume estimates for gross domestic product (GDP) at 2006 prices; and it is part of Statistics Sierra Leone s (SSL) effort to provide relevant statistics for informed decision-making in the macroeconomic environment. The publication contains time series of the main national accounts aggregates at current and constant 2006 prices from 2001 to SSL adopted the United Nations System of National Accounts (SNA) 1993 s recommendations for compiling national accounts in 2001 after successfully implemented SNA This means that we can compare our national accounts aggregates with those of other countries in the sub-region and beyond. GDP figures are estimated from the following sources: administrative data received from institutions such as Accountant General s Office, Budget Bureau, Bank of Sierra Leone (BSL), Sierra Leone Insurance Company, Government Gold and Diamond Office, etc.; surveys conducted by other institutions and the Annual Economic Survey (AES) and other surveys conducted by SSL to complement the sources mentioned. I recognize the immense contribution made by Abu Bakarr Turay, Director, Economic Statistics Division and the National Accounts Statistics Section staff (Osman Korma, Clementina Akran and Ibrahim Samura) and all SSL staff in the data collection, processing, drafting and finalization of this report; and the numerous organizations, both public and private institutions, which provided basic data used in the compilation of the aggregates presented in this report. I also acknowledge the valuable contribution of the International Monetary Fund (IMF), who always supports us with timely technical assistance in the area of macroeconomics. Finally, we are very grateful to the Government of Sierra Leone for funding the exercise. Mohamed King-Koroma Statistician General vii
9 ABBREVIATIONS AES BKPS BOP BSL COE CPI FISIM GDP GFCF GGDO GNI GNDI GST GUMA GVA IMF MAFFS MDAs MOFED NPISH NPA RoW SLWACO SLIHS SNA SSL VAT Annual Economic Survey Bo-Kenema Power Station Balance of Payments Bank of Sierra Leo Compensation of Employees Consumer Price Index Financial Intermediation Services Indirectly Measured Gross Domestic Product Gross Fixed Capital Formation Government Gold and Diamond Office Gross National Income Gross National Disposable Income Goods and Services Tax Guma Valley Water Company Gross Value Added International Monetary Fund Ministry of Agriculture Forestry and Food Security Ministries, Departments and Agencies Ministry of Finance and Economic Development Non-Profit Institutions Serving Households National Power Authority Rest of the World Sierra Leone Water Company Sierra Leone Integrated Household Survey System of National Accounts Statistics Sierra Leone Value Added Tax viii
10 CHAPTER Introduction National accounts are an essential tool for analyzing and forecasting economic phenomena. The System of National Accounts (SNA) is the internationally agreed standard set of recommendations on how to compile measures of economic activity in accordance with established accounting conventions based on economic principles. The recommendations are expressed in terms of a set of concepts, definitions, classifications and accounting rules that comprise the internationally agreed standards for measuring such items as gross domestic product (GDP), the most frequently quoted indicator of economic performance. In Sierra Leone, the GDP figures are computed by Statistics Sierra Leone using the 1993 version of the SNA since 2001, which represents a smooth migration from SNA SNA1993 was adopted in 2001 as part of the effort to improve on the quality of national accounts in the post-civil war period. The base year was first revised from 1990 to 2001 in 2001, and it has been further revised from 2001 to 2006 in 2011 to ensure that the estimates not only comply with international standards but also account for recent developments in the economy. As best practice, it is recommended that countries rebase their national accounts every five years, or at most every 10 years, in order to account for changing patterns of consumption and economic activities in the economy. GDP figures are estimated from the following sources: administrative data received from institutions (such as Accountant General s Office, Budget Bureau, Bank of Sierra Leone (BSL), Sierra Leone Insurance Company, Government Gold and Diamond Office, etc.); surveys conducted by other institutions; and the annual economic survey (AES) and other surveys conducted by Statistics Sierra Leone to complement the sources mentioned. This National Accounts Report, 2013 gives consolidated estimates of GDP and other related aggregates for Sierra Leone from 2001 to It is the first edition in the series of publications to incorporate volume estimates for GDP at 2006 prices. GDP figures at 2006 prices are also available in Appendix of the AES Report, published annually by SSL. 1
11 Most of the data used to compile the national accounts are actual reported figures. However, it is not possible to collect regular data for informal activities, such as street harking and subsistence agriculture. For such activities, indirect estimation techniques are used to estimate their contribution to GDP. The SNA states that GDP should also include illegal activities, such as prostitution, drugs and gambling. However, no attempt is made to measure illegal activities, as is the case in other countries. 2
12 CHAPTER Concepts and Definitions The concepts and definitions conform to the United Nations recommendations on the subject as contained in the SNA Definitions of the main aggregates are the following: 2.1 The System of National Accounts (SNA) SNA is a coherent, consistent and integrated set of macro-economic accounts based on internationally agreed concepts, definitions, classifications, and accounting procedures. In 1953, the United Nations Statistical Council (UNSC) produced the first version of A System of National Accounts, which was revised in 1968 and In 2008 the SNA was further revised and the UNSC launched the SNA2008. In terms of GDP, the main changes over the 1993 version relate to the capitalization of research expenditure; expansion of that part of military expenditure to be treated as capital formation; refinement to the calculation of, and distribution of, financial intermediation services indirectly measured (FISIM); and compilation of central bank output. The version SNA 1993 was published in 1993 and countries had being advised to adopt it; now that the SNA 2008 has been published, the recommendation is to move to adopt this system. Generally, the SNA 2008 retains the basic structure of the national accounts of the SNA The following short definitions of the main aggregates (as contained in SNA 93 & 2008) are given here so as to guide users. SSL adopted the SNA 93 in 2001, and is planning to implement the SNA 2008 by National Accounts Aggregates The gross Domestic Product (GDP) is the sum of value added of all domestic producers in the economy. It represents the money value of all goods and services produced within a country out of economic activity during the specified period, which could be quarterly bi-annually or annually (SSL is currently compiling annual GDP estimates), before the provision of consumption of fixed capital-which is GDP by 3
13 production approach. Also GDP can be viewed as the expenditure value of all goods and services available for different domestic final uses or for exports, less expenditure on imports. Thus GDP = final consumption + gross capital formation + exports imports. In addition, the production process creates incomes for not only the owners of the inputs used in production but also for owners of capital and for the government-which is GDP by income approach. The value of those incomes is equal to gross domestic product. Hence, GDP can also be calculated as the sum of compensation of employees, taxes less subsidies and gross operating surplus/mixed income-which is GDP by income approach, defined as: GDP = compensation of employees + taxes - subsidies + gross operating surplus/mixed income GDP at market prices is equal to value added at basic prices, plus taxes less subsidies on products. Gross National Income (GNI) is equal to GDP plus net primary income from abroad. Gross National Disposable Income (GNDI) is the sum of GNI plus net current transfers from the rest of the world. Gross fixed capital formation consists of the net additions to the assets of producers, which are intended to be used in production for more than one year. Thus, this includes value of construction and capital imports. Production in an economic sense can be described as an activity carried out under the control and responsibility of an institutional unit that uses inputs of labour, capital, and intermediate goods and services to produce outputs of goods and services. These outputs must be of a kind that can be delivered to other units, and do have market value, or else such outputs like those of the house wives, output eaten on the farm, etc. are excluded from the production estimates. Consumption of fixed capital is a cost of production, relating to the wear and tear of fixed assets in the process of their use. It measures the decline in the current value of the stock of fixed assets during the accounting period. This current value may differ substantially from the historic costs prevailing at the time when the assets were acquired. It is not viewed as intermediate consumption; rather it is treated as a component of value added. Compensation of employees (COE) is the total remuneration payable by an enterprise to its employees for work done by them during the accounting period. This remuneration therefore includes cash and in-kind payments, whether they 4
14 represent salaries/wages, tips, allowances, bonuses, overtime, fuel/car costs, and housing provision. In a narrow sense, the term employee could only mean formal workers of the establishment with a written contract, who are registered with the social security, and who are non-owners of the establishment. The term worker on the other hand, is generally used and refers to anyone who works for, or on behalf of, the establishment. Workers who are the sole or joint owners of the unincorporated enterprise where they work are classified as self-employed. Workers engaged in production for own final consumption and unpaid family workers also fall in this category. Taxes on products are payable on goods and services when they are produced, sold or used. They include taxes on imports that become payable when products enter the country. Taxes on products are indirect taxes levied on the quantity or unit price of the products being taxed. Subsidies are current transfers that government pays to producers that constitute additions to the income receivable from their output. It is usually estimated as per unit price of the item being subsidized, with the view to reducing the price paid by final consumers for such items. Fuel and rice have been frequently subsidized commodities in Sierra Leone. The basic price is the amount actually receivable by the producer from sale of goods or services. It does not include any deductible taxes on products but, on the other hand, it includes subsidies on products. The purchaser s price is the amount paid by the purchaser, excluding deductible value added tax (VAT) or goods and services tax (GST). They include all other taxes on products. The purchase price also includes any trade and transport margins applied on the delivery of goods. Market price is the valuation used for total GDP, and includes all taxes on products. Household Final Consumption This consists of the expenditure of resident households on goods and services. It includes goods produced for own consumption. 5
15 Non-Profit Institutions Serving Households Final Consumption This covers the expenditure of non-profit institutions serving households (NPISH), which is made on behalf of households. Government Final Consumption This consists of expenditures incurred by both Central and Local Government on goods and services including defense, security, general administration and those relating to the provision of health, education and other services. Gross Capital formation This consists of purchases less sales of assets that are used in production. It thus includes expenditures on construction (residential and non-residential), imports of capital goods and inventories of establishments. Net Exports This is the difference between exports and imports of goods and services measured at free on board (FOB) cost. Exports constitute goods leaving the country and services rendered by resident persons and establishments to non-resident persons and establishments. Imports constitute goods entering the country and services received by resident persons and establishments from non-resident persons and establishments. Net exports constitute a critical part of the current account balance (CAB) of the balance of payments (BOP). 2.3 Geographical, Gender and Periodic Coverage The estimates presented in this report are at the national level for the whole country. We do not compile regional or local council GDP due to the centralized nature of our economy. It is quite difficult or even impossible to isolate activities carried out at regional or local council level from the data collected for the GDP compilation. In the same vein, it is not possible to disaggregate GDP by gender since economic activities are not organized along gender lines. Currently, GDP is only estimated annually; however, SSL are investigating the feasibility of compiling quarterly GDP estimates. 6
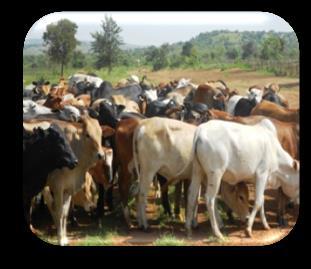
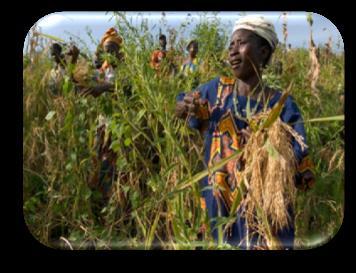
16 CHAPTER Classification of Economic Activities Sierra Leone uses the International Standards of Industrial Classification (ISIC Revision 3.1) which classifies economic activities into 15 categories namely; Agriculture, Hunting and Forestry Fishing Mining and Quarrying Manufacturing Electricity Gas and Water Supply Construction Wholesale and Retail Trade, Repair of motor vehicles, motorcycles, personal and household goods Transport, Storage and Communications Financial Intermediation Real Estate, Renting and Business Services Public Administration and Defense; Compulsory Social Security; Education Health and Social Work Other Community, Social and Personal Services Hotels and Restaurants 3.1 Agriculture, Hunting and Forestry Crops This activity covers major food crops, cash crops as well as other crops. Major food crops include rice, cassava, sweet potatoes, maize, and ground nut. On the other hand, major cash crops include cocoa, coffee, kola nut, oil palm and cashew nuts. Other crops include vegetables and fresh fruits Livestock The activity includes slaughtered animals (cattle, goats, sheep, pigs, poultry and rabbit); milk and other livestock products; it also includes the increase in inventories of cattle, goat, sheep and poultry. 7
17 3.1.3 Forestry and Hunting Forestry covers the production of logs, charcoal, fuel wood, honey and beeswax while, hunting includes animals hunted by tourist and domestic hunters, trophies and sold live animals. The increase in value of nurseries of trees is included as part of capital formation. 3.2 Fishery Fishing activity in Sierra Leone covers the harvested fish and shrimps from both marine and fresh waters including rivers, lakes and dams; it includes both industrial fishing and artisanal and subsistence household fishing activity. 3.3 Mining and Quarrying Mining is a major activity which involves extraction of both underground and surface minerals and other materials. It includes the mining of diamonds, gold, rutile, illiminite, bauxite, zacom and very recently iron ore. The activity also covers sand extraction and stone-breaking quarrying activities. 3.4 Manufacturing This activity involves the conversion of raw materials into finished goods. The main categories include; food, dairy products, grain milling, soft drinks, alcoholic beverages, textiles, paper products, chemicals, metals, non-metals, cement, machinery and other food products. 3.5 Electricity, Gas and Water Supply The activity covers all establishments engaged in the generation, distribution and transmission of electricity and gas. It also includes production and distribution of water to various consumers. However the small scale electricity generated in the country by individuals/households such as solar energy is not captured as yet due to lack of data on such activity. 3.6 Construction The activity covers the process of site preparation, complete construction of parts of civil engineering, installation or demolition of buildings or other structures. Construction of buildings consists of residential and non-residential as well as rural 8
18 own-account construction, whereas construction of other works consists of land improvement, roads and bridges, power stations, dams and wells and other structures. 3.7 Wholesale, Retail Trade and Repairs This activity covers wholesale and retail trade, repairs of motor vehicles, motorcycles as well as personal, household goods and sale of fuel and gas. 3.8 Hotels and Restaurants The activity covers establishments engaged in running of hotels and restaurants, night clubs, bars and casinos. It covers services provided to tourists as well as residents. 3.9 Transport, Storage and Communication Transport and Communication activities consist of all forms of road, water and air transport. It also includes postal services, airline services, and telecommunication activities Financial Intermediation The activity consists of establishments engaged in financial intermediation, including the central bank, the Bank of Sierra Leone (BSL), other banks and non-bank financial institutions, insurance and foreign exchange bureau Real Estate, Renting and Business Services This covers real estate, renting and other business services activities Real Estate and Renting This activity covers all types of dwellings both owner-occupied and rented. The dwellings (owner-occupied and rented) are categorized by urban and rural and further by types of construction materials used for the walls Business Services The activity involves business services activities such as accountancy, auditing, architects, consultancy, research and development. 9
19 3.12 Public Administration and Defense Public administration covers activities of central and local government, as well as compulsory social security funds Education Education covers public and private establishments that are engaged in delivering education services in the country Health and Social Work Health and Social Work covers public and private establishments that are engaged in delivering health services in the country Other Community, Social and Personal Service Activities The activity covers establishments that are engaged in providing services such as sewage and refuse disposal; sanitation, recreational, cultural and sporting and similar activities Non-profit institutions serving households (NPISH) This activity covers activities of international and national non-governmental organizations (NGOs), membership organization serving households, and civil society organizations providing services to households Financial Intermediation Indirectly Measured (FISIM) This series represents the payment for the services of commercial banks, which is included within interest receivable on loans and interest payable on deposits. According to the SNA2008, this output of the commercial banks, should be distributed to the sectors of the economy that deposited and or contracted loans during the production period. However, under the SNA 1993, there was the option to record the total payment as a deduction from value added Taxes less Subsidies on Products This is difference between the taxes on product and subsidies as obtained from the government budget. 10
20 CHAPTER GDP Compilation Methodology 4.1 Overview of GDP Compilation The methodologies used are based on the 1993 SNA. As is the case in many countries, SSL only compiles the production and expenditure measures of GDP. These production and expenditure estimates are compiled at current and 2006 prices. 4.2 Production Approach In this approach, GDP estimates at market prices are derived by summing up the gross value added at basic prices of each industry and adding on total taxes less subsidies on products. 4.3 Expenditure Approach The expenditure approach measure GDP as the sum of final uses of goods and services. Therefore, GDP at market prices by this approach is derived by adding up the purchases that are made for final consumption by households, NPISH and government; gross capital formation; exports less imports. Export minus imports is also referred to as next exports and it is a critical part of the current account balance of the balance of payments (BOP). 4.4 Income Approach Income approach considers the incomes received by all the factors of production for their part in the production process. Incomes include compensation of employees (for labour), operating surplus/mixed income (for Entrepreneur), and net taxes on production. Thus GDP is the sum total of all these incomes, including depreciation of fixed capital, which is generated during a period of one year. 11
21 CHAPTER Compilation by Activity 5.1 Agriculture and Fishing The data on crops, livestock, forestry, and fishing were obtained from the Ministry of Agriculture, Forestry and Food Security (MAFFS).Adjustments are made for informal production, based on benchmark estimates obtained from the 2003/04 Sierra Leone Integrated Household Survey (SLIHS).The constant 2006 price estimates are derived using reported data on quantities. For crops, land under cultivation, yield ratio and post-harvest loss for each of crop were used to estimate output; while, as fertilizer is the major purchase, it is used as the indicator for estimating intermediate input ratios for the crops. 5.2 Mining and Quarrying Data on quantities of minerals produced by type were obtained from the Government Gold and Diamond Office (GGDO), the Bank of Sierra Leone (BSL) and Ministry of Mines and Mineral Resources. The mineral export values were used for diamonds, gold, rutile, illiminite and bauxite; while production figures were used for the iron ore; intermediate consumption for each mineral were estimated based on the 2006input output ratios, except for iron ore, whose intermediate consumption is estimated separately, based on the reported operating costs of the companies involved in iron ore production. The constant 2006 price estimates are derived using reported data on quantities. 5.3 Manufacturing The GDP for this activity was estimated using data from the BSL real sector data, the AES) and from the SLIHS Estimates for the informal activities were estimated on the basis of the SLIHS 2003 data; using the change in the population growth rate to drive the estimates from year to year for the constant price. 12
22 5.4 Electricity, Gas and Water Supply The estimates at current prices for electricity are based on the analysis of the annual accounts of National Power Authority (NPA) and Bo-Kenema Power Supply (BKPS). The constant price indicator is a weighted average of electricity production for all activities in the country. The number of units sold to all customers is used as an indicator for the constant price estimates. For water supply, the public sector estimates are based on analysis of Guma Valley Water Company (GUMA) and Sierra Leone Water Company (SLWACO), which supply water in Freetown and the regional areas respectively. The number of units sold is used as an indicator for constant price estimate. The private sector includes private suppliers - water deliveries are common since the demand in urban areas exceeds supply. Also, private water collection from rivers and other sources is a major activity in some areas, but it is not included in the estimates due to data limitation. 5.5 Construction The quantity of cement (produced locally and imported) is used to drive the constant price estimates. The current price estimates are derive by inflating the constant price figures using the change in a construction price index, compiled by SSL using the weighted prices of cement and paint. Rural own account construction constant price estimates are based on estimates of the value of such construction obtained from the SLIHS 2003 and population growth. The CPI was used as an inflator to obtain the current price rural own account construction estimates. 5.6 Wholesale, Retail Trade, and Repairs An indirect method is used to determine the output of wholesale and retail trade by first determining the amount of agricultural products, livestock, forestry products, fishery products, mining (diamonds and gold), manufacturing goods and imports that are brought to the market. A ratio is applied to the resulting values to derive the trade margins. The ratio was estimated from the 2005 census of business establishments. The CPI is used as a deflator to obtain constant price estimates. 5.7 Hotels and Restaurants The benchmark estimates for hotels and restaurants were estimated from the AES Annual movements are estimated on the basis of tourist s arrivals, tourist expenditures and annual population growth. 13
23 5.8 Transport, Storage and Communication The road transport industry includes only those operators whose predominant business is transportation. Annual movements are based on the registration of vehicles as well as the revenue derived from commercial vehicles. Current price estimates for air and sea transport were derived by analyzing the profit and loss accounts for the respective operators. Estimates at current prices for communication activities are derived from the analysis of the accounts of the relevant operators (posts, telecommunication and internet providing companies). The constant prices estimates are based on the number of units consumed/sold, and the CPI is used to derive the current price estimates. 5.9 Financial Intermediation The current price estimates for financial intermediation are based on an analysis of company accounts - both in the public and private sectors. Constant price estimates are derived by deflation using the total CPI series. The indicators for insurance and bureau de change activities are the total number of employees and amounts of currency exchanged, respectively Real Estate, Renting and Business Services Real Estate and Renting Information on growth in the population is used to extend forward the number of dwellings in the benchmark year. The benchmark estimates were obtained from the market value of rent for dwellings constructed using different materials, as reported in the SLIHSS 2003, as well as the population growth rate. The resultant rents for urban and rural dwellings are summed for each type of construction material. The proportions of each type of owner occupied dwelling were also obtained from the analysis of SLIHS These proportions were used to split the values of rent for each type of dwelling between owner-occupied and rented dwellings. The CPI for rent is used as the price indicator to obtain current price estimates for both categories. 14
24 Business Services Business services at constant prices were estimated on the basis of the quantity indicators for mining, manufacturing and hotels activities. The CPI(all items)was used as the price indicator to derive current price estimates Public Administration and Defense Estimates were derived directly from government accounts. Value added was derived as the total of personal emoluments, pensions, gratuities and a portion of traveling allowances. The total CPI is used as a deflator to derive the constant price estimates Education Gross value added for public schools at current prices was to a larger extent estimated from Government expenditure on education. Gross value added at constant prices was estimated by deflating GVA at current prices using CPI on education. The value added at current prices for private component was estimated by inflating GVA at constant prices using CPI for education. GVA at constant prices was estimated on the basis of the number of enrolled students Health and Social Work Gross value added for public health facilities at current prices were to a large extent is estimated from Government expenditure on health. Gross value added at constant prices was estimated by deflating GVA at current prices using CPI on health. The value added at current prices for private component was estimated by inflating GVA at constant prices using CPI for health. GVA at constant prices was estimated on the basis of the number of patients attended Other Community and Personal Services Gross Output at Current prices was estimated by extrapolating benchmark output using value index derived from CPI (all items) and index of population growth rates. Gross Output at constant prices was estimated by extrapolating benchmark output using growth rates of population as a quantity index. 15
25 5.15 Non-profit institutions serving households (NPISH) Gross Output at Current prices was estimated by estimating the cost of producing the services, which included compensation of employees and consumption fixed capital. CPI is used as a deflator to obtain constant price estimates 5.16 Financial Intermediation Indirectly Measured (FISIM) This is measured as the difference between the interest received and interest payable by the deposit money banks. CPI is used as a deflator to obtain constant price estimates. This item is netted from over all GDP Net Indirect Taxes on Products This is difference between the taxes on product and subsidies as obtained from the government budget. Constant estimates are obtained by blowing the benchmark estimates using the growth of GDP at basic prices Rebasing of GDP from base year The base year for national accounts compilation was revised from 1990 to 2001 in 2001, and it has been further revised from 2001 to 2006 in 2011 to ensure that the estimates do not only comply with international standards but also account for recent developments in the economy, especially in the mining industry. As best practice, it is recommended that countries national accounts be rebased every five year, or at the extreme end every 10 years in order to accounts for changing patterns in the economy. Since our base year was 2001 and given the fact that a good number of new activities (re-)surfaced during 2006, the year has been chosen for the new base year. New activities included in the 2001 series (but their compilation actually started in 2006), include mobile communication, gold mining, bauxite, rutile and illiminte mining, as well as expanded financial sector including foreign exchange bureaus. Being the year of heavily indebted poor country (HIPC) initiative (debt relief) completion point, 2006 is also considered to be a stable year in terms of prices (stable inflation) and fiscal discipline (low deficit). The rebasing process was supported by the International Monetary Fund (IMF), who provided three Technical Missions (TAs) in 2011 to facilitate the process. The Missions reviewed the rebasing methodology in line with international best practice and provided hands-on-training. The rebasing process incorporated the following activities: 16
26 1) A new methodology is introduced-updated methodology for compilation 2) A new source datasets were included-for some industries 3) A new price index is constructed-for all industries using 2006 prices as base Key activities/methodologies introduced include: A new product, char coal was added to the forestry output. A new activity-land improvement was introduced in the construction of industry, subsistence fish catch is adjusted as proportion of artisanal fish catch rather than as a proportion of total artisanal and industrial fish catch. A data on loan provisions made by commercial banks was obtained and included in the profit before tax returns of commercial banks; this amount was previously netted out before estimating GDP. Intermediate consumption (IC) for commercial bank was separately estimated from FISIM; previously FISIM was assumed to be the IC of commercial banks. Construction prices index was constructed using cement and paint products, this index is used as the deflator/inflator for construction aggregates. Received and used updated data on crops and livestock for period from the Ministry of Agriculture Forestry and Food Security (MAFFS). Added new manufacturing products (such as oxygen gas, common soap and flour) for the estimation of manufacturing output. Gold was added on the mining output, as well as treated as one of the tradable minerals in the domestic market along side with diamonds. On the expenditure side, capital formation and inventories were estimated for forestry and livestock activities as new activities. Also transport and installation cost of equipment was included as part of the capital formation. On the income side, informal private sector wages was estimated and included in the accounts; and other taxes (direct taxes) were obtained from the government budget profile and included in the accounts. The result of the rebasing exercises shows that normal (current price) GDP increased by 10-16% between 2006 and 2009, whiles real (constant price) GDP increased by 44-48% for the same period 17
27 CHAPTER Data Analysis of National Aggregates 6.1 Background Sierra Leone is a small country with a population of about 6 million, which is full of economic potentials, not only because it is endowed with a broad range of natural resources, including a sizable deposits of gold, diamonds, bauxite, rutile, iron ore, but also has fertile land for agriculture, forestry and high valued fishery products as well as high profiled human resources. The mining sector accounts far less than 6% of GDP between 2001 and 2011, although this contribution increased to 12% of GDP in 2012 and 23 percent in 2013 due mainly to the discovery and mining of iron ore in 2011 in the Northern Region of the country. Coffee, cocoa and fish are the major agricultural exports of the country. The manufacturing sector consisting mainly of import substituting industries is small and makes only a marginal contribution of 2% of GDP. Agriculture being the main stay of the economy, contributes 41 percent of real GDP in 2013, followed by services and industry, which account for about 29% and 27 of real GDP respectively. On a whole, the economy of Sierra Leone continued to recover in 2013 from the financial and economic crisis of 2008/2009. The 2013 real GDP (with iron ore) grew by 20.1 percent, from Le 8,438,400 million in 2012 to Le 10,137,732 million in 2013, making Sierra Leone to be among the fastest growing economies in Sub-Saharan Africa with annual average growth rate of 4.9 percent. Although much of the growth is coming from the extractive industries, it nevertheless represents huge effort on the part of the government and the people, considering the fact that Sierra Leone is still a post conflict country with huge challenges faced by investors. The leap in economic activities in the country since 2010 seems to have come along with declining levels of poverty as indicated by the drop in the proportion of the population living under the poverty line of one dollar a day from 66.0% in 2003 to 52.9% in 2011 (Poverty Report, SSL) also witnessed, for the first time in more than five years, single digit inflation (year-on-year), a stable exchange rate against the USD and declining interest rates. There are however, concerns regarding the inclusiveness of this growth as more than half of the population is still below the poverty line. 18
28 GDP Growth Rate (%) Since the end of the civil war in 2002, Sierra Leone has achieved milestones in the area of economic growth and development as depicted by the GDP growth rates which rank very favorable with the Sub-Saharan average as well as Ghana between 2009 and 2013 as shown in Figure 1. Figure 1: Gross Domestic Product (GDP) Growth Annual Rates (%) Year Sub-Saharan Africa Sierra Leone Ghana Source: Statistics Sierra Leone (SSL); IMF Regional Economic Outlook-Sub-Saharan Africa, 2014; Ghana Statistiscal Services: Figure 1 shows that real GDP growth rate for Sierra Leone in 2012 and 2013 has been more than Ghana real GDP growth rate, which also has oil as a releavtive new activity, just as we have iron ore as a reslatively new activity; SSA real GDP growth rates, on the other hand, have been flate at 4.9 percent in 2012 and This undersores the fact that Sierra Leone has been making tremedous efforts to expand output and economic activity. In addition, Figure 2 shows that GDP per capita has almost doubled since 2009, which is good news for poverty reduction as it gives an indication of the amount of resources available in the country to the average person, which could be distributed. However, it is clear that Sierra Leone is still US$ less than the US$ 1, 026, which is the per capita GDP required for Sierra Leone to achieve the dream of becoming a lower middle income country by the year
29 Figure 2: Per Capita GDP (Current US $) Source: Statistics Sierra Leone (SSL) 6.2 Trends in GDP Series The Real GDP figures estimated at 2006 prices show in Figure 3 that Sierra Leone has continued to enjoy robust economic growth since 2009, notwithstanding the negative impact of the 2008/09 financial and economic crisis that emanated from the US housing market crisis. The economy started re-bouncing back from the crisis in Real GDP grow by 5.3 percent in 2010 and 6.0 percent in 2011, largely on account of growth in agriculture, mining, manufacturing, construction and services. Figure 3: Average Annual Rates Growth of GDP at 2006 Prices The graph presents the Average Annual Rates of Growth of total GDP at 2006 prices from 2009 to The GDP in real terms grew by 3.2 percent in 2009 compared to 5.8 percent in

30 Percent (%) In addition, the real GDP growth rate of 15.2% in 2012 represents a 9.2 percentage point increase above the 2011 estimates, which underscores the important role of iron ore production in GDP estimation as it reflected the increase in iron ore volume produced from 137, 000 tons in 2011 to 6,600,000 tons in Also in 2013 GDP grew by 20.1 percent mainly due to the production of 14.7 million tons of iron ore, which represents a significant leap in our effort towards becoming a middle income country. Non-iron ore GDP grew at a much slower rate from 5.3 and 5.5% in 2012 and 2013 respectively, which could be due to the slow growth experienced in the electricity and manufacturing industries during those years. Figure 4: Average Annual Rates Growth of Agriculture & Fishing GDP at 2006 Prices Agriculture and Fishing Growth Rate (%) Year As the main sector of the economy, the output of the Agriculture sector continues to grow since However growth in the sector slowed down to 3.8% in 2012 partly due to the fact that tractorization policy, which aims at expanding land under cultivation, had reached it limit and that the backup policy of establishing agricultural business centers (ABC) for farmers, which is needed to enhance productivity and processing of produce was still at the embryonic stage. This Agriculture growth is supported by growth in the crop (under Small Holder Commercialization Programme (SHCP) policy of the government), forestry (timber and charcoal), livestock and fishery. 21
31 Percent (%) Percent (%) Figure 5: Average Annual Rates Growth of Industry GDP at 2006 Prices Industry Growth Rate (%) Year The Industrial sector suffered heavily during the structural crisis faced by mining companies in 2008 and the financial crisis of 2008/2009. As a result the sector recoded negative growth rates of 4.8% in 2009; mainly due to decline in the mining output of diamond, bauxite and rutile. The growth rate in 2012 of is realized mainly from increased iron ore production and construction. This is also true for the 94.3 percent in 2013, although this 2013 growth rate suffered from the base effect realized in 2012, it is however still very impressive. Figure 6: Average Annual Rates of Growth of Service GDP at 2006 Prices Services Growth Rate (%) Year The service sector grew by 6.1% in 2012 and 6.0% in 2013 supported mainly by growth in the sub-sectors like public administration services, Transport and Communication, trade, tourism, and Banking, which continue to record impressive growth rates. 6.3 Gross Domestic Product at Constant 2006 Prices Gross domestic product (GDP) is among the most important economic indicators. Total GDP at 2006 prices after adjusting for FISIM was 8,438,400 million Leones and 22

32 10,137,732 million Leones in 2012 and 2013 respectively. The sectoral shares show that agriculture is the main stay of the economy contributing 47 percent of GDP in 2012 and 41 percent in This is followed by services which contributed 31 percent of GDP in 2012 and 28 percent of GDP in Industry contributed 16.8 percent in 2012 and 27 percent in 2013 Figure 7: Composition of Real GDP at 2006 Prices Real GDP (%) 2012 Real GDP (%) Agriculture Services Industry Indirect taxes Agriculture Services Industry Indirect taxes 6.4 Shares of GDP at Current Market Prices In 2012 the share of Agriculture industry was 50.8 percent, Industry and Construction 14.6 percent, services including FISIM 31.0 percent and taxes 3.7 percent in nominal terms. Figure 8: Composition of GDP by Broad Group s at Current Market Prices in 2009 Nominal GDP (%) Nominal GDP (%) Agriculture Industry Agriculture Industry Services Indirect taxes Services Indirect taxes In 2013 the contribution of agriculture decline to 48 percent; that of services declined to 26.3 percent; while that of industry increase to 22.2 percent. 23
33 Table 1: Gross Domestic Product and Some Allied Aggregates Summary Table No Aggregate Gross Domestic Product at b.p 7,887,790 9,691,433 12,273,994 15,853,167 20,542,530 2 Gross Domestic Product at m.p. 8,308,293 10,256,144 12,752,935 16,460,656 21,286,675 3 Gross Domestic Product at m.p. (million US$) 2,454 2,578 2,944 3,789 4,913 4 Gross Domestic Product at m.p. (million US$) 6,561,889 6,912,753 7,311,605 7,702,069 8,127,139 5 Non-iron ore Gross Domestic Product at m.p. (million Leones) 8,308,293 10,256,144 12,723,002 15,331,631 17,920,436 6 Non-iron ore Gross Domestic Product at m.p. (million US$) 2,454 2,578 2,937 3,529 4,136 7 Gross National Income at m.p. 9,022,901 10,369,277 13,219,247 14,941,283 19,563,827 8 Net National Income at m.p. 8,691,555 9,990,108 12,726,549 14,449,509 18,826,166 9 Net National Disposable Income at m.p 9,269,933 10,821,001 13,568,138 15,441,519 19,829, Gross National Disposable Income at m.p 9,601,279 11,200,170 14,060,836 15,933,293 20,567, Gross Fixed Capital Formation 799,404 3,150,100 5,315,874 4,082,899 2,968, Gross Capital Formation 830,263 3,188,376 5,365,826 4,600,592 2,712, Government Final Consump. Exp. at m.p 873,436 1,066,555 1,289,136 1,693,056 1,855, Household Final Consumption Exp. at m.p 7,617,290 7,627,908 10,933,598 13,099,016 16,663, Gross Savings at m.p 923,817 2,318,428 1,610, ,109 1,753, Per capita GDP (Le) 1,481,526 1,784,671 2,165,155 2,726,330 3,438, Per Capita GDP ($) at m.p AT 2006 PRICES 18 Gross Domestic Product at b.p 6,231,915 6,565,135 6,957,146 8,051,089 9,729, Non-iron ore Gross Domestic Product at b.p 6,231,915 6,565,135 6,943,930 7,314,759 7,718, Gross Fixed Capital Formation 633,496 2,152,799 3,061,180 2,201,095 1,863, Gross Capital Formation 657,331 2,178,504 3,089,670 2,529,715 1,892,833 Growth Rates (%) 22 GDP at current market prices GDP at constant 2006 prices Non-Iron Ore GDP constant at 2006 prices Change in GDP deflator Change in Non-Iron Ore GDP deflator NB: b.p. =>basic price m.p. =>market prices. Exp.=>Expenditure 24
National Bureau of Statistics Ministry of Finance Dar-es-Salaam
 THE UNITED REPUBLIC OF TANZANIA National Bureau of Statistics Ministry of Finance Dar-es-Salaam October, 2013 PREFACE The publication National Accounts of Tanzania Mainland 2001-2012 is the fifth in the
Preliminary Annual. National Accounts. Preliminary Annual National Accounts 2016
 Preliminary Annual National Accounts 2016 Preliminary Annual National Accounts 2016 1 Mission Statement In a coordinated manner produce and disseminate relevant, quality and timely statistics that are
PRELIMINARY ANNUAL NATIONAL ACCOUNTS 2014
 PRELIMINARY ANNUAL NATIONAL ACCOUNTS 2014 Est. by Statistics Act 9 of 2011 Preliminary Annual National Account 2014 Namibia Statistics Agency 1 MISSION STATEMENT In a coordinated manner we produce and
Annual National Accounts 2016
 Annual National Accounts 2016 Namibia Statistics Agency P.O. Box 2133, FGI House, Post Street Mall, Windhoek, Namibia Tel: +264 61 431 3200 Fax: +264 61 431 3253 Email: info@nsa.org.na www.nsa.org.na Annual
1 INTRODUCTION. 1.1 Background
 A Report of the Informal Economy in Sierra Leone (Draft paper for the Expert Group Meeting on Accounting for the Informal Sector in National Accounts) Osman Awoto Soltani-Koroma Statistician and Head Business
National Accounts Estimates ( ) September 2018 issue
 September 2018 issue") National Accounts Estimates (2015 2018) September 2018 issue 1. INTRODUCTION This issue of Economic and Social Indicators presents National Accounts estimates for the period 2015 to 2018. Concepts and
National Accounts Estimates (2015 2018) September 2018 issue 1. INTRODUCTION This issue of Economic and Social Indicators presents National Accounts estimates for the period 2015 to 2018. Concepts and
National Accounts Estimates ( ) March 2018 issue
 March 2018 issue") National Accounts Estimates (2015 2018) March 2018 issue 1. INTRODUCTION This issue of Economic and Social Indicators presents National Accounts estimates for the period 2015 to 2018. Concepts and definitions
National Accounts Estimates (2015 2018) March 2018 issue 1. INTRODUCTION This issue of Economic and Social Indicators presents National Accounts estimates for the period 2015 to 2018. Concepts and definitions
Annual National Accounts
 Annual National Accounts 2013 Est. by Statistics Act 9 of 2011 Namibia Statistics National Accounts : 2013 Agency 1 OUR MISSION In a coordinated manner we produce and disseminate relevant, quality and
Gross Domestic Product , preliminary figures for Aruba
 Gross Domestic Product 2000 2006, preliminary figures for Aruba Central Bureau of Statistics Aruba Oranjestad, December 2007 COPYRIGHT RESERVED Use of the contents of this publication is allowed, provided
National Accounts
 Republic of Namibia National Accounts 1996 2006 Sectoral Contribution to GDP, 2006 Primary Sector 22.1% Tertiary Sector 51.6% Secondary Sector 18.4% Central Bureau of Statistics National Planning Commission
NATIONAL ACCOUNTS STATISTICS TO KINGDOM OF TONGA. May Price: T$25.00
 SDT: 35-07 KINGDOM OF TONGA NATIONAL ACCOUNTS STATISTICS 2001-02 TO 2009-10 May 2011 Statistics Department P.O. Box 149, Nuku alofa Government of Tonga Telephone: (676) 23-300 / 23-913 Email: dept@stats.gov.to
NATIONAL ACCOUNTS STATISTICS
 SDT: 35-06 KINGDOM OF TONGA NATIONAL ACCOUNTS STATISTICS 2010 October 2010 Statistics Department P.O. Box 149, Nuku alofa Government of Tonga Telephone: (676) 23-300 / 23-913 Fax : (676) 24-303 Email :
International Monetary Fund Washington, D.C.
 2006 International Monetary Fund February 2006 IMF Country Report No. 06/52 Vietnam: Statistical Appendix This Statistical Appendix paper for Vietnam was prepared by a staff team of the International Monetary
NOTES ON METHODOLOGY AND REVISIONS IN THE ESTIMATES
 NOTES ON METHODOLOGY AND REVISIONS IN THE ESTIMATES The new series on National Accounts Statistics was introduced through a Press Release on January 30, 2015 with base year 2011-12 in place of previous
International Monetary Fund Washington, D.C.
 2006 International Monetary Fund November 2006 IMF Country Report No. 06/423 Vietnam: Statistical Appendix This Statistical Appendix for Vietnam was prepared by a staff team of the International Monetary
THE UNITED REPUBLIC OF TANZANIA
 THE UNITED REPUBLIC OF TANZANIA National Bureau of Statistics Ministry of Finance Dar-es-Salaam October, 2015 PREFACE This publication of National Accounts of Tanzania Mainland 2007-2014 is the first in
S Y S T E M O F N A T I O N A L A C C O U N T S REPORT 2016
 T H E CAYMAN ISLANDS S Y S T E M O F N A T I O N A L A C C O U N T S REPORT 2016 NOVEMBER 2017 T H E ECONOMICS AND STATISTIC S OFFICE TABLE OF CONTENTS Page ACKNOWLEDGEMENT... i ABBREVIATIONS AND ACRONYMS...
Nigerian Gross Domestic Product Report
 Issue 03 Quarter: Three Year: Nigerian Gross Domestic Product Report Quarter Three NATIONAL BUREAU OF STATISTICS Preface This publication provides data on Quarterly Gross Domestic Product (GDP) estimates
Outline of presentation. National Accounts Office September 2016 Chiba, Japan
 25-27 September 2016 Chiba, Japan National Accounts Office Office of the National Economic and Social Development Board (NESDB) Outline of presentation Short Term Indicator Quarterly Gross Domestic Product
National Accounts GROSS DOMESTIC PRODUCT BY PRODUCTION, INCOME AND EXPENDITURE APPROACH
 TB 01 Thematic Bulletin ISSN 2232-7789 National Accounts GROSS DOMESTIC PRODUCT BY PRODUCTION, INCOME AND EXPENDITURE APPROACH Bosnia and Herzegovina BHAS Agency for Statistic of Bosnia and Herzegovina
Validation of National Accounts Expenditures
 Chapter 21 Validation of National Accounts Expenditures Price data and accounts data are the two pillars of the Inter Comparison Program (ICP). Because purchasing power parities (PPPs) are derived from
Accounts, Indicators and Policy Use with 2008 SNA Framework
 Accounts, Indicators and Policy Use with 28 SNA Framework Regional Seminar on Developing a Programme for the Implementation Programme of the 28 SNA and the Implementation Strategy for the SEEA Central
Fiscal Year 2015 Statistical Appendices. August, 2016
 Fiscal Year 2015 Statistical Appendices August, 2016 Acknowledgements This FY2015 Statistical Compendium was prepared by the Graduate School USA, Pacific Islands Training Initiative, Honolulu, Hawaii in
Lesson: VII Expenditure Components of GDP: Part I
 An Introduction to System of National Accounts Lesson: VII Expenditure Components of GDP: Part I Fourth Intermediate-Level e-learning Course on 2008 System of National Accounts September - November 2014
Compilation of Quarterly GDP: Methods, Problems, and Solution The case of Thailand
 Strengthening Regional Capacities for Statistical Development in Southeast Asia Project Sponsored by UNSD, ESCAP and ASEAN Secretariat Bangkok, 6-10 August 2001 Compilation of Quarterly GDP: Methods, Problems,
Item
 223 POPULATION a, b Total population million; as of 1 July 5.704 6.156 6.665 6.744 6.731 6.784 6.813 6.857 Population density c persons per square kilometer 5296 5840 6200 6260 6240 6280 6310 6350 Population
NATIONAL ACCOUNTS STATISTICS 2014 AN OVERVIEW
 NATIONAL ACCOUNTS STATISTICS 2014 AN OVERVIEW 1. THE PUBLICATION 1.01 The Central Statistics Office (CSO), Ministry of Statistics and Programme Implementation, regularly compiles estimates of national
National Accounts Statistics Report 2015
 National Accounts Statistics Report 2015 Private Bag 0024, Gaborone. Tel: 3671300 Fax: 3952201 E-mail: info@statsbots.org.bw Website: http://www.statsbots.org.bw 2. Preface Published by STATISTICS BOTSWANA
THE UNITED REPUBLIC OF TANZANIA QUARTERLY GROSS DOMESTIC PRODUCT OF TANZANIA MAINLAND
 THE UNITED REPUBLIC OF TANZANIA QUARTERLY GROSS DOMESTIC PRODUCT OF TANZANIA MAINLAND National Bureau of Statistics Ministry of Finance Economic Affairs Dar es Salaam May, 2010 Table of Contents 1.0 Introduction...
Croatian Quarterly National Accounts Inventory based on ESA 2010 methodology
 Croatian Quarterly National Accounts Inventory based on ESA 2010 methodology Grant agreement 04121.2015.002-2015.168 Contact persons: Natalija Krunić (KrunicN@dzs.hr) - QGDP by Production and Income Approach
The primary purpose of the International Comparison Program (ICP) is to provide the purchasing
 is to provide the purchasing") CHAPTER 3 National Accounts Framework for International Comparisons: GDP Compilation and Breakdown Process Paul McCarthy The primary purpose of the International Comparison Program (ICP) is to provide
CHAPTER 3 National Accounts Framework for International Comparisons: GDP Compilation and Breakdown Process Paul McCarthy The primary purpose of the International Comparison Program (ICP) is to provide
Gross domestic product, 2008 (Preliminary estimation)
") Internet publication www.ksh.hu Hungarian September 2009 Central Statistical Office ISBN 978-963-235-266-4 Gross domestic product, 2008 (Preliminary estimation) Contents Summary...2 Tables...4 Methodological
Internet publication www.ksh.hu Hungarian September 2009 Central Statistical Office ISBN 978-963-235-266-4 Gross domestic product, 2008 (Preliminary estimation) Contents Summary...2 Tables...4 Methodological
Quarterly National Accounts Inventory Croatia
 Quarterly National Accounts Inventory Croatia IPA 2011 Multi-beneficiary Statistical Co-operation Programme Contact persons: Verica Roknić (RoknicV@dzs.hr) - GDP by Expenditure Approach Department Natalija
METHODOLOGY OF COMPILING QUARTERLY GDP ESTIMATES
 METHODOLOGY OF COMPILING QUARTERLY GDP ESTIMATES The Central Statistical Organisation (CSO) introduced the quarterly estimates of Gross Domestic Product (GDP) on 30.6.1999. Quarterly Releases include GDP
Malaysia. Key Indicators for Asia and the Pacific Item
 Key Indicators for Asia and the Pacific 2017 1 POPULATION Total population million; as of 1 July 23.49 24.03 24.54 25.04 25.54 26.05 26.55 27.06 27.57 28.08 28.59 29.06 29.51 29.92 30.60 31.20 31.66 Population
International Monetary Fund Washington, D.C.
 2007 International Monetary Fund February 2007 IMF Country Report No. 07/48 Ukraine: Statistical Appendix This Statistical Appendix for Ukraine was prepared by a staff team of the International Monetary
GROSS DOMESTIC PRODUCT SECOND QUARTER 2015 SEPTEMBER Namibia Statistics Agency. Gross Domestic Product Second Quarter 2015
 GROSS DOMESTIC SEPTEMBER 2015 PRODUCT SECOND QUARTER 2015 Gross Domestic Product Second Quarter 2015 Namibia Statistics Agency 1 Forth coming issue Expected release date Gross Domestic Product Third Quarter
GDP REBASING REPORT BASE YEAR 2015
 REVOLUTIONARY GOVERNMENT OF ZANZIBAR OFFICE OF THE CHIEF GOVERNMENT STATISTICIAN GDP REBASING REPORT BASE YEAR 2015 November, 2018 PREFACE This report is the second GDP rebasing publication that presents
Nigerian Gross Domestic Product Report
 Issue Quarter: Four Year: Nigerian Gross Domestic Product Report Quarter Four 2015 Preface This publication provides data on Quarterly Gross Domestic Product (GDP) estimates for the four quarters of 2014,
Reviving the Production of National Accounts and Implementing the System of National Accounts (SNA 2008)
") Reviving the Production of National Accounts and Implementing the System of National Accounts (SNA 2008) Moffat Nyoni, Zimbabwe National Statistics Agency Paper Prepared for the Special IARIW-SSA Conference
Reviving the Production of National Accounts and Implementing the System of National Accounts (SNA 2008) Moffat Nyoni, Zimbabwe National Statistics Agency Paper Prepared for the Special IARIW-SSA Conference
This Press Release is embargoed against publication, telecast or circulation on internet till 5.30 pm today i.e. 28th February
 . PRESS NOTE ON SECOND ADVANCE ESTIMATES OF NATIONAL INCOME 2017-18 AND QUARTERLY ESTIMATES OF GROSS DOMESTIC PRODUCT FOR THE THIRD QUARTER (Q3) OF 2017-18 CENTRAL STATISTICS OFFICE MINISTRY OF STATISTICS
China, People s Republic of
 1 POPULATION Total population as of 31 December (million) 1,267.4 1,276.3 1,284.5 1,292.3 1,299.9 1,307.6 1,314.5 1,321.3 1,328.0 1,334.5 1,340.9 1,347.4 1,354.0 1,360.7 1,367.8 1,374.6 1,382.7 1,390.1
PDCOUNTRY DEMOGRAPHICS
 PDCOUNTRY DEMOGRAPHICS The population, GDP (and its breakdown), value added by economic activity, implicit price deflator, GNI, and exchange rate demographics provided are among the most important parts
Supply and Use Tables for Macedonia. Prepared by: Lidija Kralevska Skopje, February 2016
 Supply and Use Tables for Macedonia Prepared by: Lidija Kralevska Skopje, February 2016 Contents Introduction Data Sources Compilation of the Supply and Use Tables Supply and Use Tables as an integral
This Press Release is embargoed against publication, telecast or circulation on internet till 5.30 pm today i.e. 6 th January 2017 PRESS NOTE
 PRESS NOTE ON FIRST ADVANCE ESTIMATES OF NATIONAL INCOME 2016-17 CENTRAL STATISTICS OFFICE MINISTRY OF STATISTICS & PROGRAMME IMPLEMENTATION GOVERNMENT OF INDIA 2 GOVERNMENT OF INDIA MINISTRY OF STATISTICS
At IBISWorld, we know that industry intelligence is more than assembling facts: It's combining data and insight to answer the questions that
 At IBISWorld, we know that industry intelligence is more than assembling facts: It's combining data and insight to answer the questions that successful businesses ask IBISWorld Australia Business Environment
National accounts of the Netherlands
 National accounts of the Netherlands å 2014 National accounts of the Netherlands 2014 Explanation of symbols. Data not available * Provisional figure ** Revised provisional figure (but not definite) x
Hong Kong, China. Key Indicators for Asia and the Pacific 2018
 Key Indicators for Asia and the Pacific 2018 1 POPULATION a Total population as of 1 July (million) 6.7 6.7 6.7 6.7 6.8 6.8 6.9 6.9 7.0 7.0 7.0 7.1 7.2 7.2 7.2 7.3 7.3 7.4 Population density b (persons/km
NATIONAL ACCOUNTS STATISTICS 2013 AN OVERVIEW
 NATIONAL ACCOUNTS STATISTICS 2013 AN OVERVIEW 1. THE PUBLICATION 1.01 The Central Statistics Office (CSO), Ministry of Statistics and Programme Implementation, regularly compiles estimates of national
Fiji. Key Indicators for Asia and the Pacific Item
 1 POPULATION Total population as of 1 July ( 000) 802.0 805.0 810.0 816.0 821.0 827.0 830.0 834.5 841.4 845.5 850.7 854.3 858.0 862.1 865.7 869.5 873.2 884.9 Population density (persons/km 2 ) 44 44 44
Gross domestic product of Montenegro for period
 MONTENEGRO STATISTICAL OFFICE RELEASE No: 211 Podgorica, 30. September 2015 When using these data, please name the source Gross domestic product of Montenegro for period 2010-2014 Real growth rate of gross
NATIONAL ECONOMIC ACCOUNTS 2010 (Provisional Estimates)
") REPUBLIC OF CYPRUS NATIONAL ECONOMIC ACCOUNTS 2010 (Provisional Estimates) STATISTICAL SERVICE National Accounts Statistics Series II Report No. 27 Obtainable from the Printing Office of the Republic of
REPUBLIC OF CYPRUS NATIONAL ECONOMIC ACCOUNTS 2010 (Provisional Estimates) STATISTICAL SERVICE National Accounts Statistics Series II Report No. 27 Obtainable from the Printing Office of the Republic of
18th International INFORUM Conference, Hikone, September 6 to September 12, Commodity taxes, commodity subsidies, margins and the like
 18th International INFORUM Conference, Hikone, September 6 to September 12, 2010 Commodity taxes, commodity subsidies, margins and the like Josef Richter University of Innsbruck Faculty of Economics and
Viet Nam. Key Indicators for Asia and the Pacific Item
 Key Indicators for Asia and the Pacific 2018 1 POPULATION Total population as of 1 July (million) 77.11 78.12 79.08 80.00 80.95 81.91 82.85 84.22 85.12 86.03 86.93 87.84 88.81 89.76 90.73 91.71 92.69 93.67*
National Accounts Framework for International Comparisons:
 International Comparison Program Chapter 3 National Accounts Framework for International Comparisons: GDP Compilation and Breakdown Process Paul McCarthy Measuring the Size of the World Economy ICP Book
DESCRIPTION OF SOURCES AND METHODS USED TO COMPILE NON-FINANCIAL NATIONAL ACCOUNTS
 DESCRIPTION OF SOURCES AND METHODS USED TO COMPILE NON-FINANCIAL NATIONAL ACCOUNTS BANJA LUKA, JUNE 2012 Description of sources and methods used to compile non-financial National accounts 2 CONTENTS Foreword...
Gross domestic product of Montenegro in 2011
 MONTENEGRO STATISTICAL OFFICE R E L E A S E No: 257 Podgorica, 28 September 2012 When using the data please name the source Gross domestic product of Montenegro in 2011 Real growth rate of gross domestic
NATIONAL ACCOUNTS STATISTICS Highlights
 Per Capita Income (in Rs.) NATIONAL ACCOUNTS STATISTICS 218 Highlights 1. The Gross Domestic Product at constant (211-12) prices for the year 217-18 is estimated at ` 13.1 lakh crore, as against the estimate
3.1 Scheduled Banks' Liabilities and Assets
 3.1 Scheduled Banks' Liabilities and Assets Liabilities/Assets (Million Rupees) 2015 2016 2017 2018 Jun Dec Jun Dec Jun Dec Jun Liabilities Capital 501,119.9 540,096.2 548,631.7 552,067.2 657,627.1 517,287.1
This Press Release is embargoed against publication, telecast or circulation on internet till 5.30 pm today i.e. 8th February
 . PRESS NOTE ON ADVANCE ESTIMATES OF NATIONAL INCOME 2015-16 AND QUARTERLY ESTIMATES OF GROSS DOMESTIC PRODUCT FOR THE THIRD QUARTER (Q3) OF 2015-16 CENTRAL STATISTICS OFFICE MINISTRY OF STATISTICS & PROGRAMME
Fiscal Year 2017 Statistical Appendices
 Fiscal Year 2017 Statistical Appendices August, 2018 Acknowledgements This FY2017 Statistical Compendium was prepared by the Graduate School USA, Pacific Islands Training Initiative, Honolulu, Hawaii in
Contents. Oeur Sophal, Deputy Director of Department
 National Accounts of Cambodia Oeur Sophal, Deputy Director of Department \\csng14p20101\covsea$\ibduser\cambodia\project Tiger\Ratings Review\S&P\Ratings Review_22Oct2007_sent.ppt /1 Contents 1. Background
FDI and FATS statistics and tourism
 Regional Workshop on Travel and International Tourism Consumption FDI and FATS statistics and tourism Roseau, Dominica, 14-17 May 2013 1 Value added in Hotels and Restaurants in selected CARICOM Members
National Income Accounting
 National Income Accounting Expenditure and Output Measures Example from Ghana - Newsletter Limitations of the GDP Measure Production that is not bought or sold does not generally get counted. Although
དཔལ ལ ན འབ ག གཞ ང ར ལ ཡ ཞ ས ར ས དད བད འའནན. National Accounts Statistics National Statistics Bureau Royal Government of Bhutan Thimphu : Bhutan
 དཔལ ལ ན འབ ག གཞ ང ར ལ ཡ ཞ ས ར ས དད བད འའནན National Accounts Statistics 2014 National Statistics Bureau Royal Government of Bhutan Thimphu : Bhutan Foreword National Statistics Bureau (NSB) is pleased
Hong Kong, China. Key Indicators for Asia and the Pacific 2017
 Key Indicators for Asia and the Pacific 2017 1 POPULATION a Total population b million; as of 1 July 6.665 6.714 6.744 6.731 6.784 6.813 6.857 6.916 6.958 6.973 7.024 7.072 7.150 7.179 7.230 7.291 7.337
This Press Release is embargoed against publication, telecast or circulation on internet till 5.30 pm today i.e. 31 st January, 2018.
 This Press Release is embargoed against publication, telecast or circulation on internet till 5.30 pm today i.e. 31 st January, 2018. PRESS NOTE ON FIRST REVISED ESTIMATES OF NATIONAL INCOME, CONSUMPTION
Nigerian Gross Domestic Product Report
 Issue Quarter: Three Year: 2015 Nigerian Gross Domestic Product Report Quarter Three 2015 Preface This publication provides data on Quarterly Gross Domestic Product (GDP) estimates for the four quarters
Guidelines for the Notes on National Accounts Methodology
 Guidelines for the Notes on National Accounts Methodology In addition to the national accounts data, metadata on the national accounts methodology is published in the United Nations publication: National
FOURTH QUARTER GDP 2012
 FOURTH QUARTER GDP 2012 FOURTH QUARTER GDP 2012 1 MISSION STATEMENT In a coordinated manner produce and disseminate relevant, quality and timely statistics that are fit-for-purpose in accordance with international
Gross domestic product of Montenegro in 2016
 MONTENEGRO STATISTICAL OFFICE R E L E A S E No:174 Podgorica 29 September 2017 When using the data pleaase name the source Gross domestic product of Montenegro in 2016 Real growth rate of gross domestic
GOVERNMENT OF INDIA MINISTRY OF STATISTICS & PROGRAMME IMPLEMENTATION
 GOVERNMENT OF INDIA MINISTRY OF STATISTICS & PROGRAMME IMPLEMENTATION Dated, the 28 th November, 2018 7 th Agrahayana, 1940 Saka NATIONAL ACCOUNTS STATISTICS: BACK-SERIES 2004-05 TO 2011-12 Base year of
TIMOR-LESTE COUNTRY REPORT
 TIMOR-LESTE COUNTRY REPORT SUMMARY At constant prices (2015=100), in 2015 the non- Oil GDP increased 4.0%, following the GDP expenditure (e) approach, as the headline GDP (GDP (e) = GDP). For the other,
2.4. Price development. GDP deflator
 2.4. Price development GDP deflator Differing changes in domestic and external prices The same growth in the implicit deflator for production as in intermediate consumption The differing influence of domestic
Gross Domestic Product: June 2009 quarter
 Embargoed until 10:45am 23 September 2009 Highlights Gross domestic product (GDP): Economic activity was up 0.1 percent in the June 2009 quarter, following five quarters of contraction. Activity in the
Quarterly National Accounts
 An Phríomh-Oifig Staidrimh Central Statistics Office 18 December Seasonally Adjusted growth rates (% change on previous quarter) Quarterly National Accounts Quarter 3 % 5.0 3.0 1.0 GDP and GNP seasonally
Nauru. Key Indicators for Asia and the Pacific Item
 Key Indicators for Asia and the Pacific 2018 1 POPULATION Total population a as of 1 July ( 000) 10.1 10.1 10.1 9.9 9.7 9.5 9.1 9.2 9.4 9.5 9.7 10.1 10.3 10.8 11.9 12.5 13.0 13.3 Population density (persons/km
18 NOV Nigerian Gross Domestic Product Report (expenditure approach) Q2 2015
 Q2 2015") 18 NOV 2015 Nigerian Gross Domestic Product Report (expenditure approach) Q2 2015 PREFACE This publication provides data on Quarterly Gross Domestic Product (GDP) by the EXPENDITURE approach estimates
18 NOV 2015 Nigerian Gross Domestic Product Report (expenditure approach) Q2 2015 PREFACE This publication provides data on Quarterly Gross Domestic Product (GDP) by the EXPENDITURE approach estimates
GROSS DOMESTIC PRODUCT, FIRST QUARTER OF 2018 (PRELIMINARY DATA)
") GROSS DOMESTIC PRODUCT, FIRST QUARTER OF 2018 (PRELIMINARY DATA) In the first quarter of 2018 Gross Domestic Product (GDP) 1 at current prices amounts to 21 479 million BGN. In Euro terms GDP is 10 982
GROSS DOMESTIC PRODUCT, FIRST QUARTER OF 2018 (PRELIMINARY DATA) In the first quarter of 2018 Gross Domestic Product (GDP) 1 at current prices amounts to 21 479 million BGN. In Euro terms GDP is 10 982
Macro Economics & National Income Accounting. Samir K Mahajan
 Macro Economics & National Income Accounting MACROECONOMICS (Ragner Frisch ) Macroeconomics looks at the economy as an organic whole. Macroeconomics studies economic aggregates such as: total output, total
Gross Domestic Product: September 2009 quarter
 Embargoed until 10:45am 23 December 2009 Highlights Gross domestic product (GDP): Economic activity was up 0.2 percent in the September 2009 quarter, following a 0.2 percent increase in the June 2009 quarter.
India. Key Indicators for Asia and the Pacific Item
 1 POPULATION a Total population as of 1 October (million) 1,019 1,040 1,056 1,072 1,089 1,106 1,122 1,138 1,154 1,170 1,186 1,220 1,235 1,251 1,267 1,283 1,299 1,316 Population density (persons/km 2 )
Netherlands. May 2018 Statistical Factsheet
 May 2018 Statistical Factsheet Netherlands CONTENTS Main figures 1. KEY DATA 2. POPULATI ON & ECONOMY 3. FINANCIAL ASPECTS 4. ECONOMI C ACCOUNTS 5. AGRICULTURAL TRADE 6. FARM STRUCTURE 1 2 3 4-5 6-12 13-14
Italy. May 2018 Statistical Factsheet
 May 2018 Statistical Factsheet Italy CONTENTS Main figures 1. KEY DATA 2. POPULATI ON & ECONOMY 3. FINANCIAL ASPECTS 4. ECONOMI C ACCOUNTS 5. AGRICULTURAL TRADE 6. FARM STRUCTURE 1 2 3 4-5 6-12 13-14 15-16
Austria. May 2018 Statistical Factsheet
 May 2018 Statistical Factsheet Austria CONTENTS Main figures 1. KEY DATA 2. POPULATI ON & ECONOMY 3. FINANCIAL ASPECTS 4. ECONOMI C ACCOUNTS 5. AGRICULTURAL TRADE 6. FARM STRUCTURE 1 2 3 4-5 6-12 13-14
Estonia. May 2018 Statistical Factsheet
 May 2018 Statistical Factsheet Estonia CONTENTS Main figures 1. KEY DATA 2. POPULATI ON & ECONOMY 3. FINANCIAL ASPECTS 4. ECONOMI C ACCOUNTS 5. AGRICULTURAL TRADE 6. FARM STRUCTURE 1 2 3 4-5 6-12 13-14
Data Appendix Understanding European Real Exchange Rates, by Mario J. Crucini, Christopher I. Telmer and Marios Zachariadis
 Data Appendix Understanding European Real Exchange Rates, by Mario J. Crucini, Christopher I. Telmer and Marios Zachariadis This appendix provides further description of our data sources and manipulations
Gross Domestic Product: June 2012 quarter
 Gross Domestic Product: June 2012 quarter Embargoed until 10:45am 20 September 2012 Key facts Gross domestic product (GDP): Economic activity increased 0.6 percent in the June 2012 quarter. Agriculture
TECHNICAL ASSISTANCE REPORT NATIONAL ACCOUNTS STATISTICS MISSION. Copies of this report are available to the public from
 IMF Country Report No. 17/187 July 2017 SURINAME TECHNICAL ASSISTANCE REPORT NATIONAL ACCOUNTS STATISTICS MISSION This Technical Assistance report on Suriname was prepared by a staff team of the International
GROSS DOMESTIC PRODUCT, THIRD QUARTER OF 2018 (PRELIMINARY DATA)
") GROSS DOMESTIC PRODUCT, THIRD QUARTER OF 2018 (PRELIMINARY DATA) In the third quarter of 2018 Gross Domestic Product (GDP) 1 at current prices amounts to 29 822 million BGN. In Euro terms GDP is 15 248
GROSS DOMESTIC PRODUCT, THIRD QUARTER OF 2018 (PRELIMINARY DATA) In the third quarter of 2018 Gross Domestic Product (GDP) 1 at current prices amounts to 29 822 million BGN. In Euro terms GDP is 15 248
France. May 2018 Statistical Factsheet
 May 2018 Statistical Factsheet France CONTENTS Main figures 1. KEY DATA 2. POPULATI ON & ECONOMY 3. FINANCIAL ASPECTS 4. ECONOMI C ACCOUNTS 5. AGRICULTURAL TRADE 6. FARM STRUCTURE 1 2 3 4-5 6-12 13-14
Kathmandu, Nepal, September 23-26, 2009
 Session Number: Session 8b (Parallel) Time: Friday, September 25, 14:00-15:30 Paper Prepared for the Special IARIW-SAIM Conference on Measuring the Informal Economy in Developing Countries Kathmandu, Nepal,
GROSS DOMESTIC PRODUCT THIRD QUARTER 2017
 Gross Domestic Product - Third Quarter 2017 GROSS DOMESTIC PRODUCT THIRD QUARTER 2017 1 www.nsa.org.na Namibia Statistics Agency, P. O. Box 2133, Windhoek, FGI House, Post Street Mall Tel: +264 61 431
A Comparison of Official and EUKLEMS estimates of MFP Growth for Canada. Wulong Gu Economic Analysis Division Statistics Canada.
 A Comparison of Official and EUKLEMS estimates of MFP Growth for Canada Wulong Gu Economic Analysis Division Statistics Canada January 12, 2012 The Canadian data in the EU KLEMS database is now updated
Statistical Factsheet. France CONTENTS. Main figures - Year 2016
 June 2017 Statistical Factsheet France CONTENTS Main figures 2016 1. KEY DATA 2. POPULATION & ECONOMY 3. FINANCIAL ASPECTS 4. ECONOMIC ACCOUNTS 5. AGRICULTURAL TRADE 6. FARM STRUCTURE 1 2 3 4-5 6-12 13-14
Statistical Factsheet. Belgium CONTENTS. Main figures - Year 2016
 June 2017 Statistical Factsheet Belgium CONTENTS Main figures 2016 1. KEY DATA 2. POPULATION & ECONOMY 3. FINANCIAL ASPECTS 4. ECONOMIC ACCOUNTS 5. AGRICULTURAL TRADE 6. FARM STRUCTURE 1 2 3 4-5 6-12 13-14
Statistical Factsheet. Italy CONTENTS. Main figures - Year 2016
 June 2017 Statistical Factsheet Italy CONTENTS Main figures 2016 1. KEY DATA 2. POPULATION & ECONOMY 3. FINANCIAL ASPECTS 4. ECONOMIC ACCOUNTS 5. AGRICULTURAL TRADE 6. FARM STRUCTURE 1 2 3 4-5 6-12 13-14
Papua New Guinea. Key Indicators for Asia and the Pacific 2017
 1 POPULATION Total population a million; as of 1 July 5.2 5.4 5.5 5.7 5.9 6.1 6.2 6.4 6.6 6.8 7.1 7.3 7.5 7.7 8.0 8.2 8.5 Population density persons per square kilometer 11 12 12 12 13 13 13 14 14 15 15
PRESS RELEASE: THE DEPARTMENT OF STATISTICS RELEASES GROSS DOMESTIC PRODUCT (GDP) 2017 FIGURES
 2017 FIGURES") PRESS RELEASE: THE DEPARTMENT OF STATISTICS RELEASES GROSS DOMESTIC PRODUCT (GDP) 2017 FIGURES The National Accounts Section of the Department of Statistics announces the release of a revised data series
PRESS RELEASE: THE DEPARTMENT OF STATISTICS RELEASES GROSS DOMESTIC PRODUCT (GDP) 2017 FIGURES The National Accounts Section of the Department of Statistics announces the release of a revised data series
GROSS DOMESTIC PRODUCT
 GROSS DOMESTIC PRODUCT September 2014 2013 HIGHLIGHTS GDP = $5.6 billion, marginally up 0.7% in 2013 In 2013, Gross Domestic Product (GDP), which measures the total value of goods and services produced