Business cycle. Outline Presentation: Outline
|
|
|
- Trevor Crawford
- 5 years ago
- Views:
Transcription

1 Business cycle Govinda Prasad Nyaupane Statistics Officer Central Bureau of Statistics Nepal Outline Presentation: Outline Nepal and its Statistical System Concept of business cycle. Nepalese practices on measuring business cycle.
2 Nepal and its Statistical System A land locked country situated between India and China Federal republic administrative system sq. km of land area and 28.7 million population. Diverse land structure from plain (Tarai) area to high mountains (including Mt. Everest of 8848 m.) Social diversity with 125 caste/ethnic groups, 123 linguistic groups and 10 religious groups. Low income country with per capita income of 862 US $ (2017) and annual GDP of 26 billion % population under poverty line National Statistical System of Nepal De facto decentralized Central Bureau of Statistics (CBS) as NSO and other ministries/departments involve in statistical functions as their requirement Universities and research centers, central bank as other stakeholders in NSS National Statistical Council as a coordinating body Statistical Act 1959 as an umbrella act regulating the statistical activities CBS with its 33 branch offices has mandate to conduct censuses and surveys, produce national account statistics and indices, coordinating statistical activities.

3 Business Cycle: Concept Periodic change in economy or business Cycle related to business are also termed as trade cycle or economic ups and downs. A cycle consists of more than a year,may be taken for several year. A complete cycle has four component as prosperity, recession,depression, and recovery. Cycle are never regular in periodicity and amplitude. Business Cycle: Concept
4 Nepal: Business Cycle Measurement Practice Annual GDP figures obtained through annual national accounts (ANA) has been taken as the major tool to measure the economic ups and downs A long series of GDP and its growth figures has been published since 1961/62 Recently quarterly national accounts figures have been published as short term indicators to measure the business cycle within a year. International comparison program (ICP) has recently been started. Nepal: Business Cycle Measurement Practice Some indices as CPI, WPI, MPPI, PPI etc. have been prepared for assisting the measurement practice National censuses and major surveys as Population Census, Agriculture Census, Census of Manufacturing, NLSS, Annual Household Survey (AHS), NLFS, Household Budget Survey data assist for GDP compilation Various ministries and departments, universities, government owned enterprises have been supplying data for GDP compilation.
5 Nepal: Business Cycle Measurement Practice GDP predominantly based on Value added approach Separate estimates of expenditure components except change in stock is in practice Change in stock: residually estimated due to data gap No explicit statistical discrepancy is used Attempt to produce GDP by income approach Annual GDP figures published both in constant and current prices Preliminary, Revised and Final estimates (final of previous year of the last F.Y, preliminary of current year and revised estimate of last year) Nepal: Business Cycle Measurement Practice Base year for constant price GDP is 2004/05 and planning for base shifting Macro economic indicators Real GDP (at basic price and producers price), Real GDP by primary, secondary and tertiary sector Per capita GDP (in constant price) Gross national income (current and constant price) Gross national disposable income (GNDI) Gross national saving Gross capital formation etc.
6 Nepal: Business Cycle Measurement Practice Compiles national accounts only of 15 economic sectors among 17 of SNA Supply and use tables (SUT) have been prepared two times (2004 and 2017) Adopted SNA 1993 and attempts to adopt SNA 2008 For migration to SNA 2008, efforts like Economic census, bench mark surveys are planned to be conducted Strengthening secondary data sources (administrative sources) by implementing NSDS Nepal: GDP and its Growth scenario Table 1 Gross Domestic Product (at current prices) (Rs. in millions) Industrial Classification 2008/ / / / / / / /16R 2016/17P Agriculture and Forestry Fishing Mining and Quarrying Manufacturing Electricty Gas and Water Construction Wholesale and Retail Trade Hotels and Restaurants Transport, Storage and Communications Financial Intermediation Real Estate, Renting and Business Activities Public Administration and Defence Education Health and Social work Other Community, Social and Personal Service Activities Total GVA including FISIM 938,890 1,118,571 1,290,142 1,437,474 1,580,426 1,822,173 1,971,706 2,071,917 2,392,621 Financial Intermediation Services Indirectly Measured (FISIM) Gross Domestic Product (GDP) at basic prices 909,528 1,083,415 1,248,482 1,387,482 1,525,221 1,758,738 1,899,089 1,987,824 2,293,989 Taxes less Subsidies on Products Gross Domestic Product (GDP) 988,272 1,192,774 1,366,954 1,527,344 1,695,011 1,964,540 2,130,150 2,247,427 2,599,234 R = Revised/P = Preliminary
 Industrial Classification 2008/09 2009/10 2010/11 2011/12 2012/13 2013/14 2014/15 2015/16R 2016/17P Agriculture and Forestry 198257 202196 211271 220950 223310 233448 235775 235330")
7 Nepal: GDP and its Growth scenario Table 2 Gross Domestic Product (at constant 2000/01 prices) (Rs. in millions) Industrial Classification 2008/ / / / / / / /16R 2016/17P Agriculture and Forestry Fishing Mining and Quarrying Manufacturing Electricty Gas and Water Construction Wholesale and Retail Trade Hotels and Restaurants Transport, Storage and Communications Financial Intermediation Real Estate, Renting and Business Activities Public Administration and Defence Education Health and Social Work Other Community, Social and Personal Service Activities Agriculture, Forestry and Fishing Non-agriclture Total GVA including FISIM 566, , , , , , , , ,818 Financial Intermediation Services Indirectly Measured (FISIM) Gross Domestic Product (GDP) at basic prices 542, , , , , , , , ,539 Taxes less Subsidies on Products Gross Domestic Product (GDP) 590, , , , , , , , ,049 Nepal: GDP and its Growth scenario Table 3 Gross Domestic Product by Expenditure Category (at current prices) (Rs. in millions) Description 2008/ / / / / / / /16R 2016/17P Gross Domestic Product (GDP) 988,272 1,192,774 1,366,954 1,527,344 1,695,011 1,964,540 2,130,150 2,247,427 2,599,234 Final Consumption Expenditure 895,042 1,056,185 1,176,030 1,359,539 1,516,129 1,730,312 1,934,046 2,161,519 2,332,741 Government Consumption 106, , , , , , , , ,738 Collective Consumption 69,838 77,473 86, , , , , , ,283 Individual Consumption 36,689 41,716 44,845 54,800 55,420 59,863 56,208 67,225 88,455 Private Consumption 772, ,993 1,022,126 1,167,861 1,318,561 1,493,375 1,662,962 1,861,157 1,981,514 Food 484, , , , , ,132 1,100,694 1,228,426 1,287,139 Non-food 203, , , , , , , , ,442 Services 84, , , , , , , , ,934 Nonprofit Institutions Serving Households 15,753 20,002 22,987 27,307 29,161 35,022 38,552 40,659 46,489 Actual Final Consumption Expenditure of Household 825, ,712 1,089,958 1,249,969 1,403,142 1,588,260 1,757,722 1,969,041 2,116,458 Gross capital formation 313, , , , , , , ,680 1,104,962 Gross Fixed Capital Formation(GFCF) 211, , , , , , , , ,605 Government 44,278 53,665 63,806 71,555 75,386 94, , , ,293 Private 166, , , , , , , , ,312 Change in Stock 101, , , , , , , , ,357 Net exports of goods and services -219, , , , , , , , ,469 Imports 342, , , , , , , ,110 1,092,108 Goods 279, , , , , , , , ,574 Services 63, ,295 87, , , , ,533 Exports 122, , , , , , , , ,638 Goods 69, ,512 85, ,961 98,276 74,866 90,400 Services 52, ,352 95, , , , ,238 R = Revised/P = Preliminary Soucre: Central Bureau of Statistics
8 Nepal: GDP and its Growth scenario Table 4 Gross National Disposable Income and Saving (at current prices) (Rs. in millions) 2008/ / / / / / / /16R 2016/17P Gross Domestic Product (GDP) 988,272 1,192,774 1,366,954 1,527,344 1,695,011 1,964,540 2,130,150 2,247,427 2,599,234 Compensation of Employees 365, , , , , , , , ,863 Taxes less Subsidies on Production and Imports 79, , , , , , , , ,698 Taxes less Subsidies on Production ,110 1,294 1,447 1,409 1,453 Taxes less Subsidies on Products 78, , , , , , , , ,245 Operating surplus/mixed income, Gross 542, , , , , ,858 1,029,918 1,068,464 1,317,672 Factor Income, Net 11,750 9,117 7,549 12,291 13,079 32,752 34,243 34,004 27,785 Gross National Income (GNI) 1,000,021 1,201,891 1,374,503 1,539,635 1,708,090 1,997,291 2,164,392 2,281,431 2,627,019 Current Transfers, Net 249, , , , , , , , ,658 Gross National Disposable Income (GNDI) 1,249,508 1,484,539 1,682,362 1,962,407 2,205,791 2,628,792 2,874,349 3,059,618 3,470,677 Final Consumption Expenditure 895,042 1,056,185 1,176,030 1,359,539 1,516,129 1,730,312 1,934,046 2,161,519 2,332,741 Gross Domestic Saving 93, , , , , , ,103 85, ,493 Gross National Saving 354, , , , , , , ,098 1,137,936 Gross Capital Formation 313, , , , , , , ,680 1,104,962 Lending/Borrowing (Resource gap) (+/-) 41,437-28,135-12,936 75,979 57,060 89, , ,419 32,974 R = Revised/P = Preliminary Soucre: Central Bureau of Statistics Nepal: GDP and its Growth scenario Table 5 Summary of Macro Economic Indicators Description 2008/ / / / / / / /16R 2016/17P Percapita GDP (NRs.) Annual Change in Nominal Per Capita GDP (%) Percapita GNI (NRs.) Annual Change in Nominal Percapita GNI (%) Percapita GNDI (NRs.) Annual Change in Nominal Percapita GNDI (%) Percapita GDP at constant price (NRs.) Annual Change in Real Percapita GDP (%) Percapita GNI at constant price (NRs.) Annual Change in Real Percapita GNI (%) Percapita GNDI at constant price (NRs.) Annual Change in Real Percapita GNDI (%) Percapita Incomes in US$ Nominal Percapita GDP (US$) Nominal Percapita GNI (US$) Nominal Percapita GNDI (US$) Final Consumption Expenditure as Percentage of GDP Gross Domestic saving as Percentage of GDP Gross National Saving as Percentage of GDP Exports of Goods and Services as Percentage of GDP Imports of Goods and Services as Percentage of GDP Gross Fixed Capital Formation as Percentage of GDP Resource Gap as Percentage of GDP( +/-) Workers' Remittances as Percentage of GDP Exchange Rate (US$: NRs) Population (millions) R = Revised/P = Preliminary Soucre: Central Bureau of Statistics

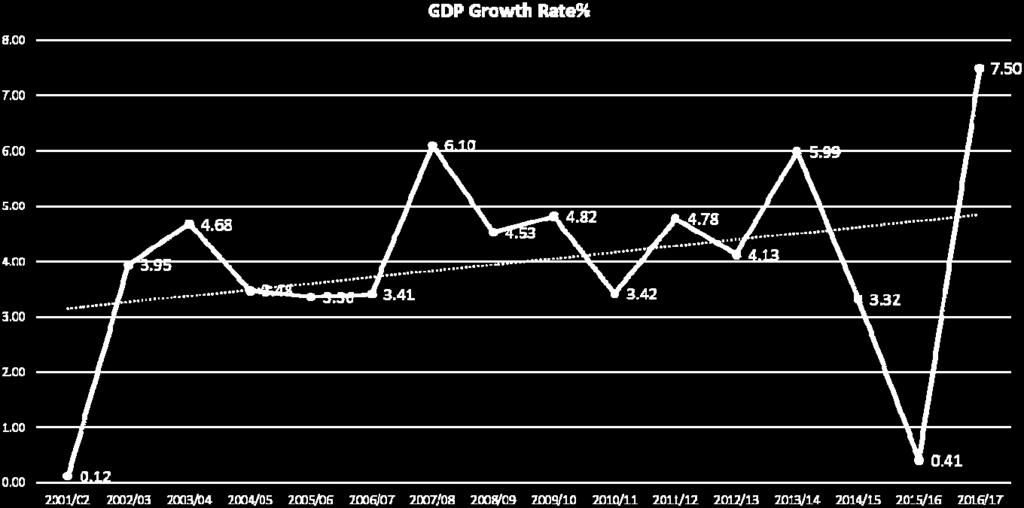

9 GDP growth trend
Preliminary Annual. National Accounts. Preliminary Annual National Accounts 2016
 Preliminary Annual National Accounts 2016 Preliminary Annual National Accounts 2016 1 Mission Statement In a coordinated manner produce and disseminate relevant, quality and timely statistics that are
Fiscal Year 2017 Statistical Appendices
 Fiscal Year 2017 Statistical Appendices August, 2018 Acknowledgements This FY2017 Statistical Compendium was prepared by the Graduate School USA, Pacific Islands Training Initiative, Honolulu, Hawaii in
Annual National Accounts 2016
 Annual National Accounts 2016 Namibia Statistics Agency P.O. Box 2133, FGI House, Post Street Mall, Windhoek, Namibia Tel: +264 61 431 3200 Fax: +264 61 431 3253 Email: info@nsa.org.na www.nsa.org.na Annual
Fiscal Year 2015 Statistical Appendices. August, 2016
 Fiscal Year 2015 Statistical Appendices August, 2016 Acknowledgements This FY2015 Statistical Compendium was prepared by the Graduate School USA, Pacific Islands Training Initiative, Honolulu, Hawaii in
This Press Release is embargoed against publication, telecast or circulation on internet till 5.30 pm today i.e. 31 st January, 2018.
 This Press Release is embargoed against publication, telecast or circulation on internet till 5.30 pm today i.e. 31 st January, 2018. PRESS NOTE ON FIRST REVISED ESTIMATES OF NATIONAL INCOME, CONSUMPTION
Gross Domestic Product of Georgia in 2015
 NATIONAL STATISTICS OFFICE OF GEORGIA (GEOSTAT) Gross Domestic Product of Georgia in 2015 15.11.2016 As a result of annual adjustment, the 2015 Gross Domestic Product (GDP) of Georgia at current prices
NATIONAL ECONOMIC ACCOUNTS 2010 (Provisional Estimates)
") REPUBLIC OF CYPRUS NATIONAL ECONOMIC ACCOUNTS 2010 (Provisional Estimates) STATISTICAL SERVICE National Accounts Statistics Series II Report No. 27 Obtainable from the Printing Office of the Republic of
REPUBLIC OF CYPRUS NATIONAL ECONOMIC ACCOUNTS 2010 (Provisional Estimates) STATISTICAL SERVICE National Accounts Statistics Series II Report No. 27 Obtainable from the Printing Office of the Republic of
National Accounts Estimates ( ) March 2018 issue
 March 2018 issue") National Accounts Estimates (2015 2018) March 2018 issue 1. INTRODUCTION This issue of Economic and Social Indicators presents National Accounts estimates for the period 2015 to 2018. Concepts and definitions
National Accounts Estimates (2015 2018) March 2018 issue 1. INTRODUCTION This issue of Economic and Social Indicators presents National Accounts estimates for the period 2015 to 2018. Concepts and definitions
PRESS RELEASE: THE DEPARTMENT OF STATISTICS RELEASES GROSS DOMESTIC PRODUCT (GDP) 2017 FIGURES
 2017 FIGURES") PRESS RELEASE: THE DEPARTMENT OF STATISTICS RELEASES GROSS DOMESTIC PRODUCT (GDP) 2017 FIGURES The National Accounts Section of the Department of Statistics announces the release of a revised data series
PRESS RELEASE: THE DEPARTMENT OF STATISTICS RELEASES GROSS DOMESTIC PRODUCT (GDP) 2017 FIGURES The National Accounts Section of the Department of Statistics announces the release of a revised data series
Nauru. Key Indicators for Asia and the Pacific Item
 Key Indicators for Asia and the Pacific 2018 1 POPULATION Total population a as of 1 July ( 000) 10.1 10.1 10.1 9.9 9.7 9.5 9.1 9.2 9.4 9.5 9.7 10.1 10.3 10.8 11.9 12.5 13.0 13.3 Population density (persons/km
National Accounts
 Republic of Namibia National Accounts 1996 2006 Sectoral Contribution to GDP, 2006 Primary Sector 22.1% Tertiary Sector 51.6% Secondary Sector 18.4% Central Bureau of Statistics National Planning Commission
This Press Release is embargoed against publication, telecast or circulation on internet till 5.30 pm today i.e. 31 st May 2017.
 This Press Release is embargoed against publication, telecast or circulation on internet till 5.30 pm today i.e. 31 st May 2017. PRESS NOTE ON PROVISIONAL ESTIMATES OF ANNUAL NATIONAL INCOME, 2016-17 AND
National Accounts of Tajikistan
 National Accounts of Tajikistan Nilyufar Khuseynova Spesialist of SNA and financial statistics department Introduction of SNA -93 The practical introduction of System of National Accounts in Tajikistan
This Press Release is embargoed against publication, telecast or circulation on internet till 5.30 pm today i.e. 8th February
 . PRESS NOTE ON ADVANCE ESTIMATES OF NATIONAL INCOME 2015-16 AND QUARTERLY ESTIMATES OF GROSS DOMESTIC PRODUCT FOR THE THIRD QUARTER (Q3) OF 2015-16 CENTRAL STATISTICS OFFICE MINISTRY OF STATISTICS & PROGRAMME
GROSS DOMESTIC PRODUCT FOR THE THIRD QUARTER OF 2012
 GROSS DOMESTIC PRODUCT FOR THE THIRD QUARTER OF 2012 In the third quarter of 2012 GDP at current prices amounted to 21 734 Million Levs. In Euro terms GDP was 11 112 Million Euro or 1 522 Euro per person.
Marshall Islands, Republic of the
 Key Indicators for Asia and the Pacific 2017 1 POPULATION Total population a thousand; as of 1 July 51.2 50.5 49.7 50.0 50.5 51.2 51.5 51.8 52.5 52.3 52.9 53.2 53.4 53.6 53.8 54.0 54.2 Population density
This Press Release is embargoed against publication, telecast or circulation on internet till 5.30 pm today i.e. 28th February
 . PRESS NOTE ON SECOND ADVANCE ESTIMATES OF NATIONAL INCOME 2017-18 AND QUARTERLY ESTIMATES OF GROSS DOMESTIC PRODUCT FOR THE THIRD QUARTER (Q3) OF 2017-18 CENTRAL STATISTICS OFFICE MINISTRY OF STATISTICS
PRESS NOTE ON ESTIMATES OF GROSS DOMESTIC PRODUCT FOR THE FIRST QUARTER
 PRESS NOTE ON ESTIMATES OF GROSS DOMESTIC PRODUCT FOR THE FIRST QUARTER APRIL-JUNE (2010-2011) CENTRAL STATISTICS OFFICE MINISTRY OF STATISTICS & PROGRAMME IMPLEMENTATION GOVERNMENT OF INDIA (Revised)
National Accounts Estimates ( ) September 2018 issue
 September 2018 issue") National Accounts Estimates (2015 2018) September 2018 issue 1. INTRODUCTION This issue of Economic and Social Indicators presents National Accounts estimates for the period 2015 to 2018. Concepts and
National Accounts Estimates (2015 2018) September 2018 issue 1. INTRODUCTION This issue of Economic and Social Indicators presents National Accounts estimates for the period 2015 to 2018. Concepts and
GOVERNMENT OF INDIA MINISTRY OF STATISTICS & PROGRAMME IMPLEMENTATION
 GOVERNMENT OF INDIA MINISTRY OF STATISTICS & PROGRAMME IMPLEMENTATION Dated, the 28 th November, 2018 7 th Agrahayana, 1940 Saka NATIONAL ACCOUNTS STATISTICS: BACK-SERIES 2004-05 TO 2011-12 Base year of
Papua New Guinea. Key Indicators for Asia and the Pacific 2017
 1 POPULATION Total population a million; as of 1 July 5.2 5.4 5.5 5.7 5.9 6.1 6.2 6.4 6.6 6.8 7.1 7.3 7.5 7.7 8.0 8.2 8.5 Population density persons per square kilometer 11 12 12 12 13 13 13 14 14 15 15
This Press Release is embargoed against publication, telecast or circulation on internet till 5.30 pm today i.e. 31 st May 2018 PRESS NOTE
 This Press Release is embargoed against publication, telecast or circulation on internet till 5.30 pm today i.e. 31 st May 2018 PRESS NOTE ON PROVISIONAL ESTIMATES OF ANNUAL NATIONAL INCOME, 2017-18 AND
PRESS NOTE ON QUARTERLY ESTIMATES OF GROSS DOMESTIC PRODUCT FOR THE THIRD QUARTER (OCTOBER-DECEMBER) OF CENTRAL STATISTICS OFFICE
 OF CENTRAL STATISTICS OFFICE") PRESS NOTE ON QUARTERLY ESTIMATES OF GROSS DOMESTIC PRODUCT FOR THE THIRD QUARTER (OCTOBER-DECEMBER) OF 2012-13 CENTRAL STATISTICS OFFICE MINISTRY OF STATISTICS AND PROGRAMME IMPLEMENTATION GOVERNMENT
PRESS NOTE ON QUARTERLY ESTIMATES OF GROSS DOMESTIC PRODUCT FOR THE THIRD QUARTER (OCTOBER-DECEMBER) OF 2012-13 CENTRAL STATISTICS OFFICE MINISTRY OF STATISTICS AND PROGRAMME IMPLEMENTATION GOVERNMENT
PRELIMINARY ANNUAL NATIONAL ACCOUNTS 2014
 PRELIMINARY ANNUAL NATIONAL ACCOUNTS 2014 Est. by Statistics Act 9 of 2011 Preliminary Annual National Account 2014 Namibia Statistics Agency 1 MISSION STATEMENT In a coordinated manner we produce and
GROSS DOMESTIC PRODUCT FOR THE SECOND QUARTER OF 2012
 GROSS DOMESTIC PRODUCT FOR THE SECOND QUARTER OF 2012 In the second quarter of 2012 GDP at current prices amounted to 19 007 Million Levs. In Euro terms GDP was 9 718 Million Euro or 1 330 Euro per person.
PRESS INFORMATION BUREAU GOVERNMENT OF INDIA PRESS NOTE ADVANCE ESTIMATES OF NATIONAL INCOME,
 PRESS INFORMATION BUREAU GOVERNMENT OF INDIA Dated the 12 Magha, 1933 Saka 7 February, 2012 PRESS NOTE ADVANCE ESTIMATES OF NATIONAL INCOME, 2011-12 The Central Statistics Office (CSO), Ministry of Statistics
NATIONAL ACCOUNTS STATISTICS
 SDT: 35-06 KINGDOM OF TONGA NATIONAL ACCOUNTS STATISTICS 2010 October 2010 Statistics Department P.O. Box 149, Nuku alofa Government of Tonga Telephone: (676) 23-300 / 23-913 Fax : (676) 24-303 Email :
This Press Release is embargoed against publication, telecast or circulation on internet till 5.30 pm today i.e. 6 th January 2017 PRESS NOTE
 PRESS NOTE ON FIRST ADVANCE ESTIMATES OF NATIONAL INCOME 2016-17 CENTRAL STATISTICS OFFICE MINISTRY OF STATISTICS & PROGRAMME IMPLEMENTATION GOVERNMENT OF INDIA 2 GOVERNMENT OF INDIA MINISTRY OF STATISTICS
 2.0 Origin of Gross Domestic Product (GDP at current prices) sector of origin Agriculture, forestry and fishing = primary sector Origin of GDP by sectors 2017 % share of total value added 3.52 3.75 3.83
Viet Nam. Key Indicators for Asia and the Pacific Item
 Key Indicators for Asia and the Pacific 2018 1 POPULATION Total population as of 1 July (million) 77.11 78.12 79.08 80.00 80.95 81.91 82.85 84.22 85.12 86.03 86.93 87.84 88.81 89.76 90.73 91.71 92.69 93.67*
Solomon Islands. Key Indicators for Asia and the Pacific 2018
 1 POPULATION Total population a ( 000) 418.6 428.5 438.5 448.8 459.4 470.1 481.2 492.5 504.0 515.9 528.0 540.4 553.1 566.0 579.3 592.9 606.8 620.8 Population density (persons/km 2 ) 14 14 14 15 15 15 16
PDCOUNTRY DEMOGRAPHICS
 PDCOUNTRY DEMOGRAPHICS The population, GDP (and its breakdown), value added by economic activity, implicit price deflator, GNI, and exchange rate demographics provided are among the most important parts
REGIONAL COURSE ON SNA 2008 : Improving Exhaustiveness of GDP Coverage FINANCIAL SERVICES. 31 Aug 4 Sept 2015 Daejeon, Republic of Korea
 REGIONAL COURSE ON SNA 2008 : Improving Exhaustiveness of GDP Coverage FINANCIAL SERVICES 31 Aug 4 Sept 2015 Daejeon, Republic of Korea Percentage Share of GDP at Constant 2010 Prices, for year 2014 1.1%
Annual National Accounts
 Annual National Accounts 2013 Est. by Statistics Act 9 of 2011 Namibia Statistics National Accounts : 2013 Agency 1 OUR MISSION In a coordinated manner we produce and disseminate relevant, quality and
NATIONAL ACCOUNTS STATISTICS Highlights
 Per Capita Income (in Rs.) NATIONAL ACCOUNTS STATISTICS 218 Highlights 1. The Gross Domestic Product at constant (211-12) prices for the year 217-18 is estimated at ` 13.1 lakh crore, as against the estimate
PRESS INFORMATION BUREAU GOVERNMENT OF INDIA PRESS NOTE ESTIMATES OF GROSS DOMESTIC PRODUCT FOR THE THIRD QUARTER (OCTOBER-DECEMBER) OF
 OF") 1 PRESS INFORMATION BUREAU GOVERNMENT OF INDIA PRESS NOTE Dated the 9 Phalguna, 1932 Saka 28 February, 2011 ESTIMATES OF GROSS DOMESTIC PRODUCT FOR THE THIRD QUARTER (OCTOBER-DECEMBER) OF 2010-11 The Central
1 PRESS INFORMATION BUREAU GOVERNMENT OF INDIA PRESS NOTE Dated the 9 Phalguna, 1932 Saka 28 February, 2011 ESTIMATES OF GROSS DOMESTIC PRODUCT FOR THE THIRD QUARTER (OCTOBER-DECEMBER) OF 2010-11 The Central
Quarterly National Accounts Inventory Croatia
 Quarterly National Accounts Inventory Croatia IPA 2011 Multi-beneficiary Statistical Co-operation Programme Contact persons: Verica Roknić (RoknicV@dzs.hr) - GDP by Expenditure Approach Department Natalija
This Press Release is embargoed against publication, telecast or circulation on internet till 5.30 pm today i.e. 29th May 2015.
 PRESS NOTE ON PROVISIONAL ESTIMATES OF ANNUAL NATIONAL INCOME 2014-15 AND QUARTERLY ESTIMATES OF GROSS DOMESTIC PRODUCT FOR THE FOURTH QUARTER (Q4) 2014-15 CENTRAL STATISTICS OFFICE MINISTRY OF STATISTICS
Compilation of Use Table in MYANMAR
 International Workshop on Supply and Use Tables 11-13 September 2018, Beijing, China Compilation of Use Table in MYANMAR Kyin Htay Director Planning Department 1 Outline of the Presentation Current Situation
MONGOLIA: ACTIVITIES AIMED AT IMPROVING MACROECONOMIC STATISTICS
 High-level Meeting for Coordinated Implementation of International Standards for Macroeconomic Statistics, Vladivostok 3-4 Sep, 2014 MONGOLIA: ACTIVITIES AIMED AT IMPROVING MACRO B.BADAMTSETSEG NSO, Mongolia
GROSS DOMESTIC PRODUCT, SECOND QUARTER OF 2017 (PRELIMINARY DATA)
") GROSS DOMESTIC PRODUCT, SECOND QUARTER OF 2017 (PRELIMINARY DATA) In the second quarter of 2017 Gross Domestic Product (GDP) 1 at current prices amounts to 24 149 million BGN. In Euro terms GDP is 12 347
GROSS DOMESTIC PRODUCT, SECOND QUARTER OF 2017 (PRELIMINARY DATA) In the second quarter of 2017 Gross Domestic Product (GDP) 1 at current prices amounts to 24 149 million BGN. In Euro terms GDP is 12 347
PRESS INFORMATION BUREAU GOVERNMENT OF INDIA PRESS NOTE ADVANCE ESTIMATES OF NATIONAL INCOME,
 1 PRESS INFORMATION BUREAU GOVERNMENT OF INDIA PRESS NOTE ADVANCE ESTIMATES OF NATIONAL INCOME, 2012-13 Dated the 12 Magha, 1934 Saka 7 February, 2013 The Central Statistics Office (CSO), Ministry of Statistics
NATIONAL ACCOUNTS STATISTICS TO KINGDOM OF TONGA. May Price: T$25.00
 SDT: 35-07 KINGDOM OF TONGA NATIONAL ACCOUNTS STATISTICS 2001-02 TO 2009-10 May 2011 Statistics Department P.O. Box 149, Nuku alofa Government of Tonga Telephone: (676) 23-300 / 23-913 Email: dept@stats.gov.to
Validation of National Accounts Expenditures
 Chapter 21 Validation of National Accounts Expenditures Price data and accounts data are the two pillars of the Inter Comparison Program (ICP). Because purchasing power parities (PPPs) are derived from
GROSS DOMESTIC PRODUCT, FIRST QUARTER OF 2017 (PRELIMINARY DATA)
") GROSS DOMESTIC PRODUCT, FIRST QUARTER OF 2017 (PRELIMINARY DATA) In the first quarter of 2017 GDP at current prices amounts to 20 066 million BGN. In Euro terms GDP is 10 260 million Euro or 1 445 euro
GROSS DOMESTIC PRODUCT, FIRST QUARTER OF 2017 (PRELIMINARY DATA) In the first quarter of 2017 GDP at current prices amounts to 20 066 million BGN. In Euro terms GDP is 10 260 million Euro or 1 445 euro
Fiji. Key Indicators for Asia and the Pacific Item
 1 POPULATION Total population as of 1 July ( 000) 802.0 805.0 810.0 816.0 821.0 827.0 830.0 834.5 841.4 845.5 850.7 854.3 858.0 862.1 865.7 869.5 873.2 884.9 Population density (persons/km 2 ) 44 44 44
PRESS NOTE ON ADVANCE ESTIMATES OF NATIONAL INCOME CENTRAL STATISTICS OFFICE MINISTRY OF STATISTICS & PROGRAMME IMPLEMENTATION
 PRESS NOTE ON ADVANCE ESTIMATES OF NATIONAL INCOME 2010-11 CENTRAL STATISTICS OFFICE MINISTRY OF STATISTICS & PROGRAMME IMPLEMENTATION GOVERNMENT OF INDIA PRESS INFORMATION BUREAU GOVERNMENT OF INDIA Dated
National Accounts GROSS DOMESTIC PRODUCT BY PRODUCTION, INCOME AND EXPENDITURE APPROACH
 TB 01 Thematic Bulletin ISSN 2232-7789 National Accounts GROSS DOMESTIC PRODUCT BY PRODUCTION, INCOME AND EXPENDITURE APPROACH Bosnia and Herzegovina BHAS Agency for Statistic of Bosnia and Herzegovina
GROSS DOMESTIC PRODUCT, SECOND QUARTER OF 2014 (PRELIMINARY DATA)
") GROSS DOMESTIC PRODUCT, SECOND QUARTER OF 2014 (PRELIMINARY DATA) In the second quarter of 2014 GDP at current prices amounts to 19 517 million BGN. In Euro terms GDP is 9 979 million Euro or 1 379 euro
GROSS DOMESTIC PRODUCT, SECOND QUARTER OF 2014 (PRELIMINARY DATA) In the second quarter of 2014 GDP at current prices amounts to 19 517 million BGN. In Euro terms GDP is 9 979 million Euro or 1 379 euro
GROSS DOMESTIC PRODUCT, THIRD QUARTER OF 2015 (PRELIMINARY DATA)
") GROSS DOMESTC PRODUCT, THRD QUARTER OF 2015 (PRELMNARY DATA) GDP at current prices is 23 490 million BGN in the third quarter of 2015. n Euro terms GDP is 12 010 million Euro or 1 671 euro per capita.
GROSS DOMESTC PRODUCT, THRD QUARTER OF 2015 (PRELMNARY DATA) GDP at current prices is 23 490 million BGN in the third quarter of 2015. n Euro terms GDP is 12 010 million Euro or 1 671 euro per capita.
Republic of Namibia. Quarterly Gross Domestic Product. First Quarter 2009
 Republic of Namibia Quarterly Gross Domestic Product First Quarter 2009 National Planning Commission Central Bureau of Statistics Mission Statement As the producer and coordinator of official statistics
STATE DOMESTIC PRODUCT
 CHAPTER 3 STATE DOMESTIC PRODUCT The State Domestic Product (SDP) commonly known as State Income is one of the important indicators to measure the economic development of the State/UT. In the context of
National Accounts Statistics Report 2015
 National Accounts Statistics Report 2015 Private Bag 0024, Gaborone. Tel: 3671300 Fax: 3952201 E-mail: info@statsbots.org.bw Website: http://www.statsbots.org.bw 2. Preface Published by STATISTICS BOTSWANA
Accounts, Indicators and Policy Use with 2008 SNA Framework
 Accounts, Indicators and Policy Use with 28 SNA Framework Regional Seminar on Developing a Programme for the Implementation Programme of the 28 SNA and the Implementation Strategy for the SEEA Central
Implementation of the SDGs in Nepal: Status and Challenges
 Implementation of the SDGs in Nepal: Status and Challenges South Asia Forum on the Sustainable Development Goals, 4-5 October 2018, India Habitat Centre, New Delhi Khomraj Koirala Joint Secretary National
GROSS DOMESTIC PRODUCT, THIRD QUARTER OF 2018 (PRELIMINARY DATA)
") GROSS DOMESTIC PRODUCT, THIRD QUARTER OF 2018 (PRELIMINARY DATA) In the third quarter of 2018 Gross Domestic Product (GDP) 1 at current prices amounts to 29 822 million BGN. In Euro terms GDP is 15 248
GROSS DOMESTIC PRODUCT, THIRD QUARTER OF 2018 (PRELIMINARY DATA) In the third quarter of 2018 Gross Domestic Product (GDP) 1 at current prices amounts to 29 822 million BGN. In Euro terms GDP is 15 248
Guidelines for the Notes on National Accounts Methodology
 Guidelines for the Notes on National Accounts Methodology In addition to the national accounts data, metadata on the national accounts methodology is published in the United Nations publication: National
Croatian Quarterly National Accounts Inventory based on ESA 2010 methodology
 Croatian Quarterly National Accounts Inventory based on ESA 2010 methodology Grant agreement 04121.2015.002-2015.168 Contact persons: Natalija Krunić (KrunicN@dzs.hr) - QGDP by Production and Income Approach
Item
 223 POPULATION a, b Total population million; as of 1 July 5.704 6.156 6.665 6.744 6.731 6.784 6.813 6.857 Population density c persons per square kilometer 5296 5840 6200 6260 6240 6280 6310 6350 Population
Viet Nam. Key Indicators for Asia and the Pacific Item
 1 POPULATION Total population million; as of 1 July 77.11 78.12 79.08 80.00 80.95 81.91 82.85 84.22 85.12 86.03 86.93 87.84 88.81 89.76 90.73 91.71 92.7* Population density persons per square kilometer
China, People s Republic of
 1 POPULATION Total population as of 31 December (million) 1,267.4 1,276.3 1,284.5 1,292.3 1,299.9 1,307.6 1,314.5 1,321.3 1,328.0 1,334.5 1,340.9 1,347.4 1,354.0 1,360.7 1,367.8 1,374.6 1,382.7 1,390.1
NATIONAL ACCOUNTS STATISTICS REPORT 2016
 NATIONAL ACCOUNTS STATISTICS REPORT 2016 STATISTICS REPORT. Private Bag 0024 Botswana Tel: (267) 367 1300. Toll Free: 0800 600 200. Fax: (267) 395 2201. Email: info@statsbots.org.bw Website: www.statsbots.org.bw
THE COMPILATION OF HOUSEHOLD SECTOR ACCOUNTS IN KOREA
 For Official Use STD/NA()18 Organisation de Coopération et de Développement Economiques OLIS : 26-Aug-1 Organisation for Economic Co-operation and Development Dist. : 27-Aug-1 Or. Eng. STATISTICS DIRECTORATE
GROSS DOMESTIC PRODUCT
 GROSS DOMESTIC PRODUCT September 2014 2013 HIGHLIGHTS GDP = $5.6 billion, marginally up 0.7% in 2013 In 2013, Gross Domestic Product (GDP), which measures the total value of goods and services produced
National Bureau of Statistics Ministry of Finance Dar-es-Salaam
 THE UNITED REPUBLIC OF TANZANIA National Bureau of Statistics Ministry of Finance Dar-es-Salaam October, 2013 PREFACE The publication National Accounts of Tanzania Mainland 2001-2012 is the fifth in the
Quarter 3, Copyrights Statistics Botswana 2018
 STATISTICS BOTSWANA GROSS DOMESTIC PRODUCT Quarter 3, 2018 Copyrights 2018. Private Bag 0024 Botswana Tel: (267) 367 1300. Fax: (267) 395 2201. Email: info@statsbots.org.bw Website: www.statsbots.org.bw
S Y S T E M O F N A T I O N A L A C C O U N T S REPORT 2016
 T H E CAYMAN ISLANDS S Y S T E M O F N A T I O N A L A C C O U N T S REPORT 2016 NOVEMBER 2017 T H E ECONOMICS AND STATISTIC S OFFICE TABLE OF CONTENTS Page ACKNOWLEDGEMENT... i ABBREVIATIONS AND ACRONYMS...
Guidelines for the Notes on National Accounts Methodology
 Guidelines for the Notes on National Accounts Methodology In addition to the national accounts data, metadata on the national accounts methodology is published in the United Nations publication: National
NATIONAL ECONOMIC ACCOUNTS 2011 (Provisional Estimates)
") REPUBLIC OF CYPRUS NATIONAL ECONOMIC ACCOUNTS 2011 (Provisional Estimates) STATISTICAL SERVICE National Accounts Statistics Series II Report No. 28 Obtainable from the Printing Office of the Republic of
REPUBLIC OF CYPRUS NATIONAL ECONOMIC ACCOUNTS 2011 (Provisional Estimates) STATISTICAL SERVICE National Accounts Statistics Series II Report No. 28 Obtainable from the Printing Office of the Republic of
Gross domestic product of Montenegro in 2016
 MONTENEGRO STATISTICAL OFFICE R E L E A S E No:174 Podgorica 29 September 2017 When using the data pleaase name the source Gross domestic product of Montenegro in 2016 Real growth rate of gross domestic
Hong Kong, China. Key Indicators for Asia and the Pacific 2018
 Key Indicators for Asia and the Pacific 2018 1 POPULATION a Total population as of 1 July (million) 6.7 6.7 6.7 6.7 6.8 6.8 6.9 6.9 7.0 7.0 7.0 7.1 7.2 7.2 7.2 7.3 7.3 7.4 Population density b (persons/km
STATISTICS BOTSWANA GROSS DOMESTIC PRODUCT. No:2017/3. Third Quarter 2017
 No:2017/3 STATISTICS BOTSWANA GROSS DOMESTIC PRODUCT Third Quarter 2017 Copyrights 2017 Private Bag 0024, Gaborone. Tel: 367 1300 Fax: 395 2201 Toll Free: 0800 600 200 E-mail: info@statsbots.org.bw Website:
GROSS DOMESTIC PRODUCT FOR THE FIRST QUARTER OF 2014 (PRELIMINARY DATA)
") GROSS DOMESTIC PRODUCT FOR THE FIRST QUARTER OF 2014 (PRELIMINARY DATA) In the first quarter of 2014 GDP at current prices amounts to 16 097 Million Levs. In Euro terms GDP is 8 230 Million Euro or 1 136
GROSS DOMESTIC PRODUCT FOR THE FIRST QUARTER OF 2014 (PRELIMINARY DATA) In the first quarter of 2014 GDP at current prices amounts to 16 097 Million Levs. In Euro terms GDP is 8 230 Million Euro or 1 136
GROSS DOMESTIC PRODUCT, FIRST QUARTER OF 2018 (PRELIMINARY DATA)
") GROSS DOMESTIC PRODUCT, FIRST QUARTER OF 2018 (PRELIMINARY DATA) In the first quarter of 2018 Gross Domestic Product (GDP) 1 at current prices amounts to 21 479 million BGN. In Euro terms GDP is 10 982
GROSS DOMESTIC PRODUCT, FIRST QUARTER OF 2018 (PRELIMINARY DATA) In the first quarter of 2018 Gross Domestic Product (GDP) 1 at current prices amounts to 21 479 million BGN. In Euro terms GDP is 10 982
Singapore. Key Indicators for Asia and the Pacific Item
 Key Indicators for Asia and the Pacific 2012 1 POPULATION Total population a million; as of 1 July 3.52 4.03 4.27 4.59 4.84 4.99 5.08 5.18 Population density persons per square kilometer 5443 5900 6112
Compilation of Quarterly GDP: Methods, Problems, and Solution The case of Thailand
 Strengthening Regional Capacities for Statistical Development in Southeast Asia Project Sponsored by UNSD, ESCAP and ASEAN Secretariat Bangkok, 6-10 August 2001 Compilation of Quarterly GDP: Methods, Problems,
Country Report UZBEKISTAN
 Regional Course on SNA 2008 (Special Topics): Improving Exhaustiveness of GDP Coverage 22 30 August 2016 Daejeon, Republic of Korea Country Report UZBEKISTAN Data sources and estimation methods for compiling
GROSS DOMESTIC PRODUCT FOR THE FOURTH QUARTER OF 2015 AND PRELIMINARY DATA FOR 2015
 GROSS DOMESTIC PRODUCT FOR THE FOURTH QUARTER OF 2015 AND PRELIMINARY DATA FOR 2015 In the fourth quarter of 2015 GDP at current prices amounted to 23 699 million BGN. In Euro terms GDP reaches 12 117
India. Key Indicators for Asia and the Pacific Item
 1 POPULATION a Total population as of 1 October (million) 1,019 1,040 1,056 1,072 1,089 1,106 1,122 1,138 1,154 1,170 1,186 1,220 1,235 1,251 1,267 1,283 1,299 1,316 Population density (persons/km 2 )
Gross domestic product, 2008 (Preliminary estimation)
") Internet publication www.ksh.hu Hungarian September 2009 Central Statistical Office ISBN 978-963-235-266-4 Gross domestic product, 2008 (Preliminary estimation) Contents Summary...2 Tables...4 Methodological
Internet publication www.ksh.hu Hungarian September 2009 Central Statistical Office ISBN 978-963-235-266-4 Gross domestic product, 2008 (Preliminary estimation) Contents Summary...2 Tables...4 Methodological
Malaysia. Key Indicators for Asia and the Pacific Item
 Key Indicators for Asia and the Pacific 2017 1 POPULATION Total population million; as of 1 July 23.49 24.03 24.54 25.04 25.54 26.05 26.55 27.06 27.57 28.08 28.59 29.06 29.51 29.92 30.60 31.20 31.66 Population
NOTES ON METHODOLOGY AND REVISIONS IN THE ESTIMATES
 NOTES ON METHODOLOGY AND REVISIONS IN THE ESTIMATES The new series on National Accounts Statistics was introduced through a Press Release on January 30, 2015 with base year 2011-12 in place of previous
Gross domestic product of Montenegro for period
 MONTENEGRO STATISTICAL OFFICE RELEASE No: 211 Podgorica, 30. September 2015 When using these data, please name the source Gross domestic product of Montenegro for period 2010-2014 Real growth rate of gross
Gross domestic product of Montenegro in 2011
 MONTENEGRO STATISTICAL OFFICE R E L E A S E No: 257 Podgorica, 28 September 2012 When using the data please name the source Gross domestic product of Montenegro in 2011 Real growth rate of gross domestic
Economic Indicators -- Angola
 Economic Indicators -- Angola Gross Domestic Product, 2000 Angola Sub- Saharan Africa World GDP in million constant 1995 US dollars 6,647 362,493 34,109,900 GDP PPP (million current international dollars)
Tuvalu. Key Indicators for Asia and the Pacific Item
 Key Indicators for Asia and the Pacific 2016 1 POPULATION Total population a thousand; as of 1 July 9.5 9.6 9.6 9.7 10.0 10.3 10.4 11.1 11.0 11.1 11.1 10.6 10.8 10.8 10.8 10.8 Population density persons
GROSS DOMESTIC PRODUCT FOR 2011 FINAL DATA
 GROSS DOMESTIC PRODUCT FOR 2011 FINAL DATA In 2011 GDP at current prices amounts to 75 308 million Levs. GDP at 2005 constant prices increases by 1.8 % compared to the previous year. GDP, current prices
Kathmandu, Nepal, September 23-26, 2009
 Session Number: Session 8b (Parallel) Time: Friday, September 25, 14:00-15:30 Paper Prepared for the Special IARIW-SAIM Conference on Measuring the Informal Economy in Developing Countries Kathmandu, Nepal,
GROSS DOMESTIC PRODUCT FOR THE FIRST QUARTER OF 2011
 GROSS DOMESTIC PRODUCT FOR THE FIRST QUARTER OF 2011 In the first quarter of 2011 GDP at current prices amounts to 15 903 million levs. In Euro terms GDP reaches to 8 131 million euro or 1 084.4 euro per
Table 1.3 : Demand side growth in GDP, growth contribution and relative share (figures in per cent at market prices) Growth of GDP
 Growth of GDP") Aggregate demand and its composition 1.17 The most important contribution to demand growth during the Tenth Five Year Plan period (2002-07) had come from investment, while the external trade made negligible
Aggregate demand and its composition 1.17 The most important contribution to demand growth during the Tenth Five Year Plan period (2002-07) had come from investment, while the external trade made negligible
GROSS DOMESTIC PRODUCT FOR THE FOURTH QUARTER OF 2013 AND 2013 (PRELIMINARY DATA)
") GROSS DOMESTIC PRODUCT FOR THE FOURTH QUARTER OF 2013 AND 2013 (PRELIMINARY DATA) In the fourth quarter of 2013 GDP at current prices amounted to 21 463 million BGN. In Euro terms GDP reaches 10 974 million
GROSS DOMESTIC PRODUCT FOR THE FOURTH QUARTER OF 2013 AND 2013 (PRELIMINARY DATA) In the fourth quarter of 2013 GDP at current prices amounted to 21 463 million BGN. In Euro terms GDP reaches 10 974 million
དཔལ ལ ན འབ ག གཞ ང ར ལ ཡ ཞ ས ར ས དད བད འའནན. National Accounts Statistics National Statistics Bureau Royal Government of Bhutan Thimphu : Bhutan
 དཔལ ལ ན འབ ག གཞ ང ར ལ ཡ ཞ ས ར ས དད བད འའནན National Accounts Statistics 2014 National Statistics Bureau Royal Government of Bhutan Thimphu : Bhutan Foreword National Statistics Bureau (NSB) is pleased
GROSS DOMESTIC PRODUCT FOR THE THIRD QUARTER OF 2013
 GROSS DOMESTIC PRODUCT FOR THE THIRD QUARTER OF 2013 In the third quarter of 2013 GDP at current prices amounts to 21 590 million BGN. In Euro terms GDP is 11 039 million euro or 1 519 euro per person.
RELEASE OF THE PROVISIONAL GROSS DOMESTIC PRODUCT (GDP) FOR THIRD QUARTER 2017
 FOR THIRD QUARTER 2017") RELEASE OF THE PROVISIONAL GROSS DOMESTIC PRODUCT (GDP) FOR THIRD QUARTER 2017 by Mr. BAAH WADIEH Ag. GOVERNMENT STATISTICIAN GDP Presentation December 20, 2017 1 Provisional GDP estimates for third quarter
RELEASE OF THE PROVISIONAL GROSS DOMESTIC PRODUCT (GDP) FOR THIRD QUARTER 2017 by Mr. BAAH WADIEH Ag. GOVERNMENT STATISTICIAN GDP Presentation December 20, 2017 1 Provisional GDP estimates for third quarter
Distribution and Use of Income Accounts Main entries and Data Needs
 An Introduction to System of National Accounts Integrated Transaction Accounts Lesson: VI Part I Distribution and Use of Income Accounts Main entries and Data Needs Third Intermediate-Level e-learning
THE UNITED REPUBLIC OF TANZANIA QUARTERLY GROSS DOMESTIC PRODUCT OF TANZANIA MAINLAND
 THE UNITED REPUBLIC OF TANZANIA QUARTERLY GROSS DOMESTIC PRODUCT OF TANZANIA MAINLAND National Bureau of Statistics Ministry of Finance Economic Affairs Dar es Salaam May, 2010 Table of Contents 1.0 Introduction...
COUNTRY REPORT ON IMPLEMENTED SNA IN VIETNAM
 August 15, 2015 COUNTRY REPORT ON IMPLEMENTED SNA IN VIETNAM Name: Nguyen Thi Mai Hanh National Account Department GSO Viet Nam 1. Introduction Since 1989, the System of National Account have been studied
Philippines. Key Indicators for Asia and the Pacific Item
 1 POPULATION Total population a million; as of 1 July 76.8 78.4 79.9 81.5 83.1 84.7 86.3 87.9 89.4 91.0 93.1 94.8 96.5 98.2 99.9 101.6 103.2 Population density persons per square kilometer 256 261 266
Gross Domestic Product , preliminary figures for Aruba
 Gross Domestic Product 2000 2006, preliminary figures for Aruba Central Bureau of Statistics Aruba Oranjestad, December 2007 COPYRIGHT RESERVED Use of the contents of this publication is allowed, provided
Part One. Economic Developments of Iran in 1394
 Part One Economic Developments of Iran in 39 In the Name of God, The Compassionate, The Merciful CHAPTER ECONOMIC REPORT AND BALANCE SHEET 39 NATIONAL PRODUCT, EXPENDITURE AND INCOME Gross Domestic Product