Leeds Business Confidence Index
|
|
|
- Emery Walton
- 5 years ago
- Views:
Transcription
 captures Colorado business leaders expectations for the national economy, state")
1 First Quarter 2018 Volume 11, number 1 colorado.edu/business/brd Leeds Business Confidence Rebounds Ahead of Q The Leeds Business Confidence Index (LBCI) captures Colorado business leaders expectations for the national economy, state economy, industry sales, profits, hiring plans, and capital expenditures. Ahead of Q the index is at 59.5 (up from 56.5 in Q4) and remained steady ahead of Q A total of 240 qualified panelists responded to the survey. Leeds Business Confidence Index Component Q Q Q Q Q Change Quarterly Annual State Economy National Economy Industry Sales Industry Profits Industry Hiring Capital Expenditures LBCI Business confidence pivoted higher for ahead of Q1 2018, and remained unchanged looking ahead to Q All six individual components of the LBCI remain in positive territory (above 50) ahead of both Q and Q All components of the LBCI rose ahead of Q1 2018, with the exception of the state economy overall, which recorded a modest pullback. State and national economic expectations converged in Q1, indicating business leaders expectations that the Colorado economy is less likely to outperform the nation. Among other issues, respondents noted little impact of the minimum wage increase on their business. Likewise, most companies indicated little substitution of machinery for workers. The LBCI s positive standing is consistent with Colorado s continued employment growth, real GDP expansion, rising personal incomes, and other macroeconomic indicators. 1
, but slipped 0.8 points from a year ago.")

2 Summary Expectations Pivot Higher ahead of Q1 The LBCI rose ahead of Q1 2018, and remained steady ahead of Q The overall index remains comfortably in positive territory (above 50). Expectations for Q are up to 59.5 (a 3-point increase from last quarter), but slipped 0.8 points from a year ago. Looking further ahead to Q2 2018, the index remained flat compared to the prior quarter but decreased year-over-year, dropping by 3.9 points. All six individual components of the index also remain in positive territory, and with the exception of state expectations, each component of the index improved. Expectations about the national economy recorded the greatest jump, while state expectations recorded the only decline. National real gross domestic product (GDP) continued to grow at a 3.2% seasonally adjusted annual rate (SAAR) in Q Personal consumption expenditures slowed, gross private domestic investment accelerated, and net exports improved for the quarter, while government expenditures grew modestly. In 2016, GDP grew 1.5%, following the previous year s increase of 2.9%; analysts project accelerating growth in 2017 and GDP has recorded positive growth for the seventh consecutive year according to the Bureau of Economic Analysis (BEA). Colorado continued to experience positive real GDP growth, with 3.8% SAAR in Q Colorado accounted for 1.8% of total U.S. GDP in Q


3 National and State Economies Continued Neutral Expectations Expectations for both the national economy and state economy remained positive ahead of Q1 and Q as the two indices converged. National expectations increased from 51.4 in Q4 to 58.2 ahead of Q1 and 57.6 ahead of Q State expectations fell from 58.8 in Q4 to 58.2 ahead of Q1 and 58.6 ahead of Q This marks the first quarter since 2005 that expectations for the Colorado economy have not been higher than those for the nation in panelists view. While Colorado is expected to outpace the nation in economic growth in 2018, this demonstrates the view that the state is on a slower growth path compared to the recent past. As well, this survey period overlapped the tax bill vote, which may have boosted expectations for national economic growth. Panelists expectations for both the state and national economies maintained above-neutral outlooks. For the state economy, more respondents (39.2%) believe that the state economy will expand in Q1 than expect a decline (9.6%). Over half (51.3%) remain neutral. Marking a strong shift to positive expectations for the national economy, 46.2% of respondents expect an increase, while 17.6% anticipate a decrease (36.3% are neutral). U.S GDP grew at 3.2% SAAR in Q3 2017, an increase in the growth rate from the prior quarter s rate of 3.1%. The BEA reported: The increase in real GDP in the third quarter reflected positive contributions from personal consumption expenditures (PCE), private inventory investment, nonresidential fixed investment, exports, federal government spending, and state and local government spending that were partly offset by a negative contribution from residential fixed investment. Imports, which are a subtraction in the calculation of GDP, decreased. 3


4 Colorado s Q real GDP grew at an SAAR of 3.8%. Quarter-over-quarter, the Arts, Entertainment, and Recreation; Information; and Mining industries increased by the largest percentage, while the Information; Mining; and Retail industries increased by the greatest dollar amount. Sales and Profits Outlook Moves More Positive The sales and profits expectations ahead of Q were the highest of the six components of the LBCI in the current survey. Sales expectations moved up 3.1 points ahead of Q1 2018; profits expectations increased 3 points. The profits index increased from 57.6 in Q to 60.6 head of Q and 61.5 ahead of Q Respondents maintained an overall positive outlook, with 54.6% expecting a moderate to strong increase. Negative expectations decreased slightly from 16.3% of respondents in Q4 to 15.1% in Q1. The sales index increased from 58.5 in Q4 to 61.6 ahead of Q1 and 62.6 ahead of Q In Q1, 55.5% of respondents expect increasing sales, while 32.5% expect a flat (neutral) quarter and 12.1% expect a decrease. According to the Institute for Supply Management, the manufacturing index in November 2017 had a modest 0.5 percentage point decrease from October With a reading of 58.2, the November manufacturing index is 1.1 points above the 12-month average and 0.8 points above the year-to-date average for The nonmanufacturing index also fell in November 2017 by 2.7 percentage points from October, but remained 0.4 points above the average for the past 12 months. 4

5 Personal incomes continued to grow in Colorado in Q According to the BEA, Q Colorado personal income rose 0.5% from the preceding quarter, with a strong increase of 2.9% year-over-year. Colorado ranked 13th in the nation for year-over-year growth, but fell to 42nd for quarterly growth. Per capita personal income increased a modest 0.1% in the state from Q to Q and 1.2% year-over-year. Colorado ranked 49th among states for quarterly growth in per capita personal income and 36th among all states in year-over-year growth in Q Prices continue to increase, putting more pressure on personal income, wages, and salaries. According to the Bureau of Labor Statistics, prices increased 3.1% year-over-year in the first half of 2017 in the Denver-Boulder-Greeley region in Colorado. Core inflation (which excludes energy and food) increased 2.7% and shelter increased 5.3% during the same period. Capital Expenditures and Hiring Plans Spurt of Optimism The outlook for both capital expenditures and hiring increased ahead of Q1, with capex expectations rebounding more and joining hiring expectations at Capital expenditures expectations increased 3.5 points ahead of Q the second largest increase among the six components of the index for the quarter. Hiring expectations increased by 3.5 points to settle at 59.3 ahead of Q The capital expenditures index increased from 55.8 in Q to 59.3 ahead of Q and 58.5 ahead of Q2. Less than half (44.6%) of respondents expect a moderate to strong increase in capex compared to 46.7% who project no change and 8.8% who project a decrease in investment. 5
6 In Colorado, an indicator for capital expenditures is infrastructure. According to Dodge Data and Analytics, the value of construction in Colorado was down 3% through November 2017 compared to the same period one year ago. Through November, nonbuilding and residential were essentially unchanged year-over-year, while nonresidential was down 8%. However, the Colorado Business Economic Outlook committee expects these figures to be revised up in coming months. Residential building permits in Colorado were up 10.5% for the year through November (16.6% increase for single family, 2.8% increase for multifamily), according to the U.S. Census Bureau. The hiring index increased from 55.8 in Q4 to 59.3 ahead of Q and 58.4 ahead of Q2. In Q1, 45.5% of respondents expect an increase in hiring, while 45.8% remain neutral (no change) and 8.7% expect a decrease. Employment continues to grow in the United States. In November 2017, jobs increased 1.4% year-over-year. For all nonfarm sectors, 228,000 jobs were added in November. Year-to-date through November, the average number of jobs added per month totaled 174,000, down from the average of 190,000 for the same period a year ago. The unemployment rate in the United States stood at 4.1% in November. As of November 2017, Colorado continued to exhibit strong employment growth. Jobs increased 1.7% year-over-year in November, an increase of 45,300 year-over-year the 13th-fastest rate in the country. The state unemployment rate continues to outperform the nation as a whole. In November 2017, the unemployment rate was just 2.9% a rate well below the national average. Year-over-year employment growth was recorded for six of Colorado s seven metropolitan areas. The Greeley MSA recorded the fastest year-over-year growth (4%), followed by the Fort Collins- Loveland MSA (2.7%) and the Boulder MSA (2.4%). The Denver-Aurora-Broomfield and Colorado Springs MSAs grew by 1.6% and 0.9%, respectively. The Pueblo MSA increased 0.5% while the Grand Junction MSA posted a 0.5% decline (however, Grand Junction is projected to be revised up). Colorado industries with the greatest absolute job growth in November were Professional and Business Services (13,700 jobs) and Leisure and Hospitality (7,200 jobs). Mining recorded modest year-over-year job losses; however, the Colorado Department of Labor and Employment has indicated expected upward revisions to this sector and to state employment overall. Disruptive Impacts on Labor Market? Panelists were asked two questions about potential disruptive impacts on the labor market an increased minimum wage and the substitution of machines for labor. Impact of the Higher Minimum Wage On January 1, 2017, Colorado s minimum wage increased from $8.31 per hour to $9.30 per hour, an increase of $0.99, or 11.9%. On January 1, 2018, the rate increases again to $10.20, an increase of $0.90 or 9.7%. Reflecting on the increase in Colorado s minimum wage, 80% of panelists responded that the increase has not had an effect on their business. Of the 20% of respondents that did note an effect, they described higher costs, smaller profits, reduced employment, and cautious hiring. 6
 indicated that is not the case, and only 15% reported such a substitution.")
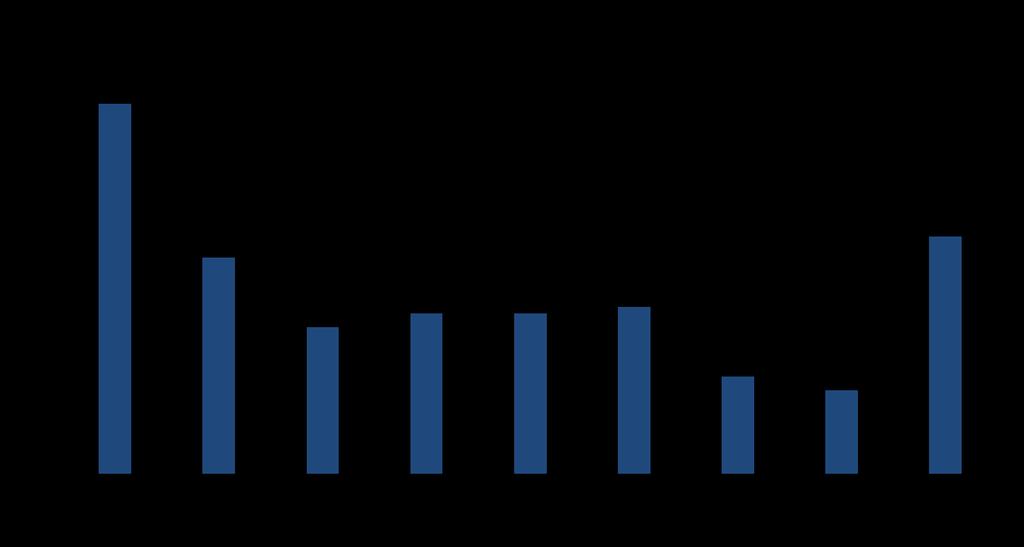
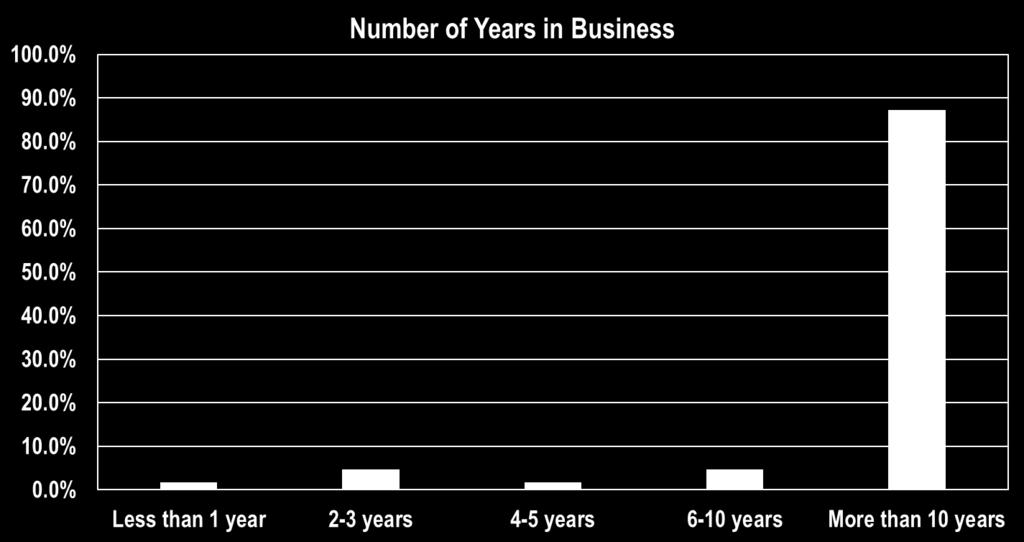
7 Impact of Machines In 2017, there was often talk of machines, artificial intelligence, or augmented intelligence replacing the workforce. Panelists were asked if their companies are substituting machines/robots for labor. Most respondents (85%) indicated that is not the case, and only 15% reported such a substitution. Respondents described IT, software, GIS, and automated manufacturing equipment among the substitutes. Expectations by Company Size and Length of Time in Business Panelists were asked two additional questions, one about the size of their company and the other about how long their company has been in business. About half (54.5%) of survey respondents work for companies with fewer than 50 employees. The three largest groups were represented by companies with 1 4 employees (22.6%), 1,000 or more employees (14.5%), and 5 9 employees (13.2%). Small employers expectations increased 2.7 points ahead of Q1, and large employers expectations increased 3.3 points. Small companies were collectively more optimistic than large companies (60.3 versus 58.9) ahead of Q1. Over 87% of respondents work at a long-standing company that has been in business for more than 10 years. While responding panelists represent every industry in the state, the largest percentage of respondents to the Q1 survey were: Finance and Insurance (19.3%); Professional, Scientific, and Technical Services (16.4%); Management of Companies and Enterprises (13%); and Other Services (except Public Administration) (12.2%). 7

8 8

9 Distribution of Expectations in Q2 2018, Q1 2018, and Q

10 # # # For more information about the LBCI and to become a panelist, go to: 10
Leeds Business Confidence Index
 Second Quarter 2018 Volume 11, number 2 colorado.edu/business/brd Leeds Business Confidence Steady Ahead of Q2 2018 The Leeds Business Confidence Index (LBCI) captures Colorado business leaders expectations
Leeds Business Confidence Index
 Third Quarter 2018 Volume 11, number 3 colorado.edu/business/brd Leeds Business Confidence Steady Ahead of Q3 2018 The Leeds Business Confidence Index (LBCI) captures Colorado business leaders expectations
Leeds Business Confidence Index
 Fourth Quarter 2017 Volume 10, number 4 colorado.edu/business/brd Leeds Business Confidence Index Cools Ahead of Q4 2017 The Leeds Business Confidence Index (LBCI) captures Colorado business leaders expectations
Summary Pessimism Abates Ahead of Q1
 First Quarter 2016 Volume 9, number 1 colorado.edu/business/brd Summary Pessimism Abates Ahead of Q1 The panel of business leaders surveyed in the Leeds Business Confidence Index (LBCI) reported modestly
Second Quarter 2016 Volume 9, number 2 colorado.edu/business/brd
 Second Quarter 2016 Volume 9, number 2 colorado.edu/business/brd Summary Stable Expectations The panel of business leaders surveyed in the Leeds Business Confidence Index (LBCI) reported steady optimism
Analysis & Background
 1 Values shown are June estimates. # # # Analysis & Background Expected Revisions to Colorado Second quarter 2017 Quarterly Census of Employment and Wages (QCEW) results indicate Colorado total nonfarm
Secretary of State Business Filings Q Data Analysis Summary
 QUARTERLY BUSINESS & ECONOMIC INDICATORS Fourth Quarter 2016 Secretary of State Business Filings Q4 2016 Data Analysis Summary New entity filings exhibit unrelenting growth in Q4 2016. Employment growth
Secretary of State Business Filings Q Data Analysis Summary
 QUARTERLY BUSINESS & ECONOMIC INDICATORS First Quarter 2016 Secretary of State Business Filings Q1 2016 Data Analysis Summary Employment projected to continue expanding in Q2 2016 and Q3 2016, but at a
Secretary of State Business Filings Q Data Analysis Summary
 C O L O R A D O S E C R E TA R Y O F S TAT E QUARTERLY BUSINESS & ECONOMIC INDICATORS Secretary of State Jena Griswold Fourth Quarter 2018 Secretary of State Business Filings Q4 2018 Data Analysis Summary
Secretary of State Business Filings Q Data Analysis Summary
 QUARTERLY BUSINESS & ECONOMIC INDICATORS Fourth Quarter 2017 Secretary of State Business Filings Q4 2017 Data Analysis Summary New entity filings continued to gain in Q4 2017. State employment projections
Will the Recovery Ever End? Boulder Economic Forecast
 Will the Recovery Ever End? Boulder Economic Forecast Place cover image here Richard Wobbekind Senior Economist and Associate Dean for Business and Government Relations January 17, 219 #COBizOutlook Real
Economic Highlights. ISM Purchasing Managers Index 1. Sixth District Payroll Employment by Industry 2. Contributions to Real GDP Growth 3
 December 1, 2010 Economic Highlights Manufacturing ISM Purchasing Managers Index 1 Employment Sixth District Payroll Employment by Industry 2 Economic Activity Contributions to Real GDP Growth 3 Prices
Secretary of State Business Filings Q Data Analysis Summary
 QUARTERLY BUSINESS & ECONOMIC INDICATORS Third Quarter 2016 Secretary of State Business Filings Q3 2016 Data Analysis Summary Employment is projected to continue expanding in Q3 2016 and Q4 2016, but at
ECONOMIC FORECAST BREAKFAST
 ECONOMIC FORECAST BREAKFAST LEADERSHIP IN A STARTUP ECONOMY FRIDAY, JANUARY 15, 2016 www.colorado.edu/leeds/brd CAREER ADVANCING DEGREES FROM LEEDS EVENING MBA PROGRAM FOR WORKING PROFESSIONALS #1 PART-TIME
More of the Same? Southwest Business Forum
 More of the Same? Southwest Business Forum Place cover image here Richard Wobbekind Senior Associate Dean, Leeds School of Business Executive Director, Business Research Division January 4, 2017 Colorado
Secretary of State Business Filings Q Data Analysis Summary
 QUARTERLY BUSINESS & ECONOMIC INDICATORS First Quarter 2018 Secretary of State Business Filings Q1 2018 Data Analysis Summary New entity filings recorded strong growth in Q1 2018. State employment projections
Will the Recovery Ever End? Certified Financial Planners
 Will the Recovery Ever End? Certified Financial Planners Place cover image here Richard Wobbekind Senior Economist and Associate Dean for Business and Government Relations January 25, 219 Attention: This
Business Growth in Colorado
 QUARTERLY BUSINESS & ECONOMIC INDICATORS First Quarter 2013 PUBLISHED BY BUSINESS RESEARCH DIVISION, LEEDS SCHOOL OF BUSINESS, UNIVERSITY OF COLORADO BOULDER I N D I C AT O R S Employment (SA) New Entity
Southwest Colorado Business Forum Business Research Division Leeds School of Business
 Southwest Colorado Business Forum 2008 Dr. Richard L. Wobbekind Associate Dean of MBA and Enterprise Programs and Executive Director of the Business Research Division, Leeds School of Business Colorado
The President s Report to the Board of Directors
 The President s Report to the Board of Directors April 4, 214 Current Economic Developments - April 4, 214 Data released since your last Directors' meeting show the economy was a bit stronger in the fourth
Southwest Business Forum. Business Research Division Leeds School of Business University of Colorado
 Southwest Business Forum Colorado Population, Employment, Income and Prices Change in Population Change in Colorado Population Thousands 2004-2014 100 90 80 70 60 50 40 30 20 10 Among top 7 states for
Third Quarter 2015 An independent economic analysis of Arkansas three largest metro areas: Central Arkansas Northwest Arkansas The Fort Smith region
 Third Quarter 2015 An independent economic analysis of Arkansas three largest metro areas: Central Arkansas Northwest Arkansas The Fort Smith region About The Compass The Compass Report is managed by Talk
Valentyn Povroznyuk, Edilberto L. Segura
 National real GDP grew by 2.3% quarter-over-quarter (qoq) in Q2 2015. Average real GDP growth for Q4 2011-Q1 2015 was revised downwards by 0.2% from the previously published 2.2%. US industrial output
The Colorado Outlook September 20, Follow the Governor s Office of State Planning and Budgeting on
 source Table of Contents Summary... 3 The Economy: Issues, Trends, and Forecast... 4 Summary of Key Economic Indicators... 17 General Fund and State Education Fund Revenue Forecast... 23 General Fund and
The Colorado Outlook March 17, Follow the Governor s Office of State Planning and Budgeting on
 sourc e Table of Contents Summary... 3 The Economy: Issues, Trends, and Forecast... 4 Summary of Key Economic Indicators... 29 General Fund and State Education Fund Revenue Forecast... 35 General Fund
QUARTERLY INDICATORS Southern Nevada Business Confidence Index
 Fourth Quarter 2017 Economic Outlook: Global, National, and Local U.S. real gross domestic product (GDP) for the second quarter of 2017 rebounded robustly, increasing at a 3.1 percent annualized rate.
Economy on Stronger Footing
 QUARTERLY BUSINESS & ECONOMIC INDICATORS Second Quarter 2013 PUBLISHED BY BUSINESS RESEARCH DIVISION, LEEDS SCHOOL OF BUSINESS, UNIVERSITY OF COLORADO BOULDER I N D I C AT O R S Employment (SA) New Entity
COMPTROLLER LEMBO REPORTS EARLY INDICATIONS THAT STATE COULD END FISCAL YEAR 2019 IN SURPLUS
 COMPTROLLER LEMBO REPORTS EARLY INDICATIONS THAT STATE COULD END FISCAL YEAR 2019 IN SURPLUS Comptroller Kevin Lembo today said that there are reasons for cautious optimism that the state could end Fiscal
VECTRA BANK 23 RD ANNUAL ECONOMIC FORECAST BREAKFAST START SMART IN 2016! Member FDIC VectraBank.com
 VECTRA BANK 23 RD ANNUAL ECONOMIC FORECAST BREAKFAST START SMART IN 2016! Member FDIC VectraBank.com Colorado s Economy and State Budget Office of State Planning and Budgeting April 26, 2016 Jason Schrock,
The Election Economy. November 29, City of Georgetown
 The Election Economy November 29, 2016 City of Georgetown More Growth Coming Why are people moving here? Citizens Quality of Life Planning for Growth 100% Renewable Energy by 2018 Transportation Investments
Michigan Economic Update
 Michigan Economic Update Federal Reserve Bank of Chicago Detroit Branch October 30, 2015 Paul Traub Senior Business Economist The Midwest Economy declined to -0.15 in September while Michigan s contribution
INDICATORS NEW ENGLAND ECONOMIC. Final Edition see inside cover FOURTH QUARTER Federal Reserve Bank of Boston
 NEW ENGLAND ECONOMIC INDICATORS FOURTH QUARTER 212 Federal Reserve Bank of Boston Economic Snapshot Labor Market Conditions Income Consumer Prices Merchandise Exports Real Estate Final Edition see inside
W HIGHLIGHTS - EXECUTIVE SUMMARY
 FURNITURE INSIGHTS Smith Leonard PLLC s Industry Newsletter June 2018 W HIGHLIGHTS - EXECUTIVE SUMMARY e had heard at the High Point Market that business seemed to have picked up a bit. We also heard that
QUARTERLY INDICATORS Southern Nevada Business Confidence Index
 Third Quarter 2018 Economic Outlook: Global, National, and Local U.S. real gross domestic product (GDP) for the first quarter of 2018 expanded at an annualized rate of 2.0 percent, after three consecutive
THE STATE OF THE ECONOMY
 THE STATE OF THE ECONOMY ANGELA GUO Portland State University The United States economy in the fourth quarter of 2013 appears to have a more robust foothold pointing to a healthier outlook for 2014. Much
The Outlook for the U.S. Economy March Summary View. The Current State of the Economy
 The Outlook for the U.S. Economy March 2010 Summary View The Current State of the Economy 8% 6% Quarterly Change (SAAR) Chart 1. The Economic Outlook History Forecast The December 2007-2009 recession is
MonthlyEconomicIndicators. MarchUpdate: 2017Benchmark EmploymentRevision. EnergeticBodies.EnergeticMinds. ResearchSponsor.
 MonthlyEconomicIndicators EnergeticBodies.EnergeticMinds. www.metrodenver.org MarchUpdate: 2017Benchmark EmploymentRevision ResearchSponsor www.pinnacol.com www.developmentresearch.net 2016 and 2017 Employment
REGIONAL SUMMARIES. Nonfarm employment grew in the second quarter. Non-farm jobs totaled 56,900 in June, up from 55,500 in June 2016.
 Second Quarter 2017 Quarterly narrative An independent economic analysis of four Arkansas metro areas: Central Arkansas Northwest Arkansas The Fort Smith region Jonesboro metro REGIONAL SUMMARIES Fort
JOB SITUATION INCOME. 3 rd Quarter 2015 PITTSBURGH
 3 rd Quarter PITTSBURGH JOB SITUATION The Pittsburgh market area will continue to experience slow and steady economic growth through the remainder of and into next year. The market area s employment is
MORGANTOWN METROPOLITAN STATISTICAL AREA OUTLOOK COLLEGE OF BUSINESS AND ECONOMICS. Bureau of Business and Economic Research
 2013 MORGANTOWN METROPOLITAN STATISTICAL AREA OUTLOOK COLLEGE OF BUSINESS AND ECONOMICS Bureau of Business and Economic Research 1 MORGANTOWN METROPOLITAN STATISTICAL AREA OUtlook 2013 EXECUTIVE SUMMARY
The Arkansas Economic Outlook
 The Arkansas Economic Outlook Dr. Michael Pakko Chief Economist and State Economic Forecaster Arkansas Economic Development Institute, UALR December 1, 2017 Overview Review of Economic Conditions: Output
Empire State Manufacturing Survey
 November 216 Empire State Manufacturing Survey Business activity stabilized in New York State, according to firms responding to the November 216 Empire State Manufacturing Survey. The headline general
Economic Update. Platts Aluminum Symposium 2014 Ft. Lauderdale, Florida January 13, Chris Oakley Federal Reserve Bank of Atlanta January 2014
 1 Economic Update Platts Aluminum Symposium 2014 Ft. Lauderdale, Florida January 13, 2014 Chris Oakley Federal Reserve Bank of Atlanta January 2014 2 Summary of the Economic Environment 1. Economic growth
Smith Leonard PLLC Kenneth D. Smith, CPA Mark S. Laferriere, CPA
 FURNITURE INSIGHTS Smith Leonard PLLC s Industry Newsletter August 2018 N HIGHLIGHTS - EXECUTIVE SUMMARY ew orders in June 2018 were up 5% over June 2017, according to our recent survey of residential
2015 Mid-Year Economic Update
 BROOMFIELD Economic Development 2015 Mid-Year Economic Update Provided by: Broomfield Economic Development One Descombes Drive Broomfield, CO 80020 303-464-5579 www.investbroomfield.com Prepared by: Development
Boost from Fiscal Policy to Fade in 2019
 Real PCE: Motor Vehicles & Parts (SAAR, 29$, Annualized % Change) Regular Grade, Avg Dollars per Gallon Economic Developments May 28 Boost from Fiscal Policy to Fade in 29 First quarter economic growth
Economic Growth Expected to Slow and Housing to Stabilize in 2019
 Consumer Confidence Expectations in the Next Six Months (%) Economic Developments December 218 Economic Growth Expected to Slow and Housing to Stabilize in 219 The U.S. economy is expected to grow 2.6
Secretary of State Business Filings Q Data Analysis Summary
 C O L O R A D O S E C R E TA R Y O F S TAT E QUARTERLY BUSINESS & ECONOMIC INDICATORS Fourth Quarter 2014 Secretary of State Business Filings Q4 2014 Data Analysis Summary New business filings increase
Baseline U.S. Economic Outlook, Summary Table*
 October 2014 Solid U.S. Economic Data Belie Market Turmoil Executive Summary September payroll job growth was above consensus with 248,000 jobs added over the month. September private-sector employment
Ontario Economic Accounts
 SECOND QUARTER OF 2017 April, May, June Ontario Economic Accounts ONTARIO MINISTRY OF FINANCE Table of Contents ECONOMIC ACCOUNTS Highlights 1 Ontario s Economy Continues to Grow Expenditure Details 2
State of Ohio Workforce. 2 nd Quarter
 To Strengthen Ohio s Families through the Delivery of Integrated Solutions to Temporary Challenges State of Ohio Workforce 2 nd Quarter 2 0 1 2 Quarterly Report on the State of Ohio s Workforce Reference
The Washington Region s Current Economic Performance and Near-Term Outlook
 The Washington Region s Current Economic Performance and Near-Term Outlook Stephen S. Fuller, Ph.D. Dwight Schar Faculty Chair and University Professor Director, The Stephen S. Fuller Institute for Research
Charting a New (Economy) Course
 Course") Charting a New (Economy) Course Metro Denver 2009 Economic Forecast January 2009 Colorado Outperforms the U.S. 2009 forecast values Colorado United States Job losses less severe -0.4% -1.1% Unemployment
Charting a New (Economy) Course Metro Denver 2009 Economic Forecast January 2009 Colorado Outperforms the U.S. 2009 forecast values Colorado United States Job losses less severe -0.4% -1.1% Unemployment
LETTER. economic COULD INTEREST RATES HEAD UP IN 2015? JANUARY Canada. United States. Interest rates. Oil price. Canadian dollar.
 economic LETTER JANUARY 215 COULD INTEREST RATES HEAD UP IN 215? For six years now, that is, since the financial crisis that shook the world in 28, Canadian interest rates have stayed low. The key interest
In fiscal year 2016, for the first time since 2009, the
 Summary In fiscal year 216, for the first time since 29, the federal budget deficit increased in relation to the nation s economic output. The Congressional Budget Office projects that over the next decade,
Gus Faucher Stuart Hoffman William Adams Kurt Rankin Mekael Teshome Chief Economist Senior Economic Advisor Senior Economist Economist Economist
 May 217 Gus Faucher Stuart Hoffman William Adams Kurt Rankin Mekael Teshome Chief Economist Senior Economic Advisor Senior Economist Economist Economist Executive Summary With Job Market in Good Shape,
Tulsa Metropolitan Area Outlook
 The Oklahoma Economy 2009 Okllahoma Economiic Outllook Tulsa Metropolitan Area Outlook Economic Performance Index Spears School of Business Oklahoma State University The 2009 Oklahoma Economic Outlook
Outlook for the Hawai'i Economy
 Outlook for the Hawai'i Economy May 3, 2001 Dr. Carl Bonham University of Hawai'i Economic Research Organization Summary The Hawaii economy entered 2001 in its best shape in more than a decade. While the
LIA Monthly Economic Report
 This publication is made possible through the support of:. LIA Monthly Economic Report A Research Report for Directors and Members of the Long Island Association, Inc. November 2018, 2018 Prepared by Dr.
Economic growth. The economy s need for workers originates in
 Economic growth 40 The economy s need for workers originates in the demand for the goods and services that they provide. So, in order to project employment, BLS starts by estimating the production of final
file:///c:/users/cathy/appdata/local/microsoft/windows/temporary Int...
 1 of 5 9/25/17, 8:57 AM A Publication of the National Association of Manufacturers September 25, 2017 As expected, the Federal Reserve opted to not raise short-term interest rates at its September 19 20
First Quarter 2016 Quarterly narrative REGIONAL SUMMARIES Fort Smith region Northwest Arkansas Central Arkansas Jonesboro
 First Quarter 2016 Quarterly narrative An independent economic analysis of four Arkansas metro areas: Central Arkansas Northwest Arkansas The Fort Smith region Jonesboro metro REGIONAL SUMMARIES Fort Smith
Current Economic Conditions in the Eighth Federal Reserve District. Little Rock Zone
 Current Economic Conditions in the Eighth Federal Reserve District Little Rock Zone December 21, 2012 Prepared by the Research Division of the Federal Reserve Bank of St. Louis Eighth Federal Reserve District
NEW ORLEANS REGIONAL COUNCIL FOR BUSINESS ECONOMICS
 Monthly Non-Farm Employment Jan. 2008 Apr Jul Jan.2009 Jan. 2010 Jan.2011 Jan.2012 Jan.2013 Jan.2014 Jan. 2015 Jan. 2016 Jan.2017 2017 THE NEW ORLEANS REGIONAL ECONOMIC INDEX NEW ORLEANS REGIONAL COUNCIL
LETTER. economic. China: Towards a floating exchange rate regime? MAY bdc.ca
 economic LETTER MAY 212 China: Towards a floating exchange rate regime? For many years now, the West has been reproaching China for keeping the yuan below its balanced value, that is, the value that would
INDICATORS NEW ENGLAND ECONOMIC THIRD QUARTER Federal Reserve Bank of Boston
 NEW ENGLAND ECONOMIC INDICATORS THIRD QUARTER Federal Reserve Bank of Boston Economic Snapshot Labor Market Conditions Income Consumer Prices Merchandise Exports Real Estate Includes data available as
Baseline U.S. Economic Outlook, Summary Table*
 January 19 Gus Faucher Stuart Hoffman William Adams Kurt Rankin Abbey Omodunbi Chief Economist Senior Economic Advisor Senior Economist Economist Economist Executive Summary Great December Jobs Report;
1 st Quarter Revenue and Expenditures
 1 st Quarter Revenue and Expenditures REPORTFY 2017 Published 11/15/2016 Revenues Section 2.09 of the Principles of Sound Financial Management requires quarterly updates to the Board of County Supervisors
The real change in private inventories added 0.22 percentage points to the second quarter GDP growth, after subtracting 0.65% in the first quarter.
 QIRGRETA Monthly Macroeconomic Commentary United States The U.S. economy bounced back in the second quarter of 2007, growing at the fastest pace in more than a year. According the final estimates released
SUBJECT: PRELIMINARY NOVEMBER 2011 ECONOMIC FORECAST
 October 26, 2011 STATE OF WASHINGTON ECONOMIC AND REVENUE FORECAST COUNCIL - 34-1560 TO: FROM: Governor s Council of Economic Advisors Arun Raha, Executive Director Economic and Revenue Forecast Council
QUARTERLY INDICATORS Southern Nevada Business Confidence Index
 Second Quarter 2018 Economic Outlook: Global, National, and Local U.S. real gross domestic product (GDP) for the fourth quarter of 2017 expanded at an annualized rate of 2.9 percent, after two consecutive
Pacific Northwest Economic Development Council Conference Mt. Hood, Oregon June 20, 2005
 Pacific Northwest Economic Development Council Conference Mt. Hood, Oregon June 20, 2005 Gary C. Zimmerman, Senior Economist Federal Reserve Bank of San Francisco Gary.Zimmerman@sf.frb.org Overview National
EMBARGOED UNTIL MARCH 2, 2011
 Outlook FORECAST: 2011-2015 March 2011 BUREAU OF BUSINESS AND ECONOMIC RESEARCH COLLEGE OF BUSINESS AND ECONOMICS WEST VIRGINIA UNIVERSITY www.bber.wvu.edu Executive Summary The Morgantown metropolitan
Owasso, Oklahoma: 2016 Economic Outlook
 Owasso, OK Economic Outlook Contact: Mark C. Snead, President and Economist March 2, 216 mark.snead@regiontrack.com (8) 762-57 Owasso, Oklahoma: 216 Economic Outlook Owasso continues to grow but is feeling
O HIGHLIGHTS - EXECUTIVE SUMMARY
 FURNITURE INSIGHTS Smith Leonard PLLC s Industry Newsletter February 2018 O HIGHLIGHTS - EXECUTIVE SUMMARY ur latest survey of residential furniture manufacturers and distributors revealed some disappointing
Economic Developments April 2019 Lower Mortgage Rates and Continued Wage Growth Provide Some Stability for Housing
 Economic Developments April 2019 Lower Mortgage Rates and Continued Wage Growth Provide Some Stability for Housing U.S. economic growth is expected to slow from 3.0 percent in 2018 to 2.2 percent in 2019.
Q3 Macroeconomic Update: Rising employment, slowing investment
 WWW.IBISWORLD.COM December January 2017 2014 1 Q3 Follow Macroeconomic on head on Master Update page A December 2017 : Rising employment, slowing investment By Viraj D Costa, Robert Miles, Chrystalleni
Worcester Economic Indicators
 Worcester Economic Indicators Steady Growth Continues in Second Quarter Worcester Economic Index up 2.5% Worcester Economic Index The Worcester economy continued to expand at a moderate pace during the
It s Déjà Vu All Over (and Over) Again
 Again") Mar-16 Apr-16 May-16 Jun-16 Jul-16 Aug-16 Sep-16 Oct-16 Nov-16 Dec-16 Jan-17 Feb-17 Mar-17 Personal Consumption Expenditures (SAAR, Chn.2009$, M-o-M % Change) Q3:2009 Q4:2009 Q1:2010 Q2:2010 Q3:2010 Q4:2010
Mar-16 Apr-16 May-16 Jun-16 Jul-16 Aug-16 Sep-16 Oct-16 Nov-16 Dec-16 Jan-17 Feb-17 Mar-17 Personal Consumption Expenditures (SAAR, Chn.2009$, M-o-M % Change) Q3:2009 Q4:2009 Q1:2010 Q2:2010 Q3:2010 Q4:2010
IMF Executive Board Concludes Article IV Consultation with United States
 Tuesday 12 th July 2016 11:30 am International Prepared by: Ravi Kurjah, Analyst II, First Citizens Research and Analytics Ravi.Kurjah@firstcitizenstt.com IMF Executive Board Concludes Article IV Consultation
Owasso Returns to Trend Growth Rate in 2017
 217 Owasso, OK Economic Outlook Contact: Mark C. Snead, President and Economist March 23, 217 mark.snead@regiontrack.com (8) 762-57 Owasso Returns to Trend Growth Rate in 217 The Owasso economy slowed
MORE BALANCED ECONOMIC GROWTH By the Bureau of Business Research and the Nebraska Business Forecast Council
 VOLUME 71, NO. 719 PRESENTED BY THE UNL BUREAU OF BUSINESS RESEARCH (BBR) JUNE 2017 MORE BALANCED ECONOMIC GROWTH By the Bureau of Business Research and the Nebraska Business Forecast Council U.S. Macroeconomic
National & Colorado. Economic Update. Alison Felix Economist & Branch Executive Federal Reserve Bank of Kansas City Denver Branch
 National & Colorado Economic Update Alison Felix Economist & Branch Executive Federal Reserve Bank of Kansas City Denver Branch The views expressed are those of the presenter and do not necessarily reflect
Colorado Economic Forecast Just the Facts!
 Colorado Economic Forecast 2017 Just the Facts! Larimer County Workforce Development Board February 8, 2017 Gary Horvath 1 If the Recession is Over Where is the Talent? February 2012 Presentation 222,831
Current Economic Conditions in the Eighth Federal Reserve District. Memphis Zone
 Current Economic Conditions in the Eighth Federal Reserve District Memphis Zone December 21, 2012 Prepared by the Research Division of the Federal Reserve Bank of St. Louis Eighth Federal Reserve District
Malaysia- GDP & BOP 1Q17
 Real GDP growth surprised on the upside in 1Q17 Real GDP growth rose by 5.6% in 1Q17, exceeding market expectations Malaysia s real GDP growth rose by 5.6% yoy in 1Q17 (4.5% in 4Q16), significantly higher
Empire State Manufacturing Survey.
 October 217 Empire State Manufacturing Survey Business activity grew at a robust pace in New York State, according to firms responding to the October 217 Empire State Manufacturing Survey. The headline
Business Situation. Preliminary Estimates for the First Quarter Real Gross Domestic Product Percent 10
 June 22 1 Business Situation Preliminary Estimates for the First Quarter 22 P RODUCTION in the United States surged in the first quarter of 22, while final sales slowed, according to the preliminary estimates
DALLAS-FORT WORTH METRO
 METRO FOURTH QUARTER 2017 Economic Growth Beats Expectations More jobs added than any other metro According to the Texas Workforce Commission, the Dallas-Fort Worth (DFW) economy led the nation by adding
Housingmarket. Tennessee. 2nd Quarter Business and Economic Research Center David Penn, Ph.D., Associate Professor, Economics
 Tennessee Housingmarket 2nd Quarter 214 Business and Economic Research Center David Penn, Ph.D., Associate Professor, Economics Supported by Tennessee Housing Development Agency Economic Overview ennessee
Metro Milwaukee Economic Trends January 2018
 Metro Milwaukee Economic Trends January 2018 Prepared by: Economic Research Division March 16, 2018 Metropolitan Milwaukee Association of Commerce www.mmac.org www.mmac.org January Economic Trends Metro
LETTER. economic. A quick look at food prices SEPTEMBER bdc.ca
 economic LETTER SEPTEMBER A quick look at food prices Food prices have risen significantly in Canada in recent years. 1 Between uary 2007 and, the food prices index was the component of the Consumer Price
Smith Leonard PLLC Kenneth D. Smith, CPA Mark S. Laferriere, CPA
 Smith Leonard PLLC s Industry Newsletter January 2018 HIGHLIGHTS - EXECUTIVE SUMMARY A ccording to our latest survey of residential furniture manufacturers and distributors, new orders in November 2017
THE STATE OF THE ECONOMY
 THE STATE OF THE ECONOMY ANGELA GUO Portland State University Moderate growth continued in the United States economy through the second quarter of 2013, though forecasters had anticipated an acceleration
New Mexico Economy: Recent Developments and Outlook
 University of New Mexico UNM Digital Repository BBER Publications Bureau of Business and Economic Research 1-11-2011 New Mexico Economy: Recent Developments and Outlook Lee A. Reynis Follow this and additional
C I T Y O F B O I S E
 C I T Y O F B O I S E D E P A R T M E N T O F F I N A N C E A N D A D M I N I S T R A T I O N Office of Budget Development & Monitoring Economic Brief Mike Sherack, Senior Budget Analyst & Brent Davis,
Nevada Economy More Firmly in Recovery than Previously Realized
 A monthly report produced for Commerce Real Estate Solutions by Stephen P. A. Brown, PhD, Center for Business & Economic Research University of Nevada, Las Vegas Issue 14 February 2012 Nevada Economy More
Banks at a Glance: Economic and Banking Highlights by State 2Q 2018
 Economic and Banking Highlights by State 2Q 2018 These semi-annual reports highlight key indicators of economic and banking conditions within each of the nine states comprising the 12th Federal Reserve
Empire State Manufacturing Survey
 November 217 Empire State Manufacturing Survey Business activity continued to grow strongly in New York State, according to firms responding to the November 217 Empire State Manufacturing Survey. Though
U.S. Equipment & Software Investment Momentum Monitor
 U.S. Equipment & Software Investment Momentum Monitor June 2018 CONTACT INFORMATION: Kelli Nienaber, Executive Director Equipment Leasing & Finance Foundation knienaber@elfaonline.org www.leasefoundation.org