Leeds Business Confidence Index
|
|
|
- Lynette Hardy
- 5 years ago
- Views:
Transcription
 captures Colorado business leaders expectations for the national economy, state economy,")
1 Second Quarter 2018 Volume 11, number 2 colorado.edu/business/brd Leeds Business Confidence Steady Ahead of Q The Leeds Business Confidence Index (LBCI) captures Colorado business leaders expectations for the national economy, state economy, industry sales, profits, hiring plans, and capital expenditures. Ahead of Q the index increased to 61.3, but slipped to 59.7 ahead of Q Although expectations generally rose ahead of Q2, they fell slightly ahead of Q3 for all components. A total of 310 qualified panelists responded to the survey from March 1 through March 20. Component Leeds Business Confidence Index Q3 Q4 Q Q Q Change Quarterly Annual State Economy National Economy Industry Sales No Change Industry Profits Industry Hiring Capital Expenditures LBCI Business confidence is slightly higher ahead of Q2, but falls looking to Q3. All six individual components of the LBCI remain in positive territory (above 50) ahead of both Q and Q Expectations for five of the components rose ahead of Q2, and the national economy fell by only 0.1 points from Q to Q Looking at the index year-over-year, five components fell from Q to Q2 2018, indicating less confidence among business leaders this year. When panelists were asked how they would use tax savings, the top responses for households include they will increase savings, or they do not expect a tax cut. Regarding how companies will use the savings, the most frequent responses are they are unsure, or they plan to invest in equipment. Colorado continues to experience employment growth, real GDP expansion, increasing personal incomes, as well as other macroeconomic factors, and the overall positive reading of the LBCI is consistent with these trends. 1
, but they slipped 2.1 points from a year ago. Looking further ahead to Q3 2018, expectations are unchanged from Q3 2017 (59.")

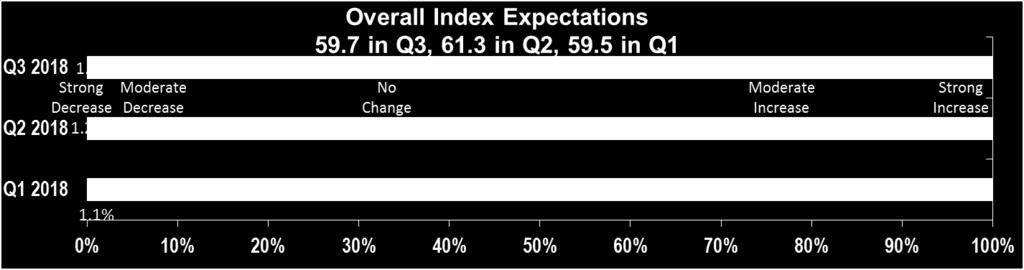
2 Summary Steady Growth Ahead of Q2 The LBCI rose ahead of Q2 2018, but decreased slightly ahead of Q The overall index remains comfortably in positive territory (above 50). Expectations for Q are 61.3 (a 1.8- point increase from last quarter), but they slipped 2.1 points from a year ago. Looking further ahead to Q3 2018, expectations are unchanged from Q (59.7), but fell 1.6 points from the previous quarter. All six individual components of the index remain in positive territory, and the national economy was the only component that fell from Q to Q Looking ahead to Q3, expectations for all six components declined compared to the prior quarter. National real gross domestic product (GDP) grew at a 2.5% seasonally adjusted annual rate (SAAR) in Q Personal consumption expenditures increased, gross private domestic investment decelerated, and net exports improved for the quarter, while government expenditures grew. In 2017, GDP rose 2.3%, following the previous year s increase of 1.5%; analysts project accelerating growth in GDP has recorded positive growth for the seventh consecutive year according to the Bureau of Economic Analysis (BEA). Colorado continued to experience positive real GDP growth, with 3.7% SAAR in Q Colorado accounted for 1.8% of total U.S. GDP in Q


3 National and State Economies Slight Positive Growth for State Outlook After the national and state economy expectations converged in Q1 2018, with a reading of 58.2, state expectations rose ahead of Q2 and national expectations fell. National expectations decreased modestly from 58.2 in Q1 to 58.1 ahead of Q2 and 57.3 ahead of Q State expectations rose from 58.2 in Q1 to 62.1 ahead of Q2 but slid to 61.9 ahead of Q After three quarters of decreasing expectations on the state level, Q2 marks a transition to increased confidence, even though expectations are still 4.9 points lower than one year ago. Panelists expectations for both the state and national economies maintained above-neutral outlooks. For the state economy, the majority of respondents (53.6%) believe that the state economy will expand in Q2, and a smaller percentage (11.3%) expects a decline. A total of 35.2% of panelists remain neutral. On the national level, 47.4% of panelists expect an expansion, while 18.7% expect a decline. Looking ahead to Q3, 53% anticipate an expansion of the state economy and 46.6% expect a national expansion. U.S GDP grew at 2.5% SAAR in Q4 2017, a decrease in the growth rate from the prior quarter s rate of 3.2%. The BEA reported: The increase in real GDP in the fourth quarter reflected positive contributions from personal consumption expenditures (PCE), exports, nonresidential fixed investment, residential fixed investment, state and local government spending, and federal government spending that were partly offset by a negative contribution from private inventory investment. Imports, which are a subtraction in the calculation of GDP, increased. 3

4 Colorado s Q real GDP grew at an SAAR of 3.7%. Quarter-over-quarter, the Finance and Insurance, Information, and Health Care and Social Assistance industries increased by the largest percentage and dollar amount. Sales and Profits Small Decreases in Expectations Sales and profits expectations rose 2.7 and 1.9 points, respectively, from Q1 and Q Looking toward Q3, however, sales expectations fell 2.9 points, while profits expectations decreased 2 points. The profits index increased from 60.6 in Q1 to 62.5 ahead of Q2, but decreased to 60.5 ahead of Q3. Respondents maintained an overall positive outlook, with 54.5% expecting a moderate to strong increase in Q2. The sales index increased from 61.6 in Q1 to 64.3 ahead of Q2 and fell slightly, to 61.4, in Q3. In Q2, 60.4 of panelists expect an increase, while 10.4% expect a decrease in sales. In terms of sales and profits, around 30% of respondents remain neutral. According to the Institute for Supply Management, the national manufacturing index in February 2018 is 60.8, which is the highest level since May February s manufacturing index is 2.8 points higher than the 12-month average and 1.7 points higher than January The nonmanufacturing index fell slightly in February 2018, by 0.4 points, from January, but remained 2.1 points above the average for the past 12 months. Personal incomes continued to grow in Colorado in Q According to the BEA, Q (most recent data) Colorado personal income rose 1.3% from the preceding quarter, with a strong increase of 5.3% year-over-year. Colorado ranked 5th in the nation for year-over-year 4

5 growth, and rose to 9th for quarterly growth. Per capita personal income increased 0.9% in the state from Q to Q and 3.9% year-over-year. Colorado ranked 29th among states for quarterly growth in per capita personal income and 11th among all states in year-over-year growth in Q Prices continue to increase, putting more pressure on personal income, wages, and salaries. According to the Bureau of Labor Statistics, prices increased 2.6% year-overyear in the second half of 2017 in the Denver-Aurora-Lakewood region in Colorado. Core inflation (which excludes energy and food) increased 3.4% and shelter increased 4.5% during the same period. Capital Expenditures and Hiring Plans Mixed Expectations The outlook for both capital expenditures and hiring is relatively steady ahead of Q2 and Q3. Hiring plans increased to 60.5 in Q2 and decreased to 57.9 in Q3, while capital expenditures rose to 60.5 in Q2 but fell to 59.0 in Q3. Both components are lower than their readings from one year ago. Hiring plans fell by 1.2 points from Q to Q2 2018, and capital expenditures dropped by 0.5 points in the same time frame. Less than half of respondents expect an increase in hiring plans (45.5%) and capital expenditures (46.8%) in Q In addition, 45.2% expect no change in hiring plans, and 42.9% anticipate no change in capital expenditures in Q2. In Colorado, an indicator for capital expenditures is infrastructure. According to Dodge Data and Analytics, the value of construction in Colorado was up 12% through February 2018 compared to the same period one year ago. Through February, nonbuilding increased by 6.5%, while residential increased by 22.4%. According to the U.S. Census Bureau, the total value of 5

6 construction for the nation increased by 3.2% from January 2017 to January 2018, which is considerably lower than Colorado. Employment continues to grow in the United States. In January 2018, jobs increased 1.5% yearover-year. For all nonfarm sectors, 200,000 jobs were added between December 2017 and January Year-to-date through January, the average number of jobs added per month totaled 174,000, down from an average of 190,000 for the same period a year ago. The unemployment rate in the United States stood at 4.1% in January. As of February 2018, Colorado continued to exhibit strong employment growth. Jobs increased 2.4% from February 2017 to February 2018, an increase of 63,400 year-over-year the fifthfastest rate in the country. The state unemployment rate continues to outperform the nation as a whole. In February 2018, the unemployment rate was just 3% seasonally adjusted, well below the national average of 4.1%. Year-over-year employment growth was recorded for Colorado s seven metropolitan areas. The Greeley MSA recorded the fastest year-over-year growth (6%), followed by Fort Collins (2.9%), Denver-Aurora-Lakewood (2.4%), Colorado Springs (2.2%), Boulder (1.9%), and Grand Junction (1.8%). Pueblo was the only MSA to report job losses (-0.3%). Colorado industries with the greatest annual percent change in February were Mining and Logging (16.7%), Construction (7.1%), and Information (4.1%). Impact of the Tax Cuts and Jobs Act (TCJA) Panelists were asked how their households and companies planned to use their tax savings. Approximately 45% responded that their households planned to increase savings, while 32% do not expect a tax cut. A total of 27% of households plan to pay off debt. Turning to how companies expect to use the tax savings, 44% are unsure of how they will use it, and 27% plan to invest in equipment. 6
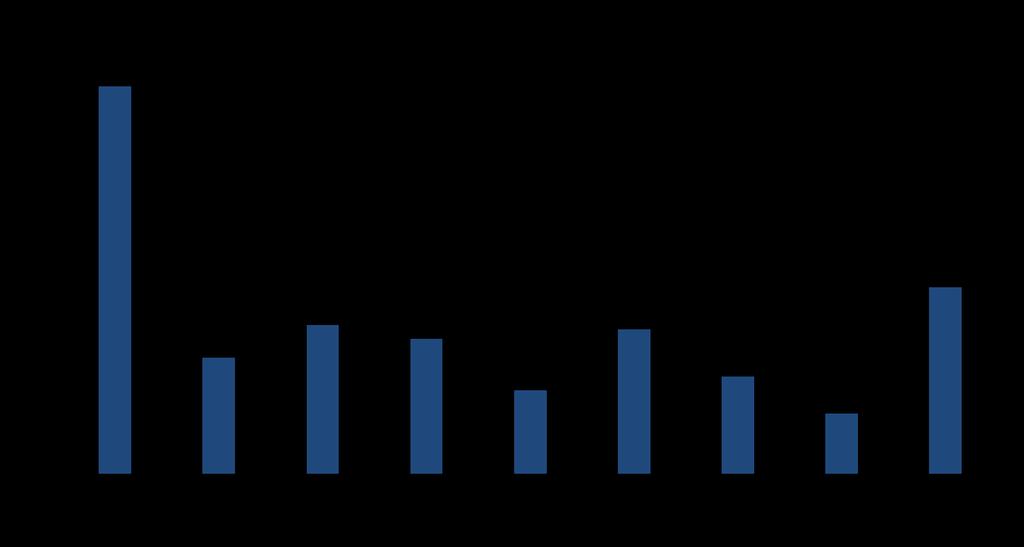
 of survey respondents work for companies with fewer than 50 employees. The four largest groups were represented by companies with 1 4 employees (28.")

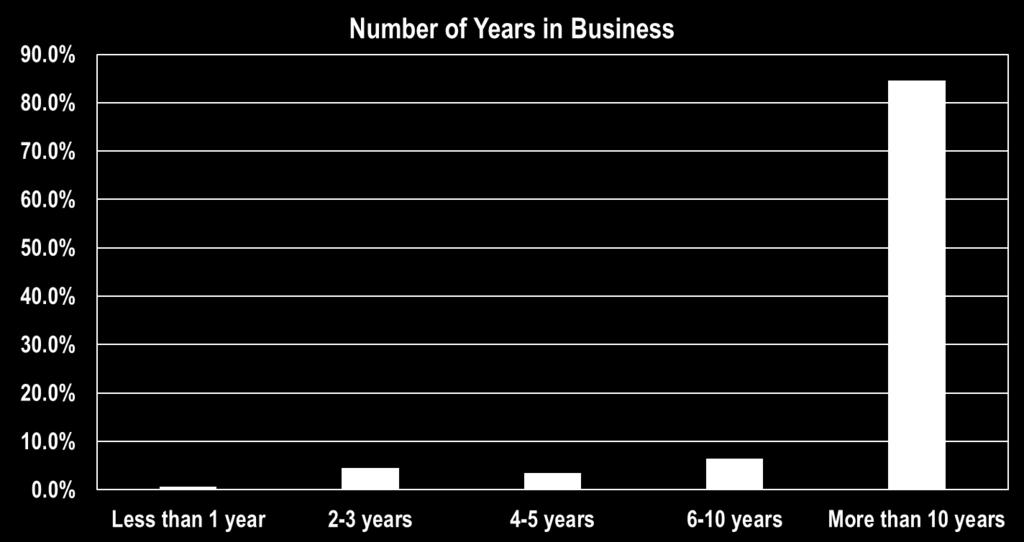
7 Expectations by Company Size and Length of Time in Business Panelists were asked two additional questions, one about the size of their company and the other about how long their company has been in business. About half (57.7%) of survey respondents work for companies with fewer than 50 employees. The four largest groups were represented by companies with 1 4 employees (28.3%), 1,000 or more employees (13.7%), employees (10.9%), and employees (9.9%). Small employers (fewer than 50 employees) expectations increased 1.3 points ahead of Q2, and large employers expectations increased 2 points. From Q2 to Q3, small and large employers expectations decreased 1.7 points. In Q2, small employers were slightly more optimistic than large employers (61.6 versus 60.9). A total of 84.6% of respondents work at a long-standing company that has been in business for more than 10 years. While responding panelists represent every industry in the state, the largest percentage of respondents to the Q2 survey were in the following sectors: Professional, Scientific and Technical Services (18%); Finance and Insurance (16%); and Real Estate, Rental and Leasing (15%). 7

8 8
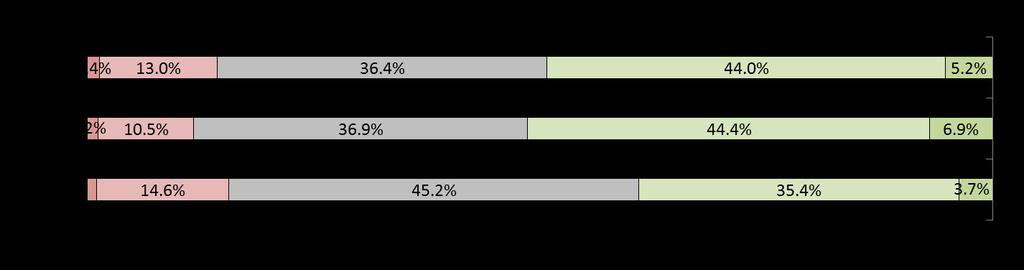
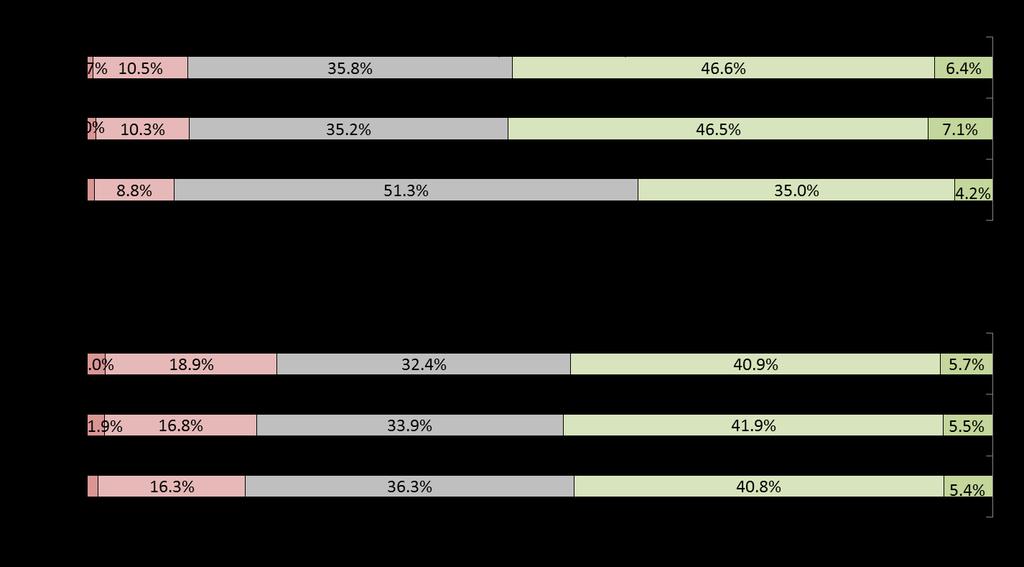
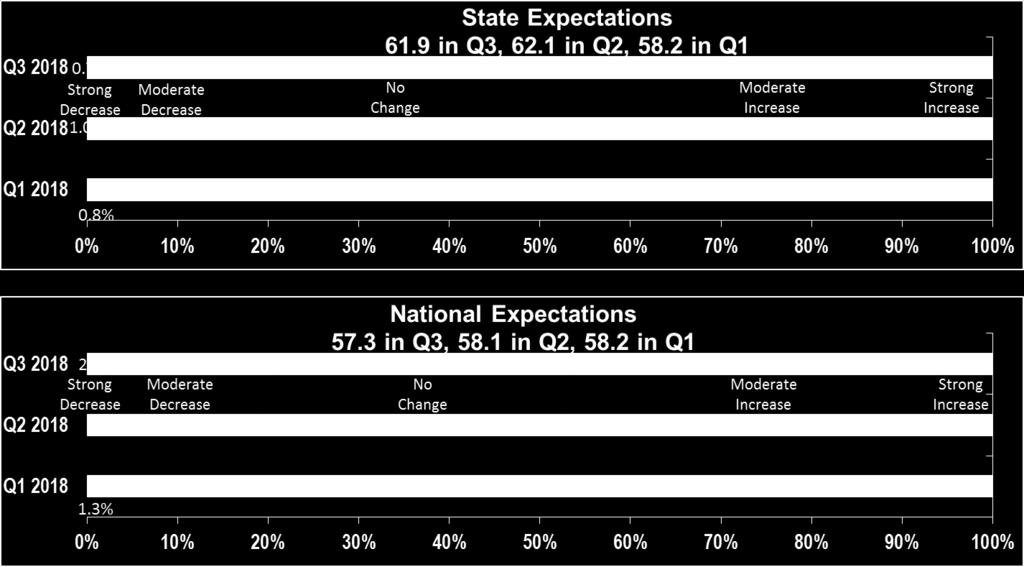
9 Distribution of Expectations in Q3 2018, Q2 2018, Q
10 # # # For more information about the LBCI and to become a panelist, go to: 10
Leeds Business Confidence Index
 Third Quarter 2018 Volume 11, number 3 colorado.edu/business/brd Leeds Business Confidence Steady Ahead of Q3 2018 The Leeds Business Confidence Index (LBCI) captures Colorado business leaders expectations
Leeds Business Confidence Index
 First Quarter 2018 Volume 11, number 1 colorado.edu/business/brd Leeds Business Confidence Rebounds Ahead of Q1 2018 The Leeds Business Confidence Index (LBCI) captures Colorado business leaders expectations
Leeds Business Confidence Index
 Fourth Quarter 2017 Volume 10, number 4 colorado.edu/business/brd Leeds Business Confidence Index Cools Ahead of Q4 2017 The Leeds Business Confidence Index (LBCI) captures Colorado business leaders expectations
Summary Pessimism Abates Ahead of Q1
 First Quarter 2016 Volume 9, number 1 colorado.edu/business/brd Summary Pessimism Abates Ahead of Q1 The panel of business leaders surveyed in the Leeds Business Confidence Index (LBCI) reported modestly
Second Quarter 2016 Volume 9, number 2 colorado.edu/business/brd
 Second Quarter 2016 Volume 9, number 2 colorado.edu/business/brd Summary Stable Expectations The panel of business leaders surveyed in the Leeds Business Confidence Index (LBCI) reported steady optimism
Analysis & Background
 1 Values shown are June estimates. # # # Analysis & Background Expected Revisions to Colorado Second quarter 2017 Quarterly Census of Employment and Wages (QCEW) results indicate Colorado total nonfarm
Secretary of State Business Filings Q Data Analysis Summary
 QUARTERLY BUSINESS & ECONOMIC INDICATORS First Quarter 2018 Secretary of State Business Filings Q1 2018 Data Analysis Summary New entity filings recorded strong growth in Q1 2018. State employment projections
Secretary of State Business Filings Q Data Analysis Summary
 C O L O R A D O S E C R E TA R Y O F S TAT E QUARTERLY BUSINESS & ECONOMIC INDICATORS Secretary of State Jena Griswold Fourth Quarter 2018 Secretary of State Business Filings Q4 2018 Data Analysis Summary
Secretary of State Business Filings Q Data Analysis Summary
 QUARTERLY BUSINESS & ECONOMIC INDICATORS First Quarter 2016 Secretary of State Business Filings Q1 2016 Data Analysis Summary Employment projected to continue expanding in Q2 2016 and Q3 2016, but at a
Secretary of State Business Filings Q Data Analysis Summary
 QUARTERLY BUSINESS & ECONOMIC INDICATORS Fourth Quarter 2017 Secretary of State Business Filings Q4 2017 Data Analysis Summary New entity filings continued to gain in Q4 2017. State employment projections
Secretary of State Business Filings Q Data Analysis Summary
 QUARTERLY BUSINESS & ECONOMIC INDICATORS Fourth Quarter 2016 Secretary of State Business Filings Q4 2016 Data Analysis Summary New entity filings exhibit unrelenting growth in Q4 2016. Employment growth
Secretary of State Business Filings Q Data Analysis Summary
 QUARTERLY BUSINESS & ECONOMIC INDICATORS Third Quarter 2016 Secretary of State Business Filings Q3 2016 Data Analysis Summary Employment is projected to continue expanding in Q3 2016 and Q4 2016, but at
Business Growth in Colorado
 QUARTERLY BUSINESS & ECONOMIC INDICATORS First Quarter 2013 PUBLISHED BY BUSINESS RESEARCH DIVISION, LEEDS SCHOOL OF BUSINESS, UNIVERSITY OF COLORADO BOULDER I N D I C AT O R S Employment (SA) New Entity
ECONOMIC FORECAST BREAKFAST
 ECONOMIC FORECAST BREAKFAST LEADERSHIP IN A STARTUP ECONOMY FRIDAY, JANUARY 15, 2016 www.colorado.edu/leeds/brd CAREER ADVANCING DEGREES FROM LEEDS EVENING MBA PROGRAM FOR WORKING PROFESSIONALS #1 PART-TIME
Will the Recovery Ever End? Boulder Economic Forecast
 Will the Recovery Ever End? Boulder Economic Forecast Place cover image here Richard Wobbekind Senior Economist and Associate Dean for Business and Government Relations January 17, 219 #COBizOutlook Real
More of the Same? Southwest Business Forum
 More of the Same? Southwest Business Forum Place cover image here Richard Wobbekind Senior Associate Dean, Leeds School of Business Executive Director, Business Research Division January 4, 2017 Colorado
Economic Highlights. ISM Purchasing Managers Index 1. Sixth District Payroll Employment by Industry 2. Contributions to Real GDP Growth 3
 December 1, 2010 Economic Highlights Manufacturing ISM Purchasing Managers Index 1 Employment Sixth District Payroll Employment by Industry 2 Economic Activity Contributions to Real GDP Growth 3 Prices
Valentyn Povroznyuk, Edilberto L. Segura
 National real GDP grew by 2.3% quarter-over-quarter (qoq) in Q2 2015. Average real GDP growth for Q4 2011-Q1 2015 was revised downwards by 0.2% from the previously published 2.2%. US industrial output
Economy on Stronger Footing
 QUARTERLY BUSINESS & ECONOMIC INDICATORS Second Quarter 2013 PUBLISHED BY BUSINESS RESEARCH DIVISION, LEEDS SCHOOL OF BUSINESS, UNIVERSITY OF COLORADO BOULDER I N D I C AT O R S Employment (SA) New Entity
Will the Recovery Ever End? Certified Financial Planners
 Will the Recovery Ever End? Certified Financial Planners Place cover image here Richard Wobbekind Senior Economist and Associate Dean for Business and Government Relations January 25, 219 Attention: This
Southwest Colorado Business Forum Business Research Division Leeds School of Business
 Southwest Colorado Business Forum 2008 Dr. Richard L. Wobbekind Associate Dean of MBA and Enterprise Programs and Executive Director of the Business Research Division, Leeds School of Business Colorado
Michigan Economic Update
 Michigan Economic Update Federal Reserve Bank of Chicago Detroit Branch October 30, 2015 Paul Traub Senior Business Economist The Midwest Economy declined to -0.15 in September while Michigan s contribution
Southwest Business Forum. Business Research Division Leeds School of Business University of Colorado
 Southwest Business Forum Colorado Population, Employment, Income and Prices Change in Population Change in Colorado Population Thousands 2004-2014 100 90 80 70 60 50 40 30 20 10 Among top 7 states for
The President s Report to the Board of Directors
 The President s Report to the Board of Directors April 4, 214 Current Economic Developments - April 4, 214 Data released since your last Directors' meeting show the economy was a bit stronger in the fourth
Smith Leonard PLLC Kenneth D. Smith, CPA Mark S. Laferriere, CPA
 FURNITURE INSIGHTS Smith Leonard PLLC s Industry Newsletter August 2018 N HIGHLIGHTS - EXECUTIVE SUMMARY ew orders in June 2018 were up 5% over June 2017, according to our recent survey of residential
The Colorado Outlook March 17, Follow the Governor s Office of State Planning and Budgeting on
 sourc e Table of Contents Summary... 3 The Economy: Issues, Trends, and Forecast... 4 Summary of Key Economic Indicators... 29 General Fund and State Education Fund Revenue Forecast... 35 General Fund
W HIGHLIGHTS - EXECUTIVE SUMMARY
 FURNITURE INSIGHTS Smith Leonard PLLC s Industry Newsletter June 2018 W HIGHLIGHTS - EXECUTIVE SUMMARY e had heard at the High Point Market that business seemed to have picked up a bit. We also heard that
Smith Leonard PLLC Kenneth D. Smith, CPA Mark S. Laferriere, CPA
 Smith Leonard PLLC s Industry Newsletter January 2018 HIGHLIGHTS - EXECUTIVE SUMMARY A ccording to our latest survey of residential furniture manufacturers and distributors, new orders in November 2017
THE STATE OF THE ECONOMY
 THE STATE OF THE ECONOMY ANGELA GUO Portland State University The United States economy in the fourth quarter of 2013 appears to have a more robust foothold pointing to a healthier outlook for 2014. Much
Secretary of State Business Filings Q Data Analysis Summary
 C O L O R A D O S E C R E TA R Y O F S TAT E QUARTERLY BUSINESS & ECONOMIC INDICATORS Fourth Quarter 2014 Secretary of State Business Filings Q4 2014 Data Analysis Summary New business filings increase
The Colorado Outlook September 20, Follow the Governor s Office of State Planning and Budgeting on
 source Table of Contents Summary... 3 The Economy: Issues, Trends, and Forecast... 4 Summary of Key Economic Indicators... 17 General Fund and State Education Fund Revenue Forecast... 23 General Fund and
QUARTERLY INDICATORS Southern Nevada Business Confidence Index
 Third Quarter 2018 Economic Outlook: Global, National, and Local U.S. real gross domestic product (GDP) for the first quarter of 2018 expanded at an annualized rate of 2.0 percent, after three consecutive
EMBARGOED UNTIL RELEASE AT 8:30 A.M. EDT, THURSDAY, MAY 27, 2010
 NEWS RELEASE EMBARGOED UNTIL RELEASE AT 8:30 A.M. EDT, THURSDAY, MAY 27, 2010 Lisa Mataloni: (202) 606-5304 (GDP) BEA 10-22 Andrew Hodge: (202) 606-5564 (Profits) Recorded message: (202) 606-5306 GROSS
COMPTROLLER LEMBO REPORTS EARLY INDICATIONS THAT STATE COULD END FISCAL YEAR 2019 IN SURPLUS
 COMPTROLLER LEMBO REPORTS EARLY INDICATIONS THAT STATE COULD END FISCAL YEAR 2019 IN SURPLUS Comptroller Kevin Lembo today said that there are reasons for cautious optimism that the state could end Fiscal
Third Quarter 2015 An independent economic analysis of Arkansas three largest metro areas: Central Arkansas Northwest Arkansas The Fort Smith region
 Third Quarter 2015 An independent economic analysis of Arkansas three largest metro areas: Central Arkansas Northwest Arkansas The Fort Smith region About The Compass The Compass Report is managed by Talk
QUARTERLY INDICATORS Southern Nevada Business Confidence Index
 Second Quarter 2018 Economic Outlook: Global, National, and Local U.S. real gross domestic product (GDP) for the fourth quarter of 2017 expanded at an annualized rate of 2.9 percent, after two consecutive
O HIGHLIGHTS - EXECUTIVE SUMMARY
 FURNITURE INSIGHTS Smith Leonard PLLC s Industry Newsletter February 2018 O HIGHLIGHTS - EXECUTIVE SUMMARY ur latest survey of residential furniture manufacturers and distributors revealed some disappointing
Economic Update. Platts Aluminum Symposium 2014 Ft. Lauderdale, Florida January 13, Chris Oakley Federal Reserve Bank of Atlanta January 2014
 1 Economic Update Platts Aluminum Symposium 2014 Ft. Lauderdale, Florida January 13, 2014 Chris Oakley Federal Reserve Bank of Atlanta January 2014 2 Summary of the Economic Environment 1. Economic growth
Empire State Manufacturing Survey.
 October 217 Empire State Manufacturing Survey Business activity grew at a robust pace in New York State, according to firms responding to the October 217 Empire State Manufacturing Survey. The headline
Colorado Economic Forecast Just the Facts!
 Colorado Economic Forecast 2017 Just the Facts! Larimer County Workforce Development Board February 8, 2017 Gary Horvath 1 If the Recession is Over Where is the Talent? February 2012 Presentation 222,831
INDICATORS NEW ENGLAND ECONOMIC. Final Edition see inside cover FOURTH QUARTER Federal Reserve Bank of Boston
 NEW ENGLAND ECONOMIC INDICATORS FOURTH QUARTER 212 Federal Reserve Bank of Boston Economic Snapshot Labor Market Conditions Income Consumer Prices Merchandise Exports Real Estate Final Edition see inside
QUARTERLY INDICATORS Southern Nevada Business Confidence Index
 Fourth Quarter 2017 Economic Outlook: Global, National, and Local U.S. real gross domestic product (GDP) for the second quarter of 2017 rebounded robustly, increasing at a 3.1 percent annualized rate.
A Closer Look at Gross Domestic Product by MSA. Spartanburg. Charleston. Greenville. South Carolina. Hilton Head Island. Columbia.
 December Summary s economy improved somewhat, according to recent reports. Payroll employment grew substantially and housing market reports were generally positive while household conditions were mostly
National & Colorado. Economic Update. Alison Felix Economist & Branch Executive Federal Reserve Bank of Kansas City Denver Branch
 National & Colorado Economic Update Alison Felix Economist & Branch Executive Federal Reserve Bank of Kansas City Denver Branch The views expressed are those of the presenter and do not necessarily reflect
Economic Growth Expected to Slow and Housing to Stabilize in 2019
 Consumer Confidence Expectations in the Next Six Months (%) Economic Developments December 218 Economic Growth Expected to Slow and Housing to Stabilize in 219 The U.S. economy is expected to grow 2.6
Outlook for the Hawai'i Economy
 Outlook for the Hawai'i Economy May 3, 2001 Dr. Carl Bonham University of Hawai'i Economic Research Organization Summary The Hawaii economy entered 2001 in its best shape in more than a decade. While the
INDICATORS NEW ENGLAND ECONOMIC THIRD QUARTER Federal Reserve Bank of Boston
 NEW ENGLAND ECONOMIC INDICATORS THIRD QUARTER Federal Reserve Bank of Boston Economic Snapshot Labor Market Conditions Income Consumer Prices Merchandise Exports Real Estate Includes data available as
2015 Mid-Year Economic Update
 BROOMFIELD Economic Development 2015 Mid-Year Economic Update Provided by: Broomfield Economic Development One Descombes Drive Broomfield, CO 80020 303-464-5579 www.investbroomfield.com Prepared by: Development
C I T Y O F B O I S E
 C I T Y O F B O I S E D E P A R T M E N T O F F I N A N C E A N D A D M I N I S T R A T I O N Office of Budget Development & Monitoring Economic Brief Mike Sherack, Senior Budget Analyst & Brent Davis,
Economic growth. The economy s need for workers originates in
 Economic growth 40 The economy s need for workers originates in the demand for the goods and services that they provide. So, in order to project employment, BLS starts by estimating the production of final
ECONOMIC PROSPECTS FOR HONG KONG IN Win Lin Chou, ACE Centre for Business and Economic Research, Hong Kong
 ECONOMIC PROSPECTS FOR HONG KONG IN 2015-16 Win Lin Chou, ACE Centre for Business and Economic Research, Hong Kong I. The Current Trends Real gross domestic product (GDP) in Hong Kong increased 2.8 percent
Boost from Fiscal Policy to Fade in 2019
 Real PCE: Motor Vehicles & Parts (SAAR, 29$, Annualized % Change) Regular Grade, Avg Dollars per Gallon Economic Developments May 28 Boost from Fiscal Policy to Fade in 29 First quarter economic growth
ECONOMY AT A GLANCE. n April the value of the Mississippi Leading Index (MLI) rose 0.3 percent as seen
 rose 0.3 percent as seen") JUNE 2018 V OLUME 76, NUMBER 6 Inside this issue: Mississippi Leading Index, April 2018 Mississippi Coincident Index, April 2018 National Trends 5 Mississippi Employment Trends Change in Mississippi Real
JUNE 2018 V OLUME 76, NUMBER 6 Inside this issue: Mississippi Leading Index, April 2018 Mississippi Coincident Index, April 2018 National Trends 5 Mississippi Employment Trends Change in Mississippi Real
GROSS DOMESTIC PRODUCT: THIRD QUARTER 2011 (SECOND ESTIMATE) CORPORATE PROFITS: THIRD QUARTER 2011 (PRELIMINARY)
 CORPORATE PROFITS: THIRD QUARTER 2011 (PRELIMINARY)") NEWS RELEASE EMBARGOED UNTIL RELEASE AT 8:30 A.M. EST, TUESDAY, NOVEMBER 22, 2011 BEA 11-55 Lisa Mataloni: (202) 606-5304 (GDP) gdpniwd@bea.gov Greg Key: (202) 606-5564 (Profits) cpniwd@bea.gov Recorded
NEWS RELEASE EMBARGOED UNTIL RELEASE AT 8:30 A.M. EST, TUESDAY, NOVEMBER 22, 2011 BEA 11-55 Lisa Mataloni: (202) 606-5304 (GDP) gdpniwd@bea.gov Greg Key: (202) 606-5564 (Profits) cpniwd@bea.gov Recorded
MISSISSIPPI S BUSINESS Monitoring the state s economy
 MISSISSIPPI S BUSINESS Monitoring the state s economy A Publication of the University Research Center, Mississippi Institutions of Higher Learning JULY 2015 VOLUME 73, NUMBER 7 ECONOMY AT A GLANCE igure
Gus Faucher Stuart Hoffman William Adams Kurt Rankin Mekael Teshome Chief Economist Senior Economic Advisor Senior Economist Economist Economist
 May 217 Gus Faucher Stuart Hoffman William Adams Kurt Rankin Mekael Teshome Chief Economist Senior Economic Advisor Senior Economist Economist Economist Executive Summary With Job Market in Good Shape,
Economic Update Adrienne C. Slack March 2017
 Economic Update Adrienne C. Slack March 2017 The views expressed are mine, and not necessarily those of the Atlanta Fed or the Federal Reserve System. 2 The Fed s Dual Mandate The Fed is pursuing two objectives
Maintaining Equilibrium. Metro Denver 2017 Economic Forecast January 2017
 Maintaining Equilibrium Metro Denver 2017 Economic Forecast January 2017 Consumer Activity Income Wealth Prices Interest Rates Consumer Confidence Spend or Save? Retail Spending What & Where? Housing Options
Economic Activity Report. October 2016
 Economic Activity Report October 2016 The current economic activity report for Commerce City economy reported mixed trends across many indicators. The employment situation improved, with overall employment
REGIONAL SUMMARIES. Nonfarm employment grew in the second quarter. Non-farm jobs totaled 56,900 in June, up from 55,500 in June 2016.
 Second Quarter 2017 Quarterly narrative An independent economic analysis of four Arkansas metro areas: Central Arkansas Northwest Arkansas The Fort Smith region Jonesboro metro REGIONAL SUMMARIES Fort
Real GDP: Percent change from preceding quarter
 EMBARGOED UNTIL RELEASE AT 8:30 A.M. EDT, WEDNESDAY, AUGUST 30, 2017 BEA 17-42 Technical: Lisa Mataloni (GDP) (301) 278-9083 gdpniwd@bea.gov Kate Pinard (Corporate Profits) (301) 278-9417 cpniwd@bea.gov
Economic Overview Q Quarterly data is as of third quarter 2018
 Economic Overview Q3 2018 1 Quarterly data is as of third quarter 2018 Monthly data as of September 30, 2018 Gross Domestic Product 2 $ in trillions Compounded Annual Percentage Change Economic Overview
Smith Leonard PLLC Kenneth D. Smith, CPA Mark S. Laferriere, CPA
 FURNITURE INSIGHTS Smith Leonard PLLC s Industry Newsletter April 2018 HIGHLIGHTS - EXECUTIVE SUMMARY N ew orders in February 2018 were 5% higher than orders in February 2017, according to our latest survey
Baseline U.S. Economic Outlook, Summary Table*
 October 2014 Solid U.S. Economic Data Belie Market Turmoil Executive Summary September payroll job growth was above consensus with 248,000 jobs added over the month. September private-sector employment
EMBARGOED UNTIL RELEASE AT 8:30 A.M. EST, THURSDAY, MARCH 30, 2006
 NEWS RELEASE EMBARGOED UNTIL RELEASE AT 8:30 A.M. EST, THURSDAY, MARCH 30, 2006 Virginia H. Mannering: (202) 606-5304 (GDP) BEA 06-11 Greg Key: (202) 606-9727 (Profits) Recorded message: (202) 606-5306
Empire State Manufacturing Survey
 November 217 Empire State Manufacturing Survey Business activity continued to grow strongly in New York State, according to firms responding to the November 217 Empire State Manufacturing Survey. Though
U.S. Equipment & Software Investment Momentum Monitor
 U.S. Equipment & Software Investment Momentum Monitor June 2018 CONTACT INFORMATION: Kelli Nienaber, Executive Director Equipment Leasing & Finance Foundation knienaber@elfaonline.org www.leasefoundation.org
ECONOMIC PROSPECTS FOR HONG KONG IN Win Lin Chou, ACE Centre for Business and Economic Research, Hong Kong
 ECONOMIC PROSPECTS FOR HONG KONG IN 2014-15 Win Lin Chou, ACE Centre for Business and Economic Research, Hong Kong I. The Current Trends Real gross domestic product (GDP) in Hong Kong slowed to 1.8 percent
Empire State Manufacturing Survey.
 March 218 Empire State Manufacturing Survey Business activity grew robustly in New York State, according to firms responding to the March 218 Empire State Manufacturing Survey. The headline general business
Northwest Minnesota Economic and Business Conditions Report - Fourth Quarter 2014
 St. Cloud State University therepository at St. Cloud State Northwest Minnesota Economic and Business Conditions Report Minnesota Regional Economic and Business Conditions Report 6-2015 Northwest Minnesota
Current Economic Conditions in the Eighth Federal Reserve District. Little Rock Zone
 Current Economic Conditions in the Eighth Federal Reserve District Little Rock Zone December 21, 2012 Prepared by the Research Division of the Federal Reserve Bank of St. Louis Eighth Federal Reserve District
ECONOMIC AND FINANCIAL HIGHLIGHTS
 ECONOMIC AND FINANCIAL HIGHLIGHTS FEDERAL RESERVE BALANCE SHEET Assets and Liabilities 2-3 REAL ESTATE Construction Spending 4 CoreLogic Home Price Index 5 Mortgage Rates and Applications 6-7 CONSUMER
VECTRA BANK 23 RD ANNUAL ECONOMIC FORECAST BREAKFAST START SMART IN 2016! Member FDIC VectraBank.com
 VECTRA BANK 23 RD ANNUAL ECONOMIC FORECAST BREAKFAST START SMART IN 2016! Member FDIC VectraBank.com Colorado s Economy and State Budget Office of State Planning and Budgeting April 26, 2016 Jason Schrock,
Smith Leonard PLLC Kenneth D. Smith, CPA Mark S. Laferriere, CPA
 FURNITURE INSIGHTS Smith Leonard PLLC s Industry Newsletter May 2018 HIGHLIGHTS - EXECUTIVE SUMMARY A fter hearing about how sluggish business was in the first quarter, our survey of residential furniture
Will the Real Private Nonfarm Payrolls Please Stand Up?
 Northern Trust Global Economic Research 50 South LaSalle Chicago, Illinois 603 northerntrust.com Paul Kasriel plk1@ntrs.com Will the Real Private Nonfarm Payrolls Please Stand Up? May 31, 20 Each month
Lecture 4: Real GDP, the First of the Big 3 Economic Activity Variables
 Lecture 4: Real GDP, the First of the Big 3 Economic Activity Variables Economists focus on the outlook for material progress. To generate an opinion about overall economic activity, economists perform
Empire State Manufacturing Survey
 November 218 218 Business activity continued to grow at a solid clip in New York State, according to firms responding to the November 218. The headline general business conditions index edged up two points
Charting a New (Economy) Course
 Course") Charting a New (Economy) Course Metro Denver 2009 Economic Forecast January 2009 Colorado Outperforms the U.S. 2009 forecast values Colorado United States Job losses less severe -0.4% -1.1% Unemployment
Charting a New (Economy) Course Metro Denver 2009 Economic Forecast January 2009 Colorado Outperforms the U.S. 2009 forecast values Colorado United States Job losses less severe -0.4% -1.1% Unemployment
First Quarter 2016 Quarterly narrative REGIONAL SUMMARIES Fort Smith region Northwest Arkansas Central Arkansas Jonesboro
 First Quarter 2016 Quarterly narrative An independent economic analysis of four Arkansas metro areas: Central Arkansas Northwest Arkansas The Fort Smith region Jonesboro metro REGIONAL SUMMARIES Fort Smith
A MONTHLY UPDATE OF THE FIFTH DISTRICT ECONOMY FEDERAL RESERVE BANK OF RICHMOND. A Closer Look at Gross Domestic Product by MSA
 December Summary Economic reports on s economy were slightly positive in recent months. Despite a slight decline in payroll employment, the unemployment rate edged lower and housing market reports were
ECONOMY AT A GLANCE. Figure 1. Leading indices. 10/1711/1712/17 1/18 2/18 3/18 4/18 5/18 6/18 7/18 8/18 9/18 10/18 Mississippi
 DECEMBER 2018 V OLUME 76, NUMBER 12 Inside this issue: Mississippi Leading Index, October 2018 Mississippi Coincident Index, October 2018 National Trends 5 Mississippi Employment Trends Changes in County
The Election Economy. November 29, City of Georgetown
 The Election Economy November 29, 2016 City of Georgetown More Growth Coming Why are people moving here? Citizens Quality of Life Planning for Growth 100% Renewable Energy by 2018 Transportation Investments
file:///c:/users/cathy/appdata/local/microsoft/windows/temporary Int...
 1 of 5 9/25/17, 8:57 AM A Publication of the National Association of Manufacturers September 25, 2017 As expected, the Federal Reserve opted to not raise short-term interest rates at its September 19 20
The Outlook for the U.S. Economy March Summary View. The Current State of the Economy
 The Outlook for the U.S. Economy March 2010 Summary View The Current State of the Economy 8% 6% Quarterly Change (SAAR) Chart 1. The Economic Outlook History Forecast The December 2007-2009 recession is
Nevada Economy More Firmly in Recovery than Previously Realized
 A monthly report produced for Commerce Real Estate Solutions by Stephen P. A. Brown, PhD, Center for Business & Economic Research University of Nevada, Las Vegas Issue 14 February 2012 Nevada Economy More
LIA Monthly Economic Report
 This publication is made possible through the support of:. LIA Monthly Economic Report A Research Report for Directors and Members of the Long Island Association, Inc. November 2018, 2018 Prepared by Dr.
EMBARGOED UNTIL RELEASE AT 8:30 A.M. EST, TUESDAY, NOVEMBER 25, 2003
 EMBARGOED UNTIL RELEASE AT 8:30 A.M. EST, TUESDAY, NOVEMBER 25, 2003 Virginia H. Mannering: (202) 606-5304 (GDP) BEA 03-45 Kenneth A. Petrick: (202) 606-9738 (Profits) Recorded message: (202) 606-5306
Arvest Consumer Sentiment Survey April 2016
 Arvest Consumer Sentiment Survey April Produced for Arvest Bank by a multi-university collaboration including: Center for Business and Economic Research Sam M. Walton College of Business University of
Empire State Manufacturing Survey
 December 16 Empire State Manufacturing Survey Business activity grew modestly in New York State, according to firms responding to the December 16 Empire State Manufacturing Survey. The headline general
THE PURCHASING ECONOMY SURVEY REPORT
 Welcome to our July Newsletter covering June survey results. Creighton s monthly survey of supply managers and procurement experts in nine Mid-America states indicates that economic growth remains in a
Robert D. Cruz, PhD, Chief Economist
 Robert D. Cruz, PhD, Chief Economist Office of Economic Development and International Trade Miami-Dade County cruzr1@miamidade.gov / www.miamidade.gov/oedit Office of Economic Development and International
1st Quarter Weekly Unemployment Claims -11% Total Home Permits* +44% Total Nonfarm Employment* +3% Mortgage Tax Collections +17%
 HOUSING T E N N E S S E E 1st Quarter 2016 Tennessee dashboard 1st quarter 2016 (percent change over the year) Weekly Unemployment Claims -11% Total Home Permits* +44% Total Nonfarm Employment* +3% Mortgage
Current Economic Conditions in the Eighth Federal Reserve District. Memphis Zone
 Current Economic Conditions in the Eighth Federal Reserve District Memphis Zone December 21, 2012 Prepared by the Research Division of the Federal Reserve Bank of St. Louis Eighth Federal Reserve District
334 Appendix B. Fixed investment. Gross domestic product (percent change) Change in private inventories. Year or quarter. Nonresidential Residential
 Change in private inventories. Year or quarter. Nonresidential Residential") 2010 Table B 5. Contributions to percent change in real gross domestic product, 1960 2009 Personal consumption expenditures Gross private domestic investment Gross domestic product (percent change) Goods
2010 Table B 5. Contributions to percent change in real gross domestic product, 1960 2009 Personal consumption expenditures Gross private domestic investment Gross domestic product (percent change) Goods
SUBJECT: PRELIMINARY NOVEMBER 2011 ECONOMIC FORECAST
 October 26, 2011 STATE OF WASHINGTON ECONOMIC AND REVENUE FORECAST COUNCIL - 34-1560 TO: FROM: Governor s Council of Economic Advisors Arun Raha, Executive Director Economic and Revenue Forecast Council
THE STATE OF THE ECONOMY
 THE STATE OF THE ECONOMY CARLY HARRISON Portland State University The economy continues to grow at a steady rate, with slight increases in global and national GDP, a lower national unemployment rate, and
Smith Leonard PLLC Kenneth D. Smith, CPA Mark S. Laferriere, CPA
 FURNITURE INSIGHTS Smith Leonard PLLC s Industry Newsletter October 2018 HIGHLIGHTS - EXECUTIVE SUMMARY A ccording to our latest survey of residential furniture manufacturers and distributors, new orders
2016 End of Year Economic Update
 BROOMFIELD Economic Development End of Year Economic Update RELEASED: MARCH 2017 Provided by: Broomfield Economic Development One Descombes Drive Broomfield, CO 80020 303-464-5579 www.investbroomfield.com
The Arkansas Economic Outlook
 The Arkansas Economic Outlook Dr. Michael Pakko Chief Economist and State Economic Forecaster Arkansas Economic Development Institute, UALR December 1, 2017 Overview Review of Economic Conditions: Output
Real GDP: Percent change from preceding quarter
 EMBARGOED UNTIL RELEASE AT 8:30 A.M. EDT, THURSDAY, MARCH 28, 2019 BEA 19-12 Technical: David Sullivan (301) 278-9083 gdpniwd@bea.gov Kate Pinard (Corporate Profits) (301) 278-9417 cpniwd@bea.gov Media: