AD HOC FINANCIAL STABILITY COMMITTEE WORKSHOP AGENDA
|
|
|
- Abraham Higgins
- 5 years ago
- Views:
Transcription
1 AD HOC FINANCIAL STABILITY COMMITTEE Friday, June 8, :00 PM VTA Auditorium 3331 North First Street San Jose, CA WORKSHOP AGENDA CALL TO ORDER 1. ROLL CALL 2. Introductions 3. Orders of the Day 4. PUBLIC PRESENTATIONS This portion of the agenda is reserved for persons desiring to address the Committee on any matter not on the agenda. Speakers are limited to 2 minutes. The law does not permit Committee action or extended discussion on any item not on the agenda except under special circumstances. If Committee action is requested, the matter can be placed on a subsequent agenda. All statements that require a response will be referred to staff for reply in writing. 5. Discuss potential strategies and solutions to address VTA s budget/structural deficit. (Breakout Session) 6. ANNOUNCEMENTS 7. ADJOURN In accordance with the Americans with Disabilities Act (ADA) and Title VI of the Civil Rights Act of 1964, VTA will make reasonable arrangements to ensure meaningful access to its meetings for persons who have disabilities and for persons with limited English proficiency who need translation and interpretation services. Individuals requiring ADA accommodations should notify the Board Secretary s Office at least 48-hours prior to the meeting. Individuals requiring language assistance should notify the Board Secretary s Office at least 72-hours prior to the meeting. The Board Secretary may be contacted at (408) or board.secretary@vta.org or (408) (TTY only). VTA s home page is on the web at: or visit us on Facebook at: (408) : 中文 / Español / 日本語 / 한국어 / tiếng Việt / Tagalog.
2 Santa Clara Valley Transportation Authority Ad Hoc Financial Stability Committee May 11, 2018 All reports for items on the open meeting agenda are available for review in the Board Secretary s Office, 3331 North First Street, San Jose, California, (408) , at least 72 hours prior to the meeting. This information is available on VTA s website at and also at the meeting. Page 2
3 Agenda Item #5 Structural Deficit Mitigation Ad Hoc Financial Sustainability Committee-Workshop June 8, 2018
4 Structural Deficit Solution Requires a combination of: Reduction of expenses and/or increase in revenues Aligning of growth rates of revenues and expenses 2
5 Today s Goal Identify mitigation measures that have a short-term implementation schedule with both a short and long-term impact 3
6 Short-Term Defined Measures that can begin implementation within one year, with full impact achieved within three years 4
7 Millions VTA Transit Budget Forecast, FY18-FY22 $600 $550 Total $50M Total $56M Total $51M Total $53M $30M Total $56M $500 $450 $30M $20M $30M $26M $30M $31M $30M $23M $26M $400 $455 $475 $467 $493 $479 $509 $514 $491 $504 $531 $350 $300 FY18 Adopted FY19 Adopted FY20 Projected FY21 Projected FY22 Projected Revenues Expenses $30M annual local share of capital need 5

8 Target $50-$60 million per year at full impact 6
9 MEMORANDUM TO: FROM: Santa Clara Valley Transportation Authority Ad Hoc Financial Stability Committee Chief Financial Officer, Raj Srinath DATE: June 5, 2018 SUBJECT: Information Follow-up FOR INFORMATION ONLY During the May 11, 2018 Ad Hoc Financial Stability Committee meeting, the committee members and stakeholders requested various information. The attached matrix and attachments address these requests. Since several of the requests related to information provided in the Public Financial Management (PFM) May 11 th presentation, it is included for reference (Attachment B). There is also one follow-up item from the April 13, 2018 meeting still outstanding. In response to the Next Network Plan and Related Efforts presentation, it was suggested that the system redesign maps presented should better illustrate transit connections. An updated map showing the main connection points is included as Attachment J. Prepared By: Carol Lawson, Fiscal Resources Manager, Budget
10 Ad Hoc Financial Stability Committee Information Follow-up from 5/11/18 Meeting Attachment A Question/Comment 1 Requested similar cost comparison information for additional agencies (SamTrans, Muni, AC Transit, BART, Orange County) (5/11/18 PFM presentation slides #8-18) 2 Requested a breakout of Cost per Unlinked Passenger Trips by function for "Cost Efficiency Measure Comparison-Unlinked Passenger Trip (UPT)" (5/11/18 PFM presentation slide #16) 3 Requested a breakout by cost in addition to percentage of Operating Expenses by Function and by Type for "Cost Comparisons-Expenses Type" (5/11/18 PFM presentation slide #18) 4 Requested additional information on what is included in the Local Funds, Taxes and Fees Levied by Transit Agency, and Other Directly Generated Funds categories for "Revenue Comparisons-By Type of Revenue" (5/11/18 PFM presentation slide #11) See Attachment C See Attachment C (slides #7 & #8) See Attachment C (slides #11 & #13) Response "Local Funds" includes financial assistance from local governments that support the operation of the transit system including tax levies, general funds, specific contributions, donations, and other. 5 Requested cost of living data for Peer Agencies See Attachment D 6 Would like to know what year the Peers implemented their various strategies on 5/11/18 See Attachment E PFM presentation "What Other Agencies Have Done" slides (#25-30) 7 Requested the baseline deficit be added to "Budget Balancing Options" slides for easier See Attachment F comparison of impact (5/11/18 PFM presentation slides #33-44) 8 Requested annotation of assumptions used be added to "Budget Balancing Options" slides See Attachment F (5/11/18 PFM presentation slides #33-44) 9 Requested an Option slide with SB 1 funding included See Attachment G 10 Requested an Option slide with 2016 Measure B funding excluded See Attachment H "Taxes and Fees Levies by Transit Agency" includes revenues from taxes and fees imposed on the public by a transit agency that has its own taxing authority. "Other Directly Generated Funds" includes advertising revenues, donations, investment earnings, parking revenues, sale proceeds, etc. Note that the Sources of Revenue chart on slide #11 (on left side of page) in the 5/11/18 PFM presentation inadvertently excluded Passenger Revenues. The updated chart in Attachment C (slide #3) reports Passenger Revenues as part of "Directly Generated Funds". Slide #4 in Attachment C provides a further breakdown of "Directly Generated Funds". Page 1 of 2
11 Ad Hoc Financial Stability Committee Information Follow-up from 5/11/18 Meeting Attachment A Question/Comment 11 Requested a summary slide that shows key assumptions used for the "Budget Balancing Options" slides (5/11/18 PFM presentation slides #33-44) 12 What is the financial impact of a 80/20 split in health benefits (at the individual level) on "Workforce-Share Pension Costs" (5/11/18 PFM presentation slide #35) 13 Absenteeism presentation - pointed out need for further study on fluctuations related to absenteeism due to training and employee living situation See Attachment I Response Based on 2018 Kaiser Permanente HMO rates, a 20% share would be $156 per month for single coverage, $312 per month for employee + 1 coverage and $406 per month for employee + 2 or more coverage. A more in-depth analysis will be conducted to help identify root causes of absenteeism fluctuations in some areas. This effort is anticipated to begin in the next few months. 14 Requested information regarding what operating costs are covered by 2008 Measure B Distribution of operating costs to 2000 Measure B is dependent on outcome of Operations and Maintenance Agreement negotiations with BART which are still in progress. 15 Requested VTA Budget Book/link to VTA website, as well as links to 5 other Agencies' Links provided under separate cover. budgets 16 Are there any other sources of revenue that we can or should be considering? Staff has explored the feasibility of various additional revenue sources in the past and will continue to explore options. 17 Requested information on how AC Transit was able to get funds from a property/parcel tax General Counsel staff is researching this issue. 18 Requested evaluation of real estate transfer tax - legal/feasible? General Counsel staff is researching this issue. 19 Requested information on number of passes going to VTA from the Downtown Palo Alto Transportation Management Agency's pilot program to reduce congestion. The program purchases an average of 14 VTA Adult Monthly Passes per month using Clipper Direct. Page 2 of 2
12 Attachment B Santa Clara Valley Transportation Authority Independent Consultant s Review and Analysis Ad Hoc Financial Stability Committee Presented By: Russ Branson, Director May 11, 2018 PFM Group Consulting LLC 50 California Street Suite 2300 San Francisco, CA (415) pfm.com PFM 1 PFM Charge from Ad Hoc Committee The scope of work approved by the Ad Hoc Committee included the following elements: 1. Review VTA s budgeted and forecasted revenues and expenses 2. Review service delivery business models and financial structure in other similarly positioned transit agencies 3. Review revenue sources for ability to enhance or identify other sources of revenue 4. Review cost structure of providing service 5. Respond to other Ad Hoc Committee requests 6. Provide recommendations to close the structural deficit PFM 2 1
13 Attachment B Presentation Outline Peer Agency Comparisons Revenues Expenses VTA Budget Forecast Model How Other Agencies Have Addressed Budget Deficits Options to Address Structural Budget Deficit PFM 3 Peer Agency Comparisons PFM 4 2
14 Attachment B Industry Overview National Trends In comparison to 2006, there has been an increase in public transit service operations, costs, and consumption. Increase in service operated transit agencies have increased the amount of time its vehicles are in operation, as measured by Vehicle Revenue Hours (VRH) Increase in service costs total Operating Expenses have risen sharply in the past decade, going from $29 billion in 2006 to $45.1 billion in Source: Federal Transit Authority National Transit Database (NTD), Service Data Time Series PFM 5 Industry Overview National Trends In comparison to 2006, there has been an increase in public transit service operations, costs, and consumption. Increase in service consumed Unlinked passenger trips (UPT), a metric for transit ridership, on public transit passengers has steadily been flat for several years and took a dip in FY16 Additionally, the distance traveled by public transit passengers is also increasing, Passenger Miles Traveled (PMT) PFM Source: Federal Transit Authority National Transit Database (NTD), Service Data Time Series 6 3
15 Attachment B Trends in Trips for VTA Santa Clara VTA riders are taking fewer, but longer trips, with a dip in FY17 along with ridership The Average Trip Length is a service efficiency measure of the number of miles traveled per passenger trip. Graphs show annual totals for both transit bus, light rail, and ACE shuttle services--paratransit not included 50,000 40,000 30,000 20,000 10,000 VTA - Total # of Passenger Trips (UPT) 46,600 44,221 45,103 43,434 42,492 34,778 32,746 33,041 32,130 31,652 10,278 10,754 10,015 10,742 11,341 39,138 29,464 9, VTA - Average Trip Length, all modes (PMT per UPT) FY07 FY08 FY09 FY10 FY11 FY12 FY13 FY14 FY15 FY16 FY FY07 FY08 FY09 FY10 FY11 FY12 FY13 FY14 FY15 FY16 FY17 Bus, in thousands Light Rail, in thousands All Modes Average Trip Length, in miles Source: Federal Transit Authority National Transit Database (NTD), Service Data Time Series PFM 7 Peer Agencies VTA services the fourth largest population area among peer agencies 2016 Service Area Statistics LACMTA Agency Los Angeles County Metropolitan Transportation Authority Modes of Transportation (Directly Operated and Purchased Transit) Bus, Bus Rapid Transit, Light Rail, Heavy Rail, Vanpool Population Square Mileage 8,626,817 1,513 CTA Chicago Transit Authority Bus, Heavy Rail 3,272, KCDOT VTA UTA TriMet King County Department of Transportation Santa Clara Valley Transportation Authority Utah Transit Authority Tri-County Metropolitan Transportation, Oregon Bus, Trolleybus, Street Car Rail, Demand Response, Demand Response - Taxi, Ferryboat, Vanpool 2,117,125 2,134 Bus, Light Rail, Demand Response 1,927, Bus, Commuter Bus, Light Rail, Commuter Rail, Demand Response, Vanpool Bus, Light Rail, Hybrid Rail, Demand Response, Demand Response - Taxi 1,883, ,560, Sacramento Regional Transit Sacramento RT District Bus, Light Rail, Demand Response 1,031, Source: Federal Transit Authority National Transit Database (NTD), 2016 Annual Database Agency Information PFM 8 4
16 Attachment B Revenues PFM 9 VTA Transit Revenue Profile VTA revenues are dominated by sales-taxbased revenues collected across a number of different sales tax measures (some are only a portion of total sales taxes collected). This reliance on tax puts the VTA at revenue risk in the event of a recession STA 2% FY18 Budgeted Transit Revenues by Type Federal & State Grants 1% Fares 8% Other Revenue 6% Increases to taxes require a 2/3 rd vote of the electorate for approval of a special tax. It is highly unlikely for additional sales taxes to be approved to support VTA operations Sales Tax Based 83% Source: VTA budget Note: Sales taxes include TDA funds which are part of the base Statewide sales tax rate PFM 10 5

, 2016 Metrics; 2016 Transit Agency 11 Revenue Comparisons Farebox")

17 Attachment B Revenue Comparisons By Type of Revenue Sources of Operating Revenues Federal, State, Local, Directly Generated Funds Directly generated funds are any funds generated by, donated to or earned by the transit agency. Listed as Passenger Fares, Transit Agency Funds, Other Earnings, and Government Funds On average, passenger fare revenue accounts for less than 20% of operating revenues nationally. Note: TDA funds categorized as State Funds for NTD purposes PFM Source: Federal Transit Authority National Transit Database (NTD), 2016 Metrics; 2016 Transit Agency 11 Revenue Comparisons Farebox Recovery Ratios The farebox recovery ratio is the proportion of fare revenues to operating costs Farebox recovery has been on the decline nationally; VTA has consistently had the lowest farebox recovery ratio among comparative agencies FY FY2017 Farebox Recovery Ratio Agency FY13 FY14 FY15 FY16 FY17* CTA 45.2% 44.2% 43.4% 41.7% N/A TriMet 30.2% 30.3% 31.5% 29.5% N/A LACMTA 26.9% 26.1% 26.2% 22.6% N/A Sacramento RT 24.6% 21.8% 21.8% 21.0% N/A UTA 24.1% 21.9% 22.2% 18.8% N/A VTA 13.0% 12.4% 12.4% 11.2% 9.5% RANK 6 of 6 6 of 6 6 of 6 6 of 6 N/A *FY17 data available for VTA only PFM Source: Federal Transit Authority National Transit Database (NTD), Service Data Time Series; Agency Budget Documents 12 6
18 Attachment B VTA Farebox Recovery Experience Compared to VTA Expense Experience While fare revenues have been declining, expenses have continued to climb FY13 - FY17 Farebox Revenues FY13 - FY17 Transit Expenses Millions $40 $39 $38 $37 $38.3 $38.4 $39.1 $37.7 Millions $440 $420 $400 $386.1 $398.4 $426.1 $36 $35 $34 $33 $34.8 $380 $360 $340 $356.4 $371.1 $32 FY 2013 FY 2014 FY 2015 FY 2016 FY 2017 $320 FY 2013 FY 2014 FY 2015 FY 2016 FY 2017 Actual Actual Actual Actual Actual Actual Actual Actual Actual Actual Source: VTA Historical Data PFM 13 Expenses PFM 14 7
19 Attachment B VTA Transit Budgeted Expense Profile FY18 Transit Budgeted Expenses by Type VTA budgeted expenses are dominated by wages and benefits at 62% of FY2018 transit expenditures Debt Service 4.5% Other Transit 8.9% Transfers 1.1% Benefit costs are dominated by: Pensions ATU and CalPERS programs Health insurance provided at full cost for Kaiser plans or lower Non-Labor 23.8% Wages 36.2% Benefits 25.5% Source: VTA budget PFM 15 Cost Efficiency Measure Comparison Unlinked Passenger Trip (UPT) The cost per Unlinked Passenger Trip (UPT) is a measure of the cost efficiency of transit services For both bus and light rail service, VTA has the highest costs per UPT over 200% over many lowcost comparisons Source: Federal Transit Authority National Transit Database (NTD), 2016 Metrics PFM 16 8


, 2016 Metrics 17 Cost Comparisons Expenses Type")


, 2016 Operating Expenses 18 9")
20 Attachment B Cost Efficiency Measure Comparison Cost Per Service Hour VTA spends more per hour on Vehicle Operations and Vehicle Maintenance than peer agencies for buses Light Rail operations are high, but in the middle of comparison agencies VTA s FY17 cost per service hour for light rail was $707 PFM Source: Federal Transit Authority National Transit Database (NTD), 2016 Metrics 17 Cost Comparisons Expenses Type Expenses for most comparative transit agencies follow similar patterns with Salaries and Benefits the dominant cost of service When categorized by function, Vehicle Operations represent more than 50% of most agency operating expenses. PFM Source: Federal Transit Authority National Transit Database (NTD), 2016 Operating Expenses 18 9
 by FY22 PFM 20 10")
21 Attachment B VTA Budget and Forecast Model PFM 19 VTA Budget Forecast The VTA staff budget forecast for the FY18-FY22 time period shows significant annual deficits barring corrective action The resulting negative operating reserves of ($26M) by FY22 PFM 20 10
22 Attachment B Independent Baseline 10-Year Budget Forecast Baseline forecast with assuming no corrective action taken by VTA Board Millions $0 ($10) FY18 - FY28 Baseline Forecast FY Net Surplus/(Deficit) Assuming No Corrective Action ($20) ($30) ($20.5) ($26.4) ($29.5) ($22.9) ($27.7) ($32.4) ($40) ($37.0) ($50) FY18 Ending Reserves: $81.2 million FY28 Ending Reserves: ($267.1) million ($41.8) ($46.8) ($45.5) ($51.1) ($60) FY2018 FY2019 FY2020 FY2021 FY2022 FY2023 FY2024 FY2025 FY2026 FY2027 FY2028 NOTE: Does not reflect $30M annual local share of capital need. Adding in this capital payment would increase the deficit by $330M to ($597.1) million by FY28 PFM 21 Business Cycle Current Expansion Phase The current expansion phases of the business cycle began nine years ago, after the recession bottomed out in June 2009 Current expansion 107 months and counting as of May 2018 Average expansion phase (11 cycles): 58.4 months Range: 12 to 120 months When will next downturn start? PFM 22 11
23 Attachment B Recessions Impact 1976 VTA Sales Tax The 1976 Half-Cent Sales Tax is VTA s largest source of revenue at 47% of total budgeted revenues in FY2018. Recessions impacts on sales taxes are increasing Annual % Change in VTA 1976 Sales Tax Collections, FY FY2017* 25% 20% 15% 10% 5% 0% (5%) '79 '81 '83 '85 '87 '89 '91 '93 '95 '97 '99 '01 '03 '05 '07 '09 '11 '13 '15 '17 (10%) (15%) (20%) (25%) *Shaded areas indicate periods of recession PFM 23 How Other Agencies Have Addressed Budget Deficits PFM 24 12
24 Attachment B What Other Agencies Have Done TriMet Portland, OR Defined benefit to defined contribution pension No retiree health No free downtown routes New income tax PFM 25 What Other Agencies Have Done Los Angeles Metro Increased fares/changed fare collection Wage freezes, changes to health and retirement programs New transportation/mobility business model PFM 26 13

25 Attachment B What Other Agencies Have Done Sacramento Regional Transit Eliminated positions/reduced annual salary adjustment New business model Introduced SmaRT Ride-on-demand micro transit/100% accessible/similar to Uber Pool PFM 27 What Other Agencies Have Done Chicago Transit Authority Increased fares 25% Controlled electrical costs Increased advertising and concession revenues Cracked down on absenteeism PFM 28 14
26 Attachment B What Other Agencies Have Done King County Metro Seattle, WA New service model Seattle voters approved a sales tax increase and a vehicle license fee to raise an additional $45 million annually in 2014 Last year voters approved another $54 billion expansion of public transit systems by raising the sales tax another 0.5 percent and increasing the vehicle license fee again PFM 29 Innovative Programs First/Last Mile & Mobility King County Metro Pilot program offering riders (via an app) within a two-mile radius of four park-and-ride lots to be picked-up on demand on a shared-ride basis to connect quickly to transit DART (Dallas) Partnership with Uber to provide access to Uber for first mile/last mile via the system s GoPass app MARTA (Atlanta) Partnered with Uber when the I-85 bridge collapsed. Uber helped address issues with lack of parking as commuters switched to transit. This partnership is continuing, with Uber targeting major transit centers for first mile/last mile trips Bishop Ranch (San Ramon) First autonomous shuttle licensed by California to shuttle BART riders from nearby neighborhood to BART station. Many small shuttles offering quicker transit to BART LA Metro Bike Share program in downtown LA and key tourist areas connecting bus and light rail destinations with first mile/last mile accessibility Sacramento RT Microbus, on-demand transit accessed through an app on a customers smartphone. Can choose pick up time, schedule for different day. Can purchase a daily pass PFM 30 15
27 Attachment B Options to Address Structural Budget Deficit PFM 31 Budget Balancing Options Three Categories Workforce Control wage inflation Share benefit costs of health insurance and pension Outsource service, where feasible Services Right-size service levels limit/defer Next Network implementation Rationalized fleet type Fleet electrification Revenue Indexed fare Increases Additional Sales-Based Taxes or other taxes PFM 32 16
28 Attachment B Workforce Control Wage Inflation Reducing wage and non-medical benefits inflation Advantages: 1) able to offer better transit service by keeping cost inflation down, 2) matching wage increases to ability-to-pay protects jobs Downsides: 1) risk not keeping up with labor market and creating retention and recruitment issues; 2) may create issues with labor union in contract negotiations VTA Budget Forecast Net Operating Revenue Millions $0 ($5) ($3.2) ($1.7) ($10) ($15) ($14.7) ($14.7) ($14.4) ($13.8) ($13.1) ($11.5) ($20) ($25) ($30) ($20.5) ($26.4) ($25.5) FY18 Ending Reserves: $81.2 million FY28 Ending Reserves: ($57.8 million) FY2018 FY2019 FY2020 FY2021 FY2022 FY2023 FY2024 FY2025 FY2026 FY2027 FY2028 FY Net Surplus/(Deficit) PFM 33 Millions Workforce Share Health Insurance Costs Negotiate cost sharing on health insurance premiums Advantages: 1) health costs are pre-tax; therefore have a lesser impact on employees than other cost-sharing or wage impacts, 2) sharing health premiums helps limit growth in VTA s insurance costs Downsides: 1) Any changes to health care must be negotiated with labor unions, 2) cost-sharing could cause some employees to opt for lower-cost, non-family benefits $0 ($5) ($10) VTA Budget Forecast Net Operating Revenue ($15) ($20) ($25) ($30) ($35) ($40) ($20.5) ($26.4) ($29.5) ($22.9) ($18.7) ($22.7) ($26.7) FY18 Ending Reserves: $81.2 million FY28 Ending Reserves: ($197.3 million) ($30.7) ($34.2) ($31.2) ($35.2) FY2018 FY2019 FY2020 FY2021 FY2022 FY2023 FY2024 FY2025 FY2026 FY2027 FY2028 FY Net Surplus/(Deficit) PFM 34 17
29 Attachment B Workforce Share Pension Costs Create across-the-board parity with employee contribution to pension costs Advantages: 1) equal participation in pension funding, 2) provides value to employees by strengthening total pension funding Downsides: 1) Any changes to pension contributions must be negotiated with labor unions Millions $0 ($5) VTA Budget Forecast Net Operating Revenue ($10) ($15) ($20) ($25) ($30) ($35) ($40) ($45) ($20.5) ($26.4) ($28.2) ($19.7) ($22.1) ($26.3) FY18 Ending Reserves: $81.2 million FY28 Ending Reserves: ($221.2 million) ($30.5) ($34.8) ($38.5) ($35.8) ($40.1) FY2018 FY2019 FY2020 FY2021 FY2022 FY2023 FY2024 FY2025 FY2026 FY2027 FY2028 FY Net Surplus/(Deficit) PFM 35 Workforce Outsource Services, Where Feasible Increasing the amount of transit contracted out, could result in significant savings Advantages: 1) lower cost, 2) easier to flex services based on ridership demand, 3) can put cost of training, capital, and innovation on contractor Downsides: 1) Less control over staffing, 2) can create culture issues between VTA and contractor staff, 3) can cause issues with labor unions with loss (expected to be by attrition) of regular employees VTA Budget Forecast Net Operating Revenue $0 Millions ($5) ($10) ($15) ($20) ($25) ($30) ($35) ($40) ($45) ($20.5) ($26.4) ($25.6) ($18.9) ($23.2) ($27.5) FY18 Ending Reserves: $81.2 million FY28 Ending Reserves: ($226.6 million) ($31.7) ($36.0) ($39.8) ($37.1) ($41.5) FY2018 FY2019 FY2020 FY2021 FY2022 FY2023 FY2024 FY2025 FY2026 FY2027 FY2028 FY Net Surplus/(Deficit) PFM 36 18
30 Attachment B Services Rationalized Fleet Sizing and Electrification Rationalized fleet sizing could include use of smaller vehicles* on routes that don t demand fullsize buses or use of a micro-transit fleet (passenger vans or smaller vehicles) Savings: Requires additional study Advantages: 1) lower, or no, up-front capital cost, 2) lower replacement cost, 3) lower maintenance costs, 4) better fuel mileage, 5) could operate with Class C license with appropriate reduction in pay Downsides: 1) If purchased, adding vehicles to fleet increases complexity of parts and maintenance demands, 2) proper match of vehicle to route could vary by time-of-day and day-ofweek, 3) multiple license requirements increases complexity/flexibility in managing workforce Fleet Electrification of buses Savings: Requires additional study Advantages: 1) Cost of electricity per mile less than fossil fuel, 2) cost of batteries going down, while life of batteries going up, 3) fewer parts, less maintenance for fully-electric vehicles Downsides: 1) requires change-out of fueling facilities, 2) limited current performance in long-term, heavy commercial use, 3) not yet an industry standard, 4) larger up-front capital costs in the current market PFM * Note smaller vehicles would need to be fully accessible to meet needs of transit dependent 37 Services Right-Size Service Levels Implementation of the Next Network is included in the Current VTA budget. These service improvement are meant to: 1) increase the frequency of service on an expanded transit network, 2) connect with the coming BART extension, and 3) provide more service in underserved and vulnerable communities No or Limited Implementation -- Two alternatives are addressed on the following slide showing: 1) Full pull-back of Next Network improvements, and 2) partial implementation of Next Network Savings: 1) $19 million -- $23 million cost less $4 million in expected fare increases from expanded services, and 2) $9.5 million -- $11.5 million cost less $2 million in expected fare increases Advantages: 1) reduces cost to balance budget and keep the VTA in a strong financial position, 2) reduces the need for other cost-savings measures Downsides: 1) does not address service needs to coming BART ridership, 2) likely to keep VTA in downward transit ridership trend, 3) abandons major effort by Board and staff to address transit service needs of the broader community, 4) survival of transit likely dependent on more service, not less PFM 38 19
31 Attachment B Services Next Network Implementation Impact to Budget Deficit Based on the savings discussed in the previous slide, elimination of the Next Network service has a large impact on the budget forecast Millions $10 $0 ($10) ($20) ($30) $0.5 VTA Budget Forecast Net Operating Revenue ($3.9) ($5.4) ($8.4) ($10.5) ($12.8) FY18 Ending Reserves: $102.2 million ($17.2) FY28 Ending Reserves: ($54.1 million) ($21.7) ($23.1) ($25.6) ($27.6) FY2018 FY2019 FY2020 FY2021 FY2022 FY2023 FY2024 FY2025 FY2026 FY2027 FY2028 FY Net Surplus/(Deficit) Only implementing half the program costs has a lower, but significant, impact on the budget deficits as well VTA Budget Forecast Net Operating Revenue $0 Millions ($10) ($20) ($30) ($40) ($10.0) ($13.4) ($15.9) ($17.9) ($20.0) ($22.3) FY18 Ending Reserves: $91.7 million ($26.7) FY28 Ending Reserves: ($160.6 million) ($31.2) ($32.6) ($35.1) ($37.1) FY2018 FY2019 FY2020 FY2021 FY2022 FY2023 FY2024 FY2025 FY2026 FY2027 FY2028 FY Net Surplus/(Deficit) PFM 39 Millions Revenue Indexed Fare Increases Index fares to CPI to keep up with service cost inflation Advantages: 1) indexing fare increases to inflation ensures fare revenues are more in line with service delivery costs Downsides: 1) fare increases could have a negative impact on ridership $0 ($5) ($10) VTA Budget Forecast Net Operating Revenue ($15) ($20) ($25) ($30) ($35) ($40) ($20.5) ($26.4) ($26.2) ($19.5) ($21.9) ($26.2) FY18 Ending Reserves: $81.2 million FY28 Ending Reserves: ($196.8 million) ($28.2) ($32.4) ($33.8) ($31.0) ($32.5) FY2018 FY2019 FY2020 FY2021 FY2022 FY2023 FY2024 FY2025 FY2026 FY2027 FY2028 FY Net Surplus/(Deficit) PFM 40 20
32 Attachment B Revenue Increase 2000 Measure A Support Increase Measure A support Advantages: 1) reduces the need for other cost-savings measures Downsides: 1) reduction of revenue available for capital from additional 2000 Measure A projects Millions $0 ($5) VTA Budget Forecast Net Operating Revenue ($10) ($15) ($20) ($25) ($30) ($35) ($20.5) ($26.4) ($25.7) ($19.0) ($19.7) ($23.9) ($24.4) FY18 Ending Reserves: $81.2 million FY28 Ending Reserves: ($170.4 million) ($28.6) ($29.8) ($26.9) ($27.4) FY2018 FY2019 FY2020 FY2021 FY2022 FY2023 FY2024 FY2025 FY2026 FY2027 FY2028 FY Net Surplus/(Deficit) PFM 41 Revenue Additional Sales Tax Revenue Increasing the tax by one-tenths of a cent would yield 20% more in revenue collections on a year-toyear basis Advantages: 1) reduces the need for other cost-savings measures, 2) provides opportunities to extend transit service Downsides: 1) increasing dependence on sales taxes is risky because sales taxes are highly impacted by economic fluctuations, 2) limit to total sales tax that can be charged in County. Santa Clara County already at limit. Exemption would require State legislative authorization Millions $30 $20 $10 VTA Budget Forecast Net Operating Revenue $23.3 $20.1 $15.5 $16.9 $13.9 $10.8 $8.2 $12.1 $9.1 $0 ($10) ($20) ($30) ($20.5) FY18 Ending Reserves: $81.2 million FY28 Ending Reserves: ($184.8 million) ($26.4) FY2018 FY2019 FY2020 FY2021 FY2022 FY2023 FY2024 FY2025 FY2026 FY2027 FY2028 FY Net Surplus/(Deficit) PFM 42 21
33 Attachment B Millions Scenario 1: Shared Sacrifice Between Employees, Riders, VTA Under this scenario, the VTA would work to spread the sacrifice of balancing the budget between as many constituents as possible. The changes modeled include: Slow wage growth Increase transit operating revenue from 2000 Measure A Index fares Contract out services Assume $12 million/year in additional State gas-tax revenue $15 $10 $5 $0 VTA Budget Forecast Net Operating Revenue $1.8 $4.0 $0.8 $3.6 $0.6 $3.0 $7.3 $10.8 ($5) ($10) ($15) ($20) ($25) ($20.5) ($14.4) ($5.8) FY18 Ending Reserves: $81.2 million FY28 Ending Reserves: $92.8 million FY2018 FY2019 FY2020 FY2021 FY2022 FY2023 FY2024 FY2025 FY2026 FY2027 FY2028 FY Net Surplus/(Deficit) PFM 43 Scenario 2: Next Network, Fare Increases, and Employee Health Sharing Under this scenario, the VTA would work to balance the budget through: Implement a lower-cost (50%) Next Network solution Employees share in health care premiums Index fares Assume $12 million/year in additional State gas-tax revenue Millions $25 $20 $15 $10 $5 VTA Budget Forecast Net Operating Revenue $16.0 $14.6 $12.4 $13.0 $11.1 $6.0 $16.7 $19.6 $0 ($5) ($10) ($15) ($10.0) ($3.9) ($0.9) FY18 Ending Reserves: $81.2 million FY28 Ending Reserves: $196.3 million FY2018 FY2019 FY2020 FY2021 FY2022 FY2023 FY2024 FY2025 FY2026 FY2027 FY2028 FY Net Surplus/(Deficit) PFM 44 22
34 Attachment B QUESTIONS? PFM 45 23
35 Attachment C Peer Agencies Original Comparators VTA services the fourth largest population area among comparative agencies 2016 Service Area Statistics LACMTA Agency Los Angeles County Metropolitan Transportation Authority Modes of Transportation (Directly Operated and Purchased Transit) Bus, Bus Rapid Transit, Light Rail, Heavy Rail, Vanpool Population Square Mileage 8,626,817 1,513 CTA Chicago Transit Authority Bus, Heavy Rail 3,272, KCDOT VTA UTA TriMet King County Department of Transportation Santa Clara Valley Transportation Authority Utah Transit Authority Tri-County Metropolitan Transportation, Oregon Bus, Trolleybus, Street Car Rail, Demand Response, Demand Response - Taxi, Ferryboat, Vanpool 2,117,125 2,134 Bus, Light Rail, Demand Response 1,927, Bus, Commuter Bus, Light Rail, Commuter Rail, Demand Response, Vanpool Bus, Light Rail, Hybrid Rail, Demand Response, Demand Response - Taxi 1,883, ,560, Sacramento RT Sacramento Regional Transit District Bus, Light Rail, Demand Response 1,031, Source: Federal Transit Authority National Transit Database (NTD), 2016 Annual Database Agency Information PFM 1
36 Attachment C Peer Agencies Ad Hoc Committee Additional Comparators VTA services the second largest population area among additional comparators 2016 Service Area Statistics OCTA VTA AC Transit Agency Orange County Transportation Authority Santa Clara Valley Transportation Authority Alameda-Contra Costa Transit District Modes of Transportation (Directly Operated and Purchased Transit) Bus, Commuter Bus, Demand Response, Demand Response-Taxi, Vanpool Population Square Mileage 3,077, Bus, Light Rail, Demand Response 1,927, Bus, Demand Response, Commuter Bus 1,425, MUNI San Francisco Municipal Railway Bus, Trolleybus, Light Rail, Street Car Rail, Cable Car, Demand Response 866, BART San Francisco Bay Area Rapid Transit District Heavy Rail, Automated Guideway, Demand Response 833, SamTrans San Mateo County Transit District Bus, Demand Response, Demand Response-Taxi 737, Source: Federal Transit Authority National Transit Database (NTD), 2016 Annual Database Agency Information PFM 2
37 Attachment C Revenue Comparisons Sources of Operating Revenues All Agencies VTA receives most of its operating revenue from local sources reported by NTD as financial assistance from local governments including income taxes, sales taxes, property taxes, and other local funds that are not directly generated by the transit agency NTD reported Taxes and Fees Levied by Transit Agency includes sales taxes, property taxes, other taxes, and tolls that are imposed by transit agencies with their own taxing authority 100% FY2016 NTD Reported Sources of Operating Revenue 90% 80% 70% 60% 50% 40% 30% 20% 10% 0% VTA BART SamTrans AC Transit MUNI OCTA Sacramento RT LACMTA CTA UTA TriMet KCDOT Local Funds State Funds Federal Funds Taxes and Fees Levied by Transit Agency Directly Generated Funds Note: TDA funds categorized as State Funds for NTD purposes PFM 3 Source: Federal Transit Authority National Transit Database (NTD), 2016 Metrics; 2016 Transit Agency
38 Attachment C Revenue Comparisons Directly Generated Revenues All Agencies Directly Generated Revenues are funds generated by, donated to or earned by the transit agency, and are dominated by passenger fares Other Directly Generated Sources includes investment earnings, rentals, parking revenues, grants and donations, and the sale of maintenance services 100% 90% 80% 70% 60% 50% 40% 30% 20% 10% FY2016 NTD Reported Directly Generated Revenues 0% VTA BART SamTrans AC Transit MUNI OCTA Sacramento RT LACMTA CTA UTA TriMet KCDOT Passenger Fares Park and Ride Advertising & Concessions Purchased Transportation Other Directly Generated Sources PFM Source: Federal Transit Authority National Transit Database (NTD), 2016 Metrics; 2016 Transit Agency 4
39 Attachment C Revenue Comparisons Farebox Recovery Ratios Original Comparators The farebox recovery ratio is the proportion of fare revenues to operating costs Farebox recovery has been on the decline nationally VTA has consistently had the lowest farebox recovery ratio among comparative agencies FY13 - FY17 Farebox Recovery Ratio Agency FY13 FY14 FY15 FY16 FY17* 50% Farebox Recovery Ratio, FY13 - FY16 CTA 45.2% 44.2% 43.4% 41.7% N/A 40% TriMet 30.2% 30.3% 31.5% 29.5% N/A 30% LACMTA 26.9% 26.1% 26.2% 22.6% N/A 20% Sacramento RT 24.6% 21.8% 21.8% 21.0% N/A 10% UTA 24.1% 21.9% 22.2% 18.8% N/A VTA 13.0% 12.4% 12.4% 11.2% 9.5% 0% CTA TriMet LACMTA Sacramento RT UTA VTA RANK 6 of 6 6 of 6 6 of 6 6 of 6 N/A FY13 FY14 FY15 FY16 *FY17 data available for VTA only PFM Source: Federal Transit Authority National Transit Database (NTD), Service Data Time Series; Agency Budget Documents 5
40 Attachment C Revenue Comparisons Farebox Recovery Ratios Additional Comparators VTA has consistently had the lowest farebox recovery ratio among the Bay Area and Orange County comparative agencies FY13 - FY17 Farebox Recovery Ratio Agency FY13 FY14 FY15 FY16 FY17* BART 77.4% 77.9% 79.9% 78.2% N/A MUNI 32.9% 29.8% 28.8% 25.7% N/A OCTA 23.0% 23.2% 21.9% 19.8% N/A AC Transit 18.5% 19.9% 19.5% 17.8% N/A SamTrans 16.9% 18.5% 15.5% 14.0% N/A VTA 13.0% 12.4% 12.4% 11.2% 9.5% RANK 6 of 6 6 of 6 6 of 6 6 of 6 N/A 100% 80% 60% 40% 20% 0% Farebox Recovery Ratio, FY13 - FY16 BART MUNI OCTA AC Transit SamTrans VTA FY13 FY14 FY15 FY16 *FY17 data available for VTA only PFM Source: Federal Transit Authority National Transit Database (NTD), Service Data Time Series; Agency Budget Documents 6
41 Attachment C Cost Efficiency Measure Cost Per Bus Trip All Agencies The cost per Unlinked Passenger Trip (UPT) is a measure of the cost efficiency of transit services VTA has the second highest costs per UPT for bus service when ranked against comparative agencies $10.00 $9.31 Cost per Unlinked Passenger Trip (UPT) - Bus, FY16 $8.00 $7.54 $6.82 $6.59 $6.55 $6.00 $4.00 $4.64 $4.36 $4.19 $3.45 $3.09 $3.06 $2.00 $0.00 SamTrans VTA AC Transit UTA Sacramento RT KCDOT OCTA TriMet LACMTA CTA MUNI Vehicle Operations Vehicle Maintenance Facility Maintenance General Administration Source: Federal Transit Authority National Transit Database (NTD), 2016 Metrics PFM 7
42 Attachment C Cost Efficiency Measure Cost Per Light Rail Trip All Agencies The cost per Unlinked Passenger Trip (UPT) is a measure of the cost efficiency of transit services VTA has the highest costs per UPT for light rail service over 200% greater than most comparators Cost per Unlinked Passenger Trip (UPT) - Light Rail, FY16 $10.00 $8.00 $8.62 $6.00 $4.00 $5.13 $4.82 $4.11 $3.50 $3.20 $2.00 $0.00 VTA LACMTA Sacramento RT MUNI UTA TriMet Vehicle Operations Vehicle Maintenance Facility Maintenance General Administration Source: Federal Transit Authority National Transit Database (NTD), 2016 Metrics PFM 8
43 Attachment C Cost Efficiency Measure Comparison Cost Per Service Hour Original Comparators VTA spends more per hour on Vehicle Operations and Vehicle Maintenance than the original peer agencies for buses, but less on General Administration than most comparators $200 $150 $100 $50 $0 $103.1 FY16 Operating Cost per Service Hour - Bus $126.3 $129.3 $134.0 UTA TriMet CTA Sacramento RT $142.3 $145.6 $166.7 KCDOT LACMTA VTA Vehicle Operations Vehicle Maintenance Non-Vehicle Maintenance General Administration Light Rail operations are high, but in the middle of comparison agencies $1,000 $800 FY16 Operating Cost per Service Hour - Light Rail $996.8 VTA s FY17 cost per service hour for light rail was $707 $600 $400 $409.6 $411.1 $610.9 $612.3 Note: Cost Per Service Hour information provided on slide #17 of the 5/11/18 PFM presentation inadvertently included data for modes other than Bus and Light Rail. These charts reflect the corrected information. $200 $0 UTA TriMet VTA Sacramento RT LACMTA Vehicle Operations Vehicle Maintenance Non-Vehicle Maintenance General Administration PFM 9 Source: Federal Transit Authority National Transit Database (NTD), 2016 Metrics
44 Attachment C Cost Efficiency Measure Comparison Cost Per Service Hour Additional Comparators VTA also spends more per hour on Vehicle Operations and Vehicle Maintenance than the new peer agencies for buses, but is lowest in general administration Light Rail operations for VTA are slightly higher than for MUNI; however, General Administration is 70% of MUNI s VTA s FY17 cost per service hour for light rail was $707 Note: Cost Per Service Hour information provided on slide #17 of the 5/11/18 PFM presentation inadvertently included data for modes other than Bus and Light Rail. These charts reflect the corrected information. $250 $200 $150 $100 $50 $125.0 FY16 Operating Cost per Service Hour - Bus $166.7 $171.7 PFM 10 $196.7 $223.6 $0 OCTA VTA MUNI AC Transit SamTrans Vehicle Operations Vehicle Maintenance Non-Vehicle Maintenance General Administration $700 $600 $500 $400 $300 $200 $100 $0 FY16 Operating Cost per Service Hour - Light Rail $594.1 $610.9 MUNI Vehicle Operations Vehicle Maintenance Non-Vehicle Maintenance General Administration VTA Source: Federal Transit Authority National Transit Database (NTD), 2016 Metrics
45 Attachment C Cost Comparisons Expenses by Type (Cost) All Agencies Expenses for most comparative transit agencies follow similar patterns with Salaries and Benefits as the dominant cost of service $1,800,000 $1,600,000 $1,400,000 $1,200,000 $1,574,418 $1,394,386 Total Operating Expenses by Type, FY16 (in thousands) $1,000,000 $800,000 $600,000 $400,000 $803,585 $625,985 $625,736 $426,093 $416,575 $359,996 $288,598 $268,970 $200,000 $- LACMTA CTA MUNI BART UTA KCDOT AC Transit VTA OCTA TriMet Sacramento RT $139,513 $129,537 Salaries, Wages, Benefits Materials and Supplies Purchased Transportation Services Other Operating Expenses SamTrans PFM 11 Source: Federal Transit Authority National Transit Database (NTD), 2016 Operating Expenses
46 Attachment C Cost Comparisons Expenses by Type (Percent of Total) All Agencies As a percent of total expenses, VTA is among the highest for salaries and benefits 100% 90% 80% 70% 60% 50% 40% 30% 20% 10% % of Operating Expenses by Type, FY16 0% LACMTA CTA MUNI BART UTA KCDOT AC Transit VTA OCTA TriMet Sacramento RT SamTrans Salaries, Wages, Benefits Materials and Supplies Purchased Transportation Services Other Operating Expenses PFM 12 Source: Federal Transit Authority National Transit Database (NTD), 2016 Operating Expenses
47 Attachment C Cost Comparisons Expenses by Function (Cost) All Agencies When categorized by function, Vehicle Operations represent more than 50% of most agency operating expenses $1,800,000 $1,600,000 $1,400,000 $1,200,000 $1,574,418 $1,394,386 Total Operating Expenses by Function, FY16 (in thousands) $1,000,000 $800,000 $600,000 $803,585 $625,985 $625,736 $400,000 $426,093 $416,575 $359,996 $288,598 $268,970 $200,000 $- $139,513 $129,537 LACMTA CTA MUNI BART KCDOT TriMet AC Transit VTA OCTA UTA Sacramento RT Vehicle Operations Vehicle Maintenance Facility Maintenance General Administration SamTrans PFM 13 Source: Federal Transit Authority National Transit Database (NTD), 2016 Operating Expenses
48 Attachment C Cost Comparisons Expenses by Function (Percent of Total) All Agencies When categorized by function, VTA s Vehicle Operations are the highest (at 56%), along with King County Vehicle maintenance is tied for second highest with MUNI General Administration is lowest, along with CTA 100% 90% 80% 70% 60% 50% 40% 30% 20% 10% % of Operating Expenses by Function, FY16 0% VTA BART SamTrans AC Transit MUNI OCTA LACMTA CTA UTA KCDOT TriMet Sacramento RT Vehicle Operations Vehicle Maintenance Facility Maintenance General Administration PFM 14 Source: Federal Transit Authority National Transit Database (NTD), 2016 Operating Expenses
49 Attachment D Cost of Living Comparisons BEA Regional Price Parities The cost of living for varies for comparator agencies. The data presented on the following two slides is based on Regional Price Parities Regional Price Parities (RPPs) are regional price levels expressed as a percentage of the overall national price level for a given year. The price level is determined by the average prices paid by consumers for the mix of goods and services consumed in each region. RPPs are expressed as a percentage of the overall national price level for each year, which is equal to For example, if the RPP for area A is 120 and for area B is 90, then on average, prices are 20% higher and 10% lower than the US average for A and B respectively PFM 1
50 Attachment D Cost of Living Comparisons BEA Regional Price Parities The 2016 RPP for all items in the San Jose Sunnyvale Santa Clara Metropolitan Statistical Area (MSA), which is served by VTA, is 27.1 percent higher than the national average As shown in the graph below, this difference is also higher than RPPs among peer agency MSAs 30% 25% 27.1% 2016 RPPs, All Items: % Difference from National Average 24.7% 20% 17.7% 15% 10% 10.5% 5% 3.8% 2.0% 1.7% 0% -5% San Jose MSA SF/Oakland MSA LA MSA Seattle MSA Chicago MSA Sacramento MSA Portland MSA Salt Lake City MSA -0.6% PFM Source: US Bureau of Economic Analysis, 2016 Regional Price Parities by MSA 2
51 Attachment D Cost of Living Comparisons BEA Regional Price Parities The 2016 RPP for Rents in the San Jose Sunnyvale Santa Clara Metropolitan Statistical Area (MSA) is percent higher than the national average As shown in the graph below, this difference is also higher than 2016 Rent RPPs among peer agency MSAs 120% 113.3% 2016 RPPs, Rents: % Difference from National Average 100% 90.9% 80% 60% 65.4% 40% 34.0% 20% 17.7% 17.6% 14.8% 4.2% 0% San Jose MSA SF/Oakland MSA LA MSA Seattle MSA Portland MSA Sacramento MSA Chicago MSA Salt Lake City MSA PFM Source: US Bureau of Economic Analysis, 2016 Regional Price Parities by MSA 3
52 Attachment E What Other Agencies Have Done TriMet Portland, OR Defined benefit to defined contribution pension (2003) No retiree health (In 2009, retiree medical benefits were closed to new nonunion employees) No free downtown routes (2009) Increased income tax rate (HB2017 Keep Oregon Moving, transit improvement bill increased the payroll and self-employment tax to %; effective January 1, 2018) PFM 1
53 Attachment E What Other Agencies Have Done Los Angeles Metro Increased fares in 2014 New transportation/mobility business model adopted the Risk Allocation matrix (RAM) in 2016 Introduced a new college student fare program that increased ridership in 2017 PFM 2
54 Attachment E What Other Agencies Have Done Sacramento Regional Transit Eliminated positions/reduced annual salary adjustment (2018) New business model introduced in recent years (first implemented in ) Introduced SmaRT Ride on-demand micro-transit/100% accessible/similar to Uber Pool in February 2018 PFM 3

55 Attachment E What Other Agencies Have Done Chicago Transit Authority FY18 Budget included the following cost saving measures: Increased fares 25%, took effect on January 7, 2018 first increase since 2009 Controlled electrical costs by locking in contractual pricing for fuel and power FY18 budget Expected increases in advertising and concession revenues Implemented new management strategies to crack down on absenteeism in 2012, which cost the agency $40 million in 2011 PFM 4
56 Attachment E What Other Agencies Have Done King County Metro Seattle, WA New service model in recent years Seattle voters approved a sales tax increase and a vehicle license fee to raise an additional $45 million annually in 2014 Last year voters approved another $54 billion expansion of public transit systems by raising the sales tax another 0.5 percent and increasing the vehicle license fee again PFM 5
57 Attachment E Innovative Programs First/Last Mile & Mobility King County Metro Pilot program offering riders (via an app) within a two-mile radius of four park-and-ride lots to be picked-up on demand on a shared-ride basis to connect quickly to transit (2018) DART (Dallas) Partnership with Uber to provide access to Uber for first mile/last mile via the system s GoPass app MARTA (Atlanta) Partnered with Uber when the I-85 bridge collapsed. Uber helped address issues with lack of parking as commuters switched to transit. This partnership is continuing, with Uber targeting major transit centers for first mile/last mile trips Bishop Ranch (San Ramon) First autonomous shuttle licensed by California to shuttle BART riders from nearby neighborhood to BART station. Many small shuttles offering quicker transit to BART (March 2018) LA Metro Bike Share program in downtown LA and key tourist areas connecting bus and light rail destinations with first mile/last mile accessibility Sacramento RT Microbus, on-demand transit accessed through an app on a customers smartphone. Can choose pick up time, schedule for different day. Can purchase a daily pass (2018) PFM 6
58 Attachment F Workforce Control Wage Inflation Reducing wage and non-medical benefits inflation Advantages: 1) able to offer better transit service by keeping cost inflation down, 2) matching wage increases to ability-to-pay protects jobs Downsides: 1) risk not keeping up with labor market and creating retention and recruitment issues; 2) may create issues with labor union in contract negotiations Key assumptions Reduces wages and non-medical benefits inflation from 3.5% to 2% Millions $0 ($5) ($10) ($15) ($20) ($25) ($30) ($35) ($40) ($45) ($50) ($20.5) ($20.5) ($22.9) ($26.4) ($26.4) ($25.5) ($29.5) FY18 Ending Reserves: $81.2 million FY28 Ending Reserves: ($57.8 million) Baseline Ending Reserves: ($267.1 million) VTA Budget Forecast Net Operating Revenue ($14.7) ($14.7) ($14.4) ($27.4) ($31.8) ($36.2) ($13.8) ($13.1) FY2018 FY2019 FY2020 FY2021 FY2022 FY2023 FY2024 FY2025 FY2026 FY2027 FY2028 ($40.7) ($44.6) ($11.5) ($42.1) ($3.2) ($46.6) ($1.7) Baseline Net Operating Results with Controlled Wage Infaltion PFM 1
59 Attachment F Workforce Share Health Insurance Costs Negotiate cost sharing on health insurance premiums Advantages: 1) health costs are pre-tax; therefore have a lesser impact on employees than other cost-sharing or wage impacts, 2) sharing health premiums helps limit growth in VTA s insurance costs Downsides: 1) Any changes to health care must be negotiated with labor unions, 2) cost-sharing could cause some employees to opt for lower-cost, non-family benefits Key Assumptions Assumes 80% employer / 20% employee health insurance premium cost sharing Millions $0 ($5) ($10) VTA Budget Forecast Net Operating Revenue ($15) ($20) ($25) ($30) ($35) ($40) ($45) ($50) ($20.5) ($20.5) ($26.4) ($26.4) ($29.5) ($29.5) ($22.9) ($22.9) FY18 Ending Reserves: $81.2 million FY28 Ending Reserves: ($197.3 million) Baseline Ending Reserves: ($267.1 million) ($27.4) ($18.7) ($31.8) FY2018 FY2019 FY2020 FY2021 FY2022 FY2023 FY2024 FY2025 FY2026 FY2027 FY2028 ($22.7) ($36.2) ($26.7) ($40.7) ($30.7) ($44.6) ($34.2) ($42.1) ($31.2) ($46.6) ($35.2) Baseline Net Operating Results with Shared Health Insurance Costs PFM 2
60 Attachment F Workforce Share Pension Costs Create across-the-board parity with employee contribution to pension costs Advantages: 1) equal participation in pension funding, 2) provides value to employees by strengthening total pension funding Downsides: 1) Any changes to pension contributions must be negotiated with labor unions Key assumptions Moves employee pension contributions to a 6% share over three years beginning in FY2020 Millions $0 ($5) ($10) ($15) ($20) ($25) ($30) ($35) ($40) ($45) ($50) VTA Budget Forecast Net Operating Revenue ($20.5) ($20.5) ($19.7) ($22.9) ($22.1) ($26.4) ($26.4) ($27.4) ($26.3) ($28.2) ($29.5) ($30.5) ($31.8) ($34.8) FY18 Ending Reserves: $81.2 million ($36.2) ($35.8) ($38.5) FY28 Ending Reserves: ($221.2 million) ($40.7) ($40.1) ($42.1) Baseline Ending Reserves: ($267.1 million) ($44.6) ($46.6) FY2018 FY2019 FY2020 FY2021 FY2022 FY2023 FY2024 FY2025 FY2026 FY2027 FY2028 Baseline Net Operating Results with Shared Pension Costs PFM 3
61 Attachment F Millions Workforce Outsource Services, Where Feasible Increasing the amount of transit contracted out, could result in significant savings Advantages: 1) lower cost, 2) easier to flex services based on ridership demand, 3) can put cost of training, capital, and innovation on contractor Downsides: 1) Less control over staffing, 2) can create culture issues between VTA and contractor staff, 3) can cause issues with labor unions with loss (expected to be by attrition) of regular employees Key Assumptions Assumes 25% savings can be achieved and 20% of current employee jobs are outsourced, resulting in a 5% reduction in personnel expenses $0 ($5) ($10) ($15) ($20) ($25) ($30) ($35) ($40) ($45) ($50) ($18.9) ($20.5) ($20.5) ($22.9) ($23.2) ($26.4) ($26.4) ($25.6) ($27.4) ($27.5) ($29.5) ($31.8) FY18 Ending Reserves: $81.2 million FY28 Ending Reserves: ($226.6 million) Baseline Ending Reserves: ($267.1 million) VTA Budget Forecast Net Operating Revenue ($36.2) ($36.0) ($37.1) ($40.7) ($39.8) ($42.1) ($41.5) ($44.6) ($46.6) FY2018 FY2019 FY2020 FY2021 FY2022 FY2023 FY2024 FY2025 FY2026 FY2027 FY2028 Baseline PFM 4 ($31.7) Net Operating Results with Outsourced Services
62 Attachment F Services Rationalized Fleet Sizing and Electrification Rationalized fleet sizing could include use of smaller vehicles* on routes that don t demand fullsize buses or use of a micro-transit fleet (passenger vans or smaller vehicles) Savings: Requires additional study Advantages: 1) lower, or no, up-front capital cost, 2) lower replacement cost, 3) lower maintenance costs, 4) better fuel mileage, 5) could operate with Class C license with appropriate reduction in pay Downsides: 1) If purchased, adding vehicles to fleet increases complexity of parts and maintenance demands, 2) proper match of vehicle to route could vary by time-of-day and day-ofweek, 3) multiple license requirements increases complexity/flexibility in managing workforce Fleet Electrification of buses Savings: Requires additional study Advantages: 1) Cost of electricity per mile less than fossil fuel, 2) cost of batteries going down, while life of batteries going up, 3) fewer parts, less maintenance for fully-electric vehicles Downsides: 1) requires change-out of fueling facilities, 2) limited current performance in long-term, heavy commercial use, 3) not yet an industry standard, 4) larger up-front capital costs in the current market PFM * Note smaller vehicles would need to be fully accessible to meet needs of transit dependent 5
63 Attachment F Services Right-Size Service Levels Implementation of the Next Network is included in the Current VTA budget. These service improvement are meant to: 1) increase the frequency of service on an expanded transit network, 2) connect with the coming BART extension, and 3) provide more service in underserved and vulnerable communities No or Limited Implementation -- Two alternatives are addressed on the following slide showing: 1) Full pull-back of Next Network improvements, and 2) partial implementation of Next Network Savings: 1) $19 million -- $23 million cost less $4 million in expected fare increases from expanded services, and 2) $9.5 million -- $11.5 million cost less $2 million in expected fare increases Advantages: 1) reduces cost to balance budget and keep the VTA in a strong financial position, 2) reduces the need for other cost-savings measures Downsides: 1) does not address service needs to coming BART ridership, 2) likely to keep VTA in downward transit ridership trend, 3) abandons major effort by Board and staff to address transit service needs of the broader community, 4) survival of transit likely dependent on more service, not less PFM 6
64 Attachment F Millions Millions Services Next Network Implementation Impact to Budget Deficit Based on the savings discussed in the previous slide, elimination of the Next Network service has a large impact on the budget forecast $10 $0 ($10) ($20) ($30) ($40) ($50) Only implementing half the program costs has a lower, but significant, impact on the budget deficits $0 ($5) ($10) ($15) ($20) ($25) ($30) ($35) ($40) ($45) ($50) $0.5 VTA Budget Forecast Net Operating Revenue ($5.4) ($3.9) ($8.4) ($10.5) ($12.8) ($17.2) ($20.5) ($22.9) ($21.7) ($23.1) ($26.4) ($29.5) ($27.4) ($25.6) ($27.6) ($31.8) FY18 Ending Reserves: $102.2 million ($36.2) FY28 Ending Reserves: ($54.1 million) ($40.7) ($42.1) Baseline Ending Reserves: ($267.1 million) ($44.6) ($46.6) FY2018 FY2019 FY2020 FY2021 FY2022 FY2023 FY2024 FY2025 FY2026 FY2027 FY2028 Baseline Net Operating Results with No Next Network Implementation VTA Budget Forecast Net Operating Revenue ($10.0) ($13.4) ($15.9) ($17.9) ($20.5) ($20.0) ($22.9) ($22.3) ($26.4) ($27.4) ($26.7) ($29.5) ($31.8) ($31.2) ($32.6) FY18 Ending Reserves: $91.7 million ($36.2) ($35.1) ($37.1) FY28 Ending Reserves: ($160.6 million) ($40.7) ($42.1) Baseline Ending Reserves: ($267.1 million) ($44.6) ($46.6) FY2018 FY2019 FY2020 FY2021 FY2022 FY2023 FY2024 FY2025 FY2026 FY2027 FY2028 PFM Baseline Net Operating Results with 50% Next Network Implementation 7
65 Attachment F Revenue Indexed Fare Increases Index fares to CPI to keep up with service cost inflation Advantages: 1) indexing fare increases to inflation ensures fare revenues are more in line with service delivery costs Downsides: 1) fare increases could have a negative impact on ridership Key assumptions Assumes fares are increased by an inflationary rate every two-year budget cycle Millions $0 ($5) ($10) VTA Budget Forecast Net Operating Revenue ($15) ($20) ($25) ($30) ($35) ($40) ($45) ($50) ($20.5) ($20.5) ($26.4) ($26.4) ($26.2) ($29.5) ($22.9) ($19.5) FY18 Ending Reserves: $81.2 million FY28 Ending Reserves: ($196.8 million) Baseline Ending Reserves: ($267.1 million) ($27.4) ($21.9) ($31.8) FY2018 FY2019 FY2020 FY2021 FY2022 FY2023 FY2024 FY2025 FY2026 FY2027 FY2028 ($26.2) ($36.2) ($28.2) ($40.7) ($32.4) ($44.6) ($33.8) ($42.1) ($31.0) ($46.6) ($32.5) Baseline Net Operating Results with Indexed Fare Increases PFM 8
66 Attachment F Millions Revenue Increase 2000 Measure A Support Increase Measure A support $0 ($5) ($10) ($15) ($20) ($19.0) ($20.5) ($20.5) ($19.7) ($25) ($22.9) ($23.9) ($24.4) ($26.4) ($26.4) ($25.7) ($30) ($27.4) ($29.5) ($35) ($31.8) ($40) ($45) ($50) Advantages: 1) reduces the need for other cost-savings measures Downsides: 1) reduction of revenue available for capital from additional 2000 Measure A projects Key assumptions Increases 2000 Measure A allocation to VTA Transit budget by 2.25 percent every two years in line with VTA s budgetary cycle FY18 Ending Reserves: $81.2 million FY28 Ending Reserves: ($170.4 million) Baseline Ending Reserves: ($267.1 million) VTA Budget Forecast Net Operating Revenue PFM 9 ($36.2) ($40.7) ($28.6) ($44.6) ($29.8) ($42.1) ($26.9) ($27.4) FY2018 FY2019 FY2020 FY2021 FY2022 FY2023 FY2024 FY2025 FY2026 FY2027 FY2028 Baseline Net Operating Results with Increased 2000 Measure A support ($46.6)
67 Attachment F Revenue Additional Sales Tax Revenue Millions Increasing the tax by one-tenths of a cent would yield 20% more in revenue collections on a year-toyear basis Advantages: 1) reduces the need for other cost-savings measures, 2) provides opportunities to extend transit service Downsides: 1) increasing dependence on sales taxes is risky because sales taxes are highly impacted by economic fluctuations, 2) limit to total sales tax that can be charged in County. Santa Clara County already at limit. Exemption would require State legislative authorization Key assumptions Assumes a $0.001 cent increase to the half-cent sales tax rate, resulting in a 20% rate increase $30 $20 $10 VTA Budget Forecast Net Operating Revenue $15.5 $23.3 $20.1 $16.9 $13.9 $10.8 $8.2 $12.1 $9.1 $0 ($10) ($20) ($30) ($40) ($50) ($60) ($20.5) ($20.5) ($26.4) ($26.4) ($29.5) ($22.9) FY18 Ending Reserves: $81.2 million FY28 Ending Reserves: ($184.8 million) Baseline Ending Reserves: ($267.1 million) ($27.4) ($31.8) FY2018 FY2019 FY2020 FY2021 FY2022 FY2023 FY2024 FY2025 FY2026 FY2027 FY2028 Baseline Net Operating Results with Additional Sales Tax Revenue PFM 10 ($36.2) ($40.7) ($44.6) ($42.1) ($46.6)
68 Attachment F Millions Scenario 1: Shared Sacrifice Between Employees, Riders, VTA Under this scenario, the VTA would work to spread the sacrifice of balancing the budget between as many constituents as possible. The changes modeled include: $20 $10 $0 Slow wage growth Increase transit operating revenue from 2000 Measure A Index fares Contract out services Assume $12 million/year in additional State gas-tax revenue VTA Budget Forecast Net Operating Revenue $1.8 $4.0 $0.8 $3.6 $0.6 $3.0 $7.3 $10.8 ($10) ($20) ($30) ($40) ($50) ($20.5) ($20.5) ($26.4) ($14.4) ($29.5) ($5.8) ($22.9) ($27.4) FY18 Ending Reserves: $81.2 million FY28 Ending Reserves: $92.8 million Baseline Ending Reserves: ($267.1 million) ($31.8) FY2018 FY2019 FY2020 FY2021 FY2022 FY2023 FY2024 FY2025 FY2026 FY2027 FY2028 ($36.2) ($40.7) ($44.6) ($42.1) ($46.6) Baseline Scenario 1 PFM 11
69 Attachment F Scenario 2: Next Network, Fare Increases, and Employee Health Sharing Under this scenario, the VTA would work to balance the budget through: Implement a lower-cost (50%) Next Network solution Employees share in health care premiums Index fares Assume $12 million/year in additional State gas-tax revenue Millions $30 $20 $10 VTA Budget Forecast Net Operating Revenue $16.0 $14.6 $12.4 $11.1 $6.0 $13.0 $16.7 $19.6 $0 ($10) ($10.0) ($3.9) ($0.9) ($20) ($30) ($40) ($50) ($20.5) ($22.9) ($26.4) ($27.4) ($29.5) ($31.8) FY18 Ending Reserves: $81.2 million ($36.2) FY28 Ending Reserves: $196.3 million ($40.7) ($42.1) Baseline Ending Reserves: ($267.1 million) ($44.6) ($46.6) FY2018 FY2019 FY2020 FY2021 FY2022 FY2023 FY2024 FY2025 FY2026 FY2027 FY2028 Baseline Scenario 2 PFM 12
70 Attachment G Revenue SB 1 Revenue Included Including revenue from SB 1 at $12 million per year starting in FY2019 improves the baseline forecast Advantages: 1) reduces the need for other cost-savings measures, 2) provides opportunities to extend transit service Downsides: 1) revenue is subject to voter approval an initiative to repeal SB 1 is on the November 2018 ballot Millions $0 ($5) ($10) ($15) ($20) ($25) ($30) ($35) ($40) ($45) ($50) ($20.5) ($20.5) ($26.4) ($14.4) ($29.5) ($17.5) ($22.9) ($10.9) FY18 Ending Reserves: $81.2 million FY28 Ending Reserves: ($147.1 million) Baseline Ending Reserves: ($267.1 million) VTA Budget Forecast Net Operating Revenue ($27.4) ($15.4) ($31.8) ($19.8) FY2018 FY2019 FY2020 FY2021 FY2022 FY2023 FY2024 FY2025 FY2026 FY2027 FY2028 ($36.2) ($24.2) ($40.7) ($28.7) ($44.6) ($32.6) ($42.1) ($30.1) ($46.6) ($34.6) Baseline Net Operating Results with SB1 Revenue Included PFM 1
71 Attachment H Revenue 2016 Measure B Revenue Excluded The graph below shows the impact of removing approximately $14 - $15 million in 2016 Measure B revenue from FY2018 FY2028 Measure B funds are currently tied up in an ongoing lawsuit that could take up to a year to resolve Millions $0 ($10) VTA Budget Forecast Net Operating Revenue ($20) ($30) ($40) ($50) ($60) ($70) ($20.5) ($20.5) ($26.4) ($26.4) ($29.5) ($44.4) ($22.9) ($38.2) FY18 Ending Reserves: $81.2 million FY28 Ending Reserves: ($416.3 million) Baseline Ending Reserves: ($267.1 million) ($27.4) ($43.1) ($31.8) ($47.9) FY2018 FY2019 FY2020 FY2021 FY2022 FY2023 FY2024 FY2025 FY2026 FY2027 FY2028 ($36.2) ($52.7) ($40.7) ($57.7) ($44.6) ($62.1) ($42.1) ($60.0) ($46.6) ($65.0) Baseline Net Operating Results with 2016 Measure B Revenue Excluded PFM 1
72 Attachment I Summary Forecast Results Initiative/Scenario Key Assumptions FY2028 Ending Reserves ($ millions) Baseline Forecast No corrective action taken by Board ($267.1) Workforce Control Wage Inflation Reduces wage inflation from 3.5% to 2% ($57.8) Share Health Insurance Costs 80% employer / 20% employee cost sharing ($197.3) Share Pension Costs 6% employee share over 3 years ($221.2) Outsource Services, Where Feasible 5% reduction in personnel expenses ($226.6) Services Rationalized Fleet Sizing Requires additional study N/A Fleet Electrification of Buses Requires additional study N/A No Next Network Implementation $19 million savings per year from full pull-back ($54.1) 50% Next Network Implementation $9.5 million savings per year from partial implementation ($160.6) Revenue Indexed Fare Increases Increased fares by inflationary rate every two years ($196.8) Increase 2000 Measure A Support Increased allocation by 2.25% every two years ($170.4) Additional Sales Tax Revenue Assumes a one-tenth cent sales tax increase $184.8 SB 1 Revenue Included $12 million/year in additional revenue ($147.1) 2016 Measure B Revenue Excluded Removes around $14 million/year in revenue ($416.3) Scenarios Scenario 1 Scenario 2 Reduced wage growth, increased 2000 Measure A support, indexed fare increases, outsourced services, SB 1 revenue 50% Next Network Implementation, shared health care costs, indexed fares, SB 1 revenue $92.8 $196.3 PFM 1


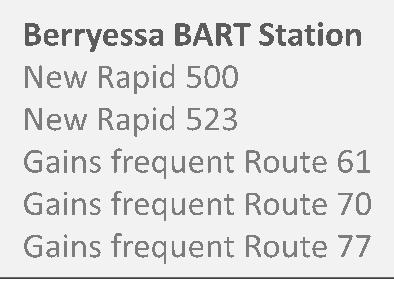
73 Next Network Frequent Regional Connections Attachment J
3 RD QUARTER 2016 QUARTERLY FINANCIAL AND PERFORMANCE REPORT
 3 RD QUARTER 2016 QUARTERLY FINANCIAL AND PERFORMANCE REPORT November 2016 0 3 rd Quarter 2016 Financial and Performance Report Table of Contents Executive Summary... 1 Environmental Factors... 3 Ridership...
1 ST QUARTER 2017 QUARTERLY FINANCIAL AND PERFORMANCE REPORT
 1 ST QUARTER 2017 QUARTERLY FINANCIAL AND PERFORMANCE REPORT May 2017 0 1 st Quarter 2017 Financial and Performance Report Table of Contents Executive Summary... 2 Environmental Factors... 4 Ridership...
Caltrain Service Preparing for FY2012 Caltrain Benefits Environment, Economy, Quality of Life
 Caltrain Service Preparing for FY2012 Caltrain Benefits Environment, Economy, Quality of Life If traveling via automobile, Caltrain riders would increase regional CO2 emissions by 89,850 metric tons or
Proposed FY2012 Operating Budget
 Proposed FY2012 Operating Budget June 2, 2011 Overview Began budget discussions in January 2011 Reviewed FY2012 Preliminary Operating Budget at the May 5, 2011 JPB meeting Followed up Board member questions
BOARD OF DIRECTORS' WORKSHOP MEETING. Friday, April 19, :30 AM PLEASE NOTE CHANGE IN MEETING TIME AGENDA
 BOARD OF DIRECTORS' WORKSHOP MEETING Friday, April 19, 2013 8:30 AM PLEASE NOTE CHANGE IN MEETING TIME Board of Supervisors Chambers County Government Center 70 West Hedding Street San Jose, CA 95110 AGENDA
4TH QUARTER 2016 QUARTERLY FINANCIAL AND PERFORMANCE REPORT
 4TH QUARTER 2016 QUARTERLY FINANCIAL AND PERFORMANCE REPORT February 2017 0 Quarterly Financial and Performance Report 4th Quarter 2016 4th Quarter 2016 Financial and Performance Report Table of Contents
1ST QUARTER May 2018
 1ST QUARTER 2018 May 2018 0 1 st Quarter 2018 Financial and Performance Report Table of Contents Executive Summary... 2 Environmental Factors... 4 Ridership... 6 Peer Ridership Comparison... 7 Operating
3RD QUARTER November 2018
 3RD QUARTER 2018 November 2018 0 Quarterly Financial and Performance Report 3rd Quarter 2018 3rd Quarter 2018 Financial and Performance Report Table of Contents Executive Summary... 2 Environmental Factors...
2 ND QUARTER 2017 QUARTERLY FINANCIAL AND PERFORMANCE REPORT
 2 ND QUARTER 2017 QUARTERLY FINANCIAL AND PERFORMANCE REPORT August 2017 0 2 nd Quarter 2017 Financial and Performance Report Table of Contents Executive Summary... 2 Environmental Factors... 4 Ridership...
BOARD OF DIRECTORS WORKSHOP/SPECIAL MEETING. Friday, April 21, :00 AM PLEASE NOTE MEETING DATE, TIME, AND LOCATION AGENDA
 BOARD OF DIRECTORS WORKSHOP/SPECIAL MEETING Friday, April 21, 2017 9:00 AM PLEASE NOTE MEETING DATE, TIME, AND LOCATION Board of Supervisors Chambers County Government Center 70 West Hedding Street San
Subject: Creation of an Eco Pass
 To: Board of Directors Date: April, 2014 From: Anne Muzzini, Director of Planning & Marketing Reviewed by: Subject: Creation of an Eco Pass Summary: The concept of creating an Eco Pass has been reviewed
4 TH QUARTER 2017 QUARTERLY FINANCIAL AND PERFORMANCE REPORT
 4 TH QUARTER 2017 QUARTERLY FINANCIAL AND PERFORMANCE REPORT February 2018 0 4 th Quarter 2017 Financial and Performance Report Table of Contents Executive Summary... 2 Environmental Factors... 4 Ridership...
BOARD OF DIRECTORS WORKSHOP MEETING. Friday, April 19, :00 AM PLEASE NOTE MEETING LOCATION AGENDA
 BOARD OF DIRECTORS WORKSHOP MEETING Friday, April 19, 2019 9:00 AM PLEASE NOTE MEETING LOCATION VTA Auditorium 3331 North First Street San Jose, CA 95134 AGENDA To help you better understand, follow, and
3 RD QUARTER 2017 QUARTERLY FINANCIAL AND PERFORMANCE REPORT
 3 RD QUARTER 2017 QUARTERLY FINANCIAL AND PERFORMANCE REPORT November 2017 0 3 rd Quarter 2017 Financial and Performance Report Table of Contents Executive Summary... 2 Environmental Factors... 4 Ridership...
Chapter 9 Financial Considerations. 9.1 Introduction
 9.1 Introduction Chapter 9 This chapter presents anticipated costs, revenues, and funding for the NEPA BART Extension Alternative. A summary of VTA s financial plan for the BART Extension Alternative is
CHAPTER 9 FINANCIAL CONSIDERATIONS
 CHAPTER 9 FINANCIAL CONSIDERATIONS 9.1 INTRODUCTION This chapter presents anticipated costs, revenues, and funding for the Berryessa Extension Project (BEP) Alternative and the Silicon Valley Rapid Transit
Ad Hoc Financial Stability Committee MINUTES
 Ad Hoc Financial Stability Committee Friday, March 9, 2018 MINUTES CALL TO ORDER The Santa Clara Valley Transportation Authority s (VTA s) Ad Hoc Financial Stability Committee ( Committee ) meeting was
Fare Policy. Discussion Document November 23, 2015
 Fare Policy Discussion Document November 23, 2015 Key legislation regarding fare levels 2013 Session Law Chapter 46 SECTION 6A. Set goal of an increase in the farebox recovery ratio of at least 10 per
BART s Business Model
 BART s Business Model July 31, 2018 What is Public Transit s Business Model? BART Background Basic Facts Regional rail rapid transit Elected Board of Directors: 9 Comprised of 3 Counties: - Alameda, Contra
CHAPTER 9 FINANCIAL CONSIDERATIONS
 CHAPTER 9 FINANCIAL CONSIDERATIONS 9.1 INTRODUCTION This chapter presents anticipated costs, revenues, and funding for the BEP and the SVRTP. A summary evaluation of VTA s financial plan for the proposed
Funding Local Public Transportation
 Funding Local Public Transportation I. Metro A. SORTA, early history In 1969 the Southwest Ohio Regional Transit Authority was established by Hamilton County with Hamilton County as its jurisdiction. In
FY18 Final Results Budget Outlook, FY20-22
 FY18 Final Results Budget Outlook, FY20-22 Objectives Provide background necessary for consideration of fiscal pressures that exist prior to electrification Service levels Ridership Member agency funding
SAN FRANCISCO MUNICIPAL TRANSPORTATION AGENCY
 THIS PRINT COVERS CALENDAR ITEM NO.: 10. SAN FRANCISCO MUNICIPAL TRANSPORTATION AGENCY DIVISION: Finance and Information Technology BRIEF DESCRIPTION: Approving revisions to the Title VI analysis for the
AGENDA Bacciocco Auditorium, 2 nd Floor 1250 San Carlos Avenue, San Carlos CA 94070
 BOARD OF DIRECTORS 2011 SEAN ELSBERND, CHAIR OMAR AHMAD, VICE CHAIR JOSÉ CISNEROS NATHANIEL P. FORD, SR. ASH KALRA LIZ KNISS ARTHUR L. LLOYD ADRIENNE TISSIER KEN YEAGER MICHAEL J. SCANLON EXECUTIVE DIRECTOR
State Grants (STA) Major Funding Sources (Except Sales Tax) Transit System. FY10 Adopted d Budget $0. Historically $8.5M/2% but has been as high as
 Major Funding Sources (Except Sales Tax) Transit System. FY10 Adopted d Budget $0. Historically $8.5M/2% but has been as high as") Major Funding Sources (Except Sales Tax) Transit System Federal Grants FY10 Adopted Budget $51M/13% State Grants (STA) FY10 Adopted d Budget $0 Historically $8.5M/2% but has been as high as $22M Fare Revenues
Major Funding Sources (Except Sales Tax) Transit System Federal Grants FY10 Adopted Budget $51M/13% State Grants (STA) FY10 Adopted d Budget $0 Historically $8.5M/2% but has been as high as $22M Fare Revenues
VALLEY METRO RPTA FY18 Budget EXECUTIVE SUMMARY
 VALLEY METRO RPTA FY18 Budget EXECUTIVE SUMMARY FY18 ADOPTED ANNUAL OPERATING AND CAPITAL BUDGET Valley Metro Regional Public Transportation Authority (RPTA) provides public transportation services for
Title VI Approval of Major Service Change, Disparate Impact and Disproportionate Burden
 Customer Service and Operations Committee Board Action Item III-A October 10, 2013 Title VI Approval of Major Service Change, Disparate Impact and Disproportionate Burden Page 3 of 42 Washington Metropolitan
Peer Agency: King County Metro
 Peer Agency: King County Metro City: Seattle, WA Fare Policy: Service Type Full Fare Reduced Fare Peak: - 1 Zone $2.75 $1.00* or $1.50** - 2 Zones $3.25 $1.00* or $1.50** Off Peak $2.50 $1.00* or $1.50**
FY17 FY16 Valley Metro RPTA Sources of Funds FY17 vs FY16
 FY17 ADOPTED ANNUAL OPERATING AND CAPITAL BUDGET Valley Metro Regional Public Transportation Authority (RPTA) provides public transportation services for Maricopa County located in the metro Phoenix, Arizona.
AGENDA DATE: April 17, 2019 ITEM NO. 12. SUBJECT: Consider Action to Increase the Compensation of Zone 7 Board Members
 ALAMEDA COUNTY FLOOD CONTROL AND WATER CONSERVATION DISTRICT, ZONE 7 100 NORTH CANYONS PARKWAY, LIVERMORE, CA 94551 PHONE (925) 454-5000 FAX (925) 454-5727 ORIGINATING SECTION: ADMINISTRATIVE SERVICES
Public Authorities by the Numbers: Capital District Transportation Authority
 Public Authorities by the Numbers: Capital District Transportation Authority June 2016 Table of Contents I. EXECUTIVE SUMMARY... 1 II. CAPITAL DISTRICT TRANSPORTATION AUTHORITY BY THE NUMBERS... 2 Introduction...
STATE ROUTE 85 CORRIDOR POLICY ADVISORY BOARD. Monday, May 21, 2018 PLEASE NOTE CHANGE IN MEETING LOCATION AGENDA
 STATE ROUTE 85 CORRIDOR POLICY ADVISORY BOARD Monday, May 21, 2018 10:00 AM PLEASE NOTE CHANGE IN MEETING LOCATION CALL TO ORDER 1. ROLL CALL 2. PUBLIC PRESENTATIONS: Mountain View City Hall Council Chambers
PINELLAS SUNCOAST TRANSIT AUTHORITY KEY BUDGET ASSUMPTIONS FOR FISCAL YEAR 2016
 PINELLAS SUNCOAST TRANSIT AUTHORITY KEY BUDGET ASSUMPTIONS FOR FISCAL YEAR 2016 PSTA Budget Forecasting Summary Item Assumption Amount Source 3 Yr. Avg. FY2016 FY2017 FY2018 FY2019 FY2020 Revenues FY15
MEMORANDUM. Santa Clara Valley Transportation Authority Board of Directors. Michael T. Burns General Manager. DATE: August 4, 2008
 MEMORANDUM TO: FROM: Santa Clara Valley Transportation Authority Board of Directors Michael T. Burns General Manager DATE: August 4, 2008 SUBJECT: BART Operating Subsidy This memorandum summarizes and
May 31, 2016 Financial Report
 2016 May 31, 2016 Financial Report Capital Metropolitan Transportation Authority 7/13/2016 Table of Contents SUMMARY REPORTS Budgetary Performance - Revenue 2 - Sales Tax Revenue 6 - Operating Expenses
TSCC Budget Review TriMet
 TSCC Budget Review 2017-18 TriMet 1. Introduction to the District: The Tri-County Metropolitan Transportation District (TriMet) boundary covers about 575 square miles of the urban portions of Multnomah,
TAXICAB INDUSTRY REPORT
 DRAFT TAXICAB INDUSTRY REPORT RATES OF FARE & GATE FEES City and County of San Francisco Office of the Controller December 2005 TABLE OF CONTENTS I - EXECUTIVE SUMMARY...2 Key Industry Findings Summary...
2018 Regional Transportation Improvement Program: Amendment No. 1
 2018 Regional Transportation Improvement Program: Amendment No. 1 Transportation Committee Item 4 January 18, 2019 Summary of Changes 2 Transportation Committee Item 4 January 18, 2019 1 RTIP Project Tables
SAN MATEO COUNTY TRANSIT DISTRICT FY2019 PROPOSED OPERATING BUDGET FY19
 FY2019 OPERATING FORECAST SOURCES OF FUNDS: Operating Revenues 1 Passenger Fares 17,040,333 16,977,116 15,917,012 16,457,750 540,738 3.4% 1 2 Local TDA and STA Funds 41,352,423 42,013,473 42,013,473 47,485,688
Balancing the Transportation Needs of a Growing City
 Balancing the Transportation Needs of a Growing City FY 2019 and FY 2020 Operating Budget SFMTA Board Meeting Ed Reiskin, Director of Transportation March 20, 2018 1 Revises Baselines: FY 2019-2020 ($
GOVERNANCE AND AUDIT COMMITTEE AGENDA
 GOVERNANCE AND AUDIT COMMITTEE Thursday, November 1, 2018 4:00 PM Conference Room 157 County Government Center 70 West Hedding Street San Jose, CA AGENDA CALL TO ORDER 1. ROLL CALL 2. PUBLIC PRESENTATIONS:
Regional Transportation District FasTracks Financial Plan. April 22,
 Regional Transportation District FasTracks Financial Plan April 22, 2004 2-1 Executive Summary The Regional Transportation District (the District or RTD ), has developed a comprehensive $4.7 billion Plan,
METROPOLITAN TRANSIT AUTHORITY OF HARRIS COUNTY, TEXAS. Independent Accountants Report on Applying Agreed-Upon Procedures
 METROPOLITAN TRANSIT AUTHORITY OF HARRIS COUNTY, TEXAS Independent Accountants Report on Applying Agreed-Upon Procedures Year ended September 30, 2012 KPMG LLP 811 Main Street Houston, TX 77002 Independent
Valley Metro Fiscal Year 2014 Financial Results. Budget and Finance Subcommittee October 9, 2014
 Valley Metro Fiscal Year 2014 Financial Results Budget and Finance Subcommittee October 9, 2014 Regional Fixed Route Bus Ridership 3-Year Comparison Regional Fixed Route Bus Average Daily Ridership Light
Strategic Plan Performance Metrics & Targets
 San Francisco Municipal Transportation Agency Strategic Plan Performance Metrics & Targets Fiscal Year 2019 Fiscal Year 2020 March 2018 SAFETY Goal 1: Create a safer transportation experience for everyone.
TEX Rail Fort Worth, Texas Project Development (Rating Assigned November 2012)
") TEX Rail Fort Worth, Texas Project Development (Rating Assigned November 2012) Summary Description Proposed Project: Commuter Rail 37.6 Miles, 14 Stations (12 new, two existing) Total Capital Cost ($YOE):
TEX Rail Fort Worth, Texas Project Development (Rating Assigned November 2012) Summary Description Proposed Project: Commuter Rail 37.6 Miles, 14 Stations (12 new, two existing) Total Capital Cost ($YOE):
2013 Triennial Customer Survey Results
 2013 Triennial Customer Survey Results Board of Directors May 1, 2014 Objectives Determine who our customers are Demographics Trip purpose Mode of access Frequency of use Reasons for riding Measure whether
August 31, 2016 Financial Report
 August 31, 2016 Financial Report Capital Metropolitan Transportation Authority 10/14/2016 Table of Contents SUMMARY REPORTS Budgetary Performance - Revenue 2 - Sales Tax Revenue 6 - Operating Expenses
The Price of Inaction
 The Price of Inaction Economic Impact of SEPTA s Plan B Service Cuts and Fare Increases May 2007 Economy League of Greater Philadelphia April 2007 Agenda 1. Background: How did SEPTA get here? 2. The SEPTA
SOUND TRANSIT STAFF REPORT MOTION NO. M Select a draft Sounder fare structure change and fare increase for public review and comment
 SOUND TRANSIT STAFF REPORT MOTION NO. M2007-21 Select a draft Sounder fare structure change and fare increase for public review and comment Meeting: Date: Type of Action: Staff Contact: Phone: Finance
April 30, 2016 Financial Report
 2016 April 30, 2016 Financial Report Capital Metropolitan Transportation Authority 6/15/2016 Table of Contents SUMMARY REPORT Budgetary Performance - Revenue 2 - Sales Tax Revenue 6 - Operating Expenses
Employer-Based Commuter Benefits Programs: How they Work and their Impacts February 9, 2017
 Employer-Based Commuter Benefits Programs: How they Work and their Impacts February 9, 2017 Michael Grant ICF Purpose / Overview Understanding types of commuter benefits programs What they are, how they
2.0 PROJECT FINANCIAL PLAN...
 Table of Contents Table of Contents 1.0 INTRODUCTION... 1-1 1.1 Purpose of Financial Plan... 1-1 1.2 Key Changes Since 2010 Financial Plan... 1-2 1.3 Project Description... 1-4 1.4 Project Sponsor: Los
Proposed Budget Fiscal Year 2010 July 1, 2009 June 30, 2010
 Proposed Budget Fiscal Year 2010 July 1, 2009 June 30, 2010 Presented to the Board of Directors: Finance, Administration, and Oversight Committee January 8, 2009 1 General Manager s Overview And Summary
FY 2013 and FY 2014 Proposed Operating Budget An Investment in Maintenance. April 3, 2012 SAN FRANCISCO, CALIFORNIA
 FY 2013 and FY 2014 Proposed Operating An Investment in Maintenance April 3, 2012 SAN FRANCISCO, CALIFORNIA Introduction FY 2013-2014 Proposed Operating Revenues Expenditures An investment in maintenance
Balancing the Transportation Needs of a Growing City
 Balancing the Transportation Needs of a Growing City FY 2019 and FY 2020 Operating Budget SFMTA Board Meeting Ed Reiskin, Director of Transportation February 20, 2018 1 Moving San Francisco: At a Glance
FY 2013 and FY 2014 Preliminary Operating Budget (As of mid February 2012) February 21, 2012 SAN FRANCISCO, CALIFORNIA
 February 21, 2012 SAN FRANCISCO, CALIFORNIA") FY 2013 and FY 2014 Preliminary Operating (As of mid February 2012) February 21, 2012 SAN FRANCISCO, CALIFORNIA Introduction FY 2013-2014 Preliminary Operating Revenues Expenditures New Programs Additional
FY 2013 and FY 2014 Preliminary Operating (As of mid February 2012) February 21, 2012 SAN FRANCISCO, CALIFORNIA Introduction FY 2013-2014 Preliminary Operating Revenues Expenditures New Programs Additional
Federal Assistance 13% Charges for Services 5% Appropriated Fund Balance.5% Other 3% Administration 6% Building Maintenance 3% Other 2%
 TRANSIT FUND The Transit Fund is used to account for the operations of the Town s public transit system. Federal Assistance 13% Transit Revenues State Assistance 12% Charges for Services 5% Appropriated
Introduction Project Overview How Express Lanes Work 101 Managed Lane Financial Forecast Performance Comparison Ownership Considerations Transit
 Joint Board Ownership Workshop November 16, 2018 1 Introduction Project Overview How Express Lanes Work 101 Managed Lane Financial Forecast Performance Comparison Ownership Considerations Transit Equity
8. FINANCIAL ANALYSIS
 8. FINANCIAL ANALYSIS This chapter presents the financial analysis conducted for the Locally Preferred Alternative (LPA) selected by the Metropolitan Transit Authority of Harris County (METRO) for the.
Cincinnati Streetcar: Options & Recommendations for Funding Operations
 Cincinnati Streetcar: Options & Recommendations for Funding Operations Table of Contents Background & Context... 3 Cincinnati Streetcar at a Glance... 4 Operating Model... 5 Operating Expenses: Estimates
FY19 Budget - Discussion. April 2018
 FY19 Budget - Discussion April 2018 FY19 Proposed Budget: $6.6 Billion General Planning & Programs 3% Identify regional mobility needs and solutions Debt Service 6% Obligations from current and past projects
Balancing the Transportation Needs of a Growing City
 Balancing the Transportation Needs of a Growing City FY 2019 and FY 2020 Operating Budget SFMTA Board Meeting Ed Reiskin, Director of Transportation March 6, 2018 1 Guiding Principles: FY 2013-2018 Vision:
JP Morgan Public Finance Transportation Utility Conference
 JP Morgan Public Finance Transportation Utility Conference April 18-19, 2018 Presented by: Brenden Morgan Sr. Manager of Debt & Investments Table of Contents I. Overview of the Region and RTD II. Updates
Financial Plan. Section 8 STATUS QUO PLAN STATUS QUO PLAN ASSUMPTIONS STATUS QUO PLAN BUDGET ITEMS
 Section 8 Financial Plan This final section of the TDP contains the financial information with regard to the improvements described in Section 7, Alternatives. The financial information is divided into
Program Evaluation and Audit COUNTY CONTRACTOR ADA COST REVIEW DARTS AND SCOTT COUNTY
 Program Evaluation and Audit COUNTY CONTRACTOR ADA COST REVIEW DARTS AND SCOTT COUNTY October 27, 2006 Background INTRODUCTION The Metropolitan Council contracts with four County governments (Anoka, Dakota,
Public Transportation Department Anchorage: Performance. Value. Results.
 Anchorage: Performance. Value. Results. Mission Serve Anchorage residents and visitors by providing public transportation that emphasizes quality, safety, cost effectiveness, and economic vitality. Core
Transit Subsidy. Mission Statement. Mandates
 Mission Statement The Potomac and Rappahannock Transportation Commission (PRTC) is a multi-jurisdictional agency representing Prince William, Stafford, and Spotsylvania Counties and the Cities of Manassas,
San Francisco Paratransit
 San Francisco Paratransit Addendum #1 SF Paratransit Van Services: SFMTA/DAAS Group Van, & DAAS Shopping Shuttle No. 16-493-001 October 28, 2016 Proposal Submission Deadline: Wednesday, November 9, 2016
University Link LRT Extension
 (November 2007) The Central Puget Sound Regional Transit Authority, commonly known as Sound Transit, is proposing to implement an extension of the Central Link light rail transit (LRT) Initial Segment
The Charles County Board of Education Conference and T ravel Pr ocedures
 Type text] 2 01 9 9 The Charles County Board of Education Conference and T ravel Pr ocedures Office of Fi scal Services Revised 1/ 01 / 2019 The Charles County Public Schools (CCPS) travel guidelines should
DART Fare Structure Programs
 DART Fare Structure Programs Budget & Finance Committee November 13, 2018 Joseph G. Costello Senior Vice President, Finance 0 Calendar Date Nov 13 Dec 11 Jan 22 Feb 26 Mar 26 Apr 23 May 28 Jun 18 Jul 18
To: Administration and Finance Committee Date: February 3, SUBJECT: Independent Auditor s Report on National Transit Database Report Form FFA-10
 To: Administration and Finance Committee Date: February 3, 2016 From: Erick Cheung Reviewed By: Director of Finance SUBJECT: Independent Auditor s Report on National Transit Database Report Form FFA-10
Contracts Administration Management Action Plan Status June 20, 2013
 Related to Agenda Item W1 Contracts Administration Management Action Plan Status June 20, 2013 Background In January 2012, the Board authorized an on-call management and consulting services contract with
The Charles County Board of Education Conference and Travel Procedures
 Type text] 2016 The Charles County Board of Education Conference and Travel Procedures Office of Finance and Business Revised 12/11/2015 The Charles County Public Schools (CCPS) travel guidelines are intended
SFMTA Board Presentation January 16, 2018
 SFMTA Board Presentation January 16, 2018 About the SFMTA VISION San Francisco: great city, excellent transportation choices. Our Strategic Plan: Goal 1: Create a safer transportation experience for everyone.
CAPITAL PROGRAM COMMITTEE AGENDA
 CALL TO ORDER 1. ROLL CALL CAPITAL PROGRAM COMMITTEE Thursday, June 28, 2018 12:00 PM VTA Conference Room B-106 3331 North First Street San Jose, CA AGENDA 2. Welcome remarks from the General Manager/CEO,
FINANCIAL FORECAST FY15 BUDGET FORECAST AND FINANCIAL ANALYSIS
 FINANCIAL FORECAST FY15 BUDGET FORECAST AND FINANCIAL ANALYSIS Fall 2013 Financial Analysis & Grants Administration Department, Fall 2013 Tri-County Metropolitan Transportation District of Oregon Fall
Strategic Plan Progress Report Goal 3 Focus. November 2016 San Francisco, California
 Strategic Plan Progress Report Goal 3 Focus November 2016 San Francisco, California 1 Goal 3 focus Improve the environment and quality of life in San Francisco Objective 3.1 Reduce the Agency s and the
Caltrain Funding 101
 Caltrain Funding 101 Prepared for: SFMTA Board Meeting Prepared by: Caltrain Staff Date: February 7, 2012 Caltrain Funding 101 Overview Funding contribution is guided by Joint Powers Agreement Funding
MARTA 2009 Budget Summary Review
 MARTA 2009 Budget Summary Review 1 Transit Budgeting Strategies Internal Productivity & Cost Containment Fare Changes New Revenue Sources Transit Service Levels 2 The Budget Context Eliminate Legacy MARTA
System Performance Summary for FY 2016/17 Fixed Route
 System Performance Summary for FY 216/17 This report summarizes the unaudited oational formance of Marin Transit local transit services for FY 216/17, and compares these results to the District s route
20 Years of Commuter Benefits: Where We've Been and Where We're Going
 December 19, 2006 20 Years of Commuter Benefits: Where We've Been and Where We're Going By Larry Filler President and CEO, TransitCenter Inc This summer, as gas prices reached a national average of nearly
Whatcom Transportation Authority
 Whatcom Transportation Authority Annual Budget 12/14/2017 This Page Intentionally Left Blank Whatcom Transportation Authority (WTA) Annual Budget Table of Contents General Manager s Budget Message... 2
FY METROLINK BUDGET AND LACMTA'S COMMUTER RAIL PROGRAM
 9 One Gateway Plaza Los Angeles, CA 90012-2952 213.922.2ooo Tel metro. net FINANCE, BUDGET AND AUDIT COMMITTEE JUNE 19, 2013 SUBJECT: ACTION: FY 2013-14 METROLINK BUDGET AND LACMTA'S COMMUTER RAIL PROGRAM
The Future Scenarios
 The Future Scenarios Developing the Scenarios Once the policy approach for each scenario was defined, the financial, service, and capital assumptions were developed further and are detailed in three supporting
Strategic Performance measures
 Strategic Performance measures 2012 RepoRt background In 2007, the RTA worked with CTA, Pace, and Metra as well as other community stakeholders to develop a Regional Transportation Strategic Plan. This
Cash & Liquidity The chart below highlights CTA s cash position at June 2014 compared to June 2013.
 To: Chicago Transit Authority Board From: Ron DeNard, Chief Financial Officer Re: Financial Results for June 2014 Date: August 13, 2014 I. Summary CTA s financial results are $4.0 million favorable for
ONBOARD ORIGIN-DESTINATION STUDY
 REPORT ONBOARD ORIGIN-DESTINATION STUDY 12.23.2014 PREPARED FOR: ANCHORAGE METROPOLITAN AREA TRANSPORTATION SYSTEM (AMATS) 55 Railroad Row White River Junction, VT 05001 802.295.4999 www.rsginc.com SUBMITTED
CHAPTER 7: Financial Plan
 CHAPTER 7: Financial Plan Report Prepared by: Contents 7 FINANCIAL PLAN... 7-1 7.1 Introduction... 7-1 7.2 Assumptions... 7-1 7.2.1 Operating Revenue Assumptions... 7-2 7.2.2 Operating Cost Assumptions...
May 1, Dear Board of Directors:
 May 1, 2018 Dear Board of Directors: As you know, Sound Transit is undertaking an ambitious effort to build a transformative mass transit system for the Puget Sound Region. Your involvement in that effort
FTA Rural and Tribal NTD Overview and Updates. December 12, 2018
 FTA Rural and Tribal NTD Overview and Updates December 12, 2018 Introductions Margaret (Maggie) Schilling Program Manager FTA National Transit Database Murtaza Naqvi Transportation Data Analyst, FTA Program
Finance & Audit Committee Budget Work Session. September 19, 2018
 Finance & Audit Committee Budget Work Session September 19, 2018 1 Safety Minute Dave Goeres 2 3 Introduction & Strategic Priorities Steve Meyer 4 Strategic Focus Areas 5 Customer Experience Created a
FINANCE/AUDIT COMMITTEE AGENDA October 25, :00 a.m. 12:00 a.m. Wellness Center SunLine Transit Agency Thousand Palms, CA
 FINANCE/AUDIT COMMITTEE AGENDA October 25, 2017 11:00 a.m. 12:00 a.m. Wellness Center SunLine Transit Agency Thousand Palms, CA Public Comments will be accepted on each Agenda item upon the conclusion
COOPERATIVE AGREEMENT FY 2004/05 VENTURA INTERCITY SERVICE TRANSIT AUTHORITY (VISTA) CONEJO CONNECTION
 CONEJO CONNECTION") COOPERATIVE AGREEMENT FY 2004/05 VENTURA INTERCITY SERVICE TRANSIT AUTHORITY (VISTA) CONEJO CONNECTION This Agreement is made and entered into by the City of Calabasas (Calabasas) and the Ventura County
COOPERATIVE AGREEMENT FY 2004/05 VENTURA INTERCITY SERVICE TRANSIT AUTHORITY (VISTA) CONEJO CONNECTION This Agreement is made and entered into by the City of Calabasas (Calabasas) and the Ventura County
METROPOLITAN COUNCIL SUMMARY BUDGET-BY FUND TYPE TRANSPORTATION DIVISION 2007
 METROPOLITAN COUNCIL SUMMARY BUDGET-BY FUND TYPE TRANSPORTATION DIVISION 2007 Governmental Fund Types Special Revenue Funds Proprietary Fund Types Enterprise Fund Transportatio n Planning & TDM Activity
QUALITY TRANSPORTATION SUMMARY
 QUALITY TRANSPORTATION SUMMARY Quality Transportation Overview... 126 Department of Transportation... 127 Traffic Field Operations... 129 Winston-Salem Transit Authority... 131 Quality Transportation Non-Departmental...
Minimum Wage Regional Recommendation June 9, 2016
 AGENDA ITEM #10.D Minimum Wage Regional Recommendation June 9, 2016 Minimum Wage Subcommittee Greg Scharff Rod Sinks History Cities Association priority in 2015 & 2016 June 2015 Cities Association position:
RIVERSIDE TRANSIT AGENCY 1825 Third Street Riverside, CA April 28, 2005
 RIVERSIDE TRANSIT AGENCY 1825 Third Street Riverside, CA 92507 April 28, 2005 TO: THRU: FROM: SUBJECT: Summary: BOARD OF DIRECTORS Larry Rubio, Chief Executive Officer Chris Gallanes, Chief Financial Officer
FY17 Budget Discussion
 FY17 Budget Discussion Metro is Everywhere Metro is a lot more than buses and trains. Anyone who has boarded a bus or a train, driven on the freeway, used the toll roads, stopped at a traffic signal, or