FINANCE/AUDIT COMMITTEE AGENDA October 25, :00 a.m. 12:00 a.m. Wellness Center SunLine Transit Agency Thousand Palms, CA
|
|
|
- Leo Shaw
- 5 years ago
- Views:
Transcription

1 FINANCE/AUDIT COMMITTEE AGENDA October 25, :00 a.m. 12:00 a.m. Wellness Center SunLine Transit Agency Thousand Palms, CA Public Comments will be accepted on each Agenda item upon the conclusion of the staff report on that item. Public comments on non-agendized items will be accepted during the Public comments section. Comments may be limited to 3 minutes in length. Please notify the Committee Chair if you wish to comment.) 1. Call to Order 2. Roll Call 3. Confirmation of Agenda 4. Presentations Procurement Presentation (Staff: Eric Taylor) 5. Public Comments Anyone wishing to address the Finance/Audit Committee on items not on the Agenda should do so at this time. Each presentation is limited to three minutes. 6. Committee Member Comments RECEIVE AND FILE Fiscal Year 2017 Audit Reports Receive & File (Greg Pettis, Chair of Finance/Audit Committee; Staff: Luis Garcia, Deputy Chief Financial Officer) Recommend that the Board of Directors receive and file the fiscal year 2017 audit reports. The audits were completed by Vasquez & Company, LLP and include financial audits for SunLine Transit Agency and SunLine Services Group as well as a Single Audit for SunLine Transit Agency. (Page 1-86) 8. Consent Calendar Receive & File All items on the Consent Calendar will be approved by one motion, and there will be no discussion of individual items unless a Board Member requests a specific item be pulled from the calendar for separate discussion. The public may comment on any item.
2 a) Checks over $1,000 report for August 2017 (Page 87-90) b) Credit Card Statement for August 2017 (Page 91-94) c) Monthly Budget Variance Report for August 2017 (Page 95-99) d) Contracts Signed in Excess of $25,000 September 2017 (Page 100) e) Union & Non Union Pension Investment Asset Summary August 2017 (Page ) f) Ridership Report for September 2017 (Page ) g) SunDial Operational Notes for September 2017 (Page ) h) Metrics (On time Performance, Early Departures, Late Departures, Late Cancellations, Driver Absence, Advertising Revenue, Fixed Route Customer Comments, Paratransit Customer Comments) September 2017 (Page ) i) Quarterly Capital Project Update for 3 rd Quarter 2017 (Page ) j) Board Member Attendance for September 2017 (Page 119) ACTION Affordable Housing and Sustainable Communities Approve (Greg Pettis, Chair of Finance/Audit Committee; Staff: Rudy LeFlore, Chief of Performance) Recommend that the Board of Directors grant authority to the CEO/General Manager to execute all documents necessary to support the submission of a grant application in conjunction with the City of Coachella for the Affordable Housing and Sustainable Communities grant as well as the Infill Infrastructure Grant program. (Page 120) 10. Contracted Support For Rethink Effort Approve (Greg Pettis, Chair of Finance/Audit Committee; Staff: Rudy LeFlore, Chief of Performance) Recommend that the Board of Directors authorize the General Manager to Negotiate and Execute an agreement with HDR in an amount Not To Exceed $425,000 subject to approval as to form by SunLine Counsel. (Page ) 11. Approval of Contract for Telephone System Support Approve (Greg Pettis, Chair of Finance/Audit Committee; Staff: Joseph Friend, IT Administrator) Recommend that the Board of Directors delegate authority to the CEO/General Manager to execute a 3-year contract with Packet Fusion for Telephone System Support with a not to exceed amount of $26,014. (Page ) 12. Approval of Contract for Internet Service Approve (Greg Pettis, Chair of Finance/Audit Committee; Staff: Joseph Friend, IT Administrator) Recommend that the Board of Directors delegate authority to the CEO/General Manager to execute a 3-year contract with Spectrum Enterprise (formerly Time Warner Business) for Internet Services with a not to exceed amount of $108,800. (Page 126) 13. Adjourn
3 SunLine Transit Agency DATE: October 25, 2017 RECEIVE AND FILE TO: FROM: RE: Finance/Audit Committee Board of Directors Deputy Chief Financial Officer Fiscal Year 2017 Audit Reports Recommendation Recommend that the Board of Directors receive and file the fiscal year 2017 audit reports. The audits were completed by Vasquez & Company, LLP and include financial audits for SunLine Transit Agency and SunLine Services Group as well as a Single Audit for SunLine Transit Agency. Background The Joint Powers Agreement requires SunLine Transit Agency and SunLine Services Group to have an independent audit of its finances conducted annually. In addition, State Law requires that recipients of Transportation Development Act (TDA) funds undergo an annual fiscal audit. TDA funds comprise the majority of SunLine s Operating revenues, which are dispersed by Riverside County Transportation Commission (RCTC), the planning agency for SunLine. Additionally, the Code of Federal Regulations (2 CFR Part 200) requires an entity that expends more than $750,000 in Federal awards during a fiscal year to undergo a Single Audit. This audit requirement further ensures that Federal funds are expended properly. Submission of the Single Audit is required nine (9) months following the end of the entity s fiscal year. Luis Garcia
4 SunLine Transit Agency Audited Financial Statements As of and for the Years Ended June 30, 2017 and 2016 with Report of Independent Auditors
5 SunLine Transit Agency Audited Financial Statements As of and for the Years Ended June 30, 2017 and 2016 with Report of Independent Auditors
6 SunLine Transit Agency Table of Contents PAGE REPORT OF INDEPENDENT AUDITORS 1 MANAGEMENT S DISCUSSION AND ANALYSIS 4 FINANCIAL STATEMENTS Statements of Net Position 13 Statements of Revenues, Expenses, and Changes in Net Position 14 Statements of Cash Flows 15 Notes to Financial Statements 16 REQUIRED SUPPLEMENTARY INFORMATION Schedule of Changes in the Net Pension Liability and Related Ratios 37 Schedule of Contributions Bargaining Plan 38 Schedule of Contributions Non-Bargaining Plan 39 SUPPLEMENTARY INFORMATION Combining Statements of Net Position 40 Combining Statements of Revenues, Expenses, and Changes in Net Position 41 Combining Statements of Cash Flows 42 REPORT OF INDEPENDENT AUDITORS ON INTERNAL CONTROL OVER FINANCIAL REPORTING AND ON COMPLIANCE AND OTHER MATTERS BASED ON AN AUDIT OF FINANCIAL STATEMENTS PERFORMED IN ACCORDANCE WITH GOVERNMENT AUDITING STANDARDS 43
7 Report of Independent Auditors Board of Directors Sunline Transit Agency Thousand Palms, California Report on the Financial Statements We have audited the accompanying financial statements of SunLine Transit Agency (STA), which comprise the statements of net position as of June 30, 2017 and 2016 and the related statements of revenues, expenses and changes in net position, and cash flows for the years then ended, and the related notes to financial statements. Management s Responsibility for the Financial Statements Management is responsible for the preparation and fair presentation of these financial statements in accordance with accounting principles generally accepted in the United States of America; this includes the design, implementation, and maintenance of internal control relevant to the preparation and fair presentation of financial statements that are free from material misstatement, whether due to fraud or error. Auditors Responsibility Our responsibility is to express an opinion on these financial statements based on our audits. We conducted our audits in accordance with auditing standards generally accepted in the United States of America and the standards applicable to financial audits contained in Government Auditing Standards, issued by the Comptroller General of the United States. Those standards require that we plan and perform the audits to obtain reasonable assurance about whether the financial statements are free from material misstatement. An audit involves performing procedures to obtain audit evidence about the amounts and disclosures in the financial statements. The procedures selected depend on the auditor s judgment, including the assessment of the risks of material misstatement of the financial statements, whether due to fraud or error. In making those risk assessments, the auditor considers internal control relevant to the entity s preparation and fair presentation of the financial statements in order to design audit procedures that are appropriate in the circumstances, but not for the purpose of expressing an opinion on the effectiveness of the entity s internal control. Accordingly, we express no such opinion. An audit also includes evaluating the appropriateness of accounting policies used and the reasonableness of significant accounting estimates made by management, as well as evaluating the overall presentation of the financial statements. We believe that the audit evidence we have obtained is sufficient and appropriate to provide a basis for our audit opinion. 1
8 Opinion In our opinion, the financial statements referred to above present fairly, in all material respects, the financial position of SunLine Transit Agency as of June 30, 2017 and 2016, and the changes in its financial position, and its cash flows for the years then ended in accordance with accounting principles generally accepted in the United States of America. Other Matters Required Supplementary Information Accounting principles generally accepted in the United States of America require that the management s discussion and analysis on pages 4 through 12, and the schedule of changes in the net pension liability and related ratios and schedules of contributions on pages 37 through 39 be presented to supplement the basic financial statements. Such information, although not a part of the basic financial statements, is required by the Governmental Accounting Standards Board, who considers it to be an essential part of financial reporting for placing the basic financial statements in an appropriate operational, economic, or historical context. We have applied certain limited procedures to the required supplementary information in accordance with auditing standards generally accepted in the United States of America, which consisted of inquiries of management about the methods of preparing the information and comparing the information for consistency with management s responses to our inquiries, the basic financial statements, and other knowledge we obtained during our audit of the basic financial statements. We do not express an opinion or provide any assurance on the information because the limited procedures do not provide us with sufficient evidence to express an opinion or provide any assurance. Other Information Our audits were conducted for the purpose of forming an opinion on the financial statements as a whole. The combining statements of net position, revenues, expenses and changes in net position and cash flows, are presented for purposes of additional analysis and are not a required part of the financial statements. The combining statements of net position, revenues, expenses and changes in net position and cash flows are the responsibility of management and were derived from and relate directly to the underlying accounting and other records used to prepare the financial statements. Such information has been subjected to the auditing procedures applied in the audit of the financial statements and certain additional procedures, including comparing and reconciling such information directly to the underlying accounting and other records used to prepare the financial statements or to the financial statements themselves, and other additional procedures in accordance with auditing standards generally accepted in the United States of America. In our opinion, the combining statements of net position, revenues, expenses and changes in net position and cash flows are fairly stated in all material respects in relation to the financial statements as a whole. 2
9 Other Reporting Required by Government Auditing Standards In accordance with Government Auditing Standards, we have also issued our report dated September 28, 2017 on our consideration of STA s internal control over financial reporting and on our tests of its compliance with certain provisions of laws, regulations, contracts, and grant agreements and other matters. The purpose of that report is solely to describe the scope of our testing of internal control over financial reporting and compliance and the results of that testing, and not to provide an opinion on the effectiveness of STA s internal control over financial reporting or on compliance. That report is an integral part of an audit performed in accordance with Government Auditing Standards in considering STA s internal control over financial reporting and compliance. Los Angeles, California September 28,
10 SunLine Transit Agency Management s Discussion and Analysis Years ended June 30, 2017 and 2016 The management of SunLine Transit Agency (STA) offers readers of the STA's financial statements narrative overview and analysis of the financial activities of STA for the fiscal years (FY) ended June 30, 2017 and We encourage readers to consider the information presented here in conjunction with the audited financial statements including the notes to the financial statements. FINANCIAL HIGHLIGHTS The combined assets of STA exceeded its liabilities (net position) at the close of the fiscal year by $53,140,341 for 2017 and $51,292,475 for Net position at June 30, 2017 consists of $52,959,688 of net position invested in capital assets and $180,653 of unrestricted net position. STA's combined net position increased in fiscal year 2017 by $1,847,866. The increase is mainly attributed to increase in capital contributions that funded the capital projects and revenues generated more than expenses. This amount is higher than the change in net position in fiscal year 2016 which was a decrease of $2,136,737. STA received less capital grants for capital projects in fiscal year In fiscal year 2017, salaries and employee benefits and other costs (services and utilities) are higher than fiscal year 2016 due to across the board salary increase of 3% in bargaining, varied non-bargaining salary increases, new positions added to meet the growing demand for transit services, new initiatives and capital programs. Casualty and liability costs decreased in 2017 due to decrease in workers compensation and general liability claims. Fiscal year 2017 depreciation expense is higher than fiscal year 2016 due to increase in capital projects closed at the end of fiscal year OVERVIEW OF THE FINANCIAL STATEMENTS This discussion and analysis are intended to serve as an introduction to STA's financial statements. STA's basic financial statements consist of two components: Financial statements; Notes to the basic financial statements. This report also contains other supplementary information in addition to the financial statements. Financial Statements. The financial statements are designed to provide readers with a broad overview of STA's finances, in a manner similar to a private sector business. The Statement of Net Position presents information on all of STA's assets and liabilities, with the difference between the two reported as net position. Over time, increases or decreases in net position may serve as a useful indicator of whether STA's financial position is improving or deteriorating. The presentation of net position also distinguishes between those invested in capital assets, those that are restricted by external parties or legal requirements, or those that are unrestricted and can be used for any Agency purpose. The Statement of Revenues, Expenses, and Changes in Net Position provide information regarding the revenues generated and earned (passenger fares and grants) and the expenses incurred related to those revenues. The difference between the revenues and expenses represents the change in net position, or profitability as reflected by the amount of change in net position generated for the fiscal year. 4
11 SunLine Transit Agency Management s Discussion and Analysis Years ended June 30, 2017 and 2016 The Statement of Cash Flows presents information on STA's sources and uses of cash and the overall change in cash and cash equivalents over the fiscal year. These activities are categorized by the different activities in which STA engages: operating activities, noncapital financing activities, capital and related financing activities, and investing activities. Since STA's primary function is to provide transportation services to the region's citizens and recover costs through user fees and charges, the financial statements include business-type activities. In addition, the financial statements include the financial statements of STA (known as primary government), and another legally separate entity, for which STA is financially accountable for: SunLine Services Group (SSG). Notes to Financial Statements The notes provide information on significant accounting policies, cash and investments, governmental subsidies, inventory, capital assets, long-term obligations, unearned revenue, risk management, retirement plans, and other areas for a full understanding of the data in the financial statements. Other Information In addition to the financial statements and accompanying notes, this report also presents certain required supplementary information concerning STA's progress in funding its obligation to provide pension benefits to its employees. FINANCIAL STATEMENT ANALYSIS Net Position As stated earlier, increases or decreases in net position over time may serve as a useful indicator of STA's financial position. At June 30, 2017, STA's assets exceeded liabilities by $53,140,341, a $1,847,866 increase from June 30, A condensed summary of the Statements of Net Position as of June 30, 2017 and 2016 is shown below: Changes Current and other assets $ 16,816,689 $ 10,949,708 $ 5,866,981 Capital assets 52,959,688 51,170,410 1,789,278 Deferred outflows of resources 2,782,255 3,957,884 (1,175,629) Total assets and deferred outlfows of resources 72,558,632 66,078,002 6,480,630 Current liabilities 13,634,974 8,548,959 5,086,015 Long-term liabilities 3,499,047 4,975,042 (1,475,995) Deferred inflows of resources 2,284,270 1,261,526 1,022,744 Total liabilities and deferred inflows of resources 19,418,291 14,785,527 4,632,764 Net position Net investment in capital assets 52,959,688 51,170,410 1,789,278 Unrestricted 180, ,065 58,588 Total net position $ 53,140,341 $ 51,292,475 $ 1,847,866 5
12 SunLine Transit Agency Management s Discussion and Analysis Years ended June 30, 2017 and 2016 STA's investment in capital assets (e.g. buses, support vehicles, passenger facilities/structures, and peripheral equipment for operations, maintenance, and administrative support) reflects the largest portion of STA's net position. STA uses these capital assets to provide transportation services to the surrounding communities, as well as maintain the necessary service infrastructure. Because of this, these assets are not available for future spending. The increase of $1,789,278 in net investment in capital assets at June 30, 2017 resulted primarily from additions to capital assets related to battery dominant fuel cell bus project, replacement of revenue vehicles, rehabilitation of buses, and other small projects in STA's capital program. Unrestricted net position represents the portion of net position that can be used to finance day-today operations without constraints by debt covenants, enabling legislation, or other legal requirements. Unrestricted net position increased by $58,588, changed from $122,065 at June 30, 2016 to $180,653 at June 30, The increase in net position is due to SSG s revenues generated which exceeded operating expenses (net of depreciation) during fiscal year Changes in Net Position For the fiscal years ended June 30, 2017 and 2016, STA's combined revenues were $42,543,268 and $36,944,982, respectively, while the total controllable expenses, excluding vehicle operating lease, depreciation and gain on sale of fixed assets were $33,188,527 and $31,942,873, respectively. Grants finance a significant portion of the transit operations. The table below represents condensed financial data related to the changes in net position of $1,847,866 and ($2,136,737) during the fiscal years ended June 30, 2017 and 2016, respectively. The significant decrease in net position in 2016 was due to decrease in capital contributions that funded STA s capital projects Changes Revenues Passenger fares $ 3,055,022 $ 3,200,299 $ (145,277) CNG and hydrogen fuel sales 3,125,917 3,299,395 (173,478) Operating Grants 26,170,975 24,483,495 1,687,480 Capital Grants 9,295,954 5,012,097 4,283,857 Interest and other revenues 895, ,696 (54,296) Total revenues 42,543,268 36,944,982 5,598,286 Controllable Operating Expenses Salaries and benefits 24,043,772 22,331,808 1,711,964 Services 2,738,982 2,281, ,389 Materials and supplies 1,688,687 1,601,597 87,090 Utilities 1,956,125 1,698, ,205 Casualty and liability costs 1,421,017 2,801,076 (1,380,059) Fuel and Lubricants 274, ,112 61,949 Tires 213, ,948 14,085 Taxes 194, ,862 6,362 Administrative 166, ,591 (109,009) Miscellaneous 492, , ,678 Total controllable operating expenses 33,188,527 31,942,873 1,245,654 Depreciation and Lease Vehicle lease 258, ,178 Depreciation 7,248,697 7,138, ,851 Total expenses 40,695,402 39,081,719 1,613,683 Changes in Net Position 1,847,866 (2,136,737) 3,984,603 Net position Beginning of year 51,292,475 53,429,212 (2,136,737) Ending of year $ 53,140,341 $ 51,292,475 $ 1,847,866 6
13 SunLine Transit Agency Management s Discussion and Analysis Years ended June 30, 2017 and 2016 Revenues The national trends in fixed route ridership have shown decreasing ridership. As such, passenger fare revenues decreased in fiscal year 2017 by $145,277 due to continuing decline in ridership. CNG and hydrogen fuel revenues which reflect outside fuel revenues, state emission credits and CNG rebates decreased in fiscal year 2017 by $173,478 compared to fiscal year 2016 due to a lack of support in continuation of the Federal CNG rebates in fiscal year Operating grants in fiscal year 2017 increased by $1,687,480 due to the increase in LTF funding which was offset by a decrease in Measure A funds, Low-Carbon Transit Operations Program (LCTOP) funds and operating subsidy from federal grants assistance. Fiscal year 2016 operating grants were also higher than fiscal year 2015 due to increases in LTF funding, Measure A funds, LCTOP funds and receipt of Federal 5310 operating assistance offset by decrease in other state and federal assistance. Capital grants in fiscal year 2017 increased by $4,283,857 due to increase in capital projects. Projects in fiscal year 2017 included replacement of 15 para-transit vans, 4 replacement and 2 expansion of fixed route buses, purchase of 1 supervisor vehicle, installation of 25 bus shelters, intelligent transportation systems upgrade, facility improvements, equipment, fuel cell buses service maintenance, commencement of Hydrogen Low No Emission Fuel Cell buses and continuation of the battery dominant fuel cell bus project. The intelligent transportation systems upgrade and rehabilitation of buses were completed in Projects in fiscal year 2016 included replacement of 4 para-transit vans, rehabilitation of buses, intelligent transportation systems upgrade, and commencement of the battery dominant fuel cell bus. The rolling stock purchases, bus camera system upgrade, solar panels, installation of new bus shelters and new phone system projects were completed in Interest and other revenues in fiscal year 2017 decreased by $54,296 due to decrease in interest revenue and decrease in SSG s operating vehicle permits, inspection fees and surcharge fees. Fiscal year 2016 decreased by $2,401 compared to fiscal year 2015 mainly due to a decrease in SSG s surcharge fees. The combined amount of operating and capital grants in fiscal year 2017 and 2016 reflects 83% and 80% of STA s total revenues, respectively. These funds come from a variety of specific funding sources. Each funding source is guided by government regulations regarding the type and use of funds. Annually, STA submits its short-range transit plan to the Riverside County Transportation Commission (RCTC), which is the basis for annual operating and capital grant allocations. Local Transportation Funds (LTF) comprise the significant component of STA's operating grants; other operating grants generally include funding from Measure A, Riverside County's one-half cent sales tax for transportation purposes, Low-Carbon Transit Operations Program and Federal Transit Administration (FTA). Capital assets are funded primarily by capital grants from Federal Transit Administration (FTA) with matching funds from State Transit Assistance and Proposition 1B, LTF, and other sources. 7
14 8 SunLine Transit Agency Management s Discussion and Analysis Years ended June 30, 2017 and 2016
15 SunLine Transit Agency Management s Discussion and Analysis Years ended June 30, 2017 and 2016 Expenses Adopted Agency policies, procedures, and business processes are used as management tools to control expenses and attain goals and objectives. These combined controllable operating expenses consist of cost elements that exclude depreciation and vehicle operating lease. For purposes of this analysis, operating expenses before depreciation and vehicle operating lease will be discussed. These expenses totaled $33,188,527 during fiscal year 2017, an increase of $1,245,654 from fiscal year 2016 of $31,942,873. This increase was due to increase in salaries and wages, services, utilities, repair parts, fuel, tires, taxes, and offset by decrease in casualty and liability cost and administrative expenses. Salaries and benefits increased in fiscal year 2017 by $1,711,964 due to increase in administrative employees, 3% salary increase per Memorandum of Understanding, increase in overtime, guarantee wages and increase in fixed route hours to meet increased services. Fringe benefits increased due to increase in health insurance premiums. Vacation and sick time increased due to maximum hours accrual increases as length of service by employees increases. Increase in overtime pay was due to sick or vacation time taken by drivers, which causes other drivers on voluntary call back to work overtime hours and was paid overtime premiums. Casualty and liability costs decreased in fiscal year 2017 by $1,380,059 due to decrease in insurance claims on worker s compensation and general liability and increase in closed claims. Materials and supplies increased in fiscal year 2017 by $87,090 due to increase in repair parts of aging vehicles and maintenance of old facilities. Services increased in fiscal year by $457,389 due to an increase in third party contract services for vanpool marketing, custodial services, communications, computer software licenses, labor counsel, and temporary help. Fuel and lubricants increased in fiscal year 2017 by $61,949 mainly due to increase in outsourced hydrogen when the hydrogen station experienced a breakdown. Utilities expense increased in fiscal year 2017 by $257,205 mainly due to increase in cost of natural gas and transmission charge. Tires and tubes increased in fiscal year 2017 by $14,085 due to increase in vehicle miles travelled. Taxes represent fuel taxes paid based on the generation of CNG and hydrogen. In fiscal year 2017, STA generated higher volume compared to fiscal year Miscellaneous expenses increased in fiscal year 2017 by $138,678 due mostly to increase in membership and subscriptions, bank service fees, recruitment fees, employee development program, consulting and trainings and seminars. Administrative expenses decreased in fiscal years 2017 and 2016 due to decrease in administrative personnel in SSG. Vehicle lease was incurred in fiscal year 2017 due to leases of 3 Electric buses to support service improvement. 9
16 SunLine Transit Agency Management s Discussion and Analysis Years ended June 30, 2017 and 2016 Expenses (Continued) Depreciation expense increased in fiscal year 2017 by $109,851 due to increase in capital projects closed at the end of fiscal year A breakdown of operating expenses is reflected on page 6. CAPITAL ASSETS STA's capital assets (net of accumulated depreciation), as of June 30, 2017 and 2016, amounted to $52,959,688 and $51,170,410 respectively. Capital assets include land, buildings, fleet, communication/fare box systems, machinery/equipment, support vehicles, facilities improvement and passenger facilities. Significant capital asset projects during FY 2017 included the following: Purchase of 15 para-transit vans Purchase of 6 fixed route buses Replacement of support vehicle Battery Dominant Fuel Cell Bus (continued) Installation of 25 bus shelters Rehabilitation of buses Replacement of bus lifts Enterprise Resource Planning (continued) CNG and Hydrogen Fueling Station (continued) Facility improvements Information technology Machinery and equipment Fuel Cell Buses maintenance and inspection Significant capital asset projects during FY 2016 included the following: Final construction phase of Solar Panels Commencement of Battery Dominant Fuel Cell Bus Rehabilitation of buses Replacement of para-transit vehicles 10
17 SunLine Transit Agency Management s Discussion and Analysis Years ended June 30, 2017 and 2016 CAPITAL ASSETS (CONTINUED) Enterprise Resource Planning (continued) Commencement of CNG and Hydrogen Fueling Station Avail systems upgrade Wireless video link for buses A summary of the capital assets balances at June 30, 2017 related activity is presented in Note 5 of the financial statements. ECONOMIC AND OTHER FACTORS These significant factors were considered as budget assumptions when preparing the Agency s budget for FY 2018: Paratransit service initiatives and service expansions Increase in required pension contribution expenses Increase in salaries and fringe benefits for bargaining and non-bargaining employees Increase in emphasis on advertising revenue, outside CNG revenue, emissions credit No CNG rebate revenue budget for fiscal year 2018 Ten new capital project investments to cover necessities in Fleet, Facilities and technology Decrease in SRA budget mainly attributed to a continued decrease in Taxi ridership These significant factors were considered as budget assumptions when preparing the Agency s budget for FY 2017: Sustain service levels and initiatives, as well as optimizing existing routes Increase in required pension contribution expenses Increase in salaries and fringe benefits for bargaining and non-bargaining employees Increase in emphasis on advertising revenue, outside CNG revenue, emissions credit program Ten new capital project investments in alternative fuel technology fleet and facilities as well as the accumulation of funds for a new operations building Capital grant award increased capital program to acquire new assets Decrease in SRA budget mainly attributed to a continued decrease in Taxi ridership 11
18 SunLine Transit Agency Management s Discussion and Analysis Years ended June 30, 2017 and 2016 ECONOMIC AND OTHER FACTORS (CONTINUED) The combined final approved operating budget for fiscal year 2018 totaled $35,133,623, which is an increase of $1,363,078 or 4.04% over the fiscal year 2017 operating budget of $33,770,545. The combined final approved operating budget for fiscal year 2017 totaled $33,770,545, which is an increase of $2,637,682 or 8.47% over the fiscal year 2016 operating budget of $31,132,863. As stated previously, STA relies on operating and capital grants for approximately 83% of its total revenue. These funds come from a variety of specific funding sources. Each funding source is guided by government regulations regarding type and use of funds. The economic expansion in Riverside County has contributed to an increase in the operating and capital grant funds available, however signs of recovery are not as robust as expected. A component of the Agency s operating grants is local operating assistance. These funds are governed by various provisions of the Transportation Development Act and Public Utilities Code. One such provision is adherence to a predetermined farebox recovery ratio (fare revenue/net operating expenses excluding SSG s operating revenues and expenses) approved by RCTC and the California Department of Transportation. The fiscal year 2017 required farebox recovery ratio was 18.23%; the Agency s actual ratio was 20.60% which exceeded the requirement. REQUESTS FOR INFORMATION This financial report is designed to provide a general overview of STA's finances for all those with an interest in STA's finances. Questions concerning any of the information provided in this report or requests for additional financial information should be addressed to the Chief Finance Officer, SunLine Transit Agency, Harry Oliver Trail, Thousand Palms, CA
19 SunLine Transit Agency Statements of Net Position June 30 ASSETS Current assets Cash and cash equivalents $ 7,775,755 $ 5,667,228 Accounts receivable, net 512, ,688 Due from other governmental agencies 6,658,320 3,222,656 Inventory 799, ,960 Prepaid items 481, ,661 Total current assets 16,227,161 10,450,193 Noncurrent assets Deposits 589, ,515 Capital assets, not depreciated 8,608,925 6,592,942 Capital assets, depreciated 44,350,763 44,577,468 Total noncurrent assets 53,549,216 51,669,925 Total assets 69,776,377 62,120,118 DEFERRED OUTFLOWS OF RESOURCES Deferred amounts from pension 2,782,255 3,957,884 LIABILITIES Current liabilities Accounts payable and accrued expenses 970, ,064 Accrued payroll and related liabilities 270, ,408 Due to other governmental agency 3,000,000 - Net pension liability - current portion 2,026,177 2,177,519 Compensated absences - current portion 1,509,712 1,411,148 Claims payable - current portion 846, ,812 Unearned revenue 5,011,451 2,589,008 Total current liabilities 13,634,974 8,548,959 Noncurrent liabilities Net pension liability 755,380 1,929,220 Claims payable 2,743,667 3,045,822 Total noncurrent liabilities 3,499,047 4,975,042 Total liabilities 17,134,021 13,524,001 DEFERRED INFLOWS OF RESOURCES Deferred amounts from pension 2,284,270 1,261,526 NET POSITION Net investment in capital assets 52,959,688 51,170,410 Unrestricted 180, ,065 Total net position $ 53,140,341 $ 51,292,475 See notes to financial statements. 13
20 SunLine Transit Agency Statements of Revenues, Expenses and Changes in Net Position Years ended June OPERATING REVENUES Passenger fares $ 3,055,022 $ 3,200,299 CNG and hydrogen fuel sales 3,125,917 3,299,395 Taxi license fees 284, ,167 Other 606, ,196 Total operating revenues 7,071,619 7,481,057 OPERATING EXPENSES Salaries and employee benefits 24,043,772 22,331,808 Depreciation 7,248,697 7,138,846 Vehicle lease 258,178 - Casualty and liability costs 1,421,017 2,801,076 Services 2,738,982 2,281,593 Utilities 1,956,125 1,698,920 Materials and supplies 1,688,687 1,601,597 Administrative 166, ,591 Fuel and lubricants 274, ,112 Tires and tubes 213, ,948 Taxes 194, ,862 Miscellaneous 492, ,366 Total operating expenses 40,695,402 39,081,719 OPERATING LOSS (33,623,783) (31,600,662) NONOPERATING REVENUES Operating grants: Local Transportation Fund 18,470,028 15,029,833 Measure A 5,835,696 6,492,099 Federal Transit Administration - Section ,668 2,197,912 Federal Transit Administration - Section ,693 - Federal Transit Administration - Section ,042 17,564 Federal Transit Administration - Section , ,891 Federal Transit Administration - Section 5311(f) 300,000 - Federal Transit Administration - Section ,079 74,850 Federal Transit Administration - Section ,964 64,541 Federal Transit Administration - Other 510,642 90,898 Low-Carbon Transit Operations Program (LCTOP) Grant 135, ,907 Total operating grants 26,170,975 24,483,495 Interest income 4,069 2,498 Miscellaneous income Gain (loss) on sale of capital assets, net 451 (34,165) Total nonoperating revenues 26,175,695 24,451,828 LOSS BEFORE CAPITAL CONTRIBUTIONS (7,448,088) (7,148,834) CAPITAL CONTRIBUTIONS Capital grants: Federal Transit Administration 3,196,010 1,870,783 State Transit Assistance 1,226, ,861 Proposition 1B 2,899, ,977 Local Transportation Fund 165, ,115 Other 1,808,679 1,255,361 Total capital contributions 9,295,954 5,012,097 CHANGES IN NET POSITION 1,847,866 (2,136,737) NET POSITION Beginning of year 51,292,475 53,429,212 End of year $ 53,140,341 $ 51,292,475 See notes to financial statements. 14
21 SunLine Transit Agency Statements of Cash Flows Years Ended June Cash flows from operating activities Cash received from customers $ 7,196,159 $ 7,214,622 Cash payments to suppliers for goods and services (9,919,788) (9,204,702) Cash payments to employees for services (23,588,297) (20,568,005) Net cash used in operating activities (26,311,926) (22,558,085) Cash flows from noncapital financing activities Cash received from operating grants 22,750,064 22,876,982 Loan proceeds from RCTC 3,000,000 - Payment of loan to RCTC - (3,000,000) Net cash provided by noncapital financing activities 25,750,064 19,876,982 Cash flows from capital and related financing activities Cash received from capital grants 11,703,644 4,420,077 Acquisition and construction of capital assets (9,037,775) (5,012,097) Proceeds from sale of capital assets ,443 Net cash provided by (used in) capital and related financing activities 2,666,320 (568,577) Cash flows from investing activity Cash received from interest income 4,069 2,498 Net cash provided by investing activity 4,069 2,498 Change in cash and cash equivalents 2,108,527 (3,247,182) Cash and cash equivalents, beginning of year 5,667,228 8,914,410 Cash and cash equivalents, end of year $ 7,775,755 $ 5,667,228 Reconciliation of operating loss to net cash provided by (used in) operating activities: Operating loss $ (33,623,783) $ (31,600,662) Provision for doubtful accounts Depreciation 7,248,697 7,138,846 Changes in operating assets and liabilities: Accounts receivable 123,711 (266,564) Inventory (34,935) (181,210) Prepaid items (322,382) (137,345) Deposits (90,013) (199,321) Deferred outflows of resources 1,175,629 (642,997) Accounts payable and accrued liabilities 159,279 (101,950) Retention payable - (672,718) Accrued payroll and related liabilities (349,698) (81,064) Net pension liability (1,325,182) 1,707,180 Compensated absences 98, ,005 Claims payable (395,386) 1,425,734 Unearned revenue - (700) Deferred inflows of resources 1,022, ,852 Net cash used in operating activities $ (26,311,926) $ (22,558,085) See notes to financial statements. 15
22 SunLine Transit Agency Notes to Financial Statements Years ended June 30, 2017 and 2016 NOTE 1 REPORTING ENTITY SunLine Joint Powers Transportation Agency (doing business as SunLine Transit Agency) ("STA") ( Agency ), was originally formed by the County of Riverside, California, and the cities in the Coachella Valley to provide transportation services in the Coachella Valley. STA is a special purpose government and is eligible for funding under Section et. seq. of the California Public Utilities Code. Accounting principles generally accepted in the United States of America require that these financial statements represent STA and its component unit. A component unit is included in the primary government s financial statements, if STA appoints a majority of the component unit s board of directors or if the governing body is substantively the same as STA, if the component unit provides services or other benefits almost entirely to the primary government, and if STA is financially accountable for the component unit. The component unit discussed below is a legally separate component unit, however, it is included in STA s reporting entity because STA appoints majority of its board of directors and STA is considered financially accountable for its operations. Included within the reporting entity as blended component unit: SunLine Services Group ("SSG") was formed in 1993 in order to enhance public/private partnerships in the Coachella Valley. SSG operations include regulation, licensing, and franchising the taxicabs and alternative transportation in the Coachella Valley. Effective July 1, 1996, SSG adopted ordinances to give it the authority to regulate taxicab. NOTE 2 SUMMARY SIGNIFICANT ACCOUNTING POLICIES Basis of Presentation Financial statement presentation follows the standards promulgated by the Governmental Accounting Standards Board ("GASB") commonly referred to as accounting principles generally accepted in the United States of America ("U.S. GAAP"). GASB is the accepted standard-setting body for establishing governmental accounting and financial reporting standards. The financial statements (i.e., the statement of net position, the statement of revenues, expenses and changes in net position, and statement of cash flows) report information on all of the activities of the primary government and its component unit. Basis of Accounting and Measurement Focus The financial statements are reported using the "economic resources" measurement focus and the accrual basis of accounting. Revenues are recorded when earned and expenses are recorded when a liability is incurred, regardless of the timing of related cash flows. Grants and similar items are recognized as revenue when all eligibility requirements have been met. Interest associated with the current fiscal period is considered to be susceptible to accrual and so has been recognized as revenue of the current fiscal period. 16
23 SunLine Transit Agency Notes to Financial Statements Years ended June 30, 2017 and 2016 NOTE 2 SUMMARY SIGNIFICANT ACCOUNTING POLICIES (CONTINUED) Operating revenues are those revenues that are generated from the primary operations of STA. STA reports a measure of operations by presenting the change in net position from operations as "operating income" in the statement of revenues, expenses, and changes in net position. Operating activities are defined by STA as all activities other than financing and investing activities (interest expense and investment income), and other infrequently occurring transaction of a nonoperating nature. Operating expenses are those expenses that are essential to the primary operations of STA. All other expenses are reported as nonoperating expenses. Cash and Cash Equivalents Cash and cash equivalents include all highly liquid investments with original maturities of 90 days or less and are carried at cost, which approximates fair value. Investments Investments are stated at fair value, which is based on quoted market price. Changes in fair value that occur during the fiscal year are recognized as investment income reported for that fiscal year. Investment income includes interest earnings, changes in fair value, and any gains or losses realized upon the liquidation or sale of investments. Receivables Receivables are shown net of allowances for doubtful accounts, if any. Federal and State grants accrued as revenue when all eligibility requirements have been met. Amount earned but outstanding at year-end are reported as accounts receivable. Inventory Inventory consists of vehicle parts held for consumption, fuel and bus passes. Inventory is stated at the lower of weighted average cost or market. Prepaid Items Payments made to vendors for services that will benefit periods beyond the fiscal year-end are recorded as prepaid items. Deposits Deposits represent amounts held by the Public Entity Risk Management Authority (PERMA) on behalf of STA to pay workers' compensation claims and other expenses that do not involve a transfer of risk to PERMA. 17
24 SunLine Transit Agency Notes to Financial Statements Years ended June 30, 2017 and 2016 NOTE 2 SUMMARY SIGNIFICANT ACCOUNTING POLICIES (CONTINUED) Capital Assets Capital assets are valued at historical cost, or estimated historical cost, if actual historical cost was not available. Donated capital assets are valued at their estimated fair market value on the date of donation. STA policy has set the capitalization threshold for reporting capital assets at $1,000, all of which must have an estimated useful life of more than one year. Depreciation is recorded on a straight-line basis over estimated useful lives of the assets as follows: Land improvements Building Office furniture and equipment Vehicles Equipment years years 3 7 years 4 12 years 5 10 years Major outlays for capital assets are capitalized as projects, and once constructed, the related repairs and maintenance costs are expensed. Interest incurred during capital assets construction, if any, is capitalized as part of the asset cost, net of interest income earned on construction bond proceeds. Compensated Absences It is STA's policy to permit employees to accumulate earned but unused vacation leaves up to 500 hours and unlimited hours for unused sick leave. Management, non-exempt, and union employees begin to accrue vested vacation and sick hours upon being hired, except for part-time employees who begin to accrue such hours after the first year. Accumulated unpaid vacation and vested sick leave pay is recorded as an expense and a liability at the time the benefit is earned. Claims Payable STA's uninsured claims are accrued and charged to expense when the claims are reasonably determinable and the existence of a liability is probable. Liabilities include amount for claims that have been incurred but not reported (IBNR). Deferred Inflows and Outflows of Resources In accordance with GASB Statement No. 63, Financial Reporting of Deferred Outflows of Resources, Deferred Inflows of Resources, and Net Position, the Statement of Net Position reports separate sections for Deferred Outflows of Resources, and Deferred Inflows of Resources, when applicable. Deferred Outflows of Resources represent outflows of resources (consumption of net position) that apply to future periods and therefore, not recognized as an expense until that time. Deferred Inflows of Resources represent inflows of resources (acquisition of net position) that apply to future periods and therefore, are not recognized as revenue until that time. 18
25 SunLine Transit Agency Notes to Financial Statements Years ended June 30, 2017 and 2016 NOTE 2 SUMMARY SIGNIFICANT ACCOUNTING POLICIES (CONTINUED) Net Position Net Position is classified as follows: Net investment in capital assets This is component of net position consists of capital assets, net of accumulated depreciation, reduced by the outstanding balances of debt that are attributable to the acquisition, construction, or improvement of those assets. Restricted - This component of net position consists of restricted assets reduced by liabilities and deferred inflows of resources related to those assets. Unrestricted - This component of net position are the amounts of the assets, deferred outflows of resources, liabilities, and deferred inflows of resources that are not included in the determination of net investments in capital assets or the restricted component of net position. Federal, State, and Local Subventions Federal, state and local governments have made various grants and subventions available to STA for operating assistance and acquisition of capital assets. Grants for operating assistance, the acquisition of equipment or other capital outlay are not formally recognized in the accounts until the grant becomes a valid receivable as a result of STA's complying with appropriate grant requirements. Operating assistance grants are included in nonoperating revenues in the year in which the related expenses are incurred. Revenues earned under capital grants are recorded as capital contributions. Fuel and Lubricants Expense STA allocates operating expenses to the fuel and lubricants expense on the statement of revenues, expenses and change in net position including salaries and benefits, and supplies, representing the costs incurred for the generation of CNG fuel by STA. Use of Restricted/Unrestricted Resources When both restricted and unrestricted resources are available for use, it is STA's policy to use restricted resources first, then unrestricted resources as they are needed. Use of Estimates The preparation of financial statements in conformity with accounting principles generally accepted in the United States of America requires management to make estimates and assumptions that affect the reported amounts of assets and liabilities and disclosure of the contingent assets and liabilities at the date of the financial statements and the reported amounts of revenue and expenses during the reporting period. Actual results could differ from those estimates. 19
26 SunLine Transit Agency Notes to Financial Statements Years ended June 30, 2017 and 2016 NOTE 2 SUMMARY SIGNIFICANT ACCOUNTING POLICIES (CONTINUED) Pension Reporting For purposes of measuring the net pension liability and deferred outflows/inflows of resources related to pensions, and pension expense, information about the fiduciary net position of STA s pension plan (Plan) and additions to/deductions from the Plan s fiduciary net position have been determined on the same basis as they are reported in the Plan. For this purpose, benefit payments (including refunds of employee contributions) are recognized when due and payable in accordance with the benefit terms. Investments are reported at fair value. Implementation of New Accounting Pronouncements During the fiscal year ended June 30, 2017, STA adopted the following new Statements issued by Government Accounting Standards Board (GASB): GASB No. 80 Blending Requirements for Certain Component Units-An Amendment of GASB No. 14. This Statement amends the blending requirements for the financial statement presentation of component units of all state and local governments. The additional criterion requires blending of a component unit incorporated as a not-for-profit corporation in which the primary government is the sole corporate member. The additional criterion does not apply to component units included in the financial reporting entity pursuant to the provisions of Statement No. 39, Determining Whether Certain Organizations Are Component Units. The implementation of this statement did not have a significant impact on STA s financial statements for the fiscal year ended June 30, GASB No. 81 Irrevocable Split-Interest Agreements. This Statement enhances the comparability of financial statements by providing accounting and financial reporting guidance for irrevocable split-interest agreements in which a government is a beneficiary. This Statement also enhances the decision-usefulness of general purpose external financial reports, and their value for assessing accountability, by more clearly identifying the resources that are available for the government to carry out its mission. The implementation of this statement did not have a significant impact on STA s financial statements for the fiscal year ended June 30, GASB No. 82 Pension Issues-An Amendment of GASB No. 67, No. 68 and No. 73. The requirements of this Statement will improve financial reporting by enhancing consistency in the application of financial reporting requirements to certain pension issues. The implementation of this statement did not have a significant impact on STA s financial statements for the fiscal year ended June 30,
27 SunLine Transit Agency Notes to Financial Statements Years ended June 30, 2017 and 2016 NOTE 3 CASH AND INVESTMENTS Cash and investments consisted of the following: June 30, 2017 STA SSG Total Cash on hand $ 1,100 $ 100 $ 1,200 Deposits with financial institutions 6,711, ,995 7,208,789 Investments - LAIF 565, ,766 Total cash and investments $ 7,278,660 $ 497,095 $ 7,775,755 June 30, 2016 STA SSG Total Cash on hand $ 1,835 $ 100 $ 1,935 Deposits with financial institutions 4,618, ,530 5,103,188 Investments - LAIF 562, ,105 Total cash and investments $ 5,182,598 $ 484,630 $ 5,667,228 Demand Deposits At fiscal year-end of 2017 and 2016, the carrying amount of demand deposits was $7,208,789 ( $5,103,188) and the bank balance was $8,322,029 ( $5,105,024) of which the total amount was collateralized or insured with securities held by the pledging financial institutions in STA's name discussed as follows: The California Government Code requires California banks and savings and loan associations to secure STA's cash deposits by pledging securities as collateral. This Code states that collateral pledged in this manner shall have the effect of perfecting a security interest in such collateral superior to those of a general creditor. Thus, collateral for cash deposits is considered to be held in STA's name. The market value of pledged securities must equal at least 110% of STA's cash deposits. California law also allows institutions to secure Agency's deposits by pledging first trust deed mortgage notes having a value of 150% of STA's total cash deposits. STA may waive collateral requirements for cash deposits, which are fully insured up to $250,000 by the Federal Deposit Insurance Corporation ("FDIC"). STA, however, has not waived the collateralization requirements. 21
28 SunLine Transit Agency Notes to Financial Statements Years ended June 30, 2017 and 2016 NOTE 3 CASH AND INVESTMENTS (CONTINUED) Authorized Investments The table below identifies the investment types that are authorized for STA by the California Government Code (or STA's investment policy where more restrictive), and certain provisions that address interest rate risk and concentration of risk. Authorized by Investment Maximum Percentage of Maximum Investments in Investment Type Policy Maturity Portfolio One Issurer Local Agency Bonds No N/A N/A N/A U.S. Treasury Obligations Yes 5 years None None Federal Agency Securities Yes 5 years 25% None Banker's Acceptances Yes 180 days 40% None Commercial Paper-Pooled Funds Yes 270 days 40% A-1 Negotiable Certificates of Deposit Yes 5 years 30% None Repurchase Agreements Yes 1 year None None Reverse Repurchase Agreements and Securities No N/A N/A None Medium-Term Notes Yes 5 years 30% "A" Rating Mutual Funds and Money Market Funds No N/A 20% Multiple Mortgage Pass-Through Securities Yes 5 years 20% "A" "A" Rating County Pooled Investment Funds No N/A None None Local Agency Investment Fund (LAIF) Yes N/A None $50 million Interest Rate Risk Interest rate risk is the risk that changes in market interest rates will adversely affect the fair value of an investment. Generally, the longer the maturity of an investment the greater the sensitivity of its fair value to changes in market interest rates. The Agency s investment in LAIF has a maturity of less than one year. Credit Risk Credit risk is the risk that an issuer of an investment will not fulfill its obligation to the holder of the investment. This is measured by the assignment of a nationally recognized statistical rating organization. STA's investment in LAIF at June 30, 2017 was not rated. Concentration of Credit Risk Concentration of credit risk is the risk of loss attributed to the magnitude of STA's investment in a single issuer. The investment policy of STA contains no limitations on the amount that can be invested in one issuer beyond that stipulated by the California Government Code. As of June 30, 2017 and 2016, STA did not have any investments in any one issuer (other than external investment pools) that represented 5% or more of its total investment portfolio. 22
29 SunLine Transit Agency Notes to Financial Statements Years ended June 30, 2017 and 2016 NOTE 3 CASH AND INVESTMENTS (CONTINUED) Custodial Credit Risk Custodial credit risk for deposits is the risk that, in the event of the failure of a depository financial institution, STA will not be able to recover its deposits or will not be able to recover collateral securities that are in the possession of an outside party. Custodial credit risk for investments is the risk that, in the event of the failure of the counterparty (e.g., broker-dealer) to a transaction, a government will not be able to recover the value of its investments or collateral securities that are in the possession of another party. The California Government Code and STA's investment policy do not contain legal or policy requirements that would limit the exposure to custodial credit risk for deposits or investments, other than the provision for deposits as disclosed previously. Investment in State Investment Pool The Agency is a voluntary participant in the Local Agency Investment Fund (LAIF) that is regulated by California Government Code Section under the oversight of the Treasurer of the State of California. The fair value of the Agency s investment in this pool is reported in the accompanying financial statements at amounts based on the Agency s pro-rata share of the fair value provided by LAIF for the entire LAIF portfolio (in relation to the amortized cost of that portfolio). The balance available for withdrawal is based on the accounting records maintained by LAIF, which are recorded on an amortized cost basis. As of June 30, 2017 and 2016, the Agency s investment in LAIF had a contractual withdrawal value of $565,766 and $562,105, respectively. Fair Value Measurement STA categorizes its fair value measurements within the fair value hierarchy established by generally accepted accounting principles. The hierarchy is based on the valuation inputs used to measure the fair value of the asset. Level 1 inputs are quoted prices in active markets for identical assets; Level 2 inputs are significant other observable inputs; Level 3 inputs are significant unobservable inputs. STA s investments in LAIF as of June 30, 2017 and 2016 is reported at the Agency s pro-rata share of the amortized cost provided by LAIF for the entire LAIF portfolio. This amount approximates fair value. 23
30 SunLine Transit Agency Notes to Financial Statements Years ended June 30, 2017 and 2016 NOTE 4 DUE FROM OTHER GOVERNMENTAL AGENCIES At June 30, 2017 and 2016, due from other governments consisted of the following: Federal Transportation Administration (FTA) $ 5,042,533 $ 2,617,147 State Transit Assistance (STA) 730, ,457 Measure A 555,407 - Local Transportation Fund 32,820 12,101 Others 296, ,951 Total $ 6,658,320 $ 3,222,656 Federal Transportation Administration (FTA) Under the provisions of the FTA, funds are available to the Agency for maintenance costs, acquisition, construction, improvement and maintenance of transit facilities, transit vehicles and equipment. State Transit Assistance (STA) and Local Transportation Fund (LTF) Under the provisions of the STA Fund, funds are available to the Agency for maintenance costs, acquisition, construction, improvement and maintenance of transit facilities, transit vehicles and equipment. Others Funds represents cost reimbursements in accordance with the Cooperative Agreement with CalStart and local funds. NOTE 5 CAPITAL ASSETS Summary of changes in capital assets is as follows: June 30, 2017 Balance Balance July 1, 2016 Additions Deletions Transfers/Adjust June 30, 2017 Non-depreciable assets Land $ 3,141,003 $ - $ - $ - $ 3,141,003 Construction in progress 3,451,939 9,102,266 - (7,086,283) 5,467,922 Total nondepreciable assets 6,592,942 9,102,266 - (7,086,283) 8,608,925 Depreciable Assets Buildings 29,226,082 2, ,228,586 Land Improvements 3,696, ,125 3,698,014 Facility Improvement 789,962 16, , ,994 Office furniture and equipment 6,310, (4,441) 206,386 6,513,299 Vehicles 51,688, ,244 (132,484) 6,517,254 58,192,251 Equipment 5,747,288 54,155-5,813 5,807,256 Total depreciable assets 97,458, ,687 (136,925) 6,873, ,389,400 Less accumulated depreciation (52,881,402) (7,248,697) 136,925 (45,463) (60,038,637) Total depreciable assets, net 44,577,468 (7,055,010) - 6,828,305 44,350,763 Total capital assets, net $ 51,170,410 $ 2,047,256 $ - $ (257,978) $ 52,959,688 24
31 SunLine Transit Agency Notes to Financial Statements Years ended June 30, 2017 and 2016 NOTE 5 CAPITAL ASSETS (CONTINUED) June 30, 2016 Balance Balance July 1, 2015 Additions Deletions Transfers/Adjust June 30, 2016 Non-depreciable assets Land $ 3,141,003 $ - $ - $ - $ 3,141,003 Construction in progress 3,430,623 4,525,441 - (4,504,125) 3,451,939 Total nondepreciable assets 6,571,626 4,525,441 - (4,504,125) 6,592,942 Depreciable Assets Buildings 27,709,578 - (397,897) 1,914,401 29,226,082 Land Improvements 3,561, ,127 3,696,889 Facility Improvement 178,988 62, , ,962 Office furniture and equipment 5,838, ,018 (55,810) 324,016 6,310,413 Vehicles 50,541, ,908 (569,871) 1,533,629 51,688,237 Equipment 5,664,365 37,086 (2,787) 48,622 5,747,286 Total depreciable assets 93,494, ,656 (1,026,365) 4,504,125 97,458,869 Less accumulated depreciation (46,711,312) (7,138,846) 968,757 - (52,881,401) Total depreciable assets, net 46,783,141 (6,652,190) (57,608) 4,504,125 44,577,468 Total capital assets, net $ 53,354,767 $ (2,126,749) $ (57,608) $ - $ 51,170,410 Depreciation expense for the year ended June 30, 2017 and 2016 comprised of: SunLine Transit Agency $ 7,242,077 7,124,551 SunLine Services Group 6,620 14,295 Total $ 7,248,697 7,138,846 Changes in capital assets by funding source were as follows: Federal Funds STA/Prop 1B Funds TDA Funds Measure A Operator/ Other Total Balance at July 1, 2016 $ 42,306,686 $ 36,246,711 $ 15,770,601 $ 10,000 $ 9,717,814 $ 104,051,812 Additions, net 3,205,981 4,125, ,729-1,798,708 9,295,953 Transfers/adjustments - (258,178) ,663 (212,515) Deletions (108,781) (28,144) (136,925) Balance at June 30, 2017 $ 45,403,886 $ 40,085,924 $ 15,936,330 $ 10,000 $ 11,562,185 $ 112,998,325 June 30, 2016 Federal Funds STA/Prop 1B Funds TDA Funds Measure A Operator/ Other Total Balance at July 1, 2015 $ 40,567,653 $ 35,548,642 $ 15,296,160 $ 10,000 $ 8,643,625 $ 100,066,080 Additions, net 1,870,783 1,225, ,115-1,255,361 5,012,097 Deletions (131,750) (527,769) (185,674) - (181,172) (1,026,365) Balance at June 30, 2016 $ 42,306,686 $ 36,246,711 $ 15,770,601 $ 10,000 $ 9,717,814 $ 104,051,812 25
32 SunLine Transit Agency Notes to Financial Statements Years ended June 30, 2017 and 2016 NOTE 6 UNEARNED REVENUE Unearned revenue represents excess capital and operating assistance. The following represent the amounts at June 30: Capital Assistance Federal Transit Authority $ 1,216 $ 21,708 State Transit Assistance 144, ,902 Proposition 1B 4,158,330 1,633,203 Transportation Development Act 106, ,530 Operators/Others 4,793 36,042 Total capital assistance 4,415,075 2,007,385 Operating Assistance Low Carbon Transit Operations Program 403, ,373 Transportation Development Act 181,844 - Operator/Others 10,750 42,250 Total operating assistance 596, ,623 Total $ 5,011,451 $ 2,589,008 Capital Assistance Changes in unearned revenue by funding source for the years ended June 30, 2017 and 2016 were as follows: June 30, 2017 Federal STA Prop 1 B TDA Operator/ Funds Funds Funds Funds Other Funds Total Excess capital funds at July 1, 2016 $ 21,708 $ 163,903 $ 1,633,203 $ 152,529 $ 36,042 $ 2,007,385 Interest earned - - 1, ,702 Allocation received 3,175,518 1,206,795 5,422, ,535 1,777,430 11,701,942 Funds Available 3,197,226 1,370,698 7,057, ,064 1,813,472 13,711,029 Less eligibile costs - capitalized (3,196,010) (1,226,297) (2,899,239) (165,729) (1,808,679) (9,295,954) Excess capital funds at June 30, 2017 $ 1,216 $ 144,401 $ 4,158,330 $ 106,335 $ 4,793 $ 4,415,075 June 30, 2016 Federal STA Prop 1 B TDA Operator/ Funds Funds Funds Funds Other Funds Total Excess capital funds at July 1, 2015 $ - $ 400,130 $ 1,594,547 $ 577,100 $ 27,628 $ 2,599,405 Interest earned Allocation received 3,217, , , ,544 1,263,775 5,745,038 Funds Available 3,217,718 1,037,764 1,985, ,644 1,291,403 8,344,709 Less eligibile costs - capitalized (3,196,010) (873,861) (351,977) (660,115) (1,255,361) (6,337,324) Excess capital funds at June 30, 2016 $ 21,708 $ 163,903 $ 1,633,203 $ 152,529 $ 36,042 $ 2,007,385 26
33 SunLine Transit Agency Notes to Financial Statements Years ended June 30, 2017 and 2016 NOTE 6 UNEARNED REVENUE (CONTINUED) Operating Assistance Changes in unearned revenue by funding source for the year ended June 30 were as follows: June 30, 2017 STA Measure A Federal TDA LCTOP Operator/ Funds Funds Funds Other Funds Total Excess operating funds at July 1, 2016 $ - $ - $ 539,373 $ 42,250 $ 581,623 Allocation received 1,722,964 18,651,872-9,949 20,384,785 Funds available 1,722,964 18,651, ,373 52,199 20,966,408 Eligible costs (1,722,964) (18,470,028) (135,591) (41,449) (20,370,032) Excess operating funds at June 30, 2017 $ - $ 181,844 $ 403,782 $ 10,750 $ 596,376 June 30, 2016 STA Measure A Federal TDA LCTOP Operator/ Funds Funds Funds Other Funds Total Excess operating funds at July 1, 2015 $ - $ 3,553,091 $ - $ 19,939 $ 3,573,030 Allocation received 2,805,656 12,055,396 7,187,379 42,250 22,090,681 Funds available 2,805,656 15,608,487 7,187,379 62,189 25,663,711 Eligible costs (2,805,656) (15,029,833) (6,648,006) (19,939) (24,503,434) Changes in pension - (578,654) - - (578,654) Excess operating funds at June 30, 2016 $ - $ - $ 539,373 $ 42,250 $ 581,623 NOTE 7 LONG-TERM OBLIGATIONS Summary of changes in long-term obligations for the year ended June 30 were as follows: June 30, 2017 Balance Balance Due Within Due In More July 1, 2016 Additions Deletions June 30, 2017 One Year Than One Year Compensated absences $ 1,411,148 $ 1,306,476 $ (1,207,912) $ 1,509,712 $ 1,509,712 $ - Claims payable 3,985, ,784 (950,170) 3,590, ,581 2,743,667 Net pension obligation 4,106,739 1,076,507 (2,401,689) 2,781,557 2,026, ,380 Total $ 9,503,521 $ 2,937,767 $ (4,559,771) $ 7,881,517 $ 4,382,470 $ 3,499,047 June 30, 2016 Balance Balance Due Within Due In More July 1, 2015 Additions Deletions June 30, 2016 One Year Than One Year Compensated absences $ 1,282,143 $ 1,974,176 $ (1,845,171) $ 1,411,148 $ 1,411,148 $ - Claims payable 2,559,900 2,808,427 (1,382,693) 3,985, ,812 3,045,822 Net pension obligation 2,399,559 3,696,807 (1,989,627) 4,106,739 2,177,519 1,929,220 Total $ 6,241,602 $ 8,479,410 $ (5,217,491) $ 9,503,521 $ 4,528,479 $ 4,975,042 Compensated Absences Compensated absences at June 30, 2017 and 2016, amounted to $1,509,712 $1,411,148, respectively. There is no fixed payment schedule for compensated absences. 27
34 SunLine Transit Agency Notes to Financial Statements Years ended June 30, 2017 and 2016 NOTE 7 LONG-TERM OBLIGATIONS (CONTINUED) Claims Payable Claims payable at June 30, 2017 and 2016, amounted to $3,590,248 and $3,985,634, respectively. There is no fixed payment schedule for claims payable. See Note 8 for more detail. Net Pension Liability Refer to Note 9 for information. NOTE 8 RISK MANAGEMENT STA is a participant in the Public Entity Risk Management Authority (PERMA) formed under a joint powers agreement between local governments and special districts for the purpose of jointly funding (pooling risks) general liability and workers' compensation insurance for the member agencies. STA's general liability self-insured retention is $125,000 per claim. The total general liability coverage limit is $50,000,000 per occurrence. Workers' compensation insurance costs are based on annual deposit premiums. STA's workers' compensation self-insured retention is $250,000 per claim and coverage limits are statutory limits. Settlements have not exceeded insurance coverage for each of the past three years. If PERMA experiences an unusually large number of losses during a policy year, the funds for a given program may become exhausted. In such case, the Board of Directors of PERMA may impose premium surcharges on all members who were in the program at the time such loss or losses occurred in order to pay the necessary costs. Annual surcharges shall not exceed an amount equal to three times the member's annual premium for the policy year in which such loss occurred. STA's surcharge would be based upon its pro rata share of premiums paid in said year. STA's self-insured retention for general and workers' compensation liabilities is based on an annual actuarial study discounted at 2.5%. Changes in liabilities for the past two fiscal years were as follows: Beginning Provisions Claim Ending Fiscal Year Balance of Claims Payments Balance $ 2,276,962 $ 1,255,374 $ (910,714) $ 2,621, ,621, ,739 (861,461) 2,559, ,559,900 2,808,427 (1,382,693) 3,985, ,985, ,784 (950,170) 3,590,248 Separate financial statements for PERMA are available at Cook Street, Suite 101, Palm Desert, California
35 SunLine Transit Agency Notes to Financial Statements Years ended June 30, 2017 and 2016 NOTE 9 EMPLOYEE RETIREMENT PLANS Plan Description STA contributes to the Sunline Transit Retirement Income Plans for Bargaining and Non-Bargaining Personnel (Plans), single-employer defined benefit pension plans. STA administers the Plans through a Retirement Committee appointed by STA's Board of Directors. Bargaining and non-bargaining participants are 100 percent vested in their accrued benefit after completion of five years of credited service. Normal retirement age is 62; however, an employee may retire prior to age 62, provided he/she has attained age 55 or has completed 25 years of credited service. Employees who retire early are subject to a reduced benefit. An employee may remain employed after his/her normal retirement age and receive an increased benefit. Non-bargaining employees shall at all times be 100 percent vested in their contributions. Bargaining Personnel Plan - Prior to June 30, 2007, the amount of the monthly retirement benefit at the normal retirement date shall be equal to 1/90 of the first $400 of Final Average Monthly Earnings (FAME) plus 1/60 of the excess of FAME over $400, times years and completed quarters of credited service. The calculation was amended effective July 1, 2007, whereas benefit payments at the normal retirement date shall be equal to 1/60 of FAME, multiplied by years and completed quarters of service. FAME is the average of the 36 highest consecutive months of earnings as a participant. If the employee has attained age 62 at termination and completed ten years of service, the minimum monthly benefit is $400. Earnings mean compensation paid during a plan year as an eligible employee, excluding any compensation paid as bonuses, overtime, or other extra pay. A year of credited service for each plan year is earned during which an employee is employed full time for STA. The basic form of benefit payment is a life annuity; however, various joint and survivor annuity forms are available, provided certain requirements are met. Non-Bargaining Personnel Plan - The amount of the monthly retirement benefit at the normal retirement date shall be equal to the greater of a) 2.5 percent times FAME times years of credited service (FAME is the average of the 36 highest consecutive months of earnings as a participant) or b) if the employee has attained age 62 at termination and completed ten years of service, the minimum monthly benefit is $400. Earnings mean compensation paid during a plan year as an eligible employee, excluding any compensation paid as bonuses, overtime, or other extra pay. The maximum benefit is 90% of FAME. A year of credited service for each plan year is earned during which an employee is employed full time for STA. The basic form of benefit payment is a life annuity; however, various joint and survivor annuity forms are available, provided certain requirements are met. 29
36 SunLine Transit Agency Notes to Financial Statements Years ended June 30, 2017 and 2016 NOTE 9 EMPLOYEE RETIREMENT PLANS (CONTINUED) Plan Description (Continued) Death, Disability and Termination Benefits Under the Plans - If an active employee (participant) dies, a death benefit may be paid to the participant's spouse, (or dependent under age 21) provided the participant has completed five years of credited service. The benefit is the participant's accrued benefit assuming that the participant retired on the day prior to their death. If an employee becomes totally and permanently disabled after completing ten years of services he/she shall be entitled to receive an unreduced pension equal to 2.5 percent of FAME times years of service. This benefit cannot exceed the projected benefit at age 62 based on current FAME and total service assuming continued employment until age 62. If a participant who has completed five years of vesting service is terminated for any reason other than death, he/she will be entitled to receive his/her normal benefit upon attainment of age 55. Separate financial statements for the Plans may be obtained from STA. The Plans provisions and benefits in effect at June 30, 2017 and 2016, are summarized as follows: Bargaining Non-Bargaining Benefit formula at normal retirement age Benefit vesting schedule 5 years of service 5 years of service Benefit payments monthly for life monthly for life Retirement age Monthly benefits, as a % of eligible compensation 1.6% 2.0% to 2.5% Required employee contribution rates none 0.03 Required employer contribution rates Employees Covered At June 30, 2017, the following employees were covered by the benefit terms for each Plan: Bargaining Non-Bargaining Inactive employees or beneficiaries currently receiving benefits Inactive employees entitled to but not yet receiving benefits Active employees Contributions Funding contributions for both Plans are determined annually on an actuarial basis as of January 1 by an actuary. The actuarially determined rate is the estimated amount necessary to finance the costs of benefits earned by employees during the year, with an additional amount to finance any unfunded accrued liability. The Agency is required to contribute the difference between the actuarially determined rate and the contribution rate of employees. 30
37 SunLine Transit Agency Notes to Financial Statements Years ended June 30, 2017 and 2016 NOTE 9 EMPLOYEE RETIREMENT PLANS (CONTINUED) Net Pension Liability The Agency s net pension liability for each Plan is measured as the total pension liability, less the pension plan s fiduciary net position. The net pension liability of the Plan is measured as of December 31, A summary of principal assumptions and methods used to determine the net pension liability is shown below. Actuarial Assumptions The total pension liabilities in the January 1, 2017 actuarial valuations were determined using the following actuarial assumptions: Bargaining Non-Bargaining Valuation Date January 1, 2017 January 1, 2017 Measurement Date December 31, 2016 December 31, 2016 Actuarial Cost Method Entry Age Normal Entry Age Normal Rate 6.0% 6.0% Inflation 2.75% 2.75% Payroll Growth 3.0% 4.0% Projected Salary 3.0% (1) 4.0% (1) Return 6.0% (2) 6.0% (2) Mortality RP Blue Collar Mortality Tables with generational improvements beginning in 2006 based on the Social Security Administration's assumption scale. After disablement, the RP Disabled Retiree Table with generational improvements beginning in 2006 based on the Social Security Administration's assumption scale. RP Blue Collar Mortality Tables with generational improvements beginning in 2006 based on the Social Security Administration's assumption scale. After disablement, the RP Disabled Retiree Table with generational improvements beginning in 2006 based on the Social Security Administration's assumption scale. (1) Depending on merit, seniority and inflation (2) Net of pension plan investment expenses, including inflation 1 The RP-2006 Mortality Tables are the RP-2014 Mortality tables w ith the MP-2014 generational projection scale removed from the central year of the study (2006) to The RP-2006 Mortality Tables are the RP-2014 Mortality tables w ith the MP-2014 generational projection scale removed from the central year of the study (2006) to Given the size of the plan, there is not enough data available to conduct credible experience study. The assumptions are not anticipated to produce significant cumulative actuarial gains or losses over time. The liabilities and data are analyzed each year in order to identify any trends of experience deviation from the actuarial assumptions. 31
38 SunLine Transit Agency Notes to Financial Statements Years ended June 30, 2017 and 2016 NOTE 9 EMPLOYEE RETIREMENT PLANS (CONTINUED) Discount Rate The discount rate used to measure the total pension liability was 6.00% for each Plan. The projection of cash flows used to determine the discount rate assumed that contributions will be made at rates equal to the actuarially determined contribution rates. Based on those assumptions, the pension plan s fiduciary net position was projected to be available to make all projected future benefit payments of current plan members. Therefore, the long-term expected rate of return on pension plan investments was applied to all periods of projected benefit payments to determine the total pension liability. According to Paragraph 30 of Statement 68, the long-term discount rate should be determined without reduction for pension plan administrative expense. An explicit cost for Plan expenses was not included in the valuation. The 6.00% investment return used in this accounting valuation is assumed to be net of administrative expenses. An investment return excluding administrative expenses would have been higher than 6.00%. Using this lower discount rate has resulted in a slightly higher Total Pension Liability and Net Pension Liability. STA believes the difference in calculation will not lead to a material difference. Changes in the Net Pension Liability The following table shows the changes in net pension liability over the measurement period: Increase(Decrease) Total Pension Plan Fiduciary Net Pension Liability Net Position Liability / (Asset) Balance at 12/31/2015 $ 45,992,156 $ 41,885,417 $ 4,106,739 Changes recognized for the measurement period: Service cost 1,950,941-1,950,941 Interest on the total pension liability 2,839,519-2,839,519 Differences between expected and actual experiences (866,759) - (866,759) Changes of assumptions (97,435) - (97,435) Contributions from the employer - 2,215,076 (2,215,076) Contributions from the employee - 131,637 (131,637) Net Investment Income - 3,172,526 (3,172,526) Administrative expenses - (367,791) 367,791 Benefit payments, including refunds of - employee contributions (1,235,559) (1,235,559) Net changes during ,590,707 3,915,889 (1,325,182) Balance at: 12/31/2016 $ 48,582,863 $ 45,801,306 $ 2,781,557 32
39 SunLine Transit Agency Notes to Financial Statements Years ended June 30, 2017 and 2016 NOTE 9 EMPLOYEE RETIREMENT PLANS (CONTINUED) Sensitivity of the Net Pension Liability to Changes in the Discount Rate The following presents the net pension liability of STA for each Plan, calculated using the discount rate for each Plan, as well as what STA s net pension liability would be if it were calculated using a discount rate that is 1-percentage point lower or 1-percentage point higher than the current rate: Bargaining Non-Bargaining 1% Decrease 5.00% 5.00% Net Pension Liability $5,238,472 $4,506,648 Current Discount Rate 6.00% 6.00% Net Pension Liability $1,827,003 $954,554 1% Increase 7.00% 7.00% Net Pension Liability ($1,004,715) ($1,964,145) Pension Plan Fiduciary Net Position Detailed information about each pension plan s fiduciary net position is available in the separately issued audited financial reports. Pension Expenses and Deferred Outflows/Inflows of Resources Related to Pensions For the year ended June 30, 2017, STA recognized pension expense of $ 3,088,267. At June 30, 2017, STA reported deferred outflows of resources and deferred inflows of resources related to pensions from the following sources: Deferred outflows Deferred inflows of resources of resources Differences between actual and expected experience $ 53,941 $ (1,229,068) Changes in assumptions 791,347 (545,522) Net differences between projected and actual earnings on plan investments 1,936,967 (509,680) Total $ 2,782,255 $ (2,284,270) 33
40 SunLine Transit Agency Notes to Financial Statements Years ended June 30, 2017 and 2016 NOTE 9 EMPLOYEE RETIREMENT PLANS (CONTINUED) Amounts reported as deferred outflows of resources and deferred inflows of resources related to pensions will be recognized as pension expense as follows: December 31 Amount , , , (451,376) 2021 (150,604) Therafter (170,464) Payable to the Pension Plan At June 30, 2017, the Agency has no outstanding amount of contributions to the pension plan for the year ended June 30, NOTE 10 COMMITMENTS AND CONTINGENCIES Lawsuits STA and SSG were named in certain legal actions pending at June 30, While the outcome of these lawsuits is not presently determinable, in the opinion of management of STA and SSG, based in part on the advice of counsel, the resolution of these matters is not expected to have a material adverse effect on the financial position or results of operations of STA and SSG, or is adequately covered by insurance. Federal and State Grant Programs STA participates in Federal and State grant programs. These programs were audited in accordance with the provisions of the Federal Single Audit Act of 1984, as amended in 1996 and applicable state requirements. No cost disallowance is expected as a result of these audits; however, these programs may be subject to further examination by the grantors. Awards which may be disallowed by the granting agencies, if any, cannot be determined at this time. Management expects such amounts, if any, to be immaterial. Construction Commitments Construction commitments at June 30, 2017 is $261,
41 SunLine Transit Agency Notes to Financial Statements Years ended June 30, 2017 and 2016 NOTE 11 TRANSPORTATION DEVELOPMENT ACT (TDA) COMPLIANCE STA is subject to the provisions of the Public Utilities Code ("PUC") Section and must maintain a minimum fare ratio of 18.23% in 2017 of operating revenues to operating expenses. After allocation of indirect costs to each type of service and taking into consideration certain cost exemption provisions of the TDA, STA's fare ratio for the year ended June 30, 2017 was 20.60%, as calculated below. STA is in compliance with the provisions of PUC Section Farebox and other revenues $ 6,787,606 Interest 4,069 Total revenues 6,791,675 Net Revenues 6,791,675 Operating expenses 40,462,904 Less: Depreciation 7,242,077 Vehicle lease 258,178 Net operating expenses $ 32,962,649 Fare ratio 20.60% Target ratio 18.23% NOTE 12 PROPOSITION 1B On November 7, 2006, the voters of the State of California approved the Highway Safety, Traffic Reduction, Air Quality, and Port Security Bond Act of 2006, known as Proposition 1B. Proposition 1B included in a State program of funding in the amount of $4 billion and $1 billion to be deposited in the Public Transportation Modernization, Improvement and Service Enhancement Account (PTMISEA) and Transit System Safety, Security and Disaster Response Account (TSSSDRA), respectively. PTMISEA funds can be used for rehabilitation, safety or modernization improvements, or for rolling stock procurement, rehabilitation or replacement. TSSSDRA funds can be used for transportation related security and safety projects. Proposition 1B activity during the year ended June 30, 2017 was as follows: PTMISEA TSSSDRA Total Unspent Prop 1B funds at July 1, 2016 $ 542,316 $ 1,090,887 $ 1,633,203 Prop 1 B funds received/returned 5,049, ,551 5,422,664 Prop 1 B funds spent (2,641,883) (257,356) (2,899,239) Interest revenue earned on unspent Prop 1B funds 1, ,702 Unspent Prop 1B funds at June 30, 2017 $ 2,950,866 $ 1,207,464 $ 4,158,330 35
42 SunLine Transit Agency Notes to Financial Statements Years ended June 30, 2017 and 2016 NOTE 13 VEHICLE LEASES SunLine Transit Agency (lessee) entered into agreement with BYD Coach and Bus (lessor) to lease three (3) K9-40 foot, low floor BYD Electric Buses. The original lease agreement covers the period December 1, 2015 up to January 1, 2017 (14 months) which includes a buy-out option for $650,000 for each bus minus lease payments made to date. Upon payment of the 14 th lease payment, SunLine Transit Agency has the right to purchase the buses and power interface charging systems for the residual value of $586,804 each plus tax, based on the first 14 month lease term, or return the buses to BYD Coach and Bus. The lease shall automatically renew for consecutive 12-month terms unless SunLine Transit Agency provides 30 days written notice. On January 2, 2017 the terms of the agreement was changed to a month-to-month lease agreement. The funding source for payment of operating leases for 3 BYD Electric buses is from State Transit Assistance Capital Funds. NOTE 14 SUBSEQUENT EVENTS The Agency has evaluated events subsequent to June 30, 2017 to assess the need for potential recognition or disclosure in the financial statements. Such events were evaluated through September 28, 2017, the date the financial statements were available to be issued. Based upon this evaluation, it was determined that no subsequent events occurred that require recognition or additional disclosure in the financial statements. 36
43 REQUIRED SUPPLEMENTARY INFORMATION
44 Sunline Transit Agency Schedule of Changes in the Net Pension Liability and Related Ratios As of June 30, 2017 Last Ten Years* Reporting Period Reporting Period Bargaining Non- Bargaining Bargaining Non- Bargaining Total Pension Liability Service cost $ 963,077 $ 987,864 $ 786,230 $ 838,631 Interest on total pension liability 1,396,512 1,443,007 1,319,280 1,380,214 Differences between expected and actual experience (97,435) (866,759) 43,602 (461,064) Changes of assumptions - - (565,426) (130,456) Benefits payments, including refunds of employee contributions (494,152) (741,407) (452,533) (718,599) Net change in total pension liability 1,768, ,705 1,131, ,726 Total pension liability - beginning 22,559,195 23,432,961 21,428,042 22,524,235 Total pension liability - ending (a) $ 24,327,197 $ 24,255,666 $ 22,559,195 $ 23,432,961 Plan fiduciary net pension Contributions from the employer $ 1,171,779 $ 1,043,297 $ 1,017,569 $ 972,058 Contributions from the employee - 131, ,295 Net investment income 1,553,438 1,619,088 (134,851) (140,493) Benefits payments, including refunds of employee contributions (494,152) (741,407) (452,533) (718,599) Administrative expenses (181,447) (186,344) (162,245) (172,502) Net change in plan fiduciary net position $ 2,049,618 $ 1,866,271 $ 267,940 $ 64,759 Plan fiduciary net position - beginning 20,450,576 21,434,841 20,182,636 21,370,082 Plan fiduciary net position - ending (b) $ 22,500,194 $ 23,301,112 $ 20,450,576 $ 21,434,841 Net pension liability - ending (a) - (b) $ 1,827,003 $ 954,554 $ 2,108,619 $ 1,998,120 Plan fiduciary net position as a percentage of the total pension l 92.49% 96.06% 90.65% 91.47% Covered - employee payroll $ 9,306,674 $ 4,429,828 $ 7,395,958 $ 3,608,769 Net pension liability as a percentage of covered-employee payro 19.63% 21.55% 28.51% 55.37% Note to Schedule * Fiscal Year 2015 was the 1 st year of implementation See report of independent auditors. 37
45 SunLine Transit Agency Schedule of Contributions Bargaining Plan Last Ten Years* Contributions in Relation to Contributions Actuarially the Actuarially Contributions as a % of Year Ended Determined Determined Deficiency Covered Covered December 31 Contribution Contribution (Excess) Payroll Payroll , ,347 (57,835) 5,531, % , ,759 (70,391) 5,746, % ,118,112 1,095,054 23,058 6,415, % ,021,656 1,118,615 (96,959) 6,688, % ,580 1,028,823 (69,243) 6,514, % ,011,840 1,045,458 (33,618) 6,593, % , ,727 (82,939) 6,862, % , ,727 (145,141) 7,171, % ,288 1,017,569 (126,281) 7,395, % ,175,179 1,171,779 3,400 9,306, % Notes to Schedule Actuarially determined contributions are calculated annually, at the beginning of each Plan year in which contributions are reported Methods and assumptions used to determine contributions are as follows: Actuarial cost method Aggregate Actuarial Cost Method Amortization method Level percentage of payroll Remaining amortization period Remaining working lifetime Asset valuation method Actuarial value of assets is the market value of funds held by custodian with accrued contributions and accrued interest and dividends. Inflation 2.75% Salary increases 3.00%, including merit, seniority, and inflation. Investment rate of return 6.00% per annum, net of investment expenses, compounded annually. Retirement age Retirement age varies based on employees' age and year of service Mortality RP-2006 Blue Collar Mortality Tables with generational improvements beginning in 2006 based on the Social Security Administration's assumption scale. After disablement, the RP-2006 Disabled Retiree Table with generational improvements beginning in 2006 based on the Social Security Administation's assumption scale. The RP-2006 Mortality Tables are the RP-2014 Mortality tables with the MP-2014 generational projection scale removed from the central year of the study (2006) to See report of independent auditors. 38
46 SunLine Transit Agency Schedule of Contributions Non-Bargaining Plan Last Ten Years* Contributions in Relation to Contributions Actuarially the Actuarially Contributions as a % of Year Ended Determined Determined Deficiency Covered Covered December 31 Contribution Contribution (Excess) Payroll Payroll 2007 $ 935,508 $ 1,072,325 $ (136,817) $ 3,007, % ,600 1,062,471 (110,871) 3,429, % ,265,400 1,222,443 42,957 3,525, % ,162,812 1,192,577 (29,765) 3,725, % ,013,700 1,072,780 (59,080) 3,512, % ,063,500 1,120,580 (57,080) 3,295, % ,708 1,168,010 (207,302) 3,288, % , ,711 (261,319) 3,626, % , ,058 (133,870) 3,608, % ,053,887 1,043,297 10,590 4,429, % Notes to Schedule Actuarially determined contributions are calculated annually, at the beginning of each Plan year in which contributions are reported Methods and assumptions used to determine contributions are as follows: Actuarial cost method Aggregate Actuarial Cost Method Amortization method Level percentage of payroll Remaining amortization period Remaining working lifetime Asset valuation method Actuarial value of assets is the market value of funds held by custodian with accrued contributions and accrued interest and dividends. Inflation 2.75% Salary increases 4.00% Investment rate of return 6.00% per annum, net of investment expenses, compounded annually. Retirement age Retirement age varies based on employees' age and year of service Mortality RP-2006 Blue Collar Mortality Tables with generational improvements beginning in 2006 based on the Social Security Administration's assumption scale. After disablement, the RP-2006 Disabled Retiree Table with generational improvements beginning in 2006 based on the Social Security Administation's assumption scale. The RP-2006 Mortality Tables are the RP-2014 Mortality tables with the MP-2014 generational projection scale removed from the central year of the study (2006) to See report of independent auditors. 39
47 SUPPLEMENTARY INFORMATION
48 Sunline Transit Agency Combining Statements of Net Position June 30, 2017 and STA SSG Total STA SSG Total ASSETS Current assets: Cash and investments $ 7,278,660 $ 497,095 $ 7,775,755 $ 5,182,598 $ 484,630 $ 5,667,228 Accounts receivable, net 477,034 35, , ,438 12, ,688 Due from other governmental agencies 6,658,320-6,658,320 3,222,656-3,222,656 Due from STA 45,548-45,548 47,402-47,402 Inventory 799, , , ,960 Prepaid expennse 481, , , ,661 Total current assets 15,740, ,209 16,272,709 10,000, ,880 10,497,595 Noncurrent assets: Deposits 589, , , ,515 Capital assets, not depreciated 8,608,925-8,608,925 6,592,942-6,592,942 Capital assets, depreciated 44,341,626 9,137 44,350,763 44,561,911 15,557 44,577,468 Total noncurrent assets 53,540,079 9,137 53,549,216 51,654,368 15,557 51,669,925 Total assets 69,280, ,346 69,821,925 61,655, ,437 62,167,520 DEFERRED OUTFLOW OF RESOURCES Deferred amounts from pension 2,782,255-2,782,255 3,957,884-3,957,884 LIABILITES Current liabilities: Accounts payable and accrued liabilities 966,639 3, , ,664 13, ,064 Accrued payroll and related liabilities 269,572 1, , ,287 4, ,408 Due to other governmental agencies Riverside County Transportation Commission 3,000,000-3,000, Due to STA - 45,548 45,548-47,402 47,402 Unearned revenue 5,011,451-5,011,451 2,589,008-2,589,008 Net pension liability - current portion 2,026,177-2,026,177 2,177,519-2,177,519 Compensated absences payable 1,505,264 4,448 1,509,712 1,397,975 13,173 1,411,148 Claims payable - current portion 846, , , ,812 Total current liabilities 13,625,684 54,838 13,680,522 8,518,265 78,096 8,596,361 Noncurrent liabilities: Net pension liability 755, ,380 1,929,220-1,929,220 Claims payable 2,743,667-2,743,667 3,045,822-3,045,822 Total noncurrent liabilities 3,499,047-3,499,047 4,975,042-4,975,042 Total liabilities 17,124,731 54,838 17,179,569 13,493,307 78,096 13,571,403 DEFERRED INFLOW OF RESOURCES Deferred amounts from pension 2,284,270-2,284,270 1,261,526-1,261,526 NET POSITION Net investment in capital assets 52,950,551 9,137 52,959,688 51,154,853 15,557 51,170,410 Unrestricted (296,718) 477, ,653 (296,719) 418, ,065 Total net position $ 52,653,833 $ 486,508 $ 53,140,341 $ 50,858,134 $ 434,341 $ 51,292,475 See report of independent auditors. 40
49 Sunline Transit Agency Combining Statements of Revenues, Expenses, and Changes in Net Position Years ended June 30, 2017 and STA SSG Total STA SSG Total OPERATING REVENUES Passenger fares $ 3,055,022 $ - $ 3,055,022 $ 3,200,299 $ - $ 3,200,299 CNG and hydrogen fuel revenues 3,125,917-3,125,917 3,299,395-3,299,395 Taxi license fees - 284, , , ,167 Other 606, , , ,196 Total operating revenues 6,787, ,465 7,071,619 7,131, ,167 7,481,057 Operating expenses Salaries and benefits 24,043,772-24,043,772 22,331,808-22,331,808 Depreciation 7,242,077 6,620 7,248,697 7,124,551 14,295 7,138,846 Vehicle lease 258, , Casualty and liability costs 1,409,171 11,846 1,421,017 2,797,763 3,314 2,801,077 Services 2,704,544 34,438 2,738,982 2,252,215 29,377 2,281,592 Utilities 1,949,540 6,585 1,956,125 1,694,943 3,976 1,698,919 Materials and supplies 1,685,163 3,524 1,688,687 1,591,914 9,683 1,601,597 Administrative - 166, , , ,591 Fuel and lubricants 274, , , ,112 Tires and tubes 213, , , ,948 Taxes 194, , , ,863 Miscellaneous 489,141 2, , ,295 3, ,366 Total operating expenses 40,462, ,498 40,695,402 38,742, ,307 39,081,719 OPERATING LOSS (33,675,750) 51,967 (33,623,783) (31,610,522) 9,860 (31,600,662) NONOPERATING REVENUES Operating grants: Local Transportation Fund 18,470,028-18,470,028 15,029,833-15,029,833 Measure A 5,835,696-5,835,696 6,492,099-6,492,099 Federal Transit Administration -Section , ,668 2,197,912-2,197,912 Federal Transit Administration -Section ,693-6, Federal Transit Administration -Section ,042-40,042 17,564-17,564 Federal Transit Administration -Section , , , ,891 Federal Transit Administration -Section 5311(f) 300, , Federal Transit Administration -Section ,079-15,079 74,850-74,850 Federal Transit Administration -Section ,964-76,964 64,541-64,541 Federal Transit Administration - CMAQ 510, ,642 90,898-90,898 Low-Carbon Transit Operations Program 135, , , ,907 Total operating grants 26,170,975-26,170,975 24,483,495-24,483,495 Interest income 4,069-4,069 2, ,498 Miscellaneous income Gain (loss) on sale of capital assets (34,165) - (34,165) Total nonoperating revenues 26,175, ,175,695 24,451, ,451,828 LOSS BEFORE CAPITAL CONTRIBUTIONS (7,500,255) 52,167 (7,448,088) (7,158,715) 9,881 (7,148,834) CAPITAL CONTRIBUTIONS Capital grants: Federal Transit Administration 3,196,010-3,196,010 1,870,783-1,870,783 State Transit Assistance 1,226,297-1,226, , ,861 Prop 1 B 2,899,239-2,899, , ,977 Local Transportation Fund 165, , , ,115 Other 1,808,679-1,808,679 1,255,361-1,255,361 Total capital contributions 9,295,954-9,295,954 5,012,097-5,012,097 CHANGE IN NET POSITION 1,795,699 52,167 1,847,866 (2,146,618) 9,881 (2,136,737) NET POSITION Beginning of year 50,858, ,341 51,292,475 53,004, ,460 53,429,212 End of year $ 52,653,833 $ 486,508 $ 53,140,341 $ 50,858,134 $ 434,341 $ 51,292,475 See report of independent auditors. 41
50 Sunline Transit Agency Combining Statements of Cash Flows Years Ended June 30, 2017 and STA SSG Total STA SSG Total Cash flows from operating activities Cash received from customers $ 6,934,558 $ 261,601 $ 7,196,159 $ 6,861,568 $ 353,054 $ 7,214,622 Cash payments to suppliers for goods and services (9,850,796) (68,992) (9,919,788) (9,162,327) (42,375) (9,204,702) Cash payments to employees for services (23,410,007) (178,290) (23,588,297) (20,278,372) (289,633) (20,568,005) Net cash provided by (used in) operating activities (26,326,245) 14,319 (26,311,926) (22,579,131) 21,046 (22,558,085) Cash flows from noncapital financing activities Cash received from operating grants 22,750,064-22,750,064 22,876,982-22,876,982 Loan proceeds from RCTC 3,000,000-3,000, Advances to/from SSG 1,854 (1,854) - (59,162) 59,162 - Payment of loan to RCTC (3,000,000) - (3,000,000) Net cash provided by noncapital financing activities 25,751,918 (1,854) 25,750,064 19,817,820 59,162 19,876,982 Cash flows from capital and related financing activities Cash received from capital grants 11,703,644-11,703,644 4,420,077-4,420,077 Acquisition and construction of capital assets (9,037,775) - (9,037,775) (5,012,097) - (5,012,097) Proceeds from sale of capital assets ,443-23,443 Net cash used in capital and related financing activities 2,666,320-2,666,320 (568,577) - (568,577) Cash flows from investing activities Cash received from interest income 4,069-4,069 2, ,498 Net cash provided by investing activities 4,069-4,069 2, ,498 Change in cash and cash equivalents 2,096,062 12,465 2,108,527 (3,327,411) 80,229 (3,247,182) Cash and cash equivalents, beginning of year 5,182, ,630 5,667,228 8,510, ,401 8,914,410 Cash and cash equivalents, end of year $ 7,278,660 $ 497,095 $ 7,775,755 5,182,598 $ 484,630 $ 5,667,228 Reconciliation of operating income (loss) to net cash provided by (used in) operating activities: Operating income (loss) $ (33,675,750) $ 51,967 $ (33,623,783) (31,618,095) $ 17,433 $ (31,600,662) Provision for doubtful accounts Depreciation 7,242,077 6,620 7,248,697 7,124,551 14,295 7,138,846 Changes in operating assets and liabilities Accounts receivable 146,575 (22,864) 123,711 (271,151) 4,587 (266,564) Inventory (34,935) - (34,935) (181,210) - (181,210) Prepaid items (322,382) - (322,382) (137,345) - (137,345) Deposits (90,013) - (90,013) (199,321) - (199,321) Deferred outflows of resources 1,175,629-1,175,629 (642,997) - (642,997) Accounts payable and accrued liabilities 168,975 (9,696) 159,279 (111,414) 9,464 (101,950) Retention payable (672,718) - (672,718) Accrued payroll and related liabilities (346,715) (2,983) (349,698) (74,530) (6,534) (81,064) Net pension liability (1,325,182) - (1,325,182) 1,707,180-1,707,180 Compensated absences 107,289 (8,725) 98, ,931 (9,926) 129,005 Claims payable (395,386) - (395,386) 1,425,734-1,425,734 Unearned revenue (700) (700) Deferred inflows of resources 1,022,744-1,022, , ,852 Net cash provided by (used in) operating activities $ (26,326,245) $ 14,319 $ (26,311,926) $ (22,586,704) $ 28,619 $ (22,558,085) See report of independent auditors. 42
51 Report of Independent Auditors on Internal Control over Financial Reporting and on Compliance and Other Matters Based on an Audit of Financial Statements Performed in Accordance with Government Auditing Standards Board of Directors Sunline Transit Agency We have audited, in accordance with the auditing standards generally accepted in the United States of America and the standards applicable to financial audits contained in Government Auditing Standards issued by the Comptroller General of the United States, the financial statements of the Sunline Transit Agency (STA), which comprise the statements of net position as of June 30, 2017, the related statements of revenues, expenses and changes in net position, and cash flows for the year then ended, and the related notes to the financial statements, and have issued our report thereon dated September 28, Internal Control over Financial Reporting In planning and performing our audit of the financial statements, we considered STA's internal control over financial reporting (internal control) to determine the audit procedures that are appropriate in the circumstances for the purpose of expressing our opinion on the financial statements, but not for the purpose of expressing an opinion on the effectiveness of STA s internal control. Accordingly, we do not express an opinion on the effectiveness of STA s internal control. A deficiency in internal control exists when the design or operation of a control does not allow management or employees, in the normal course of performing their assigned functions, to prevent, or detect and correct, misstatements on a timely basis. A material weakness is a deficiency, or a combination of deficiencies, in internal control such that there is a reasonable possibility that a material misstatement of the entity s financial statements will not be prevented, or detected and corrected on a timely basis. A significant deficiency is a deficiency, or a combination of deficiencies, in internal control that is less severe than a material weakness, yet important enough to merit attention by those charged with governance. Our consideration of internal control was for the limited purpose described in the first paragraph of this section and was not designed to identify all deficiencies in internal control that might be material weaknesses or significant deficiencies. Given these limitations, during our audit we did not identify any deficiencies in internal control that we consider to be material weaknesses. However, material weaknesses may exist that have not been identified. 43
52 Compliance and Other Matters As part of obtaining reasonable assurance about whether STA's financial statements are free from material misstatement, we performed tests of its compliance with certain provisions of laws, regulations, contracts, and grant agreements, contained in the State of California Department of Transportation, Article 4 of the Transportation Development Act, the Public Transportation Modernization, Improvement and Service Enhancement Account (PTMISEA) described in California Government Code , the Transit System Safety, Security and Disaster Response Account (TSSSDRA) described in California Government Code , noncompliance with which could have a direct and material effect on the determination of financial statement amounts. However, providing an opinion on compliance with those provisions was not an objective of our audit, and accordingly, we do not express such an opinion. The results of our tests disclosed no instances of noncompliance or other matters that are required to be reported under Government Auditing Standards. Purpose of this Report The purpose of this report is solely to describe the scope of our testing of internal control and compliance and the result of that testing, and not to provide an opinion on the effectiveness of STA s internal control or on compliance. This report is an integral part of an audit performed in accordance with Government Auditing Standards in considering the entity s internal control and compliance. Accordingly, this communication is not suitable for any other purpose. Los Angeles, California September 28,
53 Vasquez & Company LLP has over 45 years of experience in performing audit, accounting & consulting services for all types of nonprofit organizations, for-profit companies, governmental entities and publicly traded companies. Vasquez is a member of the RSM US Alliance. RSM US Alliance provides its members with access to resources of RSM US LLP. RSM US Alliance member firms are separate and independent businesses and legal entities that are responsible for their own acts and omissions, and each are separate and independent from RSM US LLP. RSM US LLP is the U.S. member firm of RSM International, a global network of independent audit, tax, and consulting firms. Members of RSM US Alliance have access to RSM International resources through RSM US LLP but are not member firms of RSM International. Visit rsmus.com/about us for more information regarding RSM US LLP and RSM International. The RSM logo is used under license by RSM US LLP. RSM US Alliance products and services are proprietary to RSM US LLP. 801 South Grand Avenue, Suite 400 Los Angeles, California Ph. (213) Fax (213)

54 SunLine Services Group Audited Financial Statements As of and for the Years Ended June 30, 2017 and 2016 with Report of Independent Auditors
55 SunLine Services Group Audited Financial Statements As of and for the Years Ended June 30, 2017 and 2016 with Report of Independent Auditors
56 SunLine Services Group Table of Contents PAGE REPORT OF INDEPENDENT AUDITORS 1 MANAGEMENT S DISCUSSION AND ANALYSIS 3 FINANCIAL STATEMENTS Statements of Net Position 7 Statements of Revenues, Expenses, and Changes in Net Position 8 Statements of Cash Flows 9 Notes to Financial Statements 10 REPORT OF INDEPENDENT AUDITORS ON INTERNAL CONTROL OVER FINANCIAL REPORTING AND ON COMPLIANCE AND OTHER MATTERS BASED ON AN AUDIT OF FINANCIAL STATEMENTS PERFORMED IN ACCORDANCE WITH GOVERNMENT AUDITING STANDARDS 15
57 Report of Independent Auditors Board of Directors SunLine Services Group Thousand Palms, California Report on the Financial Statements We have audited the accompanying financial statements of SunLine Services Group (SSG), a component unit of SunLine Transit Agency (STA), which comprise the statements of net position as of June 30, 2017 and 2016 and the related statements of revenues, expenses and changes in net position, and cash flows for the years then ended, and the related notes to the financial statements. Management s Responsibility for the Financial Statements Management is responsible for the preparation and fair presentation of these financial statements in accordance with accounting principles generally accepted in the United States of America; this includes the design, implementation, and maintenance of internal control relevant to the preparation and fair presentation of financial statements that are free from material misstatement, whether due to fraud or error. Auditors Responsibility Our responsibility is to express an opinion on these financial statements based on our audits. We conducted our audits in accordance with auditing standards generally accepted in the United States of America and the standards applicable to financial audits contained in Government Auditing Standards, issued by the Comptroller General of the United States. Those standards require that we plan and perform the audits to obtain reasonable assurance about whether the financial statements are free from material misstatement. An audit involves performing procedures to obtain audit evidence about the amounts and disclosures in the financial statements. The procedures selected depend on the auditor s judgment, including the assessment of the risks of material misstatement of the financial statements, whether due to fraud or error. In making those risk assessments, the auditor considers internal control relevant to the entity s preparation and fair presentation of the financial statements in order to design audit procedures that are appropriate in the circumstances, but not for the purpose of expressing an opinion on the effectiveness of the entity s internal control. Accordingly, we express no such opinion. An audit also includes evaluating the appropriateness of accounting policies used and the reasonableness of significant accounting estimates made by management, as well as evaluating the overall presentation of the financial statements. We believe that the audit evidence we have obtained is sufficient and appropriate to provide a basis for our audit opinion. 1
58 Opinion In our opinion, the financial statements referred to above present fairly, in all material respects, the financial position of SunLine Services Group as of June 30, 2017 and 2016, and the changes in its financial position, and its cash flows for the years then ended in accordance with accounting principles generally accepted in the United States of America. Emphasis of Matter As discussed in Note 9 to the financial statements, the 2016 financial statements have been restated to adjust depreciation reported in prior year. Our opinion is not modified with respect to this matter. Other Matters Required Supplementary Information Accounting principles generally accepted in the United States of America require that the management s discussion and analysis on pages 3 through 6 be presented to supplement the financial statements. Such information, although not a part of the financial statements, is required by the Governmental Accounting Standards Board, who considers it to be an essential part of financial reporting for placing the financial statements in an appropriate operational, economic, or historical context. We have applied certain limited procedures to the required supplementary information in accordance with auditing standards generally accepted in the United States of America, which consisted of inquiries of management about the methods of preparing the information and comparing the information for consistency with management s responses to our inquiries, the financial statements, and other knowledge we obtained during our audit of the financial statements. We do not express an opinion or provide any assurance on the information because the limited procedures do not provide us with sufficient evidence to express an opinion or provide any assurance. Other Reporting Required by Government Auditing Standards In accordance with Government Auditing Standards, we have also issued our report dated September 28, 2017 on our consideration of SSG s internal control over financial reporting and on our tests of its compliance with certain provisions of laws, regulations, contracts, and grant agreements and other matters. The purpose of that report is solely to describe the scope of our testing of internal control over financial reporting and compliance and the results of that testing, and not to provide an opinion on the effectiveness of SSG s internal control over financial reporting or on compliance. That report is an integral part of an audit performed in accordance with Government Auditing Standards in considering SSG s internal control over financial reporting and compliance. Los Angeles, California September 28,
59 SunLine Services Group Management s Discussion and Analysis Year ended June 30, 2017 The management of SunLine Services Group (SSG) offers readers of the SSG's financial statements narrative overview and analysis of the financial activities of SSG for the fiscal years (FY) ended June 30, 2017 and We encourage readers to consider the information presented here in conjunction with the audited financial statements including the notes to the financial statements. FINANCIAL HIGHLIGHTS Total assets of SSG exceeded its liabilities at the close of the fiscal year by $486,508 in 2017 and $434,341 in At June 30, 2017, net position consisted of $9,137 net investment in capital assets and $477,371 of unrestricted net position. SSG's net position increased in FY 2017 by $52,167. Operating revenues decreased by $64,523, however, operating expenses also decreased by $106,809 during the year. The decrease in operating revenues in FY 2017 when compared to FY 2016 was due to the decrease in operating vehicle permits and passenger surcharge fees in FY 2017 because of competition from the Uber transport services. OVERVIEW OF THE FINANCIAL STATEMENTS This discussion and analysis are intended to serve as an introduction to SSG's financial statements. SSG's financial statements consist of two components: Financial statements; and, Notes to financial statements. Financial Statements The financial statements are designed to provide readers with a broad overview of SSG's finances, in a manner similar to a private sector business. The Statement of Net Position presents information on all of SSG's assets and liabilities, with the difference between the two reported as net position. Over time, increases or decreases in net position may serve as a useful indicator of whether SSG's financial position is improving or deteriorating. The presentation of net position also distinguishes between those invested in capital assets, those that are restricted by external parties or legal requirements, or those that are unrestricted and can be used for any purpose. The Statement of Revenues, Expenses and Changes in Net Position provide information regarding the revenues generated and earned and the expenses incurred related to those revenues. The difference between the revenues and expenses represents the change in net position, or profitability as reflected by the amount of change in net position generated for the fiscal year. The Statement of Cash Flows presents information on SSG's sources and uses of cash and the overall change in cash and cash equivalents over the fiscal year. These activities are categorized by the different activities in which SSG engages: operating activities, noncapital financing activities, capital and related financing activities, and investing activities. Notes to Financial Statements The notes provide information on significant accounting policies, cash and investments, accounts receivable, capital assets, compensated absences, and other areas for a full understanding of the data in the financial statements. 3
60 SunLine Services Group Management s Discussion and Analysis June 30, 2017 FINANCIAL STATEMENT ANALYSIS Net Position As stated earlier, increases or decreases in net position over time may serve as a useful indicator of SSG's financial position. At June 30, 2017, SSG's assets exceeded liabilities by $486,508, a $52,167 increase from June 30, A condensed summary of the Statements of Net Position as of June 30, 2017 and 2016 is shown below: (as restated) Changes Current and other assets $ 532,209 $ 496,880 $ 35,329 Capital assets 9,137 15,557 (6,420) Total assets 541, ,437 28,909 Current liabilities 54,838 78,096 (23,258) Total liabilities 54,838 78,096 (23,258) Net Position: Net investment in capital assets 9,137 15,557 (6,420) Unrestricted 477, ,784 58,587 Total net position $ 486,508 $ 434,341 $ 52,167 SSG's investment in capital assets represents acquisition of service vehicles and peripheral equipment for operations, and administrative support. SSG uses these capital assets to provide services to regulate, license, and franchise taxicabs and alternative transportation in the Coachella Valley. Because of this, these assets are not available for future spending. The decrease of $6,420 in net investment in capital assets at June 30, 2017, resulted primarily from the depreciation of capital assets. Unrestricted net position represents the portion of net position that can be used to finance day-today operations without constraints by debt covenants, enabling legislation, or other legal requirements. Unrestricted net position increased by $58,587 due to higher revenues generated than expenses incurred during FY Changes in Net Position For the fiscal years ended June 30, 2017 and 2016, SSG's revenues were $284,465, and $349,188, respectively, while the total expenses, excluding depreciation, were $225,878 and $325,012, respectively. The table below presents financial data related to the change in net position of $52,167 and $9,881 during the fiscal years ended June 30, 2017 and 2016, respectively. The lower operating revenues in 2017 than 2016 was primarily due to decrease in revenues from operating vehicle permits and passenger surcharge fees because of competition from the Uber transport services. 4
61 SunLine Services Group Management s Discussion and Analysis June 30, 2017 (as restated) Changes REVENUES Operating vehicle permit fees $ 79,150 $ 90,941 $ (11,791) Passenger surcharge fees 181, ,071 (35,426) Driving permits and inspection fees 17,460 38,615 (21,155) Interest and other revenues 6,410 2,561 3,849 Total revenues 284, ,188 (64,523) CONTROLLABLE OPERATING EXPENSES Administrative 166, ,591 (109,009) Services 34,438 29,377 5,061 Materials and supplies 3,524 9,683 (6,159) Utilities 6,585 3,976 2,609 Casualty and liability 11,846 3,314 8,532 Miscellaneous 2,903 3,071 (168) Total controllable operating expenses 225, ,012 (99,134) Depreciation 6,620 14,295 (7,675) Total expenses 232, ,307 (106,809) CHANGES IN NET POSITION 52,167 9,881 42,286 NET POSITION Beginning of year 434, ,460 9,881 End of year $ 486,508 $ 434,341 $ 52,167 Revenues Operating revenues decreased by $64,523 from 2017 due to the decrease in operating vehicle permits and passenger surcharge fees as a result of the competition from the Uber transport services. Expenses Adopted SSG policies, procedures, and business processes are used as management tools to control expenses and attain goals and objectives. These controllable operating expenses consist of cost elements that exclude depreciation. For purposes of this analysis, operating expenses before depreciation will be discussed. These expenses totaled $225,878 and $325,012 during the fiscal years ended June 30, 2017 and 2016, respectively. Operating expenses before depreciation decreased by $99,134 from The decrease is primarily due to decrease in administrative expenses such as decrease in salaries expenses allocated by STA during the year. 5
62 SunLine Services Group Management s Discussion and Analysis Year ended June 30, 2017 Capital assets SSG's investment in capital assets amounted to $9,137 and $15,557 (net of accumulated depreciation), as of June 30, 2017 and 2016, respectively. This investment in capital assets includes service vehicles, facilities/structures, and peripheral equipment for operations, and administrative support. These capital assets were acquired using internally generated funds. ECONOMIC FACTORS AND NEXT YEAR S BUDGETS These significant factors were considered as budget assumptions when preparing SSG s budget for FY 2018: Uber has continued to increase its market share and the effect has had a negative impact on Taxi revenues. The decrease in the SSG budget is mainly attributed to a continued decrease in Taxi ridership. Projected revenues are 14.45% below the budgeted amount in FY Vehicle inspection and re-inspection revenue is no longer a source of income for SRA in FY Allocated overhead was distributed to specific general ledger accounts to identify the appropriate expense e.g., utilities, postage, insurance expense. The administrative salaries were reduced by 16.22% due to a reduction in allocated salaries. The lower total salaries contributed to lower fringe expenses. Total expenses were further reduced by reducing the budget in maintenance contracts, repair parts, staff development, and other miscellaneous expenses. REQUESTS FOR INFORMATION This financial report is designed to provide a general overview of SSG's finances for all those with an interest in SSG's finances. Questions concerning any of the information provided in this report or requests for additional financial information should be addressed to the Director of Finance, SunLine Services Group, Harry Oliver Trail, Thousand Palms, CA
63 SunLine Services Group Statements of Net Position June 30 (as restated) ASSETS Current assets Cash and cash equivalents $ 497,095 $ 484,630 Accounts receivable 35,114 12,250 Total current assets 532, ,880 Noncurrent assets Capital assets, net of accumulated depreciation 9,137 15,557 Total assets 541, ,437 LIABILITIES Current liabilities Accounts payable and accrued liabilities 3,704 13,400 Advances from SunLine Transit Agency 45,548 47,402 Accrued payroll and related liabilities 1,138 4,121 Compensated absences 4,448 13,173 Total current liabilities 54,838 78,096 NET POSITION Net investment in capital assets 9,137 15,557 Unrestricted 477, ,784 Total net position $ 486,508 $ 434,341 See notes to financial statements. 7
64 SunLine Services Group Statements of Revenues, Expenses, and Changes in Net Position Years ended June 30 (as restated) OPERATING REVENUES Operating vehicle permit fees $ 79,150 $ 90,941 Passenger surcharge fees 181, ,071 Driving permits and inspection fees 17,460 38,615 Other 6,210 2,540 Total operating revenues 284, ,167 OPERATING EXPENSES Administrative 166, ,591 Services 34,438 29,377 Materials and supplies 3,524 9,683 Utilities 6,585 3,976 Casualty and liability 11,846 3,314 Depreciation 6,620 14,295 Miscellaneous 2,903 3,071 Total operating expenses 232, ,307 OPERATING INCOME 51,967 9,860 NONOPERATING REVENUE Miscellaneous income Interest income - 21 CHANGE IN NET POSITION 52,167 9,881 NET POSITION Beginning of year 434, ,460 End of year $ 486,508 $ 434,341 See notes to financial statements. 8
65 SunLine Services Group Statements of Cash Flows Years ended June Cash flows from operating activities: Cash received from customers $ 261,601 $ 353,054 Cash payments to suppliers for goods and services (68,992) (42,375) Cash payments to employees for services (178,290) (289,633) Net cash provided by operating activities 14,319 21,046 Cash flows from financing activity: Receipt (payment) of advances from SunLine Transit Agency (1,854) 59,162 Cash provided by financing activity (1,854) 59,162 Cash flows from investing activity: Interest received - 21 Cash provided by investing activity - 21 Change in cash and cash equivalents 12,465 80,229 Cash and cash equivalents, beginning of year 484, ,401 Cash and cash equivalents, end of year $ 497,095 $ 484,630 Reconciliation of operating income to net cash provided by (used in) operating activities: Operating income $ 51,967 $ 9,860 Depreciation 6,620 14,295 Change in operating assets and liabilities: Accounts receivable (22,864) 4,587 Accounts payable and accrued liabilities (9,696) 9,464 Accrued payroll and related liabilities (2,983) (6,534) Compensated absences (8,725) (9,926) Unearned revenue - (700) Net cash provided by operating activities $ 14,319 $ 21,046 See notes to financial statements. 9
66 SunLine Services Group Notes to Financial Statements Years ended June 30, 2017 and 2016 NOTE 1 REPORTING ENTITY SunLine Services Group (SSG) was formed in 1993 in order to enhance public/private partnerships in the Coachella Valley. SSG operations include regulating, licensing, and franchising of the taxicabs and alternative transportation in the Coachella Valley. Effective July 1, 1996, SSG adopted ordinances to give it the authority to regulate taxicabs. SSG is accounted for as a blended component unit of SunLine Transit Agency (STA). STA was formed by the County of Riverside, California, and the cities in the Coachella Valley to provide transportation services in the Coachella Valley. The accompanying financial statements present only SSG s financial information and are not intended to present fairly the financial position, change in financial position, or cash flows of STA as a whole, in conformity with accounting principles generally accepted in the United States of America. NOTE 2 SUMMARY SIGNIFICANT ACCOUNTING POLICIES Basis of Presentation The financial statements have been prepared in conformity with accounting principles generally accepted in the United States of America as applied to governmental agencies. Governmental Accounting Standards Board (GASB) is the accepted standard-setting body for establishing governmental accounting and financial reporting standards. The financial statements (i.e., the statement of net position, the statement of revenues, expenses and changes in net position, and statement of cash flows) report information on all of the activities of SSG. Basis of Accounting and Measurement Focus The financial statements are reported using the "economic resources" measurement focus and the accrual basis of accounting. Revenues are recorded when earned and expenses are recorded when a liability is incurred, regardless of the timing of related cash flows. Grants and similar items are recognized as revenue when all eligibility requirements have been met. Interest associated with the current fiscal period is considered to be susceptible to accrual and so has been recognized as revenue of the current fiscal period. Operating revenues are those revenues that are generated from the primary operations of SSG. The principal operating revenues of SSG are operating vehicle permit fees, passenger surcharge fees, and driving permit and inspection fees. Operating expenses include the cost of services, administrative expenses, and depreciation on capital assets. All revenues and expenses not meeting this definition are reported as nonoperating revenues and expenses. 10
67 SunLine Services Group Notes to Financial Statements Years ended June 30, 2017 and 2016 NOTE 2 SUMMARY SIGNIFICANT ACCOUNTING POLICIES (CONTINUED) Deferred inflows and outflows of resources In accordance with GASB Statement No. 63, Financial Reporting of Deferred Outflows of Resources, Deferred Inflows of Resources, and Net Position, the Statement of Net Position reports separate sections for Deferred Outflows of Resources, and Deferred Inflows of Resources, when applicable. Deferred Outflows of Resources represent outflows of resources (consumption of net position) that apply to future periods and that, therefore, will not be recognized as an expense until that time. Deferred Inflows of Resources represent inflows of resources (acquisition of net position) that apply to future periods and that, therefore, are not recognized as revenue until that time. Cash and Cash Equivalents Cash and cash equivalents include all highly liquid investments with original maturities of 90 days or less and are carried at cost, which approximates fair value. Investments Investments are stated at fair value, which is based on quoted market price. Changes in fair value that occur during the fiscal year are recognized as investment income reported for that fiscal year. Investment income includes interest earnings, changes in fair value, and any gains or losses realized upon the liquidation or sale of investments. Accounts Receivable Accounts receivable are shown net of allowances for doubtful accounts, if any. Federal and State grants are reported as revenue when all eligibility requirements have been met. Amount earned but outstanding at year-end are reported as accounts receivable. Capital Assets Capital assets which consist of service vehicles, facilities/structures, and peripheral equipment for operations and administrative support are stated at cost or, for donated assets, at fair value at the date of donation. SSG capitalizes all assets with acquisition cost of at least $1,000 and useful life of at least one year. The cost of normal maintenance and repairs that do not add to the value of the assets and do not materially extend asset lives are charged to operations as incurred. Depreciation is recorded on a straight-line basis over estimated useful lives of the assets ranging from three to seven years. Compensated Absences It is SSG's policy to permit employees to accumulate earned but unused vacation leave up to 500 hours and unlimited hours for unused sick leave. Management, nonexempt, and union employees begin to accrue vested vacation and sick hours upon being hired, except for part-time employees who begin to accrue such hours after the first year. Accumulated unpaid vacation and vested sick leave pay is recorded as an expense and a liability at the time the benefit is earned. 11
68 SunLine Services Group Notes to Financial Statements Years ended June 30, 2017 and 2016 NOTE 2 SUMMARY SIGNIFICANT ACCOUNTING POLICIES (CONTINUED) Net Position Net Position is classified as follows: Net investment in capital assets - This component of net position consists of capital assets, net of accumulated depreciation, reduced by the outstanding balances of debt that are attributable to the acquisition, construction, or improvement of those assets. Restricted - This component of net position consists of restricted assets reduced by liabilities and deferred inflows of resources related to those assets. Unrestricted - This component of net position is the amounts of the assets, deferred outflows of resources, reduced by liabilities, and deferred inflows of resources that are not included in the determination of net investments in capital assets or the restricted component of net position. Use of Restricted/Unrestricted Resources When both restricted and unrestricted resources are available for use, it is SSG's policy to use restricted resources first, then unrestricted resources as they are needed. Regulatory Administration Fees Regulatory administration fees consist of permit fees, inspection fees, and passenger surcharge fees. Inspection fees and passenger surcharge fees are recognized as revenue when such services are rendered. Permit fees are recognized when permits are issued. Use of Estimates The preparation of financial statements in conformity with accounting principles generally accepted in the United States of America requires management to make estimates and assumptions that affect the reported amounts of assets and liabilities and disclosure of the contingent assets and liabilities at the date of the financial statements and the reported amounts of revenue and expenses during the reporting period. Actual results could differ from those estimates. NOTE 3 CASH AND CASH EQUIVALENTS The carrying amounts of SSG's cash deposits were $497,095 and $484,630 at June 30, 2017 and 2016, respectively. Bank balances at June 30, 2017 and 2016 was $507,409 and $473,193, respectively, which were fully insured and/or collateralized with securities held by the pledging financial institution in SSG's name as discussed below. The California Government Code requires California banks and savings and loan associations to secure SSG s cash deposits by pledging securities as collateral. This Code states that collateral pledged in this manner shall have the effect of perfecting a security interest in such collateral superior to those of a general creditor. Thus, collateral for cash deposits is considered to be held in SSG s name. 12
69 SunLine Services Group Notes to Financial Statements Years ended June 30, 2017 and 2016 NOTE 3 CASH AND CASH EQUIVALENTS (CONTINUED) The market value of pledged securities must equal at least 110% of SSG s cash deposits. California law also allows institutions to secure SSG s deposits by pledging first trust deed mortgage notes having a value of 150% of SSG s total cash deposits. SSG may waive collateral requirements for cash deposits, which are fully insured up to $250,000 by the Federal Deposit Insurance Corporation ( FDIC ). SSG, however, has not waived the collateralization requirements. NOTE 4 CAPITAL ASSETS Summary of changes in capital assets for the years ended June 30 is as follows: Balance at July 1, 2016 (as restated) Additions Deletions Balance at June 30, 2017 Depreciable assets: Vehicles $ 342,357 $ - $ - $ 342,357 Equipment 50, ,087 Total depreciable assets 392, ,444 Accumulated depreciation (376,887) (6,620) 200 (383,307) Net capital assets $ 15,557 $ (6,620) $ 200 $ 9,137 Balance at July 1, 2015 Additions Deletions Balance at June 30, 2016 Depreciable assets: Structures $ 65,434 $ - $ (65,434) $ - Vehicles 342, ,357 Equipment 52,874 - (2,787) 50,087 Total depreciable assets 460,665 - (68,221) 392,444 Accumulated depreciation (430,813) (14,295) 68,221 (376,887) Net capital assets $ 29,852 $ (14,295) $ - $ 15,557 Depreciation expense was $6,620 and $14,295 for the years ended June 30, 2017 and 2016, respectively. NOTE 5 RELATED PARTY TRANSACTIONS STA s staff and resources are used in the performance of its responsibilities relating to the activities of SSG. Accordingly, STA allocates salaries and benefits to SSG on the basis of actual hours spent by activity. Other indirect overhead is allocated based on management's estimates. The fees to reimburse STA are billed to SSG monthly. For the year ended June 30, 2017 and 2016, STA charged SSG $166,582 and $275,591, respectively, for administrative services. 13
70 SunLine Services Group Notes to Financial Statements Years ended June 30, 2017 and 2016 NOTE 6 COMPENSATED ABSENCES Compensated absences at June 30, 2017 and 2016, amounted to $4,448 and $13,173, respectively. There is no fixed payment schedule for compensated absences. NOTE 7 RISK MANAGEMENT SSG is insured through STA for its general liability and worker's compensation insurance. Claims liabilities and the related claims expenses are not included in the accompanying financial statements because claims are not identifiable between STA and SSG. Claim liabilities at June 30, 2017 and 2016 are displayed in the financial statements of STA in the amount of $3,590,248 and $3,985,634, respectively. Refer to the audited financial statements of STA for additional information. NOTE 8 COMMITMENT AND CONTINGENCIES SSG may become involved in various legal actions, administrative proceedings, or claims in the ordinary course of operations. Although it is not possible to predict with certainty the outcome of these actions or the range of possible loss or recovery, it is the opinion of SSG's legal counsel and SSG's management that the resolution of these matters will not have a material adverse effect on the financial condition of SSG. NOTE 9 RESTATEMENT OF PRIOR YEAR S FINANCIAL STATEMENTS The 2017 financial statements of SSG were restated to reflect the depreciation of a support vehicle that was recorded in error in STA s books in FY Depreciable assets, net of depreciation Net position, end of year Depreciation Expense Balance, as previously reported $ 23,130 $ 6,722 $ 441,914 Adjustments (7,573) 7,573 (7,573) Balance, as adjusted $ 15,557 $ 14,295 $ 434,341 NOTE 10 SUBSEQUENT EVENTS SSG has evaluated events subsequent to June 30, 2017 to assess the need for potential recognition or disclosure in the financial statements. Such events were evaluated through September 28, 2017, the date the financial statements were available to be issued. Based upon this evaluation, it was determined that no subsequent events occurred that require recognition or additional disclosure in the financial statements. 14
71 Report of Independent Auditors on Internal Control over Financial Reporting and on Compliance and Other Matters Based on an Audit of Financial Statements Performed in Accordance with Government Auditing Standards Board of Directors SunLine Services Group Thousand Palms, California We have audited, in accordance with the auditing standards generally accepted in the United States of America and the standards applicable to financial audits contained in Government Auditing Standards issued by the Comptroller General of the United States, the financial statements of the SunLine Services Group (SSG), a component unit of SunLine Transit Agency (STA), which comprise the statement of net position as of June 30, 2017, and the related statements of revenues, expenses and change in net position, and cash flows for the year then ended, and the related notes to the financial statements, and have issued our report thereon dated September 28, Internal Control over Financial Reporting In planning and performing our audit of the financial statements, we considered SSG's internal control over financial reporting (internal control) to determine the audit procedures that are appropriate in the circumstances for the purpose of expressing our opinion on the financial statements, but not for the purpose of expressing an opinion on the effectiveness of SSG s internal control. Accordingly, we do not express an opinion on the effectiveness of SSG s internal control. A deficiency in internal control exists when the design or operation of a control does not allow management or employees, in the normal course of performing their assigned functions, to prevent, or detect and correct, misstatements on a timely basis. A material weakness is a deficiency, or a combination of deficiencies, in internal control such that there is a reasonable possibility that a material misstatement of the entity s financial statements will not be prevented, or detected and corrected on a timely basis. A significant deficiency is a deficiency, or a combination of deficiencies, in internal control that is less severe than a material weakness, yet important enough to merit attention by those charged with governance. Our consideration of internal control was for the limited purpose described in the first paragraph of this section and was not designed to identify all deficiencies in internal control that might be material weaknesses or significant deficiencies. Given these limitations, during our audit we did not identify any deficiencies in internal control that we consider to be material weaknesses. However, material weaknesses may exist that have not been identified. 15
72 Compliance and Other Matters As part of obtaining reasonable assurance about whether SSG's financial statements are free from material misstatement, we performed tests of its compliance with certain provisions of laws, regulations, contracts, and grant agreements, noncompliance with which could have a direct and material effect on the determination of financial statement amounts. However, providing an opinion on compliance with those provisions was not an objective of our audit, and accordingly, we do not express such an opinion. The results of our tests disclosed no instances of noncompliance or other matters that are required to be reported under Government Auditing Standards. Purpose of this Report The purpose of this report is solely to describe the scope of our testing of internal control and compliance and the result of that testing, and not to provide an opinion on the effectiveness of SSG s internal control or on compliance. This report is an integral part of an audit performed in accordance with Government Auditing Standards in considering the entity s internal control and compliance. Accordingly, this communication is not suitable for any other purpose. Los Angeles, California September 28,
73 Vasquez & Company LLP has over 45 years of experience in performing audit, accounting & consulting services for all types of nonprofit organizations, for-profit companies, governmental entities and publicly traded companies. Vasquez is a member of the RSM US Alliance. RSM US Alliance provides its members with access to resources of RSM US LLP. RSM US Alliance member firms are separate and independent businesses and legal entities that are responsible for their own acts and omissions, and each are separate and independent from RSM US LLP. RSM US LLP is the U.S. member firm of RSM International, a global network of independent audit, tax, and consulting firms. Members of RSM US Alliance have access to RSM International resources through RSM US LLP but are not member firms of RSM International. Visit rsmus.com/about us for more information regarding RSM US LLP and RSM International. The RSM logo is used under license by RSM US LLP. RSM US Alliance products and services are proprietary to RSM US LLP. 801 South Grand Avenue, Suite 400 Los Angeles, California Ph. (213) Fax (213)

74 SunLine Transit Agency Single Audit Report Year Ended June 30, 2017 with Report of Independent Auditors
75 SunLine Transit Agency Table of Contents PAGE REPORTS OF INDEPENDENT AUDITORS Report on Internal Control over Financial Reporting and on Compliance and Other Matters Based on an Audit of Financial Statements Performed in Accordance with Government Auditing Standards 1 Report on Compliance for Each Major Federal Program, on Internal Control over Compliance, and on the Schedule of Expenditures of Federal Awards Required by the Uniform Guidance. 3 SCHEDULE OF EXPENDITURES OF FEDERAL AWARDS 6 NOTES TO SCHEDULE OF EXPENDITURES OF FEDERAL AWARDS 7 SCHEDULE OF FINDINGS AND QUESTIONED COSTS 8 STATUS OF PRIOR AUDIT FINDINGS 12
76 Report of Independent Auditors on Internal Control over Financial Reporting and on Compliance and Other Matters Based on an Audit of Financial Statements Performed in Accordance with Government Auditing Standards Board of Directors SunLine Transit Agency Thousand Palms, California We have audited, in accordance with the auditing standards generally accepted in the United States of America and the standards applicable to financial audits contained in Government Auditing Standards issued by the Comptroller General of the United States, the financial statements of SunLine Transit Agency (STA), which comprise the statement of financial position as of June 30, 2017, and the related statements of revenues, expenses and changes in net position, and cash flows for the year then ended, and the related notes to the financial statements, and have issued our report thereon dated October 19, Internal Control over Financial Reporting In planning and performing our audit of the financial statements, we considered STA's internal control over financial reporting (internal control) to determine the audit procedures that are appropriate in the circumstances for the purpose of expressing our opinion on the financial statements, but not for the purpose of expressing an opinion on the effectiveness of STA s internal control. Accordingly, we do not express an opinion on the effectiveness of STA s internal control. A deficiency in internal control exists when the design or operation of a control does not allow management or employees, in the normal course of performing their assigned functions, to prevent, or detect and correct, misstatements on a timely basis. A material weakness is a deficiency, or a combination of deficiencies, in internal control such that there is a reasonable possibility that a material misstatement of the entity s financial statements will not be prevented, or detected and corrected on a timely basis. A significant deficiency is a deficiency, or a combination of deficiencies, in internal control that is less severe than a material weakness, yet important enough to merit attention by those charged with governance. Our consideration of internal control was for the limited purpose described in the first paragraph of this section and was not designed to identify all deficiencies in internal control that might be material weaknesses or significant deficiencies. Given these limitations, during our audit we did not identify any deficiencies in internal control that we consider to be material weaknesses. However, material weaknesses may exist that have not been identified. 1
77 Compliance and Other Matters As part of obtaining reasonable assurance about whether STA's financial statements are free from material misstatement, we performed tests of its compliance with certain provisions of laws, regulations, contracts, and grant agreements, noncompliance with which could have a direct and material effect on the determination of financial statement amounts. However, providing an opinion on compliance with those provisions was not an objective of our audit, and accordingly, we do not express such an opinion. The results of our tests disclosed no instances of noncompliance or other matters that are required to be reported under Government Auditing Standards. Purpose of this Report The purpose of this report is solely to describe the scope of our testing of internal control and compliance and the result of that testing, and not to provide an opinion on the effectiveness of the STA s internal control or on compliance. This report is an integral part of an audit performed in accordance with Government Auditing Standards in considering the entity s internal control and compliance. Accordingly, this communication is not suitable for any other purpose. Los Angeles, California October 19,
 compliance with")
78 Report of Independent Auditors on Compliance for Each Major Federal Program, on Internal Control over Compliance, and on the Schedule of Expenditures of Federal Awards Required by the Uniform Guidance Board of Directors SunLine Transit Agency Thousand Palms, California Report on Compliance for Each Major Federal Program We have audited SunLine Transit Agency s (STA) compliance with the types of compliance requirements described in the OMB Compliance Supplement that could have a direct and material effect on each of STA s major federal programs for the year ended June 30, STA s major federal programs are identified in the summary of auditor s results section of the accompanying schedule of findings and questioned costs. Management s Responsibility Management is responsible for compliance with federal statutes, regulations, and terms and conditions of federal awards applicable to its federal programs. Auditors Responsibility Our responsibility is to express an opinion on compliance for each of STA s major federal programs based on our audit of the types of compliance requirements referred to above. We conducted our audit of compliance in accordance with auditing standards generally accepted in the United States of America; the standards applicable to financial audits contained in Government Auditing Standards, issued by the Comptroller General of the United States; and the audit requirements of Title 2 U.S. Code of Federal Regulations Part 200, Uniform Administrative Requirements, Cost Principles, and Audit Requirements for Federal Awards (Uniform Guidance). Those standards and the Uniform Guidance require that we plan and perform the audit to obtain reasonable assurance about whether noncompliance with the types of compliance requirements referred to above that could have a direct and material effect on a major federal program occurred. An audit includes examining, on a test basis, evidence about STA s compliance with those requirements and performing such other procedures as we considered necessary in the circumstances. We believe that our audit provides a reasonable basis for our opinion on compliance for each major federal program. However, our audit does not provide a legal determination of STA s compliance. 3
79 Opinion on Each Major Federal Program In our opinion, STA complied, in all material respects, with the types of compliance requirements referred to above that could have a direct and material effect on each of its major federal programs for the year ended June 30, Other Matters The results of our auditing procedures disclosed an instance of noncompliance, which is required to be reported in accordance with the Uniform Guidance and which is described in the accompanying schedule of findings and questioned costs as Finding No Our opinion on each major federal program is not modified with respect to this matter. STA s response to the noncompliance finding identified in our audit is described in the accompanying schedule of findings and questioned costs. STA s response was not subjected to the auditing procedures applied in the audit of compliance and, accordingly, we express no opinion on the response. Report on Internal Control over Compliance Management of STA is responsible for establishing and maintaining effective internal control over compliance with the types of compliance requirements referred to above. In planning and performing our audit of compliance, we considered STA s internal control over compliance with the types of requirements that could have a direct and material effect on each major federal program to determine the auditing procedures that are appropriate in the circumstances for the purpose of expressing an opinion on compliance for each major federal program and to test and report on internal control over compliance in accordance with the Uniform Guidance, but not for the purpose of expressing an opinion on the effectiveness of internal control over compliance. Accordingly, we do not express an opinion on the effectiveness of STA s internal control over compliance. A deficiency in internal control over compliance exists when the design or operation of a control over compliance does not allow management or employees, in the normal course of performing their assigned functions, to prevent, or detect and correct, noncompliance with a type of compliance requirement of a federal program on a timely basis. A material weakness in internal control over compliance is a deficiency, or a combination of deficiencies, in internal control over compliance, such that there is a reasonable possibility that material noncompliance with a type of compliance requirement of a federal program will not be prevented, or detected and corrected, on a timely basis. A significant deficiency in internal control over compliance is a deficiency, or a combination of deficiencies, in internal control over compliance with a type of compliance requirement of a federal program that is less severe than a material weakness in internal control over compliance, yet important enough to merit attention by those charged with governance. Our consideration of internal control over compliance was for the limited purpose described in the first paragraph of this section and was not designed to identify all deficiencies in internal control over compliance that might be material weaknesses or significant deficiencies. We did not identify any deficiencies in internal control over compliance that we consider to be material weaknesses. However, material weaknesses may exist that have not been identified. The purpose of this report on internal control over compliance is solely to describe the scope of our testing of internal control over compliance and the results of that testing based on the requirements of the Uniform Guidance. Accordingly, this report is not suitable for any other purpose. 4
80 Report on Schedule of Expenditures of Federal Awards Required by the Uniform Guidance We have audited the financial statements of STA as of and for the year ended June 30, 2017, and have issued our report thereon dated October 19, 2017, which contained an unmodified opinion on those financial statements. Our audit was conducted for the purpose of forming an opinion on the financial statements as a whole. The accompanying schedule of expenditures of federal awards is presented for purposes of additional analysis as required by the Uniform Guidance and is not a required part of the financial statements. Such information is the responsibility of management and was derived from and relates directly to the underlying accounting and other records used to prepare the financial statements. The information has been subjected to the auditing procedures applied in the audit of the financial statements and certain additional procedures, including comparing and reconciling such information directly to the underlying accounting and other records used to prepare the financial statements or to the financial statements themselves, and other additional procedures in accordance with auditing standards generally accepted in the United States of America. In our opinion, the schedule of expenditures of federal awards is fairly stated in all material respects in relation to the financial statements as a whole. Los Angeles, California October 19,
81 SunLine Transit Agency Schedule of Expenditures of Federal Awards Year ended June 30, 2017 Pass-Through/ Passed CFDA Grantors Through to Federal Federal Grantor / Pass-Through Grantor / Program Title Number Number Sub-recipient Expenditures U.S. DEPARTMENT OF TRANSPORTATION Direct Assistance: Federal Transit Cluster: Federal Transit - Formula Grants (Urbanized Area Formula Program) (Capital) CA-90-Y706 $ - $ 16,069 Federal Transit - Formula Grants (Urbanized Area Formula Program) (Capital) CA-90-Y876-31,139 Federal Transit - Formula Grants (Urbanized Area Formula Program) (Capital) CA-90-Y964-88,890 Federal Transit - Formula Grants (Urbanized Area Formula Program) (Capital) CA-90-Z036-71,609 Federal Transit - Formula Grants (Urbanized Area Formula Program) (Capital) CA-90-Z201-85,739 Federal Transit - Formula Grants (Urbanized Area Formula Program) (Capital) CA-90-Z ,817 Federal Transit - Formula Grants (Urbanized Area Formula Program) (Capital) CA ,288,049 Federal Transit - Formula Grants (Urbanized Area Formula Program) (Capital) CA-95-X ,830 Federal Transit - Formula Grants (Urbanized Area Formula Program) (Operating) CA-95-X ,642 Federal Transit - Formula Grants (Urbanized Area Formula Program) (Operating) CA ,665 Subtotal - Federal Transit - Formula Grants (Urbanized Area Formula Program) - 4,028,449 Total Federal Transit Cluster - 4,028,449 Direct Assistance: Transit Services Program Cluster: Job Access - Reverse Commute (Operating) CA-37-X148-14,714 Job Access - Reverse Commute (Operating) CA-37-X Subtotal - Job Access - Reverse Commute - 15,079 New Freedom Program (Operating) CA-57-X102-76,964 Subtotal - New Freedom Program - 76,964 Total Transit Services Programs Cluster - 92,043 Direct Assistance: Capital Assistance Program for Reducing Energy Consumption and Greenhouse Gas Emission CA ,868 Passed through from CalStart Discretionary Grant for Capital Assistance Program for Reducing Energy Consumption and Greenhouse Gas Emissions (Capital) ,492,374 Discretionary Grant for Capital Assistance Program for Reducing Energy Consumption and Greenhouse Gas Emissions (Capital) ,977 Discretionary Grant for Capital Assistance Program for Reducing Energy Consumption and Greenhouse Gas Emissions (Capital) ,108 Passed through from the Southern California Association of Governments Formula Grant for Other Than Urbanized Areas M ,971 Passed through from the State of California, Department of Transportation Formula Grant for Other Than Urbanized Areas (Capital) AC ,000 Formula Grant for Other Than Urbanized Areas (Operating) AC ,042 Formula Grant for Other Than Urbanized Areas (Operating) C / 64C ,995 Formula Grant for Other Than Urbanized Areas (Operating) C ,000 Passed through from Center for Transportation and the Environment (CTE) Discretionary Grant for Operating & Planning Assistance Program for National Fuel Cell Bus Program GA ,693 Total Federal Expenditures $ - $ 6,706,520 See accompanying Notes to Schedule of Expenditures of Federal Awards and Report of Independent Auditors on Compliance for Each Major Federal Program, on Internal Control over Compliance, and on the Schedule of Expenditures of Federal Awards Required by the Uniform Guidance 6
82 SunLine Transit Agency Notes to Schedule of Expenditures of Federal Awards Year ended June 30, 2017 NOTE 1 BASIS OF PRESENTATION The accompanying schedule of expenditures of federal awards (the Schedule) includes the federal award activity of SunLine Transit Agency (STA) under programs of the federal government for the year ended June 30, The information in this Schedule is presented in accordance with the requirements of Title 2 U.S. Code of Federal Regulations Part 200, Uniform Administrative Requirements, Cost Principles, and Audit Requirements for Federal Awards (Uniform Guidance). Because the Schedule presents only a selected portion of the operations of STA, it is not intended to and does not present the financial position, changes in net assets, or cash flows of STA. NOTE 2 BASIS OF ACCOUNTING The schedule of expenditures of federal awards includes the federal grant activity of STA and is prepared under the accrual basis of accounting. The information in this schedule is presented in accordance with the requirements of the Uniform Guidance. Therefore, some amounts presented in this schedule may differ from amounts presented in, or used in the preparation of the basic financial statements. STA has elected not to use the 10-percent de minimis indirect cost rate allowed under the Uniform Guidance. NOTE 3 SCHEDULE OF EXPENDITURES OF FEDERAL AWARDS PRESENTATION The Schedule of Expenditures of Federal Awards presented is prepared from only the accounts of the grant program and, therefore, does not present the financial position or results of operations of STA. 7
83 SunLine Transit Agency Schedule of Findings and Questioned Costs Year ended June 30, 2017 Section I Summary of Auditors Results Financial Statements Type of auditors report issued on the financial statements: Internal control over financial reporting: Material weakness(es) identified? Significant deficiency(ies) identified? Noncompliance material to financial statements noted? Unmodified No None reported No Federal Awards Internal control over its major programs: Material weakness(es) identified? Significant deficiency(ies) identified? Type of auditors report issued on compliance for its major programs No None reported Unmodified Any audit findings disclosed that are required to be reported in accordance with the Uniform Guidance? Yes (See Finding No Identification of Major Programs: CFDA Number Name of Federal Program or Cluster Federal Transit Cluster Dollar threshold used to distinguish between Type A and Type B programs: $750,000 Auditee qualified as a low-risk auditee: Yes 8
84 SunLine Transit Agency Schedule of Findings and Questioned Costs Year ended June 30, 2017 Section II Financial Statement Findings There were no financial statement findings noted during the fiscal year ended June 30,
85 SunLine Transit Agency Schedule of Findings and Questioned Costs Year ended June 30, 2017 Section III Federal Award Findings Finding No Policies and Procedures Required by the Uniform Guidance Federal Program Information Federal Catalog Number: Federal Program Name: Federal Transit Cluster Federal Agency: Department of Transportation Pass-Through Entity: N/A Federal Award Numbers: CA-90-Y706; CA-90-Y876; CA-90-Y964; CA-90-Z036; CA-90-Z201; CA-90-Z225; CA-95-X327; CA Criteria or Specific Requirement 2 CFR requires nonfederal entities to maintain effective internal controls over federal awards. The focus of these policies and procedures should be to ensure that those in the organization who carry out the objectives of the award understand: The federal statutes, regulations, and terms and conditions of the award How to evaluate and properly monitor compliance The steps to take if noncompliance is identified Specifically, 2 CFR (b)(7) states that the financial management system of each non-federal entity must provide for the written procedures for determining the allowability of costs in accordance with Subpart E Cost Principles of this part and the terms and conditions of the Federal award. Condition We noted during our audit that STA does not have an existing policy and procedure on allowability of costs. Cause STA did not develop written policies and procedures to determine allowability of costs Effect STA is at risk of submitting costs for reimbursement from the grantor that may not be allowable. Questioned Cost No questioned cost identified. 10
86 SunLine Transit Agency Schedule of Findings and Questioned Costs Year ended June 30, 2017 Finding No Policies and Procedures Required by the Uniform Guidance (Continued) Recommendation STA should review all federal statutes, regulations, and the terms and conditions of the federal award and determine whether or not policies and procedures exist and are operating effectively to ensure compliance with all requirements. Additionally, we recommend that STA develop written procedures for determining the allowability of costs in compliance with the Uniform Guidance. The policies and procedures must clearly delineate the requirements of the Uniform Guidance. Further, STA should retain evidence that the policies and procedures are operating as designed. Views of Responsible Officials Staff will develop a written procedure for allowability of costs in accordance with the recommendation of the auditors. 11
87 SunLine Transit Agency Status of Prior Audit Findings Year ended June 30, 2017 Finding No Monitoring and Reporting Program Performance Condition We noted that STA did not include updated completion dates for project milestones in its quarterly Milestone/Progress Reports (MPRs). Corrective Action Taken SunLine staff worked with the Federal Transit Administration (FTA) to prepare procedures and submit all Milestone Progress Reports with updated completion dates to address this finding. In March of 2017, SunLine received a formal closeout letter from the FTA acknowledging SunLine s corrective action regarding this finding Status This finding is corrected. 12


88 Vasquez & Company LLP has over 45 years of experience in performing audit, accounting & consulting services for all types of nonprofit organizations, for-profit companies, governmental entities and publicly traded companies. Vasquez is a member of the RSM US Alliance. RSM US Alliance provides its members with access to resources of RSM US LLP. RSM US Alliance member firms are separate and independent businesses and legal entities that are responsible for their own acts and omissions, and each are separate and independent from RSM US LLP. RSM US LLP is the U.S. member firm of RSM International, a global network of independent audit, tax, and consulting firms. Members of RSM US Alliance have access to RSM International resources through RSM US LLP but are not member firms of RSM International. Visit rsmus.com/about us for more information regarding RSM US LLP and RSM International. The RSM logo is used under license by RSM US LLP. RSM US Alliance products and services are proprietary to RSM US LLP. 801 South Grand Avenue, Suite 400 Los Angeles, California Ph. (213) Fax (213)
89 SunLine Transit Agency Checks $1,000 and Over For the month of August 2017 NOTE: 1). Bold check payments represent "pass through" payments that were, or will be reimbursed to SunLine under the provisions of specific grants or contracts. 2). Underlined check payments represent "shared" payments with SunLine and specific vendors/employees. Vendor Name Description Check # Check Amount CalPERS Group Health Ins Prem /31/2017 $311, PERMA - Insurance Gen Lib/WC /18/2017 $202, PERMA - Insurance Gen Lib/WC /31/2017 $193, U.S. BANK INSTITUTIONAL TRUST- Pension Deposits /25/2017 $95, U.S. BANK INSTITUTIONAL TRUST- Pension Deposits /14/2017 $94, BP ENERGY COMPANY CNG /31/2017 $76, CORBEL SOLUTIONS, LLC WIP- IT Projects /18/2017 $74, AIR & LUBE SYSTEMS INC WIP- Replacement Bus Lift /4/2017 $72, SO CAL GAS CO. Utilities /18/2017 $39, IMPERIAL IRRIGATION DIST Utilities /18/2017 $26, RELIANCE STANDARD LTD/STD/LIFE Ins Prem /31/2017 $26, RELIANCE STANDARD LTD/STD/LIFE Ins Prem /18/2017 $24, MICHELIN NORTH AMERICA, INC. Tire Leasing /25/2017 $23, Remix Software, Inc. Software & Licenses /18/2017 $23, BURKE, WILLIAMS & SORENSEN, LLP Legal Services /25/2017 $22, TEC OF CALIFORNIA, INC. Repair Parts /18/2017 $18, AIR & LUBE SYSTEMS INC WIP- Replacement Bus Lift /18/2017 $17, ND CONSTRUCTION COMPANY, INC. WIP- Bus Shelters Phase /31/2017 $15, ROMAINE ELECTRIC CORP. Repair Parts /18/2017 $15, AFTERMARKET PARTS COMPANY, LLC Bus Parts /18/2017 $14, VASQUEZ AND COMPANY LLP Audit Services (SLT) /18/2017 $13, MCCRAY ENTERPRISES Repair Parts /25/2017 $11, TK SERVICES, INC. Bus Repair Parts /18/2017 $11, LOZANO SMITH, LLP Legal Services /4/2017 $11, CUMMINS PACIFIC, LLC Bus Repair Parts /14/2017 $9, ENGINEERING PROCUREMENT WIP- Refurbished Hydrogen /25/2017 $9, IMPERIAL IRRIGATION DIST Utilities /25/2017 $9, PRUDENTIAL OVERALL SUPPLY Uniforms /31/2017 $9, CUMMINS PACIFIC, LLC Bus Repair Parts /18/2017 $8, FRANKLIN TRUCK PARTS, INC Bus Repair Parts /18/2017 $8, ADMIRAL SECURITY SERVICES Security Services /31/2017 $8, CUMMINS PACIFIC, LLC Bus Repair Parts /25/2017 $8, SOCO GROUP INC. THE Lubricants & Oils /18/2017 $8, MARTIN A. BELSON Consulting /18/2017 $7, TRAPEZE SOFTWAREGROUP, INC. WIP- ERP Project /31/2017 $7, HARBOR DIESEL & EQUIPMENT INC. Bus Repair parts /25/2017 $7, LOZANO SMITH, LLP Legal Services /31/2017 $7, AFTERMARKET PARTS COMPANY, LLC Bus Parts /25/2017 $7, ENGINEERING PROCUREMENT WIP- Refurbished Hydrogen /14/2017 $7,324.80
90 SunLine Transit Agency Checks $1,000 and Over For the month of August 2017 NOTE: 1). Bold check payments represent "pass through" payments that were, or will be reimbursed to SunLine under the provisions of specific grants or contracts. 2). Underlined check payments represent "shared" payments with SunLine and specific vendors/employees. Vendor Name Description Check # Check Amount VERIZON WIRELESS Wireless Cell Service /14/2017 $7, AIRGAS REFRIGERANTS, INC. Freon Refrigerant /25/2017 $7, TK SERVICES, INC. Bus Repair Parts /31/2017 $7, PE FACILITY SOLUTIONS LLC Janitorial Servs /31/2017 $6, CYNTHIA L. HENSON Staff Development /25/2017 $6, AMALGAMATED TRANSIT UNION Union Dues /25/2017 $6, AMALGAMATED TRANSIT UNION Union Dues /14/2017 $6, CUMMINS PACIFIC, LLC Bus Repair Parts /4/2017 $6, NAPA AUTO PARTS Vehicle Repair Parts /18/2017 $6, FIESTA FORD, INC. Repair Parts/Support /14/2017 $6, BAE SYSTEMS CONTROLS, INC. WIP- FCB 4 & /25/2017 $6, PROPER SOLUTIONS Temp. Emp Serv /4/2017 $6, HARBOR DIESEL & EQUIPMENT INC. Bus Repair parts /14/2017 $5, SOIL SAFE INC. Facility Maintenance /31/2017 $5, PALM SPRINGS MOTORS, INC. Non-Rev Repair Parts /14/2017 $5, ALPHA MEDIA LLC Advertisement /18/2017 $5, RM BROADCASTING, LLC Advertisement /25/2017 $5, PROACTIVE WELDING ZONE, INC WIP- Emergency Reformer Repair /1/2017 $4, YELLOW CAB OF THE DESERT Taxi Voucher Program /31/2017 $4, KITTRIDGE HOTELS & RESORTS, LLC Employee Training /1/2017 $4, TIME WARNER CABLE Utilities /24/2017 $4, FLEET-NET CORPORATION Software & Licenses /25/2017 $4, ALTON HILLIS Recruiting Employees /18/2017 $4, ELLSWORTH TRUCK & AUTO Repair Parts /25/2017 $3, RELIANCE STANDARD PPO Dental /22/2017 $3, TPX COMMUNICATIONS Telephone Service /25/2017 $3, CALIFORNIA DENTAL NETWORK, INC. Dental Insurance /22/2017 $3, PVC CONSULTING, LLC WIP- Battery Dominant/Lo-No /25/2017 $3, YELLOW CAB OF THE DESERT Taxi Voucher Program /18/2017 $3, KAMBRIAN CORPORATION Computer Material/Supplies /31/2017 $3, GENFARE Farebox /25/2017 $3, AMERICAN CAB Taxi Voucher Program /31/2017 $3, WESTGATE CENTER FOR Staff Development /25/2017 $3, EYE MED Employee Benefits /14/2017 $3, EYE MED Employee Benefits /31/2017 $3, PROPER SOLUTIONS Temp. Emp Serv /18/2017 $3, HARBOR DIESEL & EQUIPMENT INC. Bus Repair parts /18/2017 $3, AMERICAN CAB Taxi Voucher Program /18/2017 $3, EASTERN CONTRA COSTA TRANSIT Membership & Subscriptions /22/2017 $3,000.00
91 SunLine Transit Agency Checks $1,000 and Over For the month of August 2017 NOTE: 1). Bold check payments represent "pass through" payments that were, or will be reimbursed to SunLine under the provisions of specific grants or contracts. 2). Underlined check payments represent "shared" payments with SunLine and specific vendors/employees. Vendor Name Description Check # Check Amount CARQUEST AUTO PARTS Repair Parts /18/2017 $2, AVAIL TECHNOLOGIES ITS Implementation /31/2017 $2, PLAZA TOWING, INC. Towing Service /31/2017 $2, ROMAINE ELECTRIC CORP. Repair Parts /31/2017 $2, CREATIVE BUS SALES, INC. Bus Repair Parts /18/2017 $2, PROPER SOLUTIONS Temp. Emp Serv /14/2017 $2, AFTERMARKET PARTS COMPANY, LLC Bus Parts /4/2017 $2, TRANSLITE ENTERPRISES INC Glass Installer /18/2017 $2, GENFARE Farebox /18/2017 $2, GRAINGER Facility Maintenance /25/2017 $2, UNITED RENTALS, INC. WIP- Replacement Bus Lift /18/2017 $2, KUNA-FM Advertisement /25/2017 $2, CDW GOVERNMENT, INC Software/Hardware /18/2017 $2, ANDREA CARTER & ASSOCIATES Marketing Consulting & PR /18/2017 $2, SPORTWORKS NORTHWEST, INC. Fuel Cell Bus Parts /31/2017 $2, FAST UNDERCAR PALM DESERT Repair Parts /18/2017 $2, BURRTEC WASTE & RECYCLING Facility Trash Removal /18/2017 $2, PARKHOUSE TIRE, INC. Revenue/Non-Rev Tires /18/2017 $2, OFFICE DEPOT Office Supplies /31/2017 $2, PATRICK M. BRASSIL Hydrogen Maintenance /31/2017 $2, OFFICETEAM Temporary Services /18/2017 $2, CALIFORNIA STATE DISBURSEMENT Employee Garnishment /14/2017 $2, AMERICAN SEATING COMPANY Seats and Inserts /18/2017 $2, INFORMATION DESIGN CONSULTANTS Employee Training /25/2017 $2, SOCO GROUP INC. THE Lubricants & Oils /31/2017 $2, WESTPORT DALLAS, INC. Repair Parts /31/2017 $2, GRAINGER Facility Maintenance /18/2017 $2, VICKY CASTANEDA Education Reimbursement /18/2017 $2, VALLEY OFFICE EQUIPMENT, INC. Fax/Copier Supplies /31/2017 $1, NORTON MEDICAL INDUSTRIES Medical-Exams and Testing /18/2017 $1, HOME DEPOT CRD SRVS Facility Maintenance /31/2017 $1, ACCOUNTEMPS Temporary Help /18/2017 $1, CALIFORNIA STATE DISBURSEMENT Employee Garnishment /25/2017 $1, FIESTA FORD, INC. Repair Parts/Support /25/2017 $1, DESERT AIR CONDITIONING, INC. A/C Repair and Sales /25/2017 $1, SARAH SYED Employee Reimbursement /18/2017 $1, INSPECTORATE AMERICA Oil Sample Jars /25/2017 $1, DESERT CITY CAB Taxi Voucher Program /18/2017 $1, GENFARE Farebox /4/2017 $1,581.88
92 SunLine Transit Agency Checks $1,000 and Over For the month of August 2017 NOTE: 1). Bold check payments represent "pass through" payments that were, or will be reimbursed to SunLine under the provisions of specific grants or contracts. 2). Underlined check payments represent "shared" payments with SunLine and specific vendors/employees. Vendor Name Description Check # Check Amount HENRY'S GLASS COMPANY Bus Parts /25/2017 $1, MAGALDI & MAGALDI, INC. Repair Parts /14/2017 $1, APOLLO VIDEO TECHNOLOGY Security Camera Equipment /4/2017 $1, SMARTDRIVE SYSTEMS, INC. Security Equipment /31/2017 $1, HANDI-HUT, INC. Bus Stops & Zones Supplies /18/2017 $1, SPORTWORKS NORTHWEST, INC. Fuel Cell Bus Parts /4/2017 $1, AIR & HOSE SOURCE, INC. Repair Parts /4/2017 $1, ELLSWORTH TRUCK & AUTO Repair Parts /18/2017 $1, AVAIL TECHNOLOGIES ITS Implementation /18/2017 $1, C V WATER DISTRICT Utilities /31/2017 $1, AURORA PICTURES Safety Supplies /25/2017 $1, WAXIE SANITARY SUPPLY Agency Supplies /18/2017 $1, CREATIVE BUS SALES, INC. Bus Repair Parts /14/2017 $1, CAPITAL ONE COMMERCIAL (COSTCO) Boardroom Supplies /25/2017 $1, DESERT CITY CAB Taxi Voucher Program /31/2017 $1, GOTCHA MEDIA HOLDINGS, LLC Advertisement /25/2017 $1, AMERICAN TRAINCO Staff Development /18/2017 $1, ERIC TAYLOR Employee Reimbursement /31/2017 $1, MAGALDI & MAGALDI, INC. Repair Parts /25/2017 $1, TOTALFUNDS BY HASLER Postage Supplies /18/2017 $1, TOTALFUNDS BY HASLER Postage Supplies /4/2017 $1, DESERT AIR CONDITIONING, INC. A/C Repair and Sales /18/2017 $1, PACKET FUSION, INC. IT Supplies /31/2017 $1, BOYLIN MANAGEMENT INSTITUTE Staff Development /4/2017 $1, Total of Checks Over $1,000 $1,867, Total of Checks Under $1,000 $55, Total of All Checks for the Month $1,922, Total Amount of Checks Prior Years Same Month $986,286.29
93
94
95
96
97
98
99 Description FY 18 Total Budget SunLine Transit Agency Budget Variance Report August 2017 Actual Current Month Budget Favorable (Unfavorable) YTD Actual Year to Date FY 18 YTD Budget Favorable (Unfavorable) Operating Revenues: Passenger Revenue 2,984, , ,698 (18,286) 423, ,395 (73,741) Other Revenue 2,469, , ,761 19, , ,522 28,709 Total Operating Revenue 5,453, , ,459 1, , ,917 (45,032) Operating Expenses: Operator & Mechanic Salaries & Wages 9,537, , ,814 41,747 1,471,533 1,589, ,096 Operator & Mechanic Overtime 1,159,221 99,037 96,602 (2,436) 253, ,204 (60,508) Administration Salaries & Wages 5,302, , ,916 4, , ,831 72,732 Administration Overtime 13,593 1,412 1,133 (279) 2,650 2,266 (384) Fringe Benefits 9,116, , ,720 78,518 1,374,769 1,519, ,671 Communications 218,000 15,841 18,167 2,325 26,823 36,333 9,510 Legal Services - General 80,000 9,846 6,667 (3,179) 25,476 13,333 (12,143) Computer/Network Software Agreement 452,868 29,925 37,739 7,814 59,882 75,478 15,596 Uniforms 112,550 2,443 9,379 6,936 5,484 18,758 13,274 Contracted Services 464,022 34,323 38,669 4,346 64,608 77,337 12,729 Equipment Repairs 7,500 1, (711) 1,742 1,250 (492) Security Services 103,604 8,328 8, ,328 17,267 8,939 Fuel - CNG 1,565, , ,453 6, , ,905 11,530 Fuel - Hydrogen 250,000 31,298 20,833 (10,464) 37,080 41,667 4,586 Tires 258,100 18,417 21,508 3,091 35,215 43,017 7,802 Office Supplies 72,400 8,814 6,033 (2,781) 13,764 12,067 (1,697) Travel/Training 143,000 14,364 11,917 (2,448) 23,567 23, Repair Parts 1,218,500 99, ,542 1, , ,083 (27,847) Facility Maintenance 43,000 4,761 3,583 (1,178) 6,296 7, Electricity - CNG & Hydrogen 175,000 14,368 14, ,913 29,167 (747) Natural Gas 1,450, , ,833 (9,466) 246, ,667 (4,581) Water 7, , Insurance Losses 1,136, ,694 94,725 (148,969) 295, ,450 (106,130) Insurance Premium - Property 13,315 1,049 1, ,097 2, Repair Claims 200, ,667 16,667 11,572 33,333 21,762 Fuel Taxes 168,200 16,078 14,017 (2,062) 32,388 28,033 (4,355) Other Expenses 3,291, , ,260 (15,492) 547, , Self Consumed Fuel (1,681,000) (141,551) (140,083) (1,467) (272,417) (280,167) 7,750 Total Operating Expenses (Before Depreciation) 34,880,026 2,929,841 2,906,669 (23,173) 5,596,020 5,813, ,318 Operating Expenses in Excess of Operating Revenue $ (2,474,309) $ (4,732,134) Subsidies: Local - Measure A ,153, , ,450 (3,870) 828, ,900 30,172 State - LTF, LCTOP ,753,800 1,576,901 1,562,817 (14,084) 3,015,834 3,125, ,800 Federal , 5310, 5311, 5316, 5317 & CMAQ ,519, , ,944 (4,145) 887, ,887 32,315 Total Subsidies 29,426,523 2,474,309 2,452,210 (22,099) 4,732,134 4,904, ,286 Net Operating Gain (Loss) After Subsidies $ - $ - $ -
100 SunLine Transit Agency Budget Variance Report August 2017 Current Month Year to Date Description FY 18 Total Budget Actual Budget Favorable (Unfavorable) YTD Actual FY 18 YTD Budget Favorable (Unfavorable) Operating Expenses: Wages & Benefits 25,130,214 1,972,067 2,094, ,118 3,913,762 4,188, ,607 Services 2,657, , ,417 (40,012) 455, ,834 (12,415) Fuels & Lubricants 1,991, , ,969 (9,994) 326, ,939 5,685 Tires 258,100 18,417 21,508 3,091 35,215 43,017 7,802 Materials and Supplies 1,537, , ,094 3, , ,188 (26,021) Utilities 1,923, , ,250 (7,704) 324, ,500 (4,036) Casualty & Liability 1,885, , ,110 (136,696) 410, ,221 (96,301) Taxes and Fees 168,200 16,078 14,017 (2,062) 32,388 28,033 (4,355) Miscellaneous Expenses 1,010,427 40,611 84,202 43,591 88, ,405 80,101 Self Consumed Fuel (1,681,000) (141,551) (140,083) (1,467) (272,417) (280,167) 7,750 Total Operating Expenses (Before Depreciation) 34,880,026 2,929,841 2,906,669 (23,173) 5,596,020 5,813, ,318 Revenues: Passenger Revenue 2,984, , ,698 (18,286) 423, ,395 (73,741) Other Revenue 2,469, , ,761 19, , ,522 28,709 Total Operating Revenue 5,453, , ,459 1, , ,917 (45,032) Net Operating Gain (Loss) $ (2,474,309) $ (4,732,134) Subsidies: Local - Measure A 17.51% 5,153, , ,450 (3,870) 828, ,900 30,172 State - LTF, LCTOP 63.73% 18,753,800 1,576,901 1,562,817 (14,084) 3,015,834 3,125, ,800 Federal , 5310, 5311, 5316, 5317 & CMAQ 18.76% 5,519, , ,944 (4,145) 887, ,887 32,315 Total Subsidies 29,426,523 2,474,309 2,452,210 (22,099) 4,732,134 4,904, ,286 Net Operating Gain (Loss) After Subsidies $ - $ - $ -
101 Budget Variance Analysis - SunLine Transit Passenger Revenue - Unfavorable Fixed-route ridership has continued to decrease. System Total Ridership is presently 31,384 trips below FY17 YTD amounts. Ridership is currently at 4.9% below FY17 YTD totals. The ridership demand follows a seasonal pattern. Ridership is higher October through April. The increase in ridership during the peak season will help adjust the current negative variance in passenger revenue. Fixed Route Paratransit System Total FY17-Aug 326,267 FY17-Aug 14,196 FY17-Aug 340,463 FY18-Aug 314,911 FY18-Aug 13,605 FY18-Aug 328,516 Variance (11,356) Variance (591) Variance (11,947) %D -3.5% %D -4.2% %D -3.5% Fixed Route YTD Paratransit YTD System Total YTD YTD-FY17 616,332 YTD-FY17 27,898 YTD-FY17 644,230 YTD-FY18 586,725 YTD-FY18 26,121 YTD-FY18 612,846 Variance (29,607) Variance (1,777) Variance (31,384) %D -4.8% %D -6.4% %D -4.9% Other Revenue - Favorable The favorable balance is due to higher revenues for August than budgeted amounts for outside fueling revenues and emissions credit revenues. Operator & Mechanic Salaries & Wages - Favorable Contributing factors include operators using vacation time, sick time, short-term disability, long-term disability. Also, there are some vacant positions. Operator & Mechanic Overtime - Unfavorable The unfavorable balance is primarily attributed to vacant operator positions. Other factors include operators and mechanics using vacation time, sick time, short-term disability, and long-term disability. To cover the actual workload, the active employees have to work extended hours. Administration Salaries & Wages - Favorable Multiple positions were posted after the Board of Directors approved the budget in June, as of August some positions remain vacant. Also, consultant expenses vary throughout the year Administration Overtime - Unfavorable Vacancies across the agency contributed to the unfavorable balance in overtime. Fringe Benefits - Favorable Fringe benefits are favorable due to vacant positions across the agency Communications - Favorable Budget is twelve-period allocation, but some expenses are yet to be incurred. The budget includes an allowance for additional internet circuits as well as additional devices for users and buses Legal Services - General - Unfavorable General legal counsel costs are higher than anticipated. For August, there is an unfavorable variance of $3,179. Burke, Williams, and Sorenson had one invoice paid in August equaling $9,921. In August SunLine had 40.6 billable hours from Burke, Williams, and Sorenson. Computer/Network Software Agreement - Favorable Budget is twelve-period allocation, but some expenses are yet to be incurred. The payments for software programs Barracuda, Keystone, Cummins Software, and Lansweeper will be incurred later in the year. UniformUniforms - Favorable At the beginning of the fiscal year, operators are given a $300 credit toward uniform expenses. The favorable balance is due to operators not yet using their annual credit. The costs will vary throughout the year depending on when the operator uses his or her uniform credit. Contracted Services - Favorable Contracted service expenses vary throughout the year.
102 Equipment Repairs - Unfavorable In August the Fleet Maintenance Department had to replace defective Graco Pumps. Security Services - Favorable Security Service expenses are within an acceptable range of the budget. Fuel - CNG - Favorable Internal consumption has decreased by 3,304 GGE's below FY17 YTD amounts. The lower internal consumption is primarily attributed to a decrease of 18,481 total miles traveled FY18 YTD in comparison to the last fiscal year. Fuel - Hydrogen - Favorable In July there were mechanical issues with the hydrogen reformer, and it was temporarily out of service. There is an unfavorable variance in August due to the mechanical failure with the hydrogen reformer. Hydrogen gas was purchased from PRAXAIR, Inc. and the invoice was paid in August Tires - Favorable Tire expenses are within an acceptable range of the budget. The favorable variance is primarily attributed to a decrease of 18,481 total miles traveled YTD in comparison to the last fiscal year. Office Supplies - Unfavorable The unfavorable variance in office supplies is primarily attributed to cartridges and toners ordered in August for the agency's printers. Office supplies are a variable expense; costs vary throughout the year as required. Travel/Training - Favorable Travel & training savings can be attributed to different times at which training sessions are attended. Repair Parts -Unfavorable Aging fleet has led to the unpredictability of component failures and therefore have increased the number of repairs. In July repair part costs increased due to scheduled maintenance designed to enhance equipment reliability by replacing worn components before they fail. In August the repair part expenses are within the acceptable range of the budget for the month. Facility Maintenance - Favorable Facility maintenance expenses are within an acceptable range of the budgeted amount. Electricity - CNG & Hydrogen - Unfavorable Electricity for CNG and hydrogen costs are higher in the summer months and begin to decrease in the winter months. Natural Gas - Unfavorable The unfavorable balance of natural gas costs is primarily attributed to an increase in outside fueling sales. GGE outside usage has increased 4,656 GGE's above FY17 YTD amounts. In August there were 6,375 more GGE's used for outside fueling sales than in the previous month. Water - Favorable Water expenses are within an acceptable range of the budgeted amount. Insurance Losses - Unfavorable In August there was a $195,979 cost to reconcile a deposit held by PERMA for workers compensation insurance. The reconciliation contributed to the unfavorable variance. Deposit premiums are intended to cover claim expenses and settlements. Annual deposit premiums are based on actuarially-determined rates for each coverage layer (pool), based on estimates of the probable losses. Insurance losses can vary widely from month to month Insurance Premium - Property - Favorable Insurance premiums for the property are within an acceptable range of the budgeted amount. Repair Claims - Favorable Repair claims can vary significantly from month to month. The favorable balance can be attributed to repairs not yet completed. Fuel Taxes - Unfavorable The unfavorable balance of fuel taxes is due to a higher quantity of outside fueling sales. Outside fueling sales are currently $30,939 above FY17 YTD amounts. For August sales are up $14,800 from the previous month. Other Expenses - Favorable Other expenses are within an acceptable range of the budgeted amount.
103 Self Consumed Fuel - Favorable The favorable balance FY18 YTD is primarily attributed to a decrease in total miles traveled FY18 YTD in comparison to FY17 YTD. There is a decrease of 18,481 miles traveled FY18 YTD in comparison to FY17 YTD. The unfavorable balance for the month is primarily attributed to an increase in total miles traveled in August. In August there was an increase of 18,607 total miles traveled in comparison to the previous month. Total Miles Total Miles Total YTD Miles FY Total YTD Miles FY18-Jul FY18-Aug Variance 2017 FY 2018 Variance Fixed Route 322, ,850 12,721 Fixed Route 662, ,979 (5,805) Paratransit 93,398 99,284 5,886 Paratransit 205, ,682 (12,676) System Total 415, ,134 18,607 System Total 868, ,661 (18,481)
104 September 2017 Vendor Product/Service Need Budgeted New Flyer of America Proton Energy Systems Psomas Five (5) Hydrogen Electric Hybrid Fuel Cell Buses Electrolyzer and Fueling Station Construction Management for CNG Fueling Station Contracts Signed in Excess of $25,000 Purchase of five Hydrogen Electric fixed route buses to replace existing CNG buses that will meet useful life as outlined by Federal guidelines Upgrade SunLine's existing Hydrogen refueling station for SunLine's fleet and public use Construction management to provide services throughout the construction phase of the CNG station replacement Budgeted Amount Cost SRTP FY16/17 $ 7,239, $ 5,900, SRTP FY16/17 $ 8,497, $ 8,334, SRTP FY14/15 $ 5,500, $ 180, Type Executed Agreement Board approved 5/24/2017 Executed Agreement Board Ratified 9/27/2017 Executed Agreement Board approved 4/26/2017
105
106
107 SunLine Transit Agency Monthly Ridership Report September 2017 FY 2016 & 2017 Month % FY 2018 FY 2017 YTD % Fixed Route Sep 2017 Sep 2016 Aug 2017 Var. Var. YTD YTD Var. Var. Bikes Wheelchairs Line Description Monthly YTD Monthly YTD 14 DHS/PS 51,898 54,964 51,732 (3,066) -5.6% 145, ,231 (4,531) -3.0% 1,526 4, , DHS 10,284 9,224 9,587 1, % 27,044 23,813 3, % DHS/PD 2,279 2,575 1,486 (296) -11.5% 4,997 5,316 (319) -6.0% PS 13,524 14,933 13,892 (1,409) -9.4% 37,482 39,456 (1,974) -5.0% CC/PS 52,195 59,267 54,354 (7,072) -11.9% 152, ,547 (12,044) -7.3% 2,183 6, , PD/RM/TP/CC/PS 19,462 21,696 18,155 (2,234) -10.3% 53,128 58,141 (5,013) -8.6% 761 2, PD/IW 3,842 4,557 2,918 (715) -15.7% 9,194 10,795 (1,601) -14.8% Indio/LQ/IW/PD 6,810 7,814 4,261 (1,004) -12.8% 14,366 16,475 (2,109) -12.8% LQ/BD 14,243 17,446 10,331 (3,203) -18.4% 33,485 38,546 (5,061) -13.1% 492 1, Indio 11,903 13,216 8,639 (1,313) -9.9% 27,475 32,131 (4,656) -14.5% Indio 8,422 8,485 5,976 (63) -0.7% 19,197 20,050 (853) -4.3% Coachella/Indio 9,540 13,485 9,555 (3,945) -29.3% 27,434 35,818 (8,384) -23.4% I/Cch/Th/Mec/Oas 15,857 14,550 14,562 1, % 43,425 40,206 3, % 269 1, I/Cch/Th/Mec/NS 1,903 2,641 2,020 (738) -27.9% 5,899 7,587 (1,688) -22.2% PS to Indio 109, , ,197 (6,554) -5.6% 314, ,083 (17,151) -5.2% 4,305 13, , PD to Riverside 1,190 1,202 1,246 (12) -1.0% 3,562 3, % Fixed route total 333, , ,911 (29,257) -8.1% 919, ,687 (58,864) -6.0% 10,883 33,060 2,219 7,287 SolVan 1,222-1,090 1, % 2,312-2, % Demand Response SunDial 13,359 14,574 13,605 (1,215) -8.3% 13,402 14,617 (1,215) -8.3% System total 347, , ,606 (29,250) -7.8% 935, ,304 (57,767) -5.8% Sep-17 Sep-16 Aug-17 Weekdays: Saturdays: Sundays: Total Days: Please note: *Running the Saturday/Sunday service on September 5, 2016 and September 4, 2017 Labor Day Holiday. Weekday and Sunday total days reflect the change. Issued:8/10/ of 2 printed on 10/13/2017


108 SunLine Transit Agency Monthly Ridership Report September Fixed Route Ridership 95 1, , , , , , , , , , , , , , , ,195 Demand Response Ridership SunDial 13, ,000 FY 2017 FY , , , , , , , ,932 Year to Date System Ridership 200, ,000 23,813 27,044 5,316 4,997 39,456 37,482 58,141 53,128 10,795 9,194 16,475 14,366 38,546 33,485 32,131 27,475 20,050 19,197 35,818 27,434 40,206 43,425 7,587 5,899 3,492 3,562 14,617 13, ,000 50, SunDial 2 of 2 printed on 10/13/2017
109 SunDial Operational Notes SEPTEMBER 2016/2017 On-Time Performance Late Trips 90.0% 89.5% 89.0% 89.6% 1,400 1,200 1, , % 88.4% % % Total Trips Total Passengers 13,400 13,200 13,000 13,192 15,000 14,500 14,574 12,800 12,600 12,400 12,321 14,000 13,500 13,359 12,200 12,000 13,000 11, ,
110 SunDial Operational Notes SEPTEMBER 2016/2017 Total Miles Preventable Accidents 116, , , , , , , , , , , Ride Alongs Onboard Inspections
111 SunDial Operational Notes SEPTEMBER 2016/2017 Safety Evaluations Trip Denials Mobility Device Boardings 2,200 2,165 2,100 2,000 1,900 1,867 1,800 1,
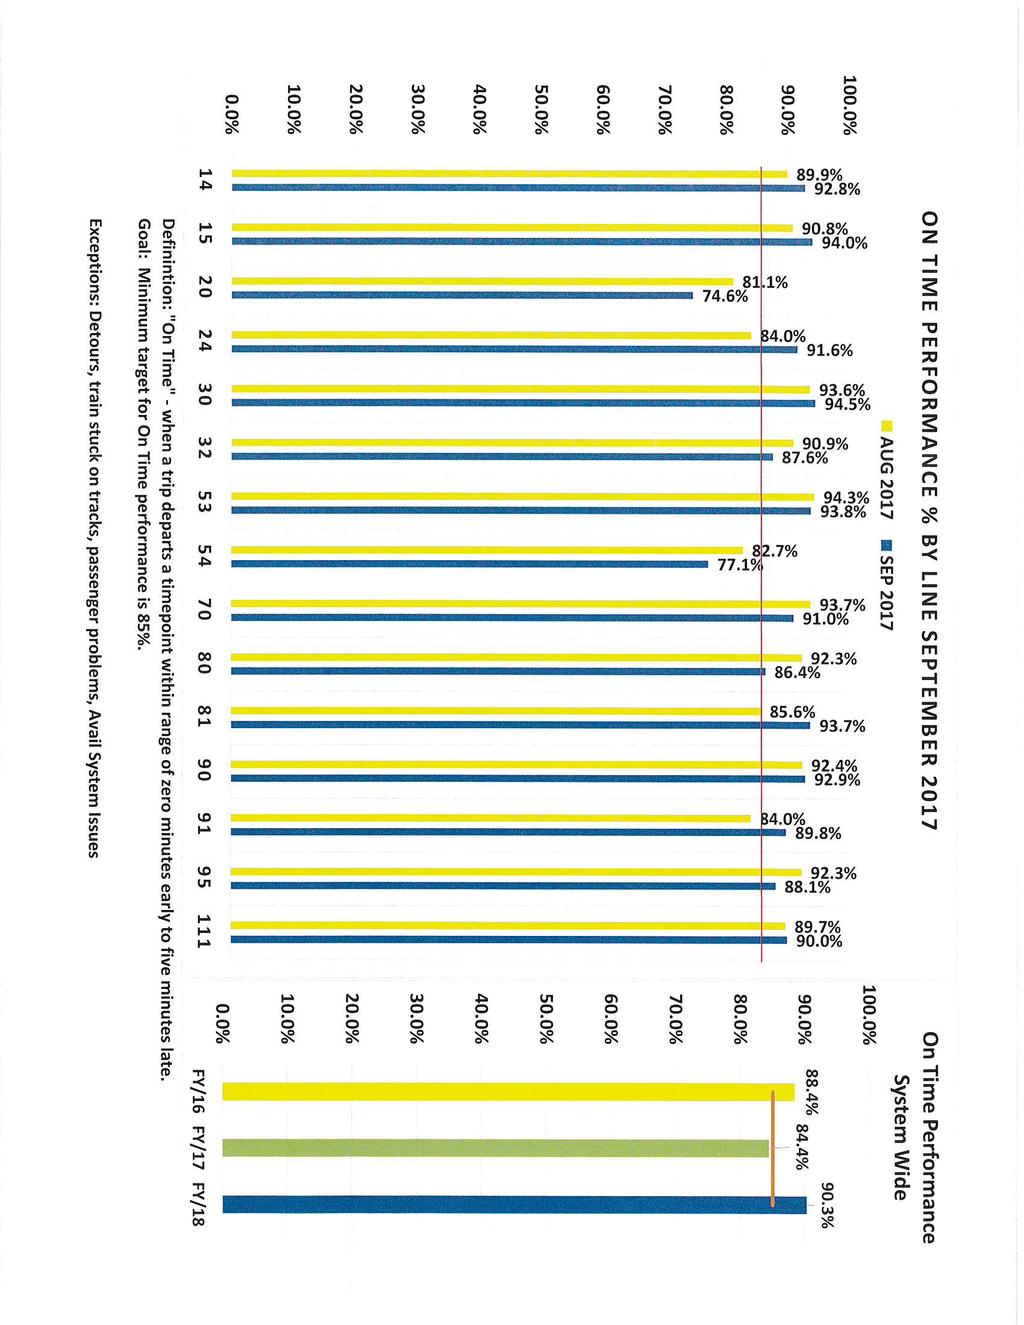
112
AGENDA. Regular Board of Directors Meeting Board Room Harry Oliver Trail Thousand Palms, CA 92276
 SunLine Transit Agency October 24, 2018 12:00 p.m. AGENDA Regular Board of Directors Meeting Board Room 32-505 Harry Oliver Trail Thousand Palms, CA 92276 In compliance with the Brown Act and Government
Whatcom Transportation Authority
 Financial Statements Audit Report Whatcom Transportation Authority Whatcom County For the period January 1, 2016 through December 31, 2017 Published April 30, 2018 Report No. 1021200 April 30, 2018 Office
MACON-BIBB COUNTY TRANSIT AUTHORITY MACON, GEORGIA (A COMPONENT UNIT OF MACON-BIBB COUNTY, GEORGIA)
") MACON, GEORGIA (A COMPONENT UNIT OF MACON-BIBB COUNTY, GEORGIA) INDEPENDENT AUDITOR S REPORT AND FINANCIAL STATEMENTS FOR THE FISCAL YEAR ENDED JUNE 30, 2016 MACON, GEORGIA TABLE OF CONTENTS JUNE 30, 2016
MACON, GEORGIA (A COMPONENT UNIT OF MACON-BIBB COUNTY, GEORGIA) INDEPENDENT AUDITOR S REPORT AND FINANCIAL STATEMENTS FOR THE FISCAL YEAR ENDED JUNE 30, 2016 MACON, GEORGIA TABLE OF CONTENTS JUNE 30, 2016
To: Board of Directors Date: December 21, 2017
 To: Board of Directors Date: December 21, 2017 From: Erick Cheung, Director of Finance Reviewed by: SUBJECT: FY 2017 Financial Audit Summary of Issues: The audit for FY 2017 has been completed and enclosed
CITY OF SANTA MONICA, CALIFORNIA Big Blue Bus Fund (An Enterprise Fund of the City of Santa Monica) Financial Statements and Supplementary
 Financial Statements and Supplementary") Financial Statements and Supplementary Information Fiscal Years Ended June 30, 2018 and 2017 (With Independent Auditors Reports Thereon) Fiscal Years Ended June 30, 2018 and 2017 Table of Contents Page
Financial Statements and Supplementary Information Fiscal Years Ended June 30, 2018 and 2017 (With Independent Auditors Reports Thereon) Fiscal Years Ended June 30, 2018 and 2017 Table of Contents Page
CITY OF SANTA MONICA, CALIFORNIA
 Financial Statements and Required and Other Supplementary Information (with Independent Auditor s Reports Thereon) Table of Contents Independent Auditor s Report... 1 Management s Discussion and Analysis
Casa Blanca Community School, Inc. Single Audit Reporting Package. Year Ended June 30, 2017
 Casa Blanca Community School, Inc. Single Audit Reporting Package Year Ended June 30, 2017 Casa Blanca Community School, Inc. Single Audit Reporting Package Year Ended June 30, 2017 Issued by: Business
Berks Area Regional Transportation Authority. Financial Statements and Supplementary Information. June 30, 2014 and 2013
 Financial Statements and Supplementary Information Table of Contents Page INDEPENDENT AUDITOR'S REPORT 1 to 3 MANAGEMENT'S DISCUSSION AND ANALYSIS 4 to 14 FINANCIAL STATEMENTS Statement of Net Position
CAPE COD REGIONAL TRANSIT AUTHORITY (a component Unit of the Massachusetts Department of Transportation)
") (a component Unit of the Massachusetts Department of Transportation) Basic Financial Statements, Supplementary Data For the Year Ended June 30, 2016 Table of Contents Management s Discussion and Analysis
(a component Unit of the Massachusetts Department of Transportation) Basic Financial Statements, Supplementary Data For the Year Ended June 30, 2016 Table of Contents Management s Discussion and Analysis
The Transit Authority of the City of Omaha FINANCIAL STATEMENTS AND INDEPENDENT AUDITORS REPORT For the years ended December 31, 2014, and 2013
 FINANCIAL STATEMENTS AND INDEPENDENT AUDITORS REPORT For the years ended December 31, 2014, and 2013 TABLE OF CONTENTS INDEPENDENT AUDITOR S REPORT 2-4 MANAGEMENT S DISCUSSION AND ANALYSIS 5-11 GENERAL
INDIANAPOLIS PUBLIC TRANSPORTATION CORPORATION (A COMPONENT UNIT OF THE CONSOLIDATED CITY OF INDIANAPOLIS MARION COUNTY GOVERNMENT REPORTING ENTITY)
") INDIANAPOLIS PUBLIC TRANSPORTATION CORPORATION (A COMPONENT UNIT OF THE CONSOLIDATED CITY OF INDIANAPOLIS MARION COUNTY GOVERNMENT REPORTING ENTITY) FINANCIAL STATEMENTS December 31, 2015 Indianapolis,
INDIANAPOLIS PUBLIC TRANSPORTATION CORPORATION (A COMPONENT UNIT OF THE CONSOLIDATED CITY OF INDIANAPOLIS MARION COUNTY GOVERNMENT REPORTING ENTITY) FINANCIAL STATEMENTS December 31, 2015 Indianapolis,
Basic Financial Statements and Report of Independent Certified Public Accountants City of Dallas, Texas Dallas Water Utilities (An Enterprise Fund of
 Basic Financial Statements and Report of Independent Certified Public Accountants City of Dallas, Texas September 30, 2016 FINANCIAL STATEMENTS For Fiscal Year Ended September 30, 2016 TABLE OF CONTENTS
AREA METROPOLITAN AMBULANCE AUTHORITY
 AREA METROPOLITAN AMBULANCE AUTHORITY FINANCIAL STATEMENTS AND SUPPLEMENTAL INFORMATION Year ended September 30, 2016 with Report of Independent Auditors AREA METROPOLITAN AMBULANCE AUTHORITY FINANCIAL
SCOTT COUNTY REDEVELOPMENT AND HOUSING AUTHORITY 2016 ANNUAL REPORT
 SCOTT COUNTY REDEVELOPMENT AND HOUSING AUTHORITY 2016 ANNUAL REPORT SCOTT COUNTY REDEVELOPMENT AND HOUSING AUTHORITY FINANCIAL REPORT FOR THE FISCAL YEAR ENDED SEPTEMBER 30, 2016 Financial Section Table
To: Board of Directors Date: December 7, 2015
 To: Board of Directors Date: December 7, 2015 From: Kathy Casenave, Director of Finance Reviewed by: SUBJECT: FY 2015 Financial Audit Summary of Issues: The audit for FY 2015 has been completed and enclosed
CHATHAM AREA TRANSIT CHATHAM AREA TRANSIT AUTHORITY FINANCIAL REPORT
 CHATHAM AREA TRANSIT CHATHAM AREA TRANSIT AUTHORITY FINANCIAL REPORT Years Ended June 30, 2017 and 2016 CHATHAM AREA TRANSIT AUTHORITY TABLE OF CONTENTS Pages FINANCIAL SECTION: Independent Auditor s Report
DETROIT TRANSPORTATION CORPORATION
 FINANCIAL REPORT JUNE 30, 2015 Contents Page No. Independent Auditor s Report... 1 Management Discussion & Analysis... 3 Basic Financial Statements: Statement of Net Position... 8 Statement of Revenues,
CITY OF ANAHEIM WATER UTILITY FUND. Financial Statements. June 30, 2016 and (With Independent Auditors Report Thereon)
") Financial Statements (With Independent Auditors Report Thereon) Table of Contents Page Independent Auditors Report 1 Management s Discussion and Analysis (Unaudited) 3 Financial Statements: Statement of
Financial Statements (With Independent Auditors Report Thereon) Table of Contents Page Independent Auditors Report 1 Management s Discussion and Analysis (Unaudited) 3 Financial Statements: Statement of
SAN BERNARDINO COMMUNITY COLLEGE DISTRICT ANNUAL FINANCIAL REPORT JUNE 30, 2017
 SAN BERNARDINO COMMUNITY COLLEGE DISTRICT ANNUAL FINANCIAL REPORT TABLE OF CONTENTS FINANCIAL SECTION Independent Auditor's Report 2 Management Discussion and Analysis 5 Basic Financial Statements - Primary
Interurban Transit Partnership
 Single Audit Report Years Ended September 30, 2016 and 2015 The report accompanying these financial statements was issued by BDO USA, LLP, a Delaware limited liability partnership and the U.S. member of
WORCESTER REGIONAL TRANSIT AUTHORITY (A Component Unit of the Massachusetts Department of Transportation) Financial Statements And Supplementary
 Financial Statements And Supplementary") Financial Statements And Supplementary Information For The Year Ended June 30, 2018 And Independent Auditors Report Financial Statements and Supplementary Information For The Year Ended June 30, 2018 And
Financial Statements And Supplementary Information For The Year Ended June 30, 2018 And Independent Auditors Report Financial Statements and Supplementary Information For The Year Ended June 30, 2018 And
Jefferson County Public Transportation Benefit Area (Jefferson Transit Authority)
") Financial Statements and Federal Single Audit Report Jefferson County Public Transportation Benefit Area (Jefferson Transit Authority) For the period January 1, 2015 through December 31, 2015 Published
Financial Statements and Federal Single Audit Report Jefferson County Public Transportation Benefit Area (Jefferson Transit Authority) For the period January 1, 2015 through December 31, 2015 Published
STATE OF NEW MEXICO EL VALLE DE LOS RANCHOS WATER & SANITATION DISTRICT ANNUAL FINANCIAL REPORT JUNE 30, 2016
 STATE OF NEW MEXICO EL VALLE DE LOS RANCHOS WATER & SANITATION DISTRICT ANNUAL FINANCIAL REPORT JUNE 30, 2016 (This page intentionally left blank.) INTRODUCTORY SECTION (This page intentionally left blank.)
CENTRAL CONTRA COSTA TRANSIT AUTHORITY CONCORD, CALIFORNIA BASIC FINANCIAL STATEMENTS WITH INDEPENDENT AUDITOR S REPORT JUNE 30, 2015
 CENTRAL CONTRA COSTA TRANSIT AUTHORITY CONCORD, CALIFORNIA BASIC FINANCIAL STATEMENTS WITH INDEPENDENT AUDITOR S REPORT JUNE 30, 2015 CENTRAL CONTRA COSTA TRANSIT AUTHORITY JUNE 30, 2015 TABLE OF CONTENTS
COASTAL ANIMAL SERVICES AUTHORITY SAN CLEMENTE, CALIFORNIA BASIC FINANCIAL STATEMENTS AND INDEPENDENT AUDITOR S REPORT
 COASTAL ANIMAL SERVICES AUTHORITY SAN CLEMENTE, CALIFORNIA BASIC FINANCIAL STATEMENTS AND INDEPENDENT AUDITOR S REPORT Financial Statements TABLE OF CONTENTS Independent Auditor s Report 1 Management
EASTERN SIERRA TRANSIT AUTHORITY ANNUAL FINANCIAL REPORT WITH INDEPENDENT AUDITOR S THEREON. June 30, 2016
 EASTERN SIERRA TRANSIT AUTHORITY ANNUAL FINANCIAL REPORT WITH INDEPENDENT AUDITOR S THEREON June 30, 2016 Annual Financial Report For the Year Ended June 30, 2016 TABLE OF CONTENTS FINANCIAL SECTION Independent
MARIPOSA COUNTY TRANSIT FUND, CALIFORNIA
 MARIPOSA COUNTY TRANSIT FUND, CALIFORNIA FINANCIAL STATEMENTS TOGETHER WITH INDEPENDENT AUDITOR S REPORT FOR THE YEAR ENDED JUNE 30, 2015 THIS PAGE INTENTIONALLY LEFT BLANK MARIPOSA COUNTY TRANSIT FUND
Jefferson County Public Transportation Benefit Area (Jefferson Transit Authority)
") Financial Statements Audit Report Jefferson County Public Transportation Benefit Area (Jefferson Transit Authority) For the period January 1, 2016 through December 31, 2016 Published August 3, 2017 Report
Financial Statements Audit Report Jefferson County Public Transportation Benefit Area (Jefferson Transit Authority) For the period January 1, 2016 through December 31, 2016 Published August 3, 2017 Report
POTOMAC AND RAPPAHANNOCK TRANSPORTATION COMMISSION
 POTOMAC AND RAPPAHANNOCK TRANSPORTATION COMMISSION FINANCIAL AND COMPLIANCE REPORTS YEAR ENDED JUNE 30, 2017 ASSURANCE, TAX & ADVISORY SERVICES TABLE OF CONTENTS FINANCIAL SECTION INDEPENDENT AUDITOR S
DETROIT TRANSPORTATION CORPORATION
 FINANCIAL REPORT JUNE 30, 2017 Contents Page No. Independent Auditor s Report... 1 Management Discussion & Analysis... 3 Basic Financial Statements: Statement of Net Position... 9 Statement of Revenues,
ST. CHARLES CITY-COUNTY LIBRARY DISTRICT FINANCIAL STATEMENTS AND SUPPLEMENTARY INFORMATION AND INDEPENDENT AUDITORS REPORT JUNE 30, 2016
 ST. CHARLES CITY-COUNTY LIBRARY DISTRICT FINANCIAL STATEMENTS AND SUPPLEMENTARY INFORMATION AND INDEPENDENT AUDITORS REPORT JUNE 30, 2016 Table of Contents INDEPENDENT AUDITORS REPORT... 1 Page MANAGEMENT
SACRAMENTO EMPLOYMENT AND TRAINING AGENCY INDEPENDENT AUDITORS REPORT, FINANCIAL STATEMENTS AND SINGLE AUDIT REPORT FOR THE YEAR ENDED JUNE 30, 2017
 SACRAMENTO EMPLOYMENT AND TRAINING AGENCY INDEPENDENT AUDITORS REPORT, FINANCIAL STATEMENTS AND SINGLE AUDIT REPORT FINANCIAL STATEMENTS AND SINGLE AUDIT REPORT TABLE OF CONTENTS FINANCIAL SECTION PAGE
CENTRAL CONTRA COSTA TRANSIT AUTHORITY CONCORD, CALIFORNIA BASIC FINANCIAL STATEMENTS WITH INDEPENDENT AUDITOR S REPORT JUNE 30, 2016
 CENTRAL CONTRA COSTA TRANSIT AUTHORITY CONCORD, CALIFORNIA BASIC FINANCIAL STATEMENTS WITH INDEPENDENT AUDITOR S REPORT JUNE 30, 2016 CENTRAL CONTRA COSTA TRANSIT AUTHORITY JUNE 30, 2016 TABLE OF CONTENTS
MEDFORD HOUSING AUTHORITY Medford, Massachusetts FINANCIAL STATEMENTS
 Medford, Massachusetts FINANCIAL STATEMENTS TABLE OF CONTENTS Independent Auditors' Report... 4 Management s Discussion and Analysis... 7 Basic Financial Statements Statement of Net Position... 5 Statement
GAYLORD COMMUNITY SCHOOLS GAYLORD, MICHIGAN FINANCIAL STATEMENTS JUNE 30, 2016
 GAYLORD, MICHIGAN FINANCIAL STATEMENTS JUNE 30, 2016 TABLE OF CONTENTS Independent Auditor's Report 1-3 Management's Discussion and Analysis 4-11 Basic Financial Statements District-wide Financial Statements
COLUSA COUNTY LOCAL TRANSPORTATION COMMISSION, CALIFORNIA
 COLUSA COUNTY LOCAL TRANSPORTATION COMMISSION, CALIFORNIA FINANCIAL STATEMENTS TOGETHER WITH INDEPENDENT AUDITOR S REPORT FOR THE YEAR ENDED JUNE 30, 2016 THIS PAGE INTENTIONALLY LEFT BLANK Annual Financial
CAJON VALLEY UNION SCHOOL DISTRICT COUNTY OF SAN DIEGO EL CAJON, CALIFORNIA AUDIT REPORT JUNE 30, 2015
 COUNTY OF SAN DIEGO EL CAJON, CALIFORNIA AUDIT REPORT JUNE 30, 2015 Wilkinson Hadley King & Co. LLP CPA's and Advisors 218 W. Douglas Ave El Cajon, CA 92020 Introductory Section Cajon Valley Union School
FALLBROOK UNION HIGH SCHOOL DISTRICT ANNUAL FINANCIAL REPORT JUNE 30, 2017
 FALLBROOK UNION HIGH SCHOOL DISTRICT ANNUAL FINANCIAL REPORT TABLE OF CONTENTS FINANCIAL SECTION Independent Auditor's Report 2 Management's Discussion and Analysis 5 Basic Financial Statements Government-Wide
LOS ANGELES COMMUNITY COLLEGE DISTRICT. Basic Financial Statements. June 30, (With Independent Auditors Report Thereon)
") Basic Financial Statements (With Independent Auditors Report Thereon) Los Angeles County, California: East Los Angeles College Los Angeles City College Los Angeles Harbor College Los Angeles Mission College
Basic Financial Statements (With Independent Auditors Report Thereon) Los Angeles County, California: East Los Angeles College Los Angeles City College Los Angeles Harbor College Los Angeles Mission College
CAPE COD REGIONAL TRANSIT AUTHORITY (a component Unit of the Massachusetts Department of Transportation)
") (a component Unit of the Massachusetts Department of Transportation) Basic Financial Statements, Supplementary Data For the Year Ended June 30, 2017 Table of Contents Management s Discussion and Analysis
(a component Unit of the Massachusetts Department of Transportation) Basic Financial Statements, Supplementary Data For the Year Ended June 30, 2017 Table of Contents Management s Discussion and Analysis
WEST BAY SANITARY DISTRICT FINANCIAL STATEMENTS AND INDEPENDENT AUDITOR S REPORT JUNE 30, 2015 * * *
 WEST BAY SANITARY DISTRICT FINANCIAL STATEMENTS AND INDEPENDENT AUDITOR S REPORT JUNE 30, 2015 * * * CHAVAN & ASSOCIATES LLP CERTIFIED PUBLIC ACCOUNTANTS 1475 SARATOGA AVE, SUITE 180 SAN JOSE, CA 95129
GREATER DAYTON REGIONAL TRANSIT AUTHORITY MONTGOMERY COUNTY DECEMBER 31, 2016 TABLE OF CONTENTS. Independent Auditor s Report... 1
 GREATER DAYTON REGIONAL TRANSIT AUTHORITY MONTGOMERY COUNTY DECEMBER 31, 2016 TABLE OF CONTENTS TITLE PAGE Independent Auditor s Report... 1 Prepared by Management: Management s Discussion and Analysis...
Accounting & Consulting Group, LLP. Certified Public Accountants
 Accounting & Consulting Group, LLP Certified Public Accountants STATE OF NEW MEXICO CITY OF EUNICE HOUSING AUTHORITY A COMPONENT UNIT OF THE CITY OF EUNICE, NEW MEXICO ANNUAL FINANCIAL REPORT FOR THE
MORONGO BASIN TRANSIT AUTHORITY (A JOINT POWERS AUTHORITY) ANNUAL FINANCIAL REPORT FOR THE FISCAL YEAR ENDED JUNE 30, 2017
 ANNUAL FINANCIAL REPORT FOR THE FISCAL YEAR ENDED JUNE 30, 2017") ANNUAL FINANCIAL REPORT FOR THE FISCAL YEAR ENDED JUNE 30, 2017 FOR THE FISCAL YEAR ENDED JUNE 30, 2017 TABLE OF CONTENTS Page INDEPENDENT AUDITORS REPORT... 1 Basic Financial Statements: Statement of
ANNUAL FINANCIAL REPORT FOR THE FISCAL YEAR ENDED JUNE 30, 2017 FOR THE FISCAL YEAR ENDED JUNE 30, 2017 TABLE OF CONTENTS Page INDEPENDENT AUDITORS REPORT... 1 Basic Financial Statements: Statement of
Glasgow Electric Plant Board
 FINANCIAL STATEMENTS AND SUPPLEMENTARY INFORMATION June 30, 2018-1- Table of Contents June 30, 2018 REPORT Independent Auditors Report 1 FINANCIAL STATEMENTS Required Supplementary Information: Management
CAPE COD REGIONAL TRANSIT AUTHORITY (a component Unit of the Massachusetts Department of Transportation)
") (a component Unit of the Massachusetts Department of Transportation) Basic Financial Statements, Supplementary Data For the Year Ended June 30, 2015 Table of Contents Management s Discussion and Analysis
(a component Unit of the Massachusetts Department of Transportation) Basic Financial Statements, Supplementary Data For the Year Ended June 30, 2015 Table of Contents Management s Discussion and Analysis
Desert Recreation District. Annual Financial Report. For the Fiscal Year Ended June 30, 2018
 Annual Financial Report For the Fiscal Year Ended June 30, 2018 Board of Directors as of June 30, 2018 Name Title Term Laura McGalliard President 12/2015-12/2019 Rudy Gutierrez Vice President 12/2015-12/2019
Belding Area Schools. Financial Statements With Supplemental Information June 30, 2018
 Financial Statements With Supplemental Information Contents Independent Auditor s Report 1-2 Management s Discussion and Analysis 3-9 Basic Financial Statements Government - Wide Financial Statements:
ALLAN HANCOCK JOINT COMMUNITY COLLEGE DISTRICT ANNUAL FINANCIAL REPORT JUNE 30, 2017
 ALLAN HANCOCK JOINT COMMUNITY COLLEGE DISTRICT ANNUAL FINANCIAL REPORT TABLE OF CONTENTS FINANCIAL SECTION Independent Auditor's Report 2 Management's Discussion and Analysis 5 Basic Financial Statements
CITY OF PORTERVILLE. Transportation and Transit Funds Audited Financial Statements. Years Ended June 30, 2016 and 2015
 CITY OF PORTERVILLE Transportation and Transit Funds Audited Financial Statements Years Ended June 30, 2016 and 2015 THIS PAGE INTENTIONALLY LEFT BLANK CITY OF PORTERVILLE Transportation and Transit Funds
TEMPLETON COMMUNITY SERVICES DISTRICT FINANCIAL STATEMENTS JUNE 30, 2018
 TEMPLETON COMMUNITY SERVICES DISTRICT FINANCIAL STATEMENTS L & C Leaf & Cole, LLP Certified Public Accountants FINANCIAL STATEMENTS TABLE OF CONTENTS Independent Auditor s Report 1-2 Management s Discussion
BOARD OF EDUCATION OF CARROLL COUNTY MANAGEMENT S DISCUSSION AND ANALYSIS, FINANCIAL STATEMENTS AND REQUIRED SUPPLEMENTARY INFORMATION
 MANAGEMENT S DISCUSSION AND ANALYSIS, FINANCIAL STATEMENTS AND REQUIRED SUPPLEMENTARY INFORMATION YEAR ENDED TABLE OF CONTENTS YEAR ENDED INDEPENDENT AUDITORS REPORT 1 MANAGEMENT S DISCUSSION AND ANALYSIS
South Central Transit Authority. Financial Statements June 30, 2015
 Financial Statements Table of Contents Page INDEPENDENT AUDITOR'S REPORT 1 and 2 MANAGEMENT'S DISCUSSION AND ANALYSIS 3 to 6 FINANCIAL STATEMENTS Statement of Net Position 7 Statement of Revenues, Expenses,
HARBOR TRANSIT MULTI-MODAL TRANSPORTATION SYSTEM
 HARBOR TRANSIT MULTI-MODAL TRANSPORTATION SYSTEM FINANCIAL STATEMENTS FOR THE YEAR ENDED JUNE 30, 2018 Vredeveld Haefner LLC CPAs and Consultants TABLE OF CONTENTS FINANCIAL SECTION PAGE Independent Auditors
South Central Transit Authority
 Financial Statements and Supplementary Information For the Year Ended June 30, 2016 and the Six Month Period Ending June 30, 2015 Table of Contents Year Ended June 30, 2016 and the Six Month Period Ending
CITY OF DIXON TRANSIT FUND FINANCIAL STATEMENTS WITH INDEPENDENT AUDITOR S REPORT FOR THE FISCAL YEAR ENDED JUNE 30, 2015
 FINANCIAL STATEMENTS WITH INDEPENDENT AUDITOR S REPORT FOR THE FISCAL YEAR ENDED FINANCIAL STATEMENTS WITH INDEPENDENT AUDITOR S REPORT FOR THE FISCAL YEAR ENDED Financial Section CITY OF DIXON TRANSIT
Pinnacle Charter School, Inc.
 Financial Statements and Supplementary Information For the Year Ended June 30, 2014 Table of Contents INTRODUCTORY SECTION Roster of School Officials Page(s) i FINANCIAL SECTION Independent Auditor s Report
BASIC FINANCIAL STATEMENTS FOR THE FISCAL YEAR ENDED JUNE 30, 2016
 COMMONWEALTH OF PUERTO RICO BASIC FINANCIAL STATEMENTS FOR THE FISCAL YEAR ENDED JUNE 30, 2016 BASIC FINANCIAL STATEMENTS TABLE OF CONTENTS PAGE Independent Auditors' Report 1-2 Management s Discussion
Tecumseh Public Schools Tecumseh, Michigan FINANCIAL STATEMENTS. June 30, 2018
 Tecumseh, Michigan FINANCIAL STATEMENTS TABLE OF CONTENTS Page INDEPENDENT AUDITOR S REPORT MANAGEMENT S DISCUSSION AND ANALYSIS i-ii iii-viii BASIC FINANCIAL STATEMENTS District-wide Financial Statements
VICTOR VALLEY TRANSIT AUTHORITY (A JOINT POWERS AUTHORITY) BASIC FINANCIAL STATEMENTS WITH INDEPENDENT AUDITORS REPORT
 BASIC FINANCIAL STATEMENTS WITH INDEPENDENT AUDITORS REPORT") VICTOR VALLEY TRANSIT AUTHORITY BASIC FINANCIAL STATEMENTS WITH INDEPENDENT AUDITORS REPORT FOR THE FISCAL FOR THE FISCAL TABLE OF CONTENTS INDEPENDENT AUDITORS REPORT... 1 MANAGEMENT S DISCUSSION AND
VICTOR VALLEY TRANSIT AUTHORITY BASIC FINANCIAL STATEMENTS WITH INDEPENDENT AUDITORS REPORT FOR THE FISCAL FOR THE FISCAL TABLE OF CONTENTS INDEPENDENT AUDITORS REPORT... 1 MANAGEMENT S DISCUSSION AND
BROWARD COUNTY, FLORIDA WATER AND WASTEWATER FUND A Major Fund of Broward County, Florida
 BROWARD COUNTY, FLORIDA WATER AND WASTEWATER FUND A Major Fund of Broward County, Florida Financial Statements For the Years Ended September 30, 2013 and 2012 BROWARD COUNTY, FLORIDA WATER AND WASTEWATER
GREENVILLE TRANSIT AUTHORITY GREENVILLE, SOUTH CAROLINA
 GREENVILLE TRANSIT AUTHORITY GREENVILLE, SOUTH CAROLINA FINANCIAL STATEMENTS YEAR ENDED JUNE 30, 2014 AND NINE MONTHS ENDED JUNE 30, 2013 TABLE OF CONTENTS YEAR ENDED JUNE 30, 2014 AND NINE MONTHS ENDED
MARK TWAIN UNION ELEMENTARY SCHOOL DISTRICT ANNUAL FINANCIAL REPORT FOR THE YEAR ENDED JUNE 30, 2017
 MARK TWAIN UNION ELEMENTARY SCHOOL DISTRICT ANNUAL FINANCIAL REPORT FOR THE YEAR ENDED This page left blank intentionally. TABLE OF CONTENTS FOR THE YEAR ENDED FINANCIAL SECTION Independent Auditor s Report
PULASKI COUNTY PUBLIC SERVICE AUTHORITY (A COMPONENT UNIT OF PULASKI COUNTY, VIRGINIA)
") PULASKI COUNTY PUBLIC SERVICE AUTHORITY (A COMPONENT UNIT OF PULASKI COUNTY, VIRGINIA) FINANCIAL REPORT YEAR ENDED JUNE 30, 2017 Pulaski County Public Service Authority (A Component Unit of Pulaski County,
PULASKI COUNTY PUBLIC SERVICE AUTHORITY (A COMPONENT UNIT OF PULASKI COUNTY, VIRGINIA) FINANCIAL REPORT YEAR ENDED JUNE 30, 2017 Pulaski County Public Service Authority (A Component Unit of Pulaski County,
ARCTIC VILLAGE TRIBAL COUNCIL. Year Ended September 30, 2016
 Management Discussion and Analysis, Basic Financial Statements, Additional Supplementary Information and Compliance Reports Year Ended September 30, 2016 Management Discussion and Analysis, Basic Financial
WEST CITIES POLICE COMMUNICATIONS JOINT POWERS AUTHORITY BASIC FINANCIAL STATEMENTS AND INDEPENDENT AUDITORS REPORT
 WEST CITIES POLICE COMMUNICATIONS JOINT POWERS AUTHORITY BASIC FINANCIAL STATEMENTS AND INDEPENDENT AUDITORS REPORT FOR THE FISCAL YEAR ENDED JUNE 30, 2017 THIS PAGE INTENTIONALLY LEFT BLANK WEST CITIES
CITY OF AVENAL CALIFORNIA
 CALIFORNIA FINANCIAL STATEMENTS FOR THE YEAR ENDED JUNE 30, 2014 JUNE 30, 2014 TABLE OF CONTENTS INDEPENDENT AUDITOR S REPORT...1 BASIC FINANCIAL STATEMENTS: Government-Wide Financial Statements: Statement
Vavrinek, Trine, Day & Co., LLP
 Attachment A Digitally signed by Lynn Lynn M. Stephens, M. Stephens, Commission Coordinator Commission Date: 2017.10.30 14:19:23 Coordinator -07'00' Vavrinek, Trine, Day & Co., LLP VA L U E T H E D I F
Georgia Cyber Academy, Inc. Audited Financial Statements June 30, 2017
 Audited Financial Statements June 30, 2017 Bambo Sonaike CPA, LLC 707 Whitlock Avenue Building B Suite 21 Marietta GA 30064 P: 770.956.6455 F: 678.559.0659 www.cpa-service.com Table of Contents Table of
LOS ANGELES COMMUNITY COLLEGE DISTRICT. June 30, 2003
 Los Angeles Community College District Report on Audited Basic Financial Statements June 30, 2003 June 30, 2003 Los Angeles County, California: East Los Angeles College Los Angeles City College Los Angeles
KPBS FM/TV. Financial Statements and Report of Independent Certified Public Accountants. June 30, 2018 and 2017
 Financial Statements and Report of Independent Certified Public Accountants June 30, 2018 and 2017 Contents Page Report of Independent Certified Public Accountants 1-2 Management s Discussion and Analysis
CAPE COD REGIONAL TRANSIT AUTHORITY (a component Unit of the Massachusetts Department of Transportation)
") (a component Unit of the Massachusetts Department of Transportation) Basic Financial Statements, Supplementary Data For the Year Ended Table of Contents Management s Discussion and Analysis i vi Independent
(a component Unit of the Massachusetts Department of Transportation) Basic Financial Statements, Supplementary Data For the Year Ended Table of Contents Management s Discussion and Analysis i vi Independent
Diablo Water District
 Diablo Water District Oakley, California Annual Financiall Report For the Years Endedd June 30, 2016 and 2015 For the Year Ended June 30, 2016 BOARD OF DIRECTORS Howard Hobbs Kenneth L. Crockett Enrico
GAYLORD COMMUNITY SCHOOLS GAYLORD, MICHIGAN FINANCIAL STATEMENTS JUNE 30, 2015
 GAYLORD, MICHIGAN FINANCIAL STATEMENTS JUNE 30, 2015 TABLE OF CONTENTS Independent Auditor's Report 1-3 Management's Discussion and Analysis 4-12 Basic Financial Statements District-wide Financial Statements
PLACER MOSQUITO AND VECTOR CONTROL DISTRICT
 INDEPENDENT AUDITORS REPORTS, MANAGEMENT S DISCUSSION AND ANALYSIS, BASIC FINANCIAL STATEMENTS AND REQUIRED SUPPLEMENTARY INFORMATION FOR THE FISCAL YEAR ENDED JUNE 30, 2017 Table of Contents Page(s) Independent
CHICAGO TRANSIT AUTHORITY. FINANCIAL STATEMENTS AND SUPPLEMENTARY INFORMATION December 31, 2010 and 2009 (With Independent Auditors Report Thereon)
") FINANCIAL STATEMENTS AND SUPPLEMENTARY INFORMATION (With Independent Auditors Report Thereon) Chicago, Illinois FINANCIAL STATEMENTS CONTENTS Independent Auditors Report... 1 Management s Discussion and
FINANCIAL STATEMENTS AND SUPPLEMENTARY INFORMATION (With Independent Auditors Report Thereon) Chicago, Illinois FINANCIAL STATEMENTS CONTENTS Independent Auditors Report... 1 Management s Discussion and
CITY OF AURORA, ILLINOIS AURORA PUBLIC LIBRARY
 ANNUAL FINANCIAL REPORT For the Year Ended December 31, 2017 TABLE OF CONTENTS Page(s) INDEPENDENT AUDITOR S REPORT... 1-2 GENERAL PURPOSE EXTERNAL FINANCIAL STATEMENTS Management s Discussion and Analysis...
Interurban Transit Partnership
 Single Audit Report Years Ended September 30, 2014 and 2013 The report accompanying these financial statements was issued by BDO USA, LLP, a Delaware limited liability partnership and the U.S. member of
MASTERY CHARTER HIGH SCHOOL FINANCIAL STATEMENTS AND SUPPLEMENTARY INFORMATION YEAR ENDED JUNE 30, 2018
 FINANCIAL STATEMENTS AND SUPPLEMENTARY INFORMATION YEAR ENDED CliftonLarsonAllen LLP TABLE OF CONTENTS YEAR ENDED INDEPENDENT AUDITORS REPORT 1 REQUIRED SUPPLEMENTARY INFORMATION MANAGEMENT S DISCUSSION
STONEYBROOK COMMUNITY DEVELOPMENT DISTRICT
 STONEYBROOK COMMUNITY DEVELOPMENT DISTRICT REGULAR MEETING AGENDA April 24, 2018 Stoneybrook Community Development District OFFICE OF THE DISTRICT MANAGER 2300 Glades Road, Suite 410W Boca Raton, Florida
INDEPENDENT AUDITOR S REPORT
 INDEPENDENT AUDITOR S REPORT To the Board of Directors Novato Fire Protection District Novato, California Report on Financial Statements We have audited the accompanying financial statements of the governmental
DIABLO WATER DISTRICT ANNUAL FINANCIAL REPORT WITH INDEPENDENT AUDITOR'S REPORT FOR THE FISCAL YEARS ENDED JUNE 30, 2018 AND 2017
 ANNUAL FINANCIAL REPORT WITH INDEPENDENT AUDITOR'S REPORT FOR THE FISCAL YEARS ENDED MANN, URRUTIA, NELSON, CPAS & ASSOCIATES, LLP 1760 CREEKSIDE OAKS DRIVE, SUITE 160 SACRAMENTO, CALIFORNIA 95833 For
CHICAGO TRANSIT AUTHORITY. FINANCIAL STATEMENTS AND SUPPLEMENTARY INFORMATION December 31, 2011 and 2010 (With Independent Auditors Report Thereon)
") FINANCIAL STATEMENTS AND SUPPLEMENTARY INFORMATION (With Independent Auditors Report Thereon) Chicago, Illinois FINANCIAL STATEMENTS CONTENTS Independent Auditors Report... 1 Management s Discussion and
FINANCIAL STATEMENTS AND SUPPLEMENTARY INFORMATION (With Independent Auditors Report Thereon) Chicago, Illinois FINANCIAL STATEMENTS CONTENTS Independent Auditors Report... 1 Management s Discussion and
PORTAGE AREA REGIONAL TRANSIT AUTHORITY PORTAGE COUNTY AUDIT REPORT FOR THE YEAR ENDED DECEMBER 31, 2016
 PORTAGE AREA REGIONAL TRANSIT AUTHORITY PORTAGE COUNTY AUDIT REPORT FOR THE YEAR ENDED DECEMBER 31, 2016 PORTAGE AREA REGIONAL TRANSIT AUTHORITY PORTAGE COUNTY DECEMBER 31, 2016 TABLE OF CONTENTS TITLE
Moapa Valley Water District
 Moapa Valley Water District ANNUAL FINANCIAL REPORT For the Year Ended June 30, 2018 Beginning on page INDEPENDENT AUDITOR'S REPORT 1 MANAGEMENT DISCUSSION AND ANALYSIS 3 BASIC FINANCIAL STATEMENTS 9
ALLIANCE BEHAVIORAL HEALTHCARE
 FINANCIAL REPORT, REQUIRED SUPPLEMENTARY INFORMATION, AND SUPPLEMENTAL SCHEDULES As of and for the Year Ended June 30, 2017 And Report of Independent Auditor TABLE OF CONTENTS REPORT OF INDEPENDENT AUDITOR...
PINE BROOK WATER DISTRICT Boulder, CO. FINANCIAL STATEMENTS For the Year Ended December 31, 2012 and 2011
 PINE BROOK WATER DISTRICT Boulder, CO FINANCIAL STATEMENTS For the Year Ended December 31, 2012 and 2011 TABLE OF CONTENTS INDEPENDENT AUDITOR S REPORT 1 MANAGEMENT S DISCUSSION AND ANALYSIS 3 BASIC FINANCIAL
New Hanover County Airport Authority A Component Unit of New Hanover County. Financial Statements and Compliance Year Ended June 30, 2018
 New Hanover County Airport Authority A Component Unit of New Hanover County Financial Statements and Compliance Year Ended June 30, 2018 Contents Financial section Independent auditors report 1-3 Management
Town of Ramapo, New York
 Financial Statements and Supplementary Information Year Ended December 31, 2014 Table of Contents Page No. Independent Auditors' Report Management's Discussion and Analysis Basic Financial Statements
PULASKI COUNTY PUBLIC SERVICE AUTHORITY (A COMPONENT UNIT OF PULASKI COUNTY, VIRGINIA)
") PULASKI COUNTY PUBLIC SERVICE AUTHORITY (A COMPONENT UNIT OF PULASKI COUNTY, VIRGINIA) FINANCIAL REPORT YEAR ENDED JUNE 30, 2016 Pulaski County Public Service Authority (A Component Unit of Pulaski County,
PULASKI COUNTY PUBLIC SERVICE AUTHORITY (A COMPONENT UNIT OF PULASKI COUNTY, VIRGINIA) FINANCIAL REPORT YEAR ENDED JUNE 30, 2016 Pulaski County Public Service Authority (A Component Unit of Pulaski County,
Public Schools of the City of Ann Arbor, Michigan. Financial Report with Supplemental Information June 30, 2018
 Financial Report with Supplemental Information Contents Independent Auditor's Report 1-2 Management's Discussion and Analysis 3-9 Basic Financial Statements Government-wide Financial Statements: Statement
CITY OF ALTURAS ALTURAS, CALIFORNIA BASIC FINANCIAL STATEMENTS
 CITY OF ALTURAS ALTURAS, CALIFORNIA BASIC FINANCIAL STATEMENTS JUNE 30, 2016 TABLE OF CONTENTS PAGE Independent Auditors Report 1-2 Management s Discussion and Analysis 3-10 Basic Financial Statements:
KANSAS TURNPIKE AUTHORITY (A COMPONENT UNIT OF THE STATE OF KANSAS)
") FINANCIAL STATEMENTS FOR THE YEARS ENDED JUNE 30, 2018 AND 2017 WITH INDEPENDENT AUDITOR S REPORT FINANCIAL STATEMENTS FOR THE YEARS ENDED JUNE 30, 2018 AND 2017 WITH INDEPENDENT AUDITOR S REPORT FINANCIAL
FINANCIAL STATEMENTS FOR THE YEARS ENDED JUNE 30, 2018 AND 2017 WITH INDEPENDENT AUDITOR S REPORT FINANCIAL STATEMENTS FOR THE YEARS ENDED JUNE 30, 2018 AND 2017 WITH INDEPENDENT AUDITOR S REPORT FINANCIAL
HARBOR TRANSIT MULTI-MODAL TRANSPORTATION SYSTEM
 HARBOR TRANSIT MULTI-MODAL TRANSPORTATION SYSTEM FINANCIAL STATEMENTS FOR THE YEAR ENDED JUNE 30, 2017 Vredeveld Haefner LLC CPAs and Consultants TABLE OF CONTENTS FINANCIAL SECTION PAGE Independent Auditors
MIDWAY CITY SANITARY DISTRICT FINANCIAL STATEMENTS WITH REPORT ON AUDIT BY INDEPENDENT CERTIFIED PUBLIC ACCOUNTANTS FOR THE YEAR ENDED JUNE 30, 2017
 FINANCIAL STATEMENTS WITH REPORT ON AUDIT BY INDEPENDENT CERTIFIED PUBLIC ACCOUNTANTS FOR THE YEAR ENDED JUNE 30, 2017 TABLE OF CONTENTS For the year ended Page Number Independent Auditors Report 1-2 Management
Bellevue Community Schools
 FINANCIAL STATEMENTS AND INDEPENDENT AUDITOR'S REPORT Year Ended Table of Contents INDEPENDENT AUDITOR'S REPORT 1 ADMINISTRATION'S DISCUSSION AND ANALYSIS 3 BASIC FINANCIAL STATEMENTS Government-Wide Financial
PLUM CREEK LIBRARY SYSTEM AUDITED FINANCIAL STATEMENTS AND SUPPLEMENTARY INFORMATION JUNE 30, 2017
 AUDITED FINANCIAL STATEMENTS AND SUPPLEMENTARY INFORMATION JUNE 30, 2017 Conway, Deuth & Schmiesing, PLLP Certified Public Accountants & Consultants Willmar, Minnesota This page intentionally left blank
STATE OF NEW MEXICO ARTESIA HOUSING AUTHORITY ANNUAL FINANCIAL REPORT FOR THE YEAR ENDED JUNE 30, 2016
 STATE OF NEW MEXICO ANNUAL FINANCIAL REPORT FOR THE YEAR ENDED JUNE 30, 2016 INTRODUCTORY SECTION STATE OF NEW MEXICO Board of Commissioners and Management June 30, 2016 Board of Directors Chairperson
BARSTOW COMMUNITY COLLEGE DISTRICT
 BARSTOW COMMUNITY COLLEGE DISTRICT San Bernardino County Barstow, California Report on Audit TABLE OF CONTENTS FINANCIAL SECTION STATEMENT OF NET POSITION...9 STATEMENT OF REVENUES, EXPENDITURES, AND CHANGES
CAL STATE L.A. METROLINK STATION AUTHORITY FINANCIAL STATEMENTS WITH REPORT ON AUDIT BY INDEPENDENT CERTIFIED PUBLIC ACCOUNTANTS
 CAL STATE L.A. METROLINK STATION AUTHORITY FINANCIAL STATEMENTS WITH REPORT ON AUDIT BY INDEPENDENT CERTIFIED PUBLIC ACCOUNTANTS FOR THE FISCAL YEAR ENDED JUNE 30, 2014 TABLE OF CONTENTS For the year ended