DART Fare Structure Programs
|
|
|
- Jack Henderson
- 5 years ago
- Views:
Transcription


1 DART Fare Structure Programs Budget & Finance Committee November 13, 2018 Joseph G. Costello Senior Vice President, Finance 0
2 Calendar Date Nov 13 Dec 11 Jan 22 Feb 26 Mar 26 Apr 23 May 28 Jun 18 Jul 18 Aug 13 Aug 27 Sep 17 Fare Structure Briefing Programs Subject Fare Structure Briefing Fare Change Cadence Possible Amendment to DART Policy or Financial Standards Regarding Fares FY 2018 Operating Financial Review / Annual Disclosure Statement FY 2019 Financial Outlook and Preliminary FY 2020 Financial Outlook Approval of Financial Standards for FY 2020 Budget and Financial Planning Process FY 2020 Capital Budget Overview FY 2020 Operating Budget Overview Proposed FY 2020 Annual Budget & Twenty-Year Financial Plan Approval to Distribute FY 2020 Annual Budget and Twenty-Year Financial Plan to Service Area Cities Budget & Finance Committee recommends approval of FY 2020 Annual Budget and Twenty-Year Financial Plan to the Committee-of-the-Whole Board Approval of FY 2020 Annual Budget and Twenty-Year Financial Plan 1
3 Presentation Outline DART ridership demographics & system usage DART programs and payment system features beneficial to lower income Means testing Potential approaches Administrative requirements Peer review Estimated revenue impact 2
4 Ridership Demographics 6.8% 3.1% Under % %
5 Ridership Demographics (cont.) Students = 16.5% of Ridership 3.1% College F/T 3.6% 9.5% College P/T K-12 4

6 Ridership Demographics (cont.) 5

7 Trip Purpose Drivers license: 67.5% have a valid driver s license Employment: 2/3 employed full-time 6
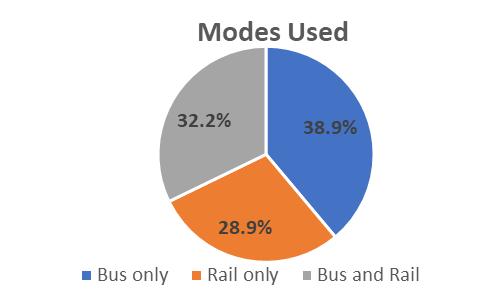
8 Number of Vehicles Used to Complete One-way Trip % 14% 2 28% 1 55% 7
9 Rider Gender / Ethnicity Asian, 2.5% Other, 1.7% 52.8% 47.2% Male Female Hispanic/Latino, 18.4% Black/African American, 52.7% White, 24.6% 8

10 Number of Working Vehicles in Household 9

11 Total Household Income 10
12 Employment 8.9% 10.0% 14.5% 66.6% Full-time Part-time Not Employed Not seeking work; Retired, Homemaker Not Employed - Seeking Work 11
13 Programs Reduced Fares are applicable on bus and rail for the following: a. Seniors and non-paratransit disabled with valid ID. b. DART Shuttle bus route. c. Children elementary through middle school. d. Students attending high schools within DART Service Area, with DART-issued student ID. Valid Monday through Friday only until March 2018, full week thereafter. e. Service area residents participating in a transitional program administered by an approved social agency, with a valid DART-issued ID. f. Discount fare with Lone Star TANF benefits Reduced fare passes are Regional passes. 12
14 Programs (Cont.) Discounted Day Pass vouchers available to government, alternative schools, and non-profit institutions to be issued to DART Service Area clients. Discounted at 40%. 13
15 Payment System Stored Value Take advantage of technology and new payment system Stored Value Best Value Fare Capping Lost card value protection 14

16 Means Testing 15
17 Potential Approaches Internally Administered Externally Administered Both 16
18 Peer Review Agencies Funding Sources Portland - July, 2018 State Payroll tax $5m/yr. (4.4%) Seattle - March, 2015 San Francisco - May, 2018 Denver Transit Agency - Operating budget $3m/yr. (3.2%) MPO for Admin. & 50% revenue less $21m/yr. (2.7%) Transit agency - Operating budget $3m/yr. (3.6%) New York New York city $212m/yr. (3.4%) LA Metro - January, 2018 Sales Taxes $3.6M/yr. (1.1%) Twin Cities Metro - October, 2017 Salt Lake City UTA Eliminate bonus for stored - value cards $3M/yr. (3.7%) Both Transit agency - Operating budget N/A Projected Rev. Loss Administration Eligibility Benefit Community Organizations 200% poverty 50% discount Social Service Organizations 200% poverty 50% discount Internally Administered 200% poverty 20% discount Internally Administered 185% poverty 40% discount Internally Administered 100% poverty 50% discount Internally Administered 200% poverty 24% discount 50% of area median income $1 fare Externally Administered SNAP Card 25% discount Madison WI Metro City of Madison N/A Both 150% poverty 57% discount 17
19 Peer Review (continued) Funding Source Projected Cost Projected Rev. Loss State Payroll tax $12m/yr. $5m/yr. (4.4%) Transit Agency - Operating budget $3.2m/yr. $3m/yr. (3.2%) MPO for Admin. & 50% revenue less $21m/yr. $21m/yr. (2.7%) Transit agency - Operating budget $1m/yr. $3m/yr. (3.6%) New York city $120m/yr. $212m/yr. (3.4%) Sales Taxes N/A $3.6M/yr. (1.1%) Eliminate bonus for stored - value cards N/A $3M/yr. (3.7%) Transit agency - Operating budget N/A N/A City of Madison N/A N/A 18
20 Peer Review (continued) Administration Eligibility Benefit Community Organizations 200% poverty 50% discount Social Service Organizations 200% poverty 50% discount Internally Administered 200% poverty 20% discount Internally Administered 185% poverty 40% discount Internally Administered 100% poverty 50% discount Internally Administered 200% poverty 24% discount Both 50% of area median income $1 fare Externally Administered SNAP Card 25% discount Both 150% poverty 57% discount 19
21 Administrative Requirements 1. Publicize Fare Program 2. Issue IDs 3. Train Fare Enforcement/Bus Operators Internally Administered: o Publish Eligibility Rules, Testing Procedure o Administer Procedure (Could be contracted) Externally Administered: o For Each Applicant, Verify that Submitted Forms of Eligibility are Valid Both: o Develop Testing Procedure (lower volume than fully internal) o Administer Means Tests 20
22 Estimated Revenue Impact DART Internal Analysis Minimum-Wage Household - ~4.7% Eligible Households - First Year Revenue Loss ~$1.6 - Annual average Loss of ~2.4% - 20 Year Impact to the FP (~ $70M) 21
23 Estimated Revenue Impact DART Internal Analysis Poverty Level Household, 50% Discount - ~6.7% Eligible Household - First Year Revenue Loss ~$2.3 - Average Annual Loss of ~3.4% - 20 Year Impact to the FP (~ $98M) 22
24 Estimated Revenue Impact DART Internal Analysis 150% Poverty-Level Household, 50% Discount - 9.7% Eligible Households - First Year Revenue Loss $3.2 - Annual average Loss of 4.8% - 20 Year Impact to the FP (~ $139M) 23
25 Estimated Revenue Impact Portland Analysis 200% Poverty Level Household, 50% Discount - First Year Revenue Loss ~$3.0 - Annual average Loss of ~4.4% - 20 Year Impact to the FP (~ $128M) 24
26 Estimated Revenue Impact Seattle Analysis 200% Poverty Level Household, 50% Discount - First Year Revenue Loss ~$2.2M - Annual average Loss of ~3.2% - 20 Year Impact to the FP (~ $93M) 25
27 Estimated Revenue Impact San Francisco Analysis 200% Poverty Level Household, 20% Discount - First Year Revenue Loss ~$1.8 - Annual average Loss of ~2.7% - 20 Year Impact to the FP (~ $78M) 26
28 Estimated Revenue Impact Denver Analysis 185% Poverty Level Household, 40% Discount - First Year Revenue Loss ~$2.4 - Annual average Loss of ~3.6% - 20 Year Impact to the FP (~ $104M) 27
29 Estimated Revenue Impact New York City Analysis 100% Poverty Level Household, 50% Discount - First Year Revenue Loss ~$2.3 - Annual average Loss of ~3.4% - 20 Year Impact to the FP (~ $98M) 28
30 Analysis Approach Externally Administered Criteria and eligibility already established by other government agencies Minimal cost impact Least complicated approach Suggested threshold Minimum Wage Smallest revenue and available cash impact of all scenarios 29
31 Recap DART already maintains multiple reduced fare programs for bus and rail riders. Fare loss impact for a low-income reduced fare program depends on: 1. The income threshold (% of poverty level) chosen 2. The discount to the full fare Cost of administering a low-income fare program is driven by the level of internal effort required accepting external agency eligibility determinations keeps administrative costs low A low-income fare program has a significant effect on the Financial Plan There is a strong trend toward offering a low-income fare program among DART s peers 30
32 Calendar Date Nov 13 Dec 11 Jan 22 Feb 26 Mar 26 Apr 23 May 28 Jun 18 Jul 18 Aug 13 Aug 27 Sep 17 Fare Structure Briefing Programs Subject Fare Structure Briefing Fare Change Cadence Possible Amendment to DART Policy or Financial Standards Regarding Fares FY 2018 Operating Financial Review / Annual Disclosure Statement FY 2019 Financial Outlook and Preliminary FY 2020 Financial Outlook Approval of Financial Standards for FY 2020 Budget and Financial Planning Process FY 2020 Capital Budget Overview FY 2020 Operating Budget Overview Proposed FY 2020 Annual Budget & Twenty-Year Financial Plan Approval to Distribute FY 2020 Annual Budget and Twenty-Year Financial Plan to Service Area Cities Budget & Finance Committee recommends approval of FY 2020 Annual Budget and Twenty-Year Financial Plan to the Committee-of-the-Whole Board Approval of FY 2020 Annual Budget and Twenty-Year Financial Plan 31
Briefing on Fare Structure
 Briefing on Fare Structure Budget & Finance Committee January 22, 2019 Joseph G. Costello Senior Vice President, Finance 0 Calendar Date Subject Jan 22 Fare Structure Briefing Feb 26 FY 2018 Operating
Approval of Proposed FY 2019 Annual Budget and 20-Year Financial Plan
 Approval of Proposed FY 2019 Annual Budget and 20-Year Financial Plan Committee of the Whole September 11, 2018 Joseph G. Costello Senior Vice President, Finance 0 Board Calendar Date Subject July 10 Draft
Financial Report - FY 2017 Year to Date May 31, 2017
 Financial Report - FY 2017 Year to Date July 19, 2017 1 Major Highlights Revenue Sales tax remittances received through YTD April 2017 are 4.2% higher than YTD April 2016 Plaza Saltillo lease income budgeted
Cash & Liquidity The chart below highlights CTA s cash position at March 2017 compared to March 2016.
 To: Chicago Transit Authority Board From: Jeremy Fine, Chief Financial Officer Re: Financial Results for March 2017 Date: May 10, 2017 I. Summary CTA s financial results are $0.6 million favorable to budget
Cash & Liquidity The chart below highlights CTA s cash position at December 2017 compared to December 2016.
 To: Chicago Transit Authority Board From: Jeremy Fine, Chief Financial Officer Re: Financial Results for December 2017 Date: February 14, 2018 I. Summary CTA s financial results are $4.7 million favorable
Cash & Liquidity The chart below highlights CTA s cash position at September 2017 compared to September 2016.
 To: Chicago Transit Authority Board From: Jeremy Fine, Chief Financial Officer Re: Financial Results for September 2017 Date: November 15, 2017 I. Summary CTA s financial results are $7.7 million favorable
The year to date is less than budget and prior year by 15.4 million and 11.6 million, respectively.
 To: Chicago Transit Authority Board From: Jeremy Fine, Chief Financial Officer Re: Financial Results for September 2016 Date: November 16, 2016 I. Summary CTA s financial results are $0.3 million unfavorable
Affordable Fares Task Force Recommendations. March 26, 2015
 Affordable Fares Task Force Recommendations March 26, 2015 Low income individuals make up a disproportionate amount of RTD users. Percent of RTD riders Percent of individuals in the district Less than
Budget Process Overview and Cost Allocation Methodology
 Budget Process Overview and Cost Allocation Methodology 1 Cost Allocation Agreement Guiding Principles Operate a consolidated regional public transportation system within and between the Participating
METRO. Monthly Board Report. June 2006
 METRO Monthly Board Report Operating Capital Service Performance June 26 7/17/26 June 26 MONTHLY BOARD REPORT INDEX Section A Section B Section C Section D Section E Section F Section G Operating Budget
XML Publisher Balance Sheet Vision Operations (USA) Feb-02
 Feb-02") Page:1 Apr-01 May-01 Jun-01 Jul-01 ASSETS Current Assets Cash and Short Term Investments 15,862,304 51,998,607 9,198,226 Accounts Receivable - Net of Allowance 2,560,786
Page:1 Apr-01 May-01 Jun-01 Jul-01 ASSETS Current Assets Cash and Short Term Investments 15,862,304 51,998,607 9,198,226 Accounts Receivable - Net of Allowance 2,560,786
Cash & Liquidity The chart below highlights CTA s cash position at January 2018 compared to January 2017.
 To: Chicago Transit Authority Board From: Jeremy Fine, Chief Financial Officer Re: Financial Results for January 2018 Date: March 14, 2018 I. Summary CTA s financial results are $1.7 million unfavorable
Cash & Liquidity The chart below highlights CTA s cash position at June 2018 compared to June 2017.
 To: Chicago Transit Authority Board From: Jeremy Fine, Chief Financial Officer Re: Financial Results for June 2018 Date: August 15, 2018 I. Summary CTA s financial results are unfavorable to budget for
Approval of Proposed FY 2019 Annual Budget and 20-Year Financial Plan
 Approval of Proposed FY 2019 Annual Budget and 20-Year Financial Plan Committee of the Whole September 18, 2018 Joseph G. Costello Senior Vice President, Finance 0 Board Calendar Date Subject July 10 Draft
Big Walnut Local School District
 Big Walnut Local School District Monthly Financial Report for the month ended September 30, 2013 Prepared By: Felicia Drummey Treasurer BIG WALNUT LOCAL SCHOOL DISTRICT SUMMARY OF YEAR TO DATE FINANCIAL
Cash & Liquidity The chart below highlights CTA s cash position at August 2018 compared to August 2017.
 To: Chicago Transit Authority Board From: Jeremy Fine, Chief Financial Officer Re: Financial Results for August 2018 Date: October 10, 2018 I. Summary CTA s financial results are favorable to budget for
REVENUE & RIDERSHIP REPORT OCTOBER 2017
 REVENUE & RIDERSHIP REPORT OCTOBER 2017 Monthly passenger revenue 3.5% above last year and 1.4% below budget Monthly ridership 3.4% below budget and 6.3% below last year Year-to-date revenue 3.5% and ridership
Cash & Liquidity The chart below highlights CTA s cash position at July 2016 compared to July 2015.
 To: Chicago Transit Authority Board From: Jeremy Fine, Chief Financial Officer Re: Financial Results for July 2016 Date: September 14, 2016 I. Summary CTA s financial results are $0.4 million favorable
Cash & Liquidity The chart below highlights CTA s cash position at February 2017 compared to February 2016.
 To: Chicago Transit Authority Board From: Jeremy Fine, Chief Financial Officer Re: Financial Results for February 2017 Date: April 5, 2017 I. Summary CTA s financial results are $0.3 million favorable
Cash & Liquidity The chart below highlights CTA s cash position at March 2018 compared to March 2017.
 To: Chicago Transit Authority Board From: Jeremy Fine, Chief Financial Officer Re: Financial Results for March 2018 Date: May 9, 2018 I. Summary CTA s financial results are $0.9 million favorable to budget
Streamline Bus Five-Year Business Plan Community Conversations. Lisa Ballard, P.E. November 13, 2012
 Streamline Bus Five-Year Business Plan Community Conversations Lisa Ballard, P.E. November 13, 2012 Streamline Daytime Latenight Bridger Bowl Livingston Saturdays Galavan Reach $1.4 million per year Ride
Memorandum. May 29, Mr. Ken Bleiwas Office of the State Comptroller 59 Maiden Lane, 29 th Floor New York, New York Dear Mr.
 Memorandum State of New York May 29, 2015 Mr. Ken Bleiwas Office of the State Comptroller 59 Maiden Lane, 29 th Floor New York, New York 10038 Dear Mr. Bleiwas, This represents the MTA s First Quarter,
The Electoral System in New Zealand
 The Electoral System in New Zealand UMR Omnibus Results July 2009 Email: umr@umr.co.nz Website: www.umr.co.nz WELLINGTON 3 Collina Terrace Thorndon WELLINGTON 6011 NEW ZEALAND Tel: +64 4 473 1061 Fax:
Joint Board Program Management Report
 Joint Board Program Management Report 2 nd Quarter - 20 1 Table of Contents Report Purpose 3 System Operations Performance Data a) System Operations Sales by Fare Product Type and Sales Channel / Location
2013 STA Passenger Survey Results. Attachment E Title VI Attachment E
 2013 STA Passenger Survey Results Attachment E 1 2014 Title VI Attachment E 2013 STA Passenger Survey Results Overview Spokane Transit Authority (STA) conducted its most recent passenger survey in December
Durham Orange Joint Staff Working Group Meeting Agenda October 10, :30 pm 4:00 pm Durham City Hall, Transportation 4B
 Durham Orange Joint Staff Working Group Meeting Agenda October 10, 2018 2:30 pm 4:00 pm Durham City Hall, Transportation 4B 1. Call to Order/Roll Call 2. Election Chair Position 3. Open Issues a. FY2019
Chartered Society of Physiotherapy. CSP Membership (as at 1 st March 2018) & NHS Data (2009 to 2017) UK/England /N Ireland/Scotland/Wales
 & NHS Data (2009 to 2017) UK/England /N Ireland/Scotland/Wales") Chartered Society of Physiotherapy CSP Membership (as at 1 st March 2018) & NHS Data (2009 to 2017) UK/England /N Ireland/Scotland/Wales Summary 1. CSP Members by Country 2. CSP Total Members from 2014
Chartered Society of Physiotherapy CSP Membership (as at 1 st March 2018) & NHS Data (2009 to 2017) UK/England /N Ireland/Scotland/Wales Summary 1. CSP Members by Country 2. CSP Total Members from 2014
HART Financial Snapshot. HART Finance and Audit Committee January 23, 2017
 HART Financial Snapshot HART Finance and Audit Committee January 23, 2017 1 Requested January 3, 2017 Cash flow management overview Fund balance update including year end fund balance reported in the past
BTP Stop and Search Data - August 2012
 BTP Search Data - August 2012 Guidance Notes This analysis covers the period 01 September 2011 to 31 August 2012. These are the latest stop and search figures, compiled from data recorded on 03 October
FUEL PRICE RISK MANAGEMENT POLICY REPORT "FUEL HEDGE"
 FUEL PRICE RISK MANAGEMENT POLICY REPORT "FUEL HEDGE" Sep-18 FUEL PRICE RISK MANAGEMENT POLICY REPORT Sep-18 (Office of Management and Budget 09/30/2018) The Fuel Price Risk Management Policy approved
HIPIOWA - IOWA COMPREHENSIVE HEALTH ASSOCIATION Unaudited Balance Sheet As of July 31
 Unaudited Balance Sheet As of July 31 Total Enrollment: 407 Assets: Cash $ 9,541,661 $ 1,237,950 Invested Cash 781,689 8,630,624 Premiums Receivable 16,445 299,134 Prepaid 32,930 34,403 Assessments Receivable
HIPIOWA - IOWA COMPREHENSIVE HEALTH ASSOCIATION Unaudited Balance Sheet As of January 31
 Unaudited Balance Sheet As of January 31 Total Enrollment: 371 Assets: Cash $ 1,408,868 $ 1,375,117 Invested Cash 4,664,286 4,136,167 Premiums Receivable 94,152 91,261 Prepaid 32,270 33,421 Assessments
2013 Triennial Customer Survey Results
 2013 Triennial Customer Survey Results Board of Directors May 1, 2014 Objectives Determine who our customers are Demographics Trip purpose Mode of access Frequency of use Reasons for riding Measure whether
Operating Budget. Third Quarter Financial Report (July 2005 March 2006)
") Third Quarter Financial Report (July 2005 March 2006) INDEX A. Executive Summary...page 2 B. Revenue and Expense Analysis...page 3 C. Budget Variance Reports...page 14 D. Ridership and Performance Measures...page
Third Quarter Financial Report (July 2005 March 2006) INDEX A. Executive Summary...page 2 B. Revenue and Expense Analysis...page 3 C. Budget Variance Reports...page 14 D. Ridership and Performance Measures...page
Portola Valley School District
 Portola Valley School District September 6, 2017 Board Presentation: Bond Program Overview & Illustrative 2018 Bond Measure Keygent LLC 999 N. Sepulveda Blvd., Ste. 500 El Segundo, CA 90245 (310) 322 4222
February 2016 Financial Report
 2016 February 2016 Financial Report Capital Metropolitan Transportation Authority 4/13/2016 Table of Contents SUMMARY REPORT Budgetary Performance - Revenue 2 - Sales Tax Revenue 5 - Operating Expenses
3/25/2008 EMPLOYMENT TRENDS IN ILLINOIS. Nonfarm Employment Change in Nonfarm Employment by Decade
 Voices for Illinois Children Symposium, March 28, 28 Paul Kleppner, Ph.D. Office for Social Policy Research Northern Illinois University EMPLOYMENT TRENDS IN ILLINOIS 7 Nonfarm Employment 195-27 6 ployees
Financial & Business Highlights For the Year Ended June 30, 2017
 Financial & Business Highlights For the Year Ended June, 17 17 16 15 14 13 12 Profit and Loss Account Operating Revenue 858 590 648 415 172 174 Investment gains net 5 162 909 825 322 516 Other 262 146
Spheria Australian Smaller Companies Fund
 29-Jun-18 $ 2.7686 $ 2.7603 $ 2.7520 28-Jun-18 $ 2.7764 $ 2.7681 $ 2.7598 27-Jun-18 $ 2.7804 $ 2.7721 $ 2.7638 26-Jun-18 $ 2.7857 $ 2.7774 $ 2.7690 25-Jun-18 $ 2.7931 $ 2.7848 $ 2.7764 22-Jun-18 $ 2.7771
THE B E A CH TO WN S O F P ALM B EA CH
 THE B E A CH TO WN S O F P ALM B EA CH C OU N T Y F LO R I D A August www.luxuryhomemarketing.com PALM BEACH TOWNS SINGLE-FAMILY HOMES LUXURY INVENTORY VS. SALES JULY Sales Luxury Benchmark Price : 7,
August 31, 2016 Financial Report
 August 31, 2016 Financial Report Capital Metropolitan Transportation Authority 10/14/2016 Table of Contents SUMMARY REPORTS Budgetary Performance - Revenue 2 - Sales Tax Revenue 6 - Operating Expenses
Operating Budget Stability
 Operating Budget Stability March Financial Update Report to Agenda Executive Summary March Performance Against FY16 Budget March Performance Against Same Period Last Year Appendix Financial Detail: March
Title VI Fare Equity Analysis
 Pioneer Valley Transit Authority Title VI Fare Equity Analysis Prepared by the Pioneer Valley Planning Commission April 12, 2012 PVTA TITLE VI FARE EQUITY ANALYSIS APRIL 12, 2012 1. CONFORMANCE WITH REGULATORY
TERMS OF REFERENCE FOR THE INVESTMENT COMMITTEE
 I. PURPOSE The purpose of the Investment Committee (the Committee ) is to recommend to the Board the investment policy, including the asset mix policy and the appropriate benchmark for both ICBC and any
MEDICAID FEDERAL SHARE OF MATCHING FUNDS
 MEDICAID FEDERAL SHARE OF MATCHING FUNDS revised by EDR based on FFIS Estimated for FFY 2019 August 3, 2017 Effective State Budget Year State adopted February 2017 State State FY real Difference in state
USA TODAY NETWORK TOPLINE METRICS REPORT: DECEMBER 2016
 USA TODAY NETWORK TOPLINE METRICS REPORT: DECEMBER 2016 USA TODAY NETWORK Total Digital Audience USA TODAY NETWORK Community Markets (USCP) USAT Sites 106.4 million monthly unique visitors 36.0 million
Isle Of Wight half year business confidence report
 half year business confidence report half year report contents new company registrations closed companies (dissolved) net company growth uk company share director age director gender naming trends sic
WESTWOOD LUTHERAN CHURCH Summary Financial Statement YEAR TO DATE - February 28, Over(Under) Budget WECC Fund Actual Budget
 Budget WECC Fund Actual Budget") WESTWOOD LUTHERAN CHURCH Summary Financial Statement YEAR TO DATE - February 28, 2018 General Fund Actual A B C D E F WECC Fund Actual Revenue Revenue - Faith Giving 1 $ 213 $ 234 $ (22) - Tuition $ 226
WESTWOOD LUTHERAN CHURCH Summary Financial Statement YEAR TO DATE - February 28, 2018 General Fund Actual A B C D E F WECC Fund Actual Revenue Revenue - Faith Giving 1 $ 213 $ 234 $ (22) - Tuition $ 226
FOR RELEASE: MONDAY, MARCH 21 AT 4 PM
 Interviews with 1,012 adult Americans conducted by telephone by Opinion Research Corporation on March 18-20, 2011. The margin of sampling error for results based on the total sample is plus or minus 3
FUEL PRICE RISK MANAGEMENT POLICY REPORT "FUEL HEDGE"
 FUEL PRICE RISK MANAGEMENT POLICY REPORT "FUEL HEDGE" December 2018 FUEL PRICE RISK MANAGEMENT POLICY REPORT December 2018 The Fuel Price Risk Management Policy approved by the Board on February 16, 2006
11 May Report.xls Office of Budget & Fiscal Planning
 Education and General Fund Actual Revenues and s by Month MTD YTD Change Revenue Jul Aug Sep Oct Nov Dec Jan Feb Mar Apr May Jun Per 14 Total over FY06 Enrollment Fees $ 8,211 $ 219 $ 41,952 ($ 818) $
Health Insurance and Children s Well-Being
 Health Insurance and Children s Well-Being Thomas DeLeire University of Wisconsin-Madison Presentation at the IRP Child Health and Well-Being Conference, October 12, 2010 1 What Do We Know? What Do We
Economic and Revenue Outlook: June 2014
 Economic and Revenue Outlook: June 2014 May 28 th, 2014 Oregon Office of Economic Analysis Mark McMullen Josh Lehner Economic Overview 2 Strong Job Growth Recently 3.5% Oregon Employment Growth 6 Month
Memorandum. May 28, Mr. Ken Bleiwas Office of the State Comptroller 59 Maiden Lane, 29 th Floor New York, New York Dear Mr.
 Memorandum State of New York May 28, 2014 Mr. Ken Bleiwas Office of the State Comptroller 59 Maiden Lane, 29 th Floor New York, New York 10038 Dear Mr. Bleiwas, This represents the MTA s First Quarter,
PSRS/PEERS Update April 2018
 PSRS/PEERS Update April 2018 1 Quick Facts PSRS/PEERS benefit is an important source of financial security for members and retirees. PSRS/PEERS Quick Facts: Over 260,000 active, inactive, retirees and
Michigan s January Unemployment Rate Moves Up Seasonally
 Labor Market News Michigan s March 2016 Vol. 72, Issue No. 1 Percent Michigan s January Unemployment Rate Moves Up Seasonally Michigan s unemployment rate (not seasonally adjusted) increased by 0.6 of
Income inequality and mobility in Australia over the last decade
 Income inequality and mobility in Australia over the last decade Roger Wilkins Meeting of National Economic Research Organisations, OECD Headquarters, 18 June 2012 1993-94 1994-95 1995-96 1996-97 1997-98
Revenue Estimating Conference Tobacco Tax and Surcharge Executive Summary
 Revenue Estimating Conference Tobacco Tax and Surcharge Executive Summary February 12, 2014 The Revenue Estimating Conference reviewed Tobacco Tax and Surcharge revenues on February 12, 2014. The forecasts
METRO. Fiscal Year 2012 Monthly Board Report. December 2011 (First Quarter Fiscal Year-to-Date)
") METRO Fiscal Year 2012 Monthly Board Report Revenue Expense Ridership Performance (First Quarter Fiscal Year-to-Date) 1/27/2012 Table of Contents Section A Section B Section C Section D Section E Section
METRO Fiscal Year 2012 Monthly Board Report Revenue Expense Ridership Performance (First Quarter Fiscal Year-to-Date) 1/27/2012 Table of Contents Section A Section B Section C Section D Section E Section
Westshore Circulator Study. Westshore Alliance Transportation Committee Meeting
 Westshore Circulator Study Westshore Alliance Transportation Committee Meeting November 14, 2012 Agenda Study Purpose Existing Conditions Analysis Needs Assessment Implementation Plan Study Purpose Explore
Fiscal Year 2018 Project 1 Annual Budget
 Fiscal Year 2018 Project 1 Annual Budget Table of Contents Table Page Summary 3 Summary of Costs Table 1 4 Treasury Related Expenses Table 2 5 Summary of Full Time Equivalent Table 3 6 Positions Cost-to-Cash
Valley Metro Fiscal Year 2014 Financial Results. Budget and Finance Subcommittee October 9, 2014
 Valley Metro Fiscal Year 2014 Financial Results Budget and Finance Subcommittee October 9, 2014 Regional Fixed Route Bus Ridership 3-Year Comparison Regional Fixed Route Bus Average Daily Ridership Light
Cabrillo College ACA Overview. May 2015
 Cabrillo College ACA Overview May 2015 PURPOSE OF HEALTH CARE REFORM Improve access to healthcare Require health insurance Larger employers must offer comprehensive, affordable coverage Create healthcare
Factor Leave Accruals. Accruing Vacation and Sick Leave
 Factor Leave Accruals Accruing Vacation and Sick Leave Factor Leave Accruals As part of the transition of non-exempt employees to biweekly pay, the UC Office of the President also requires standardization
U.S. and New England Economic Conditions and Outlook
 U.S. and New England Economic Conditions and Outlook Yolanda Kodrzycki Senior Economist and Policy Advisor charts prepared by Ana Patricia Muñoz presented to New England Board of Higher Education conference
Review of Registered Charites Compliance Rates with Annual Reporting Requirements 2016
 Review of Registered Charites Compliance Rates with Annual Reporting Requirements 2016 October 2017 The Charities Regulator, in accordance with the provisions of section 14 of the Charities Act 2009, carried
Executive Summary. July 17, 2015
 Executive Summary July 17, 2015 The Revenue Estimating Conference adopted interest rates for use in the state budgeting process. The adopted interest rates take into consideration current benchmark rates
Algo Trading System RTM
 Year Return 2016 15,17% 2015 29,57% 2014 18,57% 2013 15,64% 2012 13,97% 2011 55,41% 2010 50,98% 2009 48,29% Algo Trading System RTM 89000 79000 69000 59000 49000 39000 29000 19000 9000 2-Jan-09 2-Jan-10
Current Employment Statistics
 Current Employment Statistics December 2017 If you have any questions or seek additional information, please contact: Vermont Department of Labor Economic and Labor Market Information Division 802-828-4202
Performance Report October 2018
 Structured Investments Indicative Report October 2018 This report illustrates the indicative performance of all Structured Investment Strategies from inception to 31 October 2018 Matured Investment Strategies
HUD NSP-1 Reporting Apr 2010 Grantee Report - New Mexico State Program
 HUD NSP-1 Reporting Apr 2010 Grantee Report - State Program State Program NSP-1 Grant Amount is $19,600,000 $9,355,381 (47.7%) has been committed $4,010,874 (20.5%) has been expended Grant Number HUD Region
General Fund Revenue
 Millions Percent of Kathy Steinert, Director of Fiscal Services Phone: 541.923.8927 145 SE Salmon Ave Redmond, OR 97756 kathy.steinert@redmond.k12.or.us Date: May 23, 2014 To: Redmond School District Board
STRUCTURED INVESTMENT PERFORMANCE UPDATE 3 Years Bonus Enhanced Structured Equity Linked Investment Series 1
 STRUCTURED INVESTMENT PERFORMANCE UPDATE 3 Years Bonus Enhanced Structured Equity Linked Investment Series 1 Report as at: 30Jun16 The product is closed for subscription. This is an interim update and
Economic Outlook: Grand Strand Economy
 Economic Outlook: Grand Strand Economy 20 th Annual Economic Growth and Real Estate Summit Pine Lakes Country Club, September 29, 2017 Robert F. Salvino, Ph.D. E. Craig Wall Sr. College of Business Coastal
The Health of Jefferson County: 2010 Demographic Update
 The Health of : 2010 Demographic Update BACKGROUND How people live the sociodemographic context of their lives influences their health. People who have lower incomes may not have the resources to meet
FY2014 Operating Budget Performance Report
 Finance & Administration Committee Information Item IV-C September 11, 2014 FY2014 Operating Budget Performance Report Washington Metropolitan Area Transit Authority Board Action/Information Summary Action
Financial Report for the Month of SEPTEMBER
 WILLOUGHBY, OH Financial Report for the Month of SEPTEMBER Month Ended SEPTEMBER 30, 2013 BOARD OF EDUCATION Mrs. Margaret Warner, President SUPERINTENDENT Mr. Steve Thompson Mrs. Sharon Scott, Vice President
BUDGETWATCH October 2018 Flash Report
 October 2018 Flash Report Overall Latest Condition (reporting on operations through September and subsidies through October): Passenger Revenues were slightly below the Forecast in September, marginally
Review of Membership Developments
 RIPE Network Coordination Centre Review of Membership Developments 7 October 2009/ GM / Lisbon http://www.ripe.net 1 Applications development RIPE Network Coordination Centre 140 120 100 80 60 2007 2008
Fare Policy. Discussion Document November 23, 2015
 Fare Policy Discussion Document November 23, 2015 Key legislation regarding fare levels 2013 Session Law Chapter 46 SECTION 6A. Set goal of an increase in the farebox recovery ratio of at least 10 per
METRO MONTHLY BOARD REPORT
 METRO Revenue Expenses Service Performance Fiscal Year FY2011 Table of Contents Section A Section B Section C Section D Section E Section F Section G Section H Summary Sales Tax Revenue Fare Revenue Operating
The Economic Backdrop When will this cycle end?
 The Economic Backdrop When will this cycle end? How far are we into the current economic expansion? Current expansion in 8 th year; 4 th longest since 1960 Length of economic expansions (months) Apr-91-Feb-01
December 10, Butler School District 53 1
 December 10, 2018 Butler School District 53 1 Key Terms Aggregate Levy annual corporate levy other than debt service Debt Service Levy made to retire the principal or pay interest on bonds Property Tax
METRO. Fiscal Year 2012 Monthly Board Report. September 2012 (Fourth Quarter Fiscal Year-to-Date)
") METRO Fiscal Year 2012 Monthly Board Report Revenue Expense Ridership Performance (Fourth Quarter Fiscal Year-to-Date) This report is based on a preliminary closing of the year-end financials for FY2012
METRO Fiscal Year 2012 Monthly Board Report Revenue Expense Ridership Performance (Fourth Quarter Fiscal Year-to-Date) This report is based on a preliminary closing of the year-end financials for FY2012
RTD Pass Program Portfolio: The Current State. An Overview of RTD Pass Programs June 6, 2017
 RTD Pass Program Portfolio: The Current State An Overview of RTD Pass Programs June 6, 2017 Outline 1. The Budget 2. Pass Programs By The Numbers 3. Equity The Budget How fare revenue and pass programs
Operating Budget. Second Quarter Financial Report
 Second Quarter Financial Report INDEX A. Executive Summary... A-1 B. Revenue and Expense Analysis... B-1 C. Budget Variance Reports... C-1 D. Ridership and Performance Measures... D-1 Board Budget Committee
Title VI Approval of Major Service Change, Disparate Impact and Disproportionate Burden
 Customer Service and Operations Committee Board Action Item III-A October 10, 2013 Title VI Approval of Major Service Change, Disparate Impact and Disproportionate Burden Page 3 of 42 Washington Metropolitan
RTD Pass Program Portfolio: The Current State. An Overview of RTD Pass Programs June 6, 2017
 RTD Pass Program Portfolio: The Current State An Overview of RTD Pass Programs June 6, 2017 Outline 1. The Budget 2. Pass Programs By The Numbers 3. Equity The Budget How fare revenue and pass programs
NEWS RELEASE. R&I Upgrades to AA-/a-1+, Stable: Mitsui Fudosan Co., Ltd.
 R&I Upgrades to AA-/a-1+, Stable: Mitsui Fudosan Co., Ltd. Jun 13, 2018 Rating and Investment Information, Inc. (R&I) has announced the following: ISSUER: RATIONALE: Mitsui Fudosan Co., Ltd. Issuer Rating:
NEVADA SUB-STATE LABOR MARKET OVERVIEW. October 2018
 RESEARCH AND ANALYSIS BUREAU BRIAN SANDOVAL GOVERNOR DON SODERBERG DIRECTOR DAVID SCHMIDT CHIEF ECONOMIST NEVADA SUB-STATE LABOR MARKET OVERVIEW October 2018 Statewide, seasonally adjusted employment increased
ONBOARD ORIGIN-DESTINATION STUDY
 REPORT ONBOARD ORIGIN-DESTINATION STUDY 12.23.2014 PREPARED FOR: ANCHORAGE METROPOLITAN AREA TRANSPORTATION SYSTEM (AMATS) 55 Railroad Row White River Junction, VT 05001 802.295.4999 www.rsginc.com SUBMITTED
Business & Financial Services December 2017
 Business & Financial Services December 217 Completed Procurement Transactions by Month 2 4 175 15 125 1 75 5 2 1 Business Days to Complete 25 Jan Feb Mar Apr May Jun Jul Aug Sep Oct Nov Dec 217 Procurement
METRO. Fiscal Year 2013 Monthly Board Report. November 2012
 METRO Fiscal Year 2013 Monthly Board Report Revenue Expense Ridership Performance 12/13/2012 Table of Contents Section A Section B Section C Section D Section E Section F Section G Section H Section I
Votran Transit Development Plan (TDP) River To Sea TPO Committees September 2016
 River To Sea TPO Committees September 2016") Votran Transit Development Plan (TDP) River To Sea TPO Committees September 2016 Agenda What is a TDP? Baseline Conditions Public Involvement Peer and Trend Review Situation Appraisal Goals Proposed Alternatives
Votran Transit Development Plan (TDP) River To Sea TPO Committees September 2016 Agenda What is a TDP? Baseline Conditions Public Involvement Peer and Trend Review Situation Appraisal Goals Proposed Alternatives
April 30, 2016 Financial Report
 2016 April 30, 2016 Financial Report Capital Metropolitan Transportation Authority 6/15/2016 Table of Contents SUMMARY REPORT Budgetary Performance - Revenue 2 - Sales Tax Revenue 6 - Operating Expenses
Singapore Exchange Limited Building Tomorrow s Market, Today
 Singapore Exchange Limited Building Tomorrow s Market, Today Singapore Exchange SGX: Building Tomorrow s Market, Today SGX: Our Fundamentals FY2002 Half Year Results Going Forward SGX: Building Tomorrow
Using projections to manage your programs
 Using projections to manage your programs To project total provider reimbursements To do what ifs based on caseloads or other metrics To project amounts of admin & support available for spending Based
Big Walnut Local School District
 Big Walnut Local School District Monthly Financial Report for the month ended September 30, 2012 Prepared By: Felicia Drummey Treasurer BIG WALNUT LOCAL SCHOOL DISTRICT SUMMARY OF YEAR-TO-DATE FINANCIAL
Strategic Benefits Consulting Services Contract. Administrative Committee Cheryl D. Orr, Vice President of Human Capital August 14, 2018
 Strategic Benefits Consulting Services Contract Administrative Committee Cheryl D. Orr, Vice President of Human Capital August 14, 2018 0 DART s Vision for Healthcare Benefits To create a sustainable benefits
Dulles Corridor Enterprise Financial Update Dulles Corridor Advisory Committee Meeting
 Dulles Corridor Enterprise Financial Update Dulles Corridor Advisory Committee Meeting May 30, 2014 Discussion Outline Finance Plan for the Metrorail Project Allocation of Estimated Capital Costs and TIFIA