PSRS/PEERS Update April 2018
|
|
|
- Bennett Gilbert
- 5 years ago
- Views:
Transcription

1 PSRS/PEERS Update April

2 Quick Facts PSRS/PEERS benefit is an important source of financial security for members and retirees. PSRS/PEERS Quick Facts: Over 260,000 active, inactive, retirees and beneficiaries $41.5 billion in invested assets as of June 30, 2017 For the year ended June 30, 2017, PSRS/PEERS paid more than $2.7 billion in benefits to over 88,600 retirees and beneficiaries As of June 30, 2017, 83.98% actuarially pre-funded for PSRS; 85.81% actuarially pre-funded for PEERS FY 2017 investment return of 12.48% 43 rd largest public pension plan in the nation, 95 th largest institutional investor in the world 2

3 3

4 PSRS/PEERS: Major Economic Impact Of the more than 91,000 individuals receiving benefits from PSRS/PEERS, approximately 88% of them live in Missouri. As of December 31, 2017, total benefit payments were more than $2.7 billion. Of this amount, more than $2.4 billion was distributed among Missouri s 114 counties, positively impacting the state s economy. See PSRS/PEERS website for an interac>ve map on Missouri s coun>es. 4
5 PSRS/PEERS Goals To provide retirement security to Missouri s educators and education employees after a full career of service. To help school districts attract and retain the best and brightest educators and employees for Missouri s school children. To manage the Systems in a prudent and cost-efficient manner. 5

6 6
7 FUNDING COMPONENTS 7
8 Funding Components Investment Earnings Funding Sources Asset Liability Comparison Assumed Rate of Return PSRS Contributions Rising Contribu>on Rates Statutory Limits Benefits Legal Considera>ons COLA Statutory Flexibility Tier II Plan Design 8
9 Pension Funding Components FY B FY B Impact of 1% (PSRS/PEERS) Investment Returns Contribu>on Rate COLA (1 year) $414.8 million $62.2 million $27.2 million FY M FY B 9

10 Investment Earnings Funding Sources The PSRS/PEERS Dollar: Pensions are a shared responsibility Every dollar paid to PSRS/PEERS retirees and beneficiaries comes from three sources: * * 20-year average is as of June 30,
 was distributed to Missouri residents.")
11 * *Over 85% of the benefit paid (approx. $27.7 B) was distributed to Missouri residents. 11

12 PSRS Pre- Funded History (106%) (104%) (105%) (106%) 110% 100% 90% 80% 70% 60% 50% 40% 56.00% 50.00% 60.00% 70.00% 80.00% 80.00% 93.00% % 99.40% 95.30% 81.10% 82.00% 82.70% 82.60% 83.50% 83.40% 79.90% 77.70% 85.50% 81.50% 80.10% 82.80% 83.90% 84.80% 84.00% 30% 20% 10% 0% 16.00% 28.00% 30.00% 12

13 Investment Returns As of June 30, 2017, the annualized fund performance was 12.48% In FY 2017, there was approximately $4.7 billion in investment earnings. Investment earnings have been approximately $16 billion over the last five years Fiscal Year return: 1.8% 2015 Fiscal Year return: 4.5% 2014 Fiscal Year return: 16.9% 2013 Fiscal Year return: 12.6% PSRS/PEERS closed FY 2017 with actuarial pre-funded ratios of 83.98% and 85.81%, respectively. PSRS/PEERS investment returns for FY 2017 are close to median relative to peer universe of public plans above $1 billion. Investment returns continue to be above median relative to other public pension plans for every time period over the past seven years. The Systems exhibit a lower risk profile than two-thirds of the peer group. The long-term (25-30 year) returns for PSRS/PEERS are above 7.6%. 13
14 PSRS Asset-Liability Comparison 50,000,000 45,000,000 40,000,000 35,000,000 30,000,000 25,000,000 20,000,000 15,000,000 10,000,000 5,000, Mar- 09 Jun- 09 Jun- 10 Jun- 11 Jun- 12 Jun- 13 Jun- 14 Jun- 15 Jun- 16 Jun- 17 Jun- 18 Actuarial Accrued Liability Market Value 14
15 PSRS Contribution Rate History The law limits any change in contribution rates to 1.0% per year (.5% each to the member and the employer) 14.5% (29% total) effective July 1, % 14.0% 13.0% 12.0% 11.0% 10.0% 9.0% 8.0% 7.0% 6.0% 5.0% 4.0% 3.0% PSRS Contribu9on Rates Contribution rates increased (despite long-term investment returns above 8%) primarily due to benefit increases 14.5% since July 1,

16 16
17 Non-Social Security Public Retirement Systems (As of FY16) Source: NASRA, Public Fund Survey 17
18 PSRS Contribution Rate Compared to Other Public Funds According to the Public Fund Survey for FY 2016 for plans that do not contribute to Social Security: The average employee contribution rate is 8.93% The average employer contribution rate is 19.94% The average total contribution rate is 29.15% While the total contribution rate is in line with other funds, PSRS employee contribution rate is the highest of the plans surveyed. PSRS/PEERS are relatively unique in that employee and employer contributions are split 50/50. 18
19 COLA REVIEW 19
20 Cost of Living Statutory Flexibility Missouri statute provides the PSRS/PEERS Board of Trustees some discretion when setting annual benefit increases. Section Provides: An increase in benefits the 2nd January following retirement An increase in benefits if the cost-of-living (COLA) increase is at least 2% A maximum 5% annual cost of living adjustment (COLA) 80% lifetime COLA cap Change in Consumer Price Index (CPI- U) Minimum Adjustment Maximum Adjustment <0% 0% 0% 0%- 2% 0% 5% 2%- 5% 2% 5% >5% 5% 5% 20
21 COLA Discussion History Throughout the Spring/Summer 2016 the PSRS/PEERS Board worked with staff and consultants to identify various COLA scenarios and parameters within the stated goals The Board requested analysis on all scenarios at the following assumed rates of investment return: 7.75%, 7.6%, 7.5%, and 7.25% The Board then requested that the Systems actuaries, PricewaterhouseCoopers (PwC), calculate the 2017 actuarial valuation with these different COLA scenarios and assumptions 21
22 Board Goals for COLA Provide for the security and financial stability of the Systems, which includes: Maintaining an 80% pre-funded ratio Allowing for a reasonable assumed rate of return given capital market projections Maintain the contribution rates of both Systems at or below current levels Maintain retiree purchasing power by providing a consistent cost-of-living adjustment for PSRS/PEERS retirees Cost of living increase should be dependable and affordable without harming the financial stability of the Systems Requires no statutory, legislative action or change 22
23 PSRS Board Meeting November 3, 2017 PwC presented the results of the June 30, 2017 actuarial valuations for the systems Contribution Rates : Board voted to keep the contribution rates at PSRS (29%) and PEERS (13.72%) Based on the information presented by PwC from the working session and Board meeting the Board reviewed the current funding policy assumptions: Assumed Rate of Return lowered from 7.75% to 7.6% COLA Policy -changed to current COLA assumption effective with the January 2019 COLA and granted a one-time COLA for January
24 COLA POLICY Effective January 1, 2018, eligible benefit recipients received a one-time 1.63% COLA, which was equal to the CPI-U for fiscal year Raw CPI-U Index values Index Value Jun month to-date Jul % Aug % Sep % Oct % Nov % Dec % Jan % Feb % Mar % Apr % May % Jun % 24
25 COLA POLICY Effective with the January 2019 COLA the policy will be: 2% COLA for eligible retirees when CPI-U is between 0%-2% and cumulatively 2% or more, CPI-U between 2-5% = 2% COLA, CPI-U 5% or more = 5% COLA 2017 Board Approved Funding Policy Effective for January 1, 2019 COLA CPI - U COLA per Board Approved Funding Policy Less than 0.0% 0.0% 0.0%-2.0% 0.0%-2.0% 0.0% when CPI-U is cumulatively below 2.0% 2.0% when CPI-U cumulatively reaches 2.0% or more* 2.0%-5.0% 2.0% Over 5.0% 5.0% * Resets cumulative calculation after a COLA is provided 25
26 CPI- U Calcula>on FY In the United States, the Bureau of Labor Sta>s>cs publishes the Consumer Price Index- Urban (CPI- U) every month CPI- U is >me period dependent The PSRS/PEERS regula>on requires that the >me period for the calcula>on be from July 1 to June 30. CPI- U is 1.65% through February 28, 2018 CPI- U CumulaUve is 1.65% Raw CPI-U Index values Index Value Jun month to-date Jul % Aug % Sep % Oct % Nov % Dec % Jan % Feb % Mar-18 Apr-18 May-18 Jun-18 26
27 CHALLENGES 27

28 Challenges and Threats Economic Overall Economic Reality Federal Budget Deficit Growing Level of Debt Investment Challenges Market short-term outlook Potential Funding Challenges Actuarial Challenges Investment Returns Mortality 28
29 Yield to Maturity: U.S. Bond Index Over Decades %: 10.9% annualized %: 8.8% annualized %: 6.0% annualized 42.4%: 3.6% annualized Feb- 78 Feb- 79 Feb- 80 Feb- 81 Feb- 82 Feb- 83 Feb- 84 Feb- 85 Feb- 86 Feb- 87 Feb- 88 Feb- 89 Feb- 90 Feb- 91 Feb- 92 Feb- 93 Feb- 94 Feb- 95 Feb- 96 Feb- 97 Feb- 98 Feb- 99 Feb- 00 Feb- 01 Feb- 02 Feb- 03 Feb- 04 Feb- 05 Feb- 06 Feb- 07 Feb- 08 Feb- 09 Feb- 10 Feb- 11 Feb- 12 Feb- 13 Feb- 14 Feb- 15 Feb- 16 Feb- 17 Feb
30 Mortality People are living longer mortality rising across the nation Impact of changing mortality assumptions for the Systems are significant Total financial impact in 2016: Actuarial Accrued Liability Funded Status Actuarially Determined Contribu9on Rate Example: $2.03 B % 3.57% 55 year old female PSRS Service Re9ree: Life Expectancy prior to 2016: 80.6 years of age Life Expectancy since 2016: 83.3 years of age Thus, based on the current mortality assump>on, a 55 year old female PSRS service re>ree is expected to live approximately 32 months longer, or receive benefits for 32 addi>onal months Based on the PSRS average month benefit amount of $3,239, this member would receive an addi>onal $103,648 in total benefit payments 30
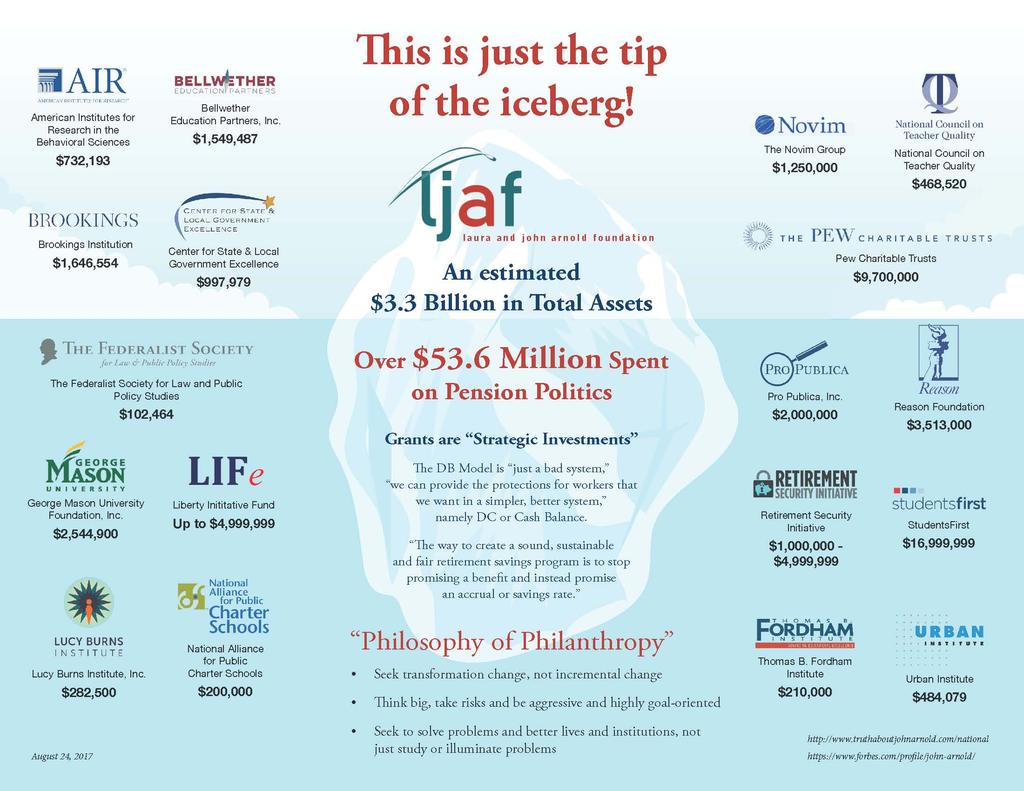
 Pension Envy Think Tanks Manhattan Institute National Council on Teacher Quality Pew Center for the")
31 Political Other Challenges and Threats Mandatory Social Security Defined Benefit (DB) vs. Defined Contribution (DC) Pension Envy Think Tanks Manhattan Institute National Council on Teacher Quality Pew Center for the States/Laura and John Arnold Foundation Show-Me Institute 31
32 32
33 QUESTIONS? 33
XML Publisher Balance Sheet Vision Operations (USA) Feb-02
 Feb-02") Page:1 Apr-01 May-01 Jun-01 Jul-01 ASSETS Current Assets Cash and Short Term Investments 15,862,304 51,998,607 9,198,226 Accounts Receivable - Net of Allowance 2,560,786
Page:1 Apr-01 May-01 Jun-01 Jul-01 ASSETS Current Assets Cash and Short Term Investments 15,862,304 51,998,607 9,198,226 Accounts Receivable - Net of Allowance 2,560,786
Review of Membership Developments
 RIPE Network Coordination Centre Review of Membership Developments 7 October 2009/ GM / Lisbon http://www.ripe.net 1 Applications development RIPE Network Coordination Centre 140 120 100 80 60 2007 2008
Financial Report. Prepared for presentation to the Board of Trustees. March 15, 2018
 Financial Report Prepared for presentation to the Board of Trustees March 15, 2018 AGENDA 1. Hospital Financial Performance 2. Pension Cost Shift 3. Operating Pool and Endowment 2 H O S P I T A L F I N
Financial & Business Highlights For the Year Ended June 30, 2017
 Financial & Business Highlights For the Year Ended June, 17 17 16 15 14 13 12 Profit and Loss Account Operating Revenue 858 590 648 415 172 174 Investment gains net 5 162 909 825 322 516 Other 262 146
HUD NSP-1 Reporting Apr 2010 Grantee Report - New Mexico State Program
 HUD NSP-1 Reporting Apr 2010 Grantee Report - State Program State Program NSP-1 Grant Amount is $19,600,000 $9,355,381 (47.7%) has been committed $4,010,874 (20.5%) has been expended Grant Number HUD Region
CalPERS Update and Path Forward
 CalPERS Update and Path Forward Kelly Fox, Chief, Stakeholder Relations December 13, 2017 League of California Cities Fire Chiefs Facts & Figures 2 CalPERS Retirement Benefits 3 3,000+ employers 4 Financial
The Irish Association of Pension Funds. Trustee Network Funding Proposals
 The Irish Association of Pension Funds Trustee Network Funding Proposals Funding Proposals Actuarial Perspective Gavin Howlin Willis INTRODUCTION The purpose of the presentation is to work through some
2/9/2018. Unemployment Southeastern State Comparison December 2017 Alabama 3.5% Southeast Avg 4.1%
 Alabama's Total Employment (In Thousands) 2,050 2,029 2,000 1,980 2,006 1,992 1,976 1,950 1,945 1,923 1,949 1,900 1,876 1,902 1,887 1,871 1,870 1,885 1,903 1,850 1,800 1,750 * *FY17 is Preliminary Data
Cost Estimation of a Manufacturing Company
 Cost Estimation of a Manufacturing Company Name: Business: Date: Economics of One Unit: Manufacturing Company (Only complete if you are making a product, such as a bracelet or beauty product) Economics
Review of Registered Charites Compliance Rates with Annual Reporting Requirements 2016
 Review of Registered Charites Compliance Rates with Annual Reporting Requirements 2016 October 2017 The Charities Regulator, in accordance with the provisions of section 14 of the Charities Act 2009, carried
Spheria Australian Smaller Companies Fund
 29-Jun-18 $ 2.7686 $ 2.7603 $ 2.7520 28-Jun-18 $ 2.7764 $ 2.7681 $ 2.7598 27-Jun-18 $ 2.7804 $ 2.7721 $ 2.7638 26-Jun-18 $ 2.7857 $ 2.7774 $ 2.7690 25-Jun-18 $ 2.7931 $ 2.7848 $ 2.7764 22-Jun-18 $ 2.7771
Big Walnut Local School District
 Big Walnut Local School District Monthly Financial Report for the month ended September 30, 2013 Prepared By: Felicia Drummey Treasurer BIG WALNUT LOCAL SCHOOL DISTRICT SUMMARY OF YEAR TO DATE FINANCIAL
SELF-FUNDED PPO HEALTH PLAN RATE REQUIREMENTS RETIREES JANUARY 1, 2017 DECEMBER 31, 2017 COUNTY OF ORANGE JUNE 2016
 SELF-FUNDED PPO HEALTH PLAN RATE REQUIREMENTS RETIREES JANUARY 1, 2017 DECEMBER 31, 2017 COUNTY OF ORANGE JUNE 2016 Page 1 of 12 CONTENTS 1. Introduction...1 2. Rate Adjustment...2 3. Reserve Fund...4
SELF-FUNDED PPO HEALTH PLAN RATE REQUIREMENTS RETIREES JANUARY 1, 2018 DECEMBER 31, 2018 COUNTY OF ORANGE JUNE 2017
 SELF-FUNDED PPO HEALTH PLAN RATE REQUIREMENTS RETIREES JANUARY 1, 2018 DECEMBER 31, 2018 COUNTY OF ORANGE JUNE 2017 Page 1 of 12 COUNTY OF ORANGE CONTENTS 1. Introduction...3 2. Rate Adjustment...4 3.
Re: Public Education Employee Retirement System of Missouri ("PEERS") Cost Estimate of Proposed Benefit Changes
 Cost Estimate of Proposed Benefit Changes") January 22, 2013 Mr. M. Steve Yoakum Executive Director PSRS and PEERS of Missouri 3210 West Truman Blvd. Jefferson City, MO 65109 Re: Public Education Employee Retirement System of Missouri ("PEERS")
January 22, 2013 Mr. M. Steve Yoakum Executive Director PSRS and PEERS of Missouri 3210 West Truman Blvd. Jefferson City, MO 65109 Re: Public Education Employee Retirement System of Missouri ("PEERS")
eircom Main Superannuation Fund Case Study (Part 2) Fund De Risking Jim Foley, Group Pensions Director, eircom Ltd
 Fund De Risking Jim Foley, Group Pensions Director, eircom Ltd") eircom Main Superannuation Fund Case Study (Part 2) Fund De Risking Jim Foley, Group Pensions Director, eircom Ltd 2010 Case Study Deficit Remediation through Industrial Relations Agreement Industrial
eircom Main Superannuation Fund Case Study (Part 2) Fund De Risking Jim Foley, Group Pensions Director, eircom Ltd 2010 Case Study Deficit Remediation through Industrial Relations Agreement Industrial
Big Walnut Local School District
 Big Walnut Local School District Monthly Financial Report for the month ended September 30, 2012 Prepared By: Felicia Drummey Treasurer BIG WALNUT LOCAL SCHOOL DISTRICT SUMMARY OF YEAR-TO-DATE FINANCIAL
Teachers Retirement: Policy, Sustainability, & Maximizing the System for Supporting Education in Georgia
 Teachers Retirement: Policy, Sustainability, & Maximizing the System for Supporting Education in Georgia Georgia Association of Educational Leaders July 10, 2018 1943 2018 Recognizing 75 Years of Retirement
WESTWOOD LUTHERAN CHURCH Summary Financial Statement YEAR TO DATE - February 28, Over(Under) Budget WECC Fund Actual Budget
 Budget WECC Fund Actual Budget") WESTWOOD LUTHERAN CHURCH Summary Financial Statement YEAR TO DATE - February 28, 2018 General Fund Actual A B C D E F WECC Fund Actual Revenue Revenue - Faith Giving 1 $ 213 $ 234 $ (22) - Tuition $ 226
WESTWOOD LUTHERAN CHURCH Summary Financial Statement YEAR TO DATE - February 28, 2018 General Fund Actual A B C D E F WECC Fund Actual Revenue Revenue - Faith Giving 1 $ 213 $ 234 $ (22) - Tuition $ 226
Re: Public Education Employee Retirement System of Missouri ("PEERS") Cost Estimate of Proposed Benefit Changes
 Cost Estimate of Proposed Benefit Changes") January 22, 2013 Mr. M. Steve Yoakum Executive Director PSRS and PEERS of Missouri 3210 West Truman Blvd. Jefferson City, MO 65109 Re: Public Education Employee Retirement System of Missouri ("PEERS")
January 22, 2013 Mr. M. Steve Yoakum Executive Director PSRS and PEERS of Missouri 3210 West Truman Blvd. Jefferson City, MO 65109 Re: Public Education Employee Retirement System of Missouri ("PEERS")
Investor Presentation For the Six Months Ended September 30, 2006
 Investor Presentation For the Six Months Ended September 30, 2006 November 15, 2006 Information Development Co., Ltd 1 Today s Presentation 1. Performance Overview 2. Industry Trends and ID s Operating
This letter has been prepared pursuant to the engagement letter dated October 27, 2008, between
 February 20, 2013 Mr. M. Steve Yoakum Executive Director PSRS and PEERS of Missouri 3210 West Truman Blvd. Jefferson City, MO 65109 Re: Public School Retirement System of Missouri ("PSRS") Cost Estimate
Key IRS Interest Rates After PPA
 Key IRS Interest After PPA (updated upon release of figures in IRS Notice usually by the end of the first full business week of the month) Below are Tables I, II, and III showing official interest rates
Factor Leave Accruals. Accruing Vacation and Sick Leave
 Factor Leave Accruals Accruing Vacation and Sick Leave Factor Leave Accruals As part of the transition of non-exempt employees to biweekly pay, the UC Office of the President also requires standardization
OTHER DEPOSITS FINANCIAL INSTITUTIONS DEPOSIT BARKAT SAVING ACCOUNT
 WEIGHTAGES JAN FEB MAR APR MAY JUN JUL AUG SEPT OCT NOV DEC ANNOUNCEMENT DATE 19.Dez.14 27.Jän.15 24.Feb.15 26.Mär.15 27.Apr.15 26.Mai.15 25.Jun.15 28.Jul.15 26.Aug.15 23.Sep.15 27.Okt.15 25.Nov.15 MUDARIB
Executive Summary. July 17, 2015
 Executive Summary July 17, 2015 The Revenue Estimating Conference adopted interest rates for use in the state budgeting process. The adopted interest rates take into consideration current benchmark rates
2016 Spring Conference And Training Seminar. Cash Planning and Forecasting
 Cash Planning and Forecasting A different world! Cash forecasting starts with expectations about future flows Uses history to identify beginning balances.and to understand patterns of how things interact
South Carolina Retirement Systems update
 South Carolina Retirement Systems update Municipal Association of South Carolina Travis Turner, CPA February 1, 2017 S.C. Public Employee Benefit Authority (PEBA) PEBA was created on July 1, 2012, combining
PASSENGER REJECTION REDUCTION INITIATIVE KIRK PEREIRA. 24 th April 2018
 PASSENGER REJECTION REDUCTION INITIATIVE KIRK PEREIRA 24 th April 2018 WHAT IS THIS PROJECT ABOUT? Well we are not going into that again this year! Nearly everyone in this room knows about the project
Key IRS Interest Rates After PPA
 Key IRS Rates - After PPA - thru 2011 Page 1 of 10 Key IRS Interest Rates After PPA (updated upon release of figures in IRS Notice usually by the end of the first full business week of the month) Below
Unrestricted Cash / Board Designated Cash & Investments December 2014
 Unrestricted Cash / Board Designated Cash & Investments December 2014 25.0 20.0 21.0 20.8 18.9 19.9 15.0 10.0 11.5 12.8 11.6 9.1 10.4 9.8 11.1 10.2 9.8 17.0 16.8 15.4 14.7 14.2 14.1 13.6 13.0 12.0 10.2
Principal Household Members. Resources. Plan FAQ. Goals
 What Is My Plan? Prepared for Sample Family Nov 29, 2012 These are the Resources and Goals that have been included in your Goal Achievement Plan and are the basis for the analysis on the Can I Afford My
HIPIOWA - IOWA COMPREHENSIVE HEALTH ASSOCIATION Unaudited Balance Sheet As of July 31
 Unaudited Balance Sheet As of July 31 Total Enrollment: 407 Assets: Cash $ 9,541,661 $ 1,237,950 Invested Cash 781,689 8,630,624 Premiums Receivable 16,445 299,134 Prepaid 32,930 34,403 Assessments Receivable
HIPIOWA - IOWA COMPREHENSIVE HEALTH ASSOCIATION Unaudited Balance Sheet As of January 31
 Unaudited Balance Sheet As of January 31 Total Enrollment: 371 Assets: Cash $ 1,408,868 $ 1,375,117 Invested Cash 4,664,286 4,136,167 Premiums Receivable 94,152 91,261 Prepaid 32,270 33,421 Assessments
Performance Report October 2018
 Structured Investments Indicative Report October 2018 This report illustrates the indicative performance of all Structured Investment Strategies from inception to 31 October 2018 Matured Investment Strategies
Principal Civil Service Pension Scheme
 Principal Civil Service Pension Scheme Consultation on proposed increases to employee contribution rates effective from April 2014: Background and further information October 2013 THE CIVIL SERVICE PENSION
NORTH SYRACUSE CENTRAL SCHOOL DISTRICT. Fund Balance & Budget Assumptions December 4, 2017
 NORTH SYRACUSE CENTRAL SCHOOL DISTRICT Fund Balance & Budget Assumptions 2018-2019 December 4, 2017 1 AGENDA Fund Balance Reserves Economic Factors Revenue Assumptions Expenditure Assumptions Budget Timeline
THE B E A CH TO WN S O F P ALM B EA CH
 THE B E A CH TO WN S O F P ALM B EA CH C OU N T Y F LO R I D A August www.luxuryhomemarketing.com PALM BEACH TOWNS SINGLE-FAMILY HOMES LUXURY INVENTORY VS. SALES JULY Sales Luxury Benchmark Price : 7,
Corporate Accounting: Earnings and Distribution
 Chapter 20 Corporate Accounting: Earnings and Distribution Net income of a corporation and corporate income taxes Cash dividends Stock dividends Stock splits Appropriations of retained earnings Retained
Orange Unified School District
 Orange Unified School District Financing Information Ron Lebs Assistant Superintendent, Facilities and Planning Orange Unified School District Tel: 714.628.4500 rlebs@orangeusd.org Adam Bauer Chief Executive
Financial Accounting s Conceptual Foundations
 Economics /Management 4 Financial Accounting Financial Accounting s Conceptual Foundations L-2 A highly-stylized Information System Basic Functions (all info systems): 1. Collection of transactions data
TERMS OF REFERENCE FOR THE INVESTMENT COMMITTEE
 I. PURPOSE The purpose of the Investment Committee (the Committee ) is to recommend to the Board the investment policy, including the asset mix policy and the appropriate benchmark for both ICBC and any
Isle Of Wight half year business confidence report
 half year business confidence report half year report contents new company registrations closed companies (dissolved) net company growth uk company share director age director gender naming trends sic
General Fund Revenue
 Millions Percent of Kathy Steinert, Director of Fiscal Services Phone: 541.923.8927 145 SE Salmon Ave Redmond, OR 97756 kathy.steinert@redmond.k12.or.us Date: May 23, 2014 To: Redmond School District Board
Income inequality and mobility in Australia over the last decade
 Income inequality and mobility in Australia over the last decade Roger Wilkins Meeting of National Economic Research Organisations, OECD Headquarters, 18 June 2012 1993-94 1994-95 1995-96 1996-97 1997-98
May- 01. Jun- 01. Jul- 01. Aug- 01. System was established by the General Assembly in This system was designed specifically for law
 11400 DJIA beginning September 21, 2000 Will history repeat? 11000 10600 10200 9800 9400 9000 8600 8200 Sep- 00 Oct- 00 Nov- 00 Dec- 00 Jan- Feb- Law Enforcement Officers Pension System The Law Enforcement
What s new in LDI Expanding the toolkit
 Pensions Conference 2012 Steven Catchpole What s new in LDI Expanding the toolkit 1 June 2012 Introduction The LDI toolkit is expanding Several new tools are becoming more common: Swaptions Gilt total
City of Modesto Economic Indicators December 2014 Edition
 City of Modesto Economic Indicators December 2014 Edition Steve Christensen City of Modesto Economic Outlook: City of Modesto The City of Modesto continues to slowly recover from the Great Recession. Some
Division of Bond Finance Interest Rate Calculations. Revenue Estimating Conference Interest Rates Used for Appropriations, including PECO Bond Rates
 Division of Bond Finance Interest Rate Calculations Revenue Estimating Conference Interest Rates Used for Appropriations, including PECO Bond Rates November 16, 2018 Division of Bond Finance Calculation
Comparing Retirement Program Alternatives
 Comparing Retirement Program Alternatives Presenters: Moderator, Tina Leiss, Nevada Public Employees Retirement System Keith Brainard, National Association of State Retirement Administrators Barry Faison,
2018 Financial Management Classes
 2018 Financial Management Classes MONEY MANAGEMENT CLASS/BANKING OPERATONS (1ST & 3RD FRIDAY) INVESTING BASICS (2ND FRIDAY) CREDIT MANAGEMENT BLENDED RETIREMENT SYSTEM/THRIFT SAVINGS PLAN (4TH FRIDAY)
U.S. and Montana Economic Outlook
 U.S. and Montana Economic Outlook Patrick M. Barkey, Director Bureau of Business and Economic Research University of Montana Is the Story of the U.S. Economy Changing? Old Story Better growth next year
11 May Report.xls Office of Budget & Fiscal Planning
 Education and General Fund Actual Revenues and s by Month MTD YTD Change Revenue Jul Aug Sep Oct Nov Dec Jan Feb Mar Apr May Jun Per 14 Total over FY06 Enrollment Fees $ 8,211 $ 219 $ 41,952 ($ 818) $
BANK OF GUYANA. BANKING SYSTEM STATISTICAL ABSTRACT Website:
 BANK OF GUYANA BANKING SYSTEM STATISTICAL ABSTRACT Website: www.bankofguyana.org.gy RESEARCH DEPARTMENT November 2010 STATISTICAL ABSTRACT TABLES CONTENTS 1. MONETARY AUTHORITY 1.1 Bank of Guyana: Assets
FOR RELEASE: MONDAY, MARCH 21 AT 4 PM
 Interviews with 1,012 adult Americans conducted by telephone by Opinion Research Corporation on March 18-20, 2011. The margin of sampling error for results based on the total sample is plus or minus 3
FINANCIAL MANAGEMENT STRATEGY REPORT ON OUTCOMES FOR THE YEAR ENDED MARCH 31, 2016
 FINANCIAL MANAGEMENT STRATEGY REPORT ON OUTCOMES FOR THE YEAR ENDED MARCH 31, 2016 Manitoba Finance General Inquiries: Room 109, Legislative Building Winnipeg, Manitoba R3C 0V8 Phone: 204-945-5343 Fax:
Affordable Care Act Implementation Alert
 CONTENTS > What is the PCORI Fee? What is the purpose of the PCORI fee? > What are the reporting and payment requirements? > How is the PCORI fee calculated? > What is the role of AmeriHealth Administrators?
Illinois Job Index. Growth Rate %
 Illinois Job Index Release Data Issue 03/14/2011 Jan 1990 / Jan 2011 2011.02 www.real.illinois.edu For January Illinois Job Index, the Nation, RMW and the state all had positive job growth. The monthly
Dulles Corridor Enterprise Financial Update Dulles Corridor Advisory Committee Meeting
 Dulles Corridor Enterprise Financial Update Dulles Corridor Advisory Committee Meeting December 15, 2014 Discussion Outline Finance Plan for the Metrorail Project Allocation of Estimated Capital Costs
LOAN MARKET DATA AND ANALYTICS BY THOMSON REUTERS LPC
 LOAN MARKET DATA AND ANALYTICS BY THOMSON REUTERS LPC GLOBAL LOAN MARKET DATA AND ANALYTICS BY THOMSON REUTERS LPC Secondary Market Bid Levels: Europe Slide 2 European CLO New Issue Volume Monthly Slide
Development of Economy and Financial Markets of Kazakhstan
 Development of Economy and Financial Markets of Kazakhstan National Bank of Kazakhstan Macroeconomic development GDP, real growth, % 116 112 18 14 1 113,5 11,7 216,7223,8226,5 19,8 19,8 19,3 19,619,7 199,
Illinois Job Index Note: BLS revised its estimates for the number of jobs and seasonal adjustment method at the beginning of 2010.
 Illinois Job Index Release Data Issue 4/21/2010 Jan 1990 / Mar 2010 Note: BLS revised its estimates for the number of jobs and seasonal adjustment method at the beginning of 2010. For April Illinois Job
Revenue Estimating Conference Tobacco Tax and Surcharge Executive Summary
 Revenue Estimating Conference Tobacco Tax and Surcharge Executive Summary February 12, 2014 The Revenue Estimating Conference reviewed Tobacco Tax and Surcharge revenues on February 12, 2014. The forecasts
Project NEON Interim Finance Committee Rudy Malfabon Director
 Project NEON Interim Finance Committee Rudy Malfabon Director October 22, 2014 1 Project Benefits Safety & Congestion 1,000 crashes per year! Connectivity /Mobility for City Redevelopment Efforts Congestion:
BANK OF GUYANA. BANKING SYSTEM STATISTICAL ABSTRACT Website:
 BANK OF GUYANA BANKING SYSTEM STATISTICAL ABSTRACT Website: www.bankofguyana.org.gy RESEARCH DEPARTMENT March 2010 STATISTICAL ABSTRACT TABLES CONTENTS 1. MONETARY AUTHORITY 1.1 Bank of Guyana: Assets
PHOENIX ENERGY MARKETING CONSULTANTS INC. HISTORICAL NATURAL GAS & CRUDE OIL PRICES UPDATED TO July, 2018
 Jan-01 $12.9112 $10.4754 $9.7870 $1.5032 $29.2595 $275.39 $43.78 $159.32 $25.33 Feb-01 $10.4670 $7.8378 $6.9397 $1.5218 $29.6447 $279.78 $44.48 $165.68 $26.34 Mar-01 $7.6303 $7.3271 $5.0903 $1.5585 $27.2714
Board of Directors October 2018 and YTD Financial Report
 Board of Directors October 2018 and YTD Financial Report Consolidated Financial Results Operating Margin October ($30,262) $129,301 ($159,563) Year-to-date $292,283 $931,358 ($639,076) Excess of Revenue
PL (9 Oct 80, but effective 1 Dec 80)
") This fact sheet provides information to help you understand the provisions of the Survivor Benefit Plan (SBP), but is not a contract document. The basic statutory provisions of the SBP law are in Chapter
This fact sheet provides information to help you understand the provisions of the Survivor Benefit Plan (SBP), but is not a contract document. The basic statutory provisions of the SBP law are in Chapter
Home and Community Based Services (HCBS) Waiver Monthly Surplus-Deficit Report for Waiver Program Expenditures. June 20, 2016
 Waiver Monthly Surplus-Deficit Report for Waiver Program Expenditures. June 20, 2016") Home and Community Based Services (HCBS) Waiver Monthly Surplus-Deficit Report for Waiver Program Expenditures June 20, 2016 Appropriations and Expenditure Information The Fiscal Year 2015-16 General Appropriations
Home and Community Based Services (HCBS) Waiver Monthly Surplus-Deficit Report for Waiver Program Expenditures June 20, 2016 Appropriations and Expenditure Information The Fiscal Year 2015-16 General Appropriations
200 Years Of The U.S. Stock Market
 200 Years Of The U.S. Stock Market Professor John McConnell Krannert School of Management Purdue University September 25, 2018 1 200 Years Of The U.S. Stock Market Market Overview The long term The averages
Pension reforms in the Netherlands this millennium; from DB via CDC to DC? Bastiaan Starink (Tilburg University, Netspar and PwC)
") Pension reforms in the Netherlands this millennium; from DB via CDC to DC? Bastiaan Starink (Tilburg University, Netspar and PwC) Topics of today Some typical characteristics of the Dutch pension system
Pension reforms in the Netherlands this millennium; from DB via CDC to DC? Bastiaan Starink (Tilburg University, Netspar and PwC) Topics of today Some typical characteristics of the Dutch pension system
May 2016 MLS Statistical ReportREALTORS
 May 216 MLS Statistical ReportREALTORS 3 Year over Year Sales Comparison - Total Sales 25 2 15 1 5 213 214 215 216 Jan Feb Mar Apr May Jun Jul Aug Sep Oct Nov Dec Summary Overall Since the beginning of
June 2018 MLS Statistical Report
 Jan Feb Mar Apr May Jun Jul Aug Sep Oct Nov Dec June 218 MLS Statistical Report Total Sales The Month to Month Unit Sales graph shows that sales have started their seasonal decline. For the year, residential
State Universities Retirement System
 State Universities Retirement System Benefit Comparison May 25, 2010 Introduction This report compares and illustrates the differences between selected public retirement systems and SURS. The comparisons
Fiscal Year 2018 Project 1 Annual Budget
 Fiscal Year 2018 Project 1 Annual Budget Table of Contents Table Page Summary 3 Summary of Costs Table 1 4 Treasury Related Expenses Table 2 5 Summary of Full Time Equivalent Table 3 6 Positions Cost-to-Cash
QUARTERLY FINANCIAL REPORT June 30, 2017
 California Independent System Operator QUARTERLY FINANCIAL REPORT June 30, 2017 250 Outcropping Way Folsom, CA 95630 (916) 351-4000 CALIFORNIA INDEPENDENT SYSTEM OPERATOR CORPORATION QUARTERLY FINANCIAL
Common stock prices 1. New York Stock Exchange indexes (Dec. 31,1965=50)2. Transportation. Utility 3. Finance
2. Transportation. Utility 3. Finance") Digitized for FRASER http://fraser.stlouisfed.org/ Federal Reserve Bank of St. Louis 000 97 98 99 I90 9 9 9 9 9 9 97 98 99 970 97 97 ""..".'..'.."... 97 97 97 97 977 978 979 980 98 98 98 98 98 98 987 988
Digitized for FRASER http://fraser.stlouisfed.org/ Federal Reserve Bank of St. Louis 000 97 98 99 I90 9 9 9 9 9 9 97 98 99 970 97 97 ""..".'..'.."... 97 97 97 97 977 978 979 980 98 98 98 98 98 98 987 988
Economic and Fiscal Update. Ben Rosenfield, Controller Ted Egan, Ph.D., Chief Economist City and County of San Francisco January 23, 2018
 Economic and Fiscal Update Ben Rosenfield, Controller Ted Egan, Ph.D., Chief Economist City and County of San Francisco January 23, 2018 San Francisco Unemployment Rate Continues to Find New Lows Now Down
Constructing a Cash Flow Forecast
 Constructing a Cash Flow Forecast Method and Worked Example A cash flow forecast shows the estimates of the timing and amounts of cash inflows and outflows over a period of time. The sections of a cash
Calcom Vision Limited. FY18-19 Q2 (July-Sept 18) Investors Release 29 th October, 2018
 Investors Release 29 th October, 2018") Vision Limited FY18-19 Q2 (July-Sept 18) Investors Release 29 th October, 2018 Index FY2018-19 Q2 Performance - Review FY2018-19 Sales Review Key Focus Area of the Past Quarter: Materials Requirement Planning
Vision Limited FY18-19 Q2 (July-Sept 18) Investors Release 29 th October, 2018 Index FY2018-19 Q2 Performance - Review FY2018-19 Sales Review Key Focus Area of the Past Quarter: Materials Requirement Planning
Economic Outlook and Housing Market Forecast
 Economic Outlook and Housing Market Forecast NVAR Housing Finance Summit Terry L, Clower, Ph.D. Director, Center for Regional Analysis Schar School of Policy and Government George Mason University May
Choosing a Cell Phone Plan-Verizon Investigating Linear Equations
 Choosing a Cell Phone Plan-Verizon Investigating Linear Equations I n 2008, Verizon offered the following cell phone plans to consumers. (Source: www.verizon.com) Verizon: Nationwide Basic Monthly Anytime
Pension Investment Strategy and Pension Risk Transfer. Adapted for Mid-Atlantic Actuarial Club Annual Meeting September 11, 2014
 Pension Investment Strategy and Pension Risk Transfer Adapted for Mid-Atlantic Actuarial Club Annual Meeting September 11, 2014 Derisking costs Cost as % of ongoing liability* ACTIVE VESTED RETIREE TYPICALPLAN
Economic Activity Index ( GDB-EAI ) For the month of May 2013 G O V E R N M E N T D E V E L O P M E N T B A N K F O R P U E R T O R I C O
 For the month of May 2013 G O V E R N M E N T D E V E L O P M E N T B A N K F O R P U E R T O R I C O") Economic Activity Index ( GDB-EAI ) For the month of May 2013 General Commentary May 2013 GDB-EAI for the month of May registered a 3.4% year-over-year ( YOY ) reduction May 2013 EAI was 126.7, a 3.4%
Economic Activity Index ( GDB-EAI ) For the month of May 2013 General Commentary May 2013 GDB-EAI for the month of May registered a 3.4% year-over-year ( YOY ) reduction May 2013 EAI was 126.7, a 3.4%
December 10, Butler School District 53 1
 December 10, 2018 Butler School District 53 1 Key Terms Aggregate Levy annual corporate levy other than debt service Debt Service Levy made to retire the principal or pay interest on bonds Property Tax
University of Wisconsin - Madison Retirement Association Fundamental Concepts of Investing. September 15, Jim Hamre Steve Hawk
 University of Wisconsin - Madison Retirement Association Fundamental Concepts of Investing September 15, 2009 Jim Hamre Steve Hawk 1 Investment Environment Large Federal Budget Deficits Potential for Higher
Unrestricted Cash / Board Designated Cash & Investments December 2015
 Unrestricted Cash / Board Designated Cash & Investments December 2015 25.0 21.0 20.0 19.5 18.9 18.1 16.8 16.5 15.9 15.0 10.0 11.0 12.8 9.1 10.4 9.8 11.1 14.7 14.2 14.1 9.9 12.0 8.4 13.0 10.2 11.6 14.9
NORTH SYRACUSE CENTRAL SCHOOL DISTRICT. Fund Balance & Budget Assumptions December 3, 2018
 NORTH SYRACUSE CENTRAL SCHOOL DISTRICT Fund Balance & Budget Assumptions 2019-2020 December 3, 2018 1 AGENDA Fund Balance Reserves Economic Factors Revenue Assumptions Expenditure Assumptions Budget Timeline
Financial and Operating Plan Kevyn D. Orr Emergency Manager
 Financial and Operating Plan Kevyn D. Orr Emergency Manager June 10, 2013 Detroit spends more than it takes in it is insolvent. It has borrowed hundreds of millions of dollars and has deferred just as
Department of Public Welfare (DPW)
") Department of Public Welfare (DPW) Office of Income Maintenance Electronic Benefits Transfer Card Risk Management Report Out-of-State Residency Review FISCAL YEAR 2014-2015 September 2014 (June, July and
Department of Public Welfare (DPW) Office of Income Maintenance Electronic Benefits Transfer Card Risk Management Report Out-of-State Residency Review FISCAL YEAR 2014-2015 September 2014 (June, July and
Financial Report for the Month of SEPTEMBER
 WILLOUGHBY, OH Financial Report for the Month of SEPTEMBER Month Ended SEPTEMBER 30, 2013 BOARD OF EDUCATION Mrs. Margaret Warner, President SUPERINTENDENT Mr. Steve Thompson Mrs. Sharon Scott, Vice President
Employers Compliance with the Health Insurance Act ANNUAL REPORT. Bermuda. Health Council
 Employers Compliance with the Health Insurance Act 1970 2016 ANNUAL REPORT Bermuda ea Health Council Employers Compliance with the Health Insurance Act 1970 2016 Annual Report Contact us: If you would
Consolidated financial results for 2Q 2017
 Citi Handlowy Strategy and Investor Relations Department Consolidated financial results for 2Q 2017 August 22 nd, 2017 2Q 2017 summary Consistent growth of customer business: Loan volume growth in institutional
FILED: NEW YORK COUNTY CLERK 11/03/ :05 PM INDEX NO /2014 NYSCEF DOC. NO. 166 RECEIVED NYSCEF: 11/03/2014 EXHIBIT N
 FILED: NEW YORK COUNTY CLERK 11/03/2014 09:05 PM INDEX NO. 652382/2014 NYSCEF DOC. NO. 166 RECEIVED NYSCEF: 11/03/2014 EXHIBIT N Exhibit N: Loan Modification Examples - Conflict of Interests Example 1
Projections/Estimated - Unrestricted Cash / Board Designated Cash & Investments September 2017
 Projections/Estimated - Unrestricted Cash / Board Designated Cash & Investments September 2017 25.0 20.0 17.1 16.9 15.0 10.0 11.7 11.0 9.1 10.1 9.7 7.7 7.0 6.8 15.1 14.8 11.5 13.1 13.8 9.9 11.4 12.2 8.4
Government of the Punjab Punjab Pension Fund ANNUAL REPORT
 ANNUAL REPORT The Management Committee of (PPF) is pleased to present to Government of the Punjab the Annual Report for the year ended 30 June 2014. FUND SIZE A summary of changes in fund size during FY
Voya Indexed Universal Life-Protector
 calculation examples Values as of 07/28/2018 Voya ed Universal Life-Protector Issued by Security Life of Denver Insurance Company Required training! VFA Registered Representatives must review the Required
DART Fare Structure Programs
 DART Fare Structure Programs Budget & Finance Committee November 13, 2018 Joseph G. Costello Senior Vice President, Finance 0 Calendar Date Nov 13 Dec 11 Jan 22 Feb 26 Mar 26 Apr 23 May 28 Jun 18 Jul 18
Business & Financial Services December 2017
 Business & Financial Services December 217 Completed Procurement Transactions by Month 2 4 175 15 125 1 75 5 2 1 Business Days to Complete 25 Jan Feb Mar Apr May Jun Jul Aug Sep Oct Nov Dec 217 Procurement
Figure 1. Nepal: Recent Fiscal Developments
 Jul/Aug Aug/Sept Sept/Oct Oct/Nov Nov/Dec Dec/Jan Jan/Feb Feb/Mar Mar/Apr Apr/May May/Jun Jun/Jul Figure 1. : Recent Fiscal Developments Strong revenue growth combined with subdued capital spending kept