Project NEON Interim Finance Committee Rudy Malfabon Director
|
|
|
- Virgil Skinner
- 5 years ago
- Views:
Transcription


1 Project NEON Interim Finance Committee Rudy Malfabon Director October 22,
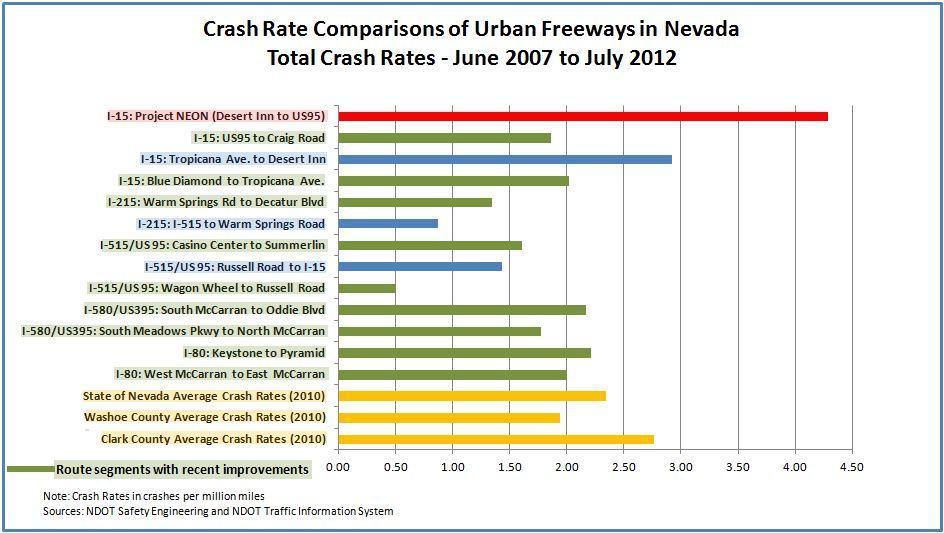
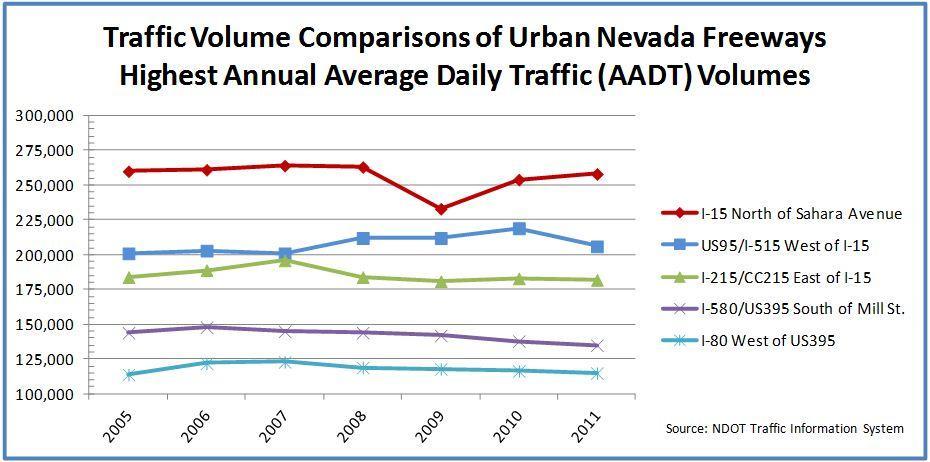
2 Project Benefits Safety & Congestion 1,000 crashes per year! Connectivity /Mobility for City Redevelopment Efforts Congestion: Improves Freight Mobility & Economy Creates 5,000 Jobs in Hard-hit Employment Sector Southern NV needs 21 st century transportation system Benefit / Cost Ratio = 5.8 (exponential improvement!) 2

3 Statewide Comparison Insert Project Map 3

4 Downtown Redevelopment I-15 US 95 Charleston Blvd. 4

5 Major Construction Elements HOV Connector 5


6 Local Connectivity 6


7 New Scope Improvements Active Traffic Management 7

8 New Scope Improvements Express Lane Conversion 8
9 What s Changed? 1. 90% of the annual Availability Payment (AP) was to have a fixed escalation of 1.75% and the remaining 10% would escalate with the CPI. The P3 teams were requesting NDOT increase the amount of CPI risk to 20% of the annual AP 2. P3 teams concerned about the risk of future appropriations from the Legislature in order for NDOT to make its annual AP. They wanted NDOT to establish that the AP would have top priority in the capital improvement program 3. NDOT retains 100% of the risk for Right-of-Way (ROW) acquisition. In the event NDOT were unable to deliver the ROW according to the contracted schedule, the contractor would be entitled to delay claims 9
10 What s Changed? - continued 4. NDOT included some work funded by the City of Las Vegas in the P3 scope of work. The P3 teams were concerned about third party (City of LV) involvement and timeliness of design reviews as well as additional requirements imposed by the City as part of the permitting process 5. The P3 teams were requesting NDOT make a $100M progress payment during construction instead of a Final Acceptance Payment of $200M upon project completion. This would effectively push the financial model closer toward a bonding project diminishing the affordability during construction 6. The P3 teams were concerned with the risk of projecting prevailing wage increases over a 35 year O&M period 10
11 Why Bond instead of P3? Reanalyzed delivery method due to federal funding uncertainty caused by federal highway bill debate Market demand for bonds and competitive pricing makes bonding even more affordable than originally projected Right-of-way acquisitions may affect schedule Project can be completed within similar timeframe by bonding as with P3 resulting in no realized efficiency savings NDOT maintains control of future O&M program and funding Eligible for up to 95% federal reimbursement vs. 64.9% with P3 method. Approximate savings: $69M Net Present Value 11
12 3 Affordability Goals Maintain a minimum of $90M in Highway Fund Helps to bridge potential gaps in federal funding Do not exceed Historical Annual Debt Service Payments $100 Million per year maximum Under $89 Million per year maintains AAA rating with S&P Maintain the same Statewide Capital Program No decrease in funding for other statewide projects 12
 $90 $80 $70 Both bond scenarios maintain AAA rating $60 $50")
13 Millions Construction Bond Payments $100 $500M Baseline $540M Conservative Annual Payment (AAA) $90 $80 $70 Both bond scenarios maintain AAA rating $60 $50 $40 13
14 Design Build Delivery Delivery Timelines Aug Sep Oct Nov Dec Jan Feb Mar Apr May Jun Jul Aug Sep Oct Nov Dec Jan Feb Mar Apr May Jun Jul Aug Sep Oct Nov Dec RFQ Dev. RFQ Response and Evaluation and RFP Development RFP Response and Evaluation Contract Execution Design and Construction Preferred Proposer Selected Issue RFQ Issue RFP 14
15 Rudy Malfabon Director (775)
XML Publisher Balance Sheet Vision Operations (USA) Feb-02
 Feb-02") Page:1 Apr-01 May-01 Jun-01 Jul-01 ASSETS Current Assets Cash and Short Term Investments 15,862,304 51,998,607 9,198,226 Accounts Receivable - Net of Allowance 2,560,786
Page:1 Apr-01 May-01 Jun-01 Jul-01 ASSETS Current Assets Cash and Short Term Investments 15,862,304 51,998,607 9,198,226 Accounts Receivable - Net of Allowance 2,560,786
Series 2016 Highway Improvement and Refunding Revenue Bonds
 1 Series 2016 Highway Improvement and Refunding Revenue Bonds November 9, 2015 Robert C. Nellis, CPM Assistant Director, Administration Peter Shellenberger Public Financial Management, Inc. 2 Project NEON
Key IRS Interest Rates After PPA
 Key IRS Interest After PPA (updated upon release of figures in IRS Notice usually by the end of the first full business week of the month) Below are Tables I, II, and III showing official interest rates
Spheria Australian Smaller Companies Fund
 29-Jun-18 $ 2.7686 $ 2.7603 $ 2.7520 28-Jun-18 $ 2.7764 $ 2.7681 $ 2.7598 27-Jun-18 $ 2.7804 $ 2.7721 $ 2.7638 26-Jun-18 $ 2.7857 $ 2.7774 $ 2.7690 25-Jun-18 $ 2.7931 $ 2.7848 $ 2.7764 22-Jun-18 $ 2.7771
Key IRS Interest Rates After PPA
 Key IRS Rates - After PPA - thru 2011 Page 1 of 10 Key IRS Interest Rates After PPA (updated upon release of figures in IRS Notice usually by the end of the first full business week of the month) Below
Looking at a Variety of Municipal Valuation Metrics
 Looking at a Variety of Municipal Valuation Metrics Muni vs. Treasuries, Corporates YEAR MUNI - TREASURY RATIO YEAR MUNI - CORPORATE RATIO 200% 80% 175% 150% 75% 70% 65% 125% Average Ratio 0% 75% 50% 60%
Business & Financial Services December 2017
 Business & Financial Services December 217 Completed Procurement Transactions by Month 2 4 175 15 125 1 75 5 2 1 Business Days to Complete 25 Jan Feb Mar Apr May Jun Jul Aug Sep Oct Nov Dec 217 Procurement
Common stock prices 1. New York Stock Exchange indexes (Dec. 31,1965=50)2. Transportation. Utility 3. Finance
2. Transportation. Utility 3. Finance") Digitized for FRASER http://fraser.stlouisfed.org/ Federal Reserve Bank of St. Louis 000 97 98 99 I90 9 9 9 9 9 9 97 98 99 970 97 97 ""..".'..'.."... 97 97 97 97 977 978 979 980 98 98 98 98 98 98 987 988
Digitized for FRASER http://fraser.stlouisfed.org/ Federal Reserve Bank of St. Louis 000 97 98 99 I90 9 9 9 9 9 9 97 98 99 970 97 97 ""..".'..'.."... 97 97 97 97 977 978 979 980 98 98 98 98 98 98 987 988
CASH MANAGEMENT & CONTRACT AWARDS
 CASH MANAGEMENT & CONTRACT AWARDS Brian Ragland, Chief Financial Officer Bill Hale, Chief Engineer Randy Hopmann, Director of District Operations Footer Text Date I. Cash Management Practices 2 FY 2018-2019
85 th Legislature: Impact on Funding and UTP
 85 th Legislature: Impact on Funding and UTP Brian Ragland, Chief Financial Officer Peter Smith, Director, Transportation Planning and Programming Division TxDOT Budget FY -2019 Use of Funds 2 Proposition
Executive Summary. July 17, 2015
 Executive Summary July 17, 2015 The Revenue Estimating Conference adopted interest rates for use in the state budgeting process. The adopted interest rates take into consideration current benchmark rates
QUESTION 2. QUESTION 3 Which one of the following is most indicative of a flexible short-term financial policy?
 QUESTION 1 Compute the cash cycle based on the following information: Average Collection Period = 47 Accounts Payable Period = 40 Average Age of Inventory = 55 QUESTION 2 Jan 41,700 July 39,182 Feb 18,921
Review of Registered Charites Compliance Rates with Annual Reporting Requirements 2016
 Review of Registered Charites Compliance Rates with Annual Reporting Requirements 2016 October 2017 The Charities Regulator, in accordance with the provisions of section 14 of the Charities Act 2009, carried
HUD NSP-1 Reporting Apr 2010 Grantee Report - New Mexico State Program
 HUD NSP-1 Reporting Apr 2010 Grantee Report - State Program State Program NSP-1 Grant Amount is $19,600,000 $9,355,381 (47.7%) has been committed $4,010,874 (20.5%) has been expended Grant Number HUD Region
Fiscal Year th Quarter Report Quarterly Report of Actual Traffic and Revenue For period ending August 31, 2017
 Fiscal Year 2017 4 th Quarter Report Quarterly Report of Actual Traffic and Revenue For period ending August 31, 2017 Footer Text Date Table of Contents Section Page Number Notes and Observations 3-4 Significant
Financial & Business Highlights For the Year Ended June 30, 2017
 Financial & Business Highlights For the Year Ended June, 17 17 16 15 14 13 12 Profit and Loss Account Operating Revenue 858 590 648 415 172 174 Investment gains net 5 162 909 825 322 516 Other 262 146
Performance Report October 2018
 Structured Investments Indicative Report October 2018 This report illustrates the indicative performance of all Structured Investment Strategies from inception to 31 October 2018 Matured Investment Strategies
CBER Economic Indexes for Nevada and Southern Nevada
 CBER Economic Indexes for Nevada and Southern Nevada Published December 19, 2017 Stephen M. Miller, PhD, Director Nicolas Prada, M.A., Graduate Research Assistant Summary of CBER s Nevada Indexes Coincident
Big Walnut Local School District
 Big Walnut Local School District Monthly Financial Report for the month ended September 30, 2013 Prepared By: Felicia Drummey Treasurer BIG WALNUT LOCAL SCHOOL DISTRICT SUMMARY OF YEAR TO DATE FINANCIAL
WESTWOOD LUTHERAN CHURCH Summary Financial Statement YEAR TO DATE - February 28, Over(Under) Budget WECC Fund Actual Budget
 Budget WECC Fund Actual Budget") WESTWOOD LUTHERAN CHURCH Summary Financial Statement YEAR TO DATE - February 28, 2018 General Fund Actual A B C D E F WECC Fund Actual Revenue Revenue - Faith Giving 1 $ 213 $ 234 $ (22) - Tuition $ 226
WESTWOOD LUTHERAN CHURCH Summary Financial Statement YEAR TO DATE - February 28, 2018 General Fund Actual A B C D E F WECC Fund Actual Revenue Revenue - Faith Giving 1 $ 213 $ 234 $ (22) - Tuition $ 226
Clerk of the Circuit Court and Comptroller, Escambia County MEMORANDUM
 Pam Childers Clerk of the Circuit Court and Comptroller, Escambia County Clerk of Courts Count y Com MEMORANDUM TO: Honorable Board of County Commissioners DATE: October 11, 2018 SUBJECT: Tourist Development
TERMS OF REFERENCE FOR THE INVESTMENT COMMITTEE
 I. PURPOSE The purpose of the Investment Committee (the Committee ) is to recommend to the Board the investment policy, including the asset mix policy and the appropriate benchmark for both ICBC and any
Using projections to manage your programs
 Using projections to manage your programs To project total provider reimbursements To do what ifs based on caseloads or other metrics To project amounts of admin & support available for spending Based
CBER Indexes for Nevada and Southern Nevada
 CBER Indexes for Nevada and Southern Nevada Published March 24, 2016 Stephen M. Miller, PhD, Director Jinju Lee, Economic Analyst Summary of CBER s Nevada Indexes Coincident Index Leading Index Mo. to
Big Walnut Local School District
 Big Walnut Local School District Monthly Financial Report for the month ended September 30, 2012 Prepared By: Felicia Drummey Treasurer BIG WALNUT LOCAL SCHOOL DISTRICT SUMMARY OF YEAR-TO-DATE FINANCIAL
Fiscal Year nd Quarter Report Quarterly Report of Actual Traffic and Toll Revenue For period ending February 28, 2018
 Fiscal Year 2018 2 nd Quarter Report Quarterly Report of Actual Traffic and Toll Revenue For period ending February 28, 2018 Footer Text Date Table of Contents Section Page Number Disclaimer 3 Notes and
QUARTERLY FINANCIAL REPORT March 31, 2018
 California Independent System Operator QUARTERLY FINANCIAL REPORT March 31, 2018 250 Outcropping Way Folsom, CA 95630 (916) 351-4000 CALIFORNIA INDEPENDENT SYSTEM OPERATOR CORPORATION QUARTERLY FINANCIAL
7.6% The YOY percent increase in Nevada taxable sales in August--up $259 million from August 2011.
 Jan-03 Jun-03 Nov-03 Apr-04 Sep-04 Feb-05 Jul-05 Dec-05 May-06 Oct-06 Mar-07 Aug-07 Jan-08 Jun-08 Nov-08 Apr-09 Sep-09 Feb-10 Dec-10 May-11 Oct-11 Aug-12 Index Municipal Investment Management In This Issue
QUARTERLY FINANCIAL REPORT June 30, 2017
 California Independent System Operator QUARTERLY FINANCIAL REPORT June 30, 2017 250 Outcropping Way Folsom, CA 95630 (916) 351-4000 CALIFORNIA INDEPENDENT SYSTEM OPERATOR CORPORATION QUARTERLY FINANCIAL
BUDGET AND STATISTICAL REPORT March 2018
 10 ACTUAL TO FY 2011 ACTUAL BUDGET AND STATISTICAL REPORT March 2018 GENERAL FUND OPERATING REVENUES: YEAR TO DATE COMPARISONS YEAR TO DATE THRU March 2018 $ in millions $300 $250 $200 234.8 257.4 252.8
Isle Of Wight half year business confidence report
 half year business confidence report half year report contents new company registrations closed companies (dissolved) net company growth uk company share director age director gender naming trends sic
Cost Estimation of a Manufacturing Company
 Cost Estimation of a Manufacturing Company Name: Business: Date: Economics of One Unit: Manufacturing Company (Only complete if you are making a product, such as a bracelet or beauty product) Economics
STRUCTURED INVESTMENT PERFORMANCE UPDATE 3 Years Bonus Enhanced Structured Equity Linked Investment Series 1
 STRUCTURED INVESTMENT PERFORMANCE UPDATE 3 Years Bonus Enhanced Structured Equity Linked Investment Series 1 Report as at: 30Jun16 The product is closed for subscription. This is an interim update and
Joint Appropriations Subcommittee on Transportation
 Joint Appropriations Subcommittee on Transportation Funding Overview February 21, 2013 H. Tasaico, PE 1 NCDOT Funding Overview - Agenda State Transportation Comparative Data Transportation Funding Sources
Foundations of Investing
 www.edwardjones.com Member SIPC Foundations of Investing 1 5 HOW CAN I STAY ON TRACK? 4 HOW DO I GET THERE? 1 WHERE AM I TODAY? MY FINANCIAL NEEDS 3 CAN I GET THERE? 2 WHERE WOULD I LIKE TO BE? 2 Develop
PHOENIX ENERGY MARKETING CONSULTANTS INC. HISTORICAL NATURAL GAS & CRUDE OIL PRICES UPDATED TO July, 2018
 Jan-01 $12.9112 $10.4754 $9.7870 $1.5032 $29.2595 $275.39 $43.78 $159.32 $25.33 Feb-01 $10.4670 $7.8378 $6.9397 $1.5218 $29.6447 $279.78 $44.48 $165.68 $26.34 Mar-01 $7.6303 $7.3271 $5.0903 $1.5585 $27.2714
CBER Economic Indexes for Nevada and Southern Nevada
 CBER Economic Indexes for Nevada and Southern Nevada Published November 14, 2018 Stephen M. Miller, PhD, Director Hasara Rathnasekara, Graduate Research Assistant Summary of CBER s Nevada Indexes Coincident
Factor Leave Accruals. Accruing Vacation and Sick Leave
 Factor Leave Accruals Accruing Vacation and Sick Leave Factor Leave Accruals As part of the transition of non-exempt employees to biweekly pay, the UC Office of the President also requires standardization
Constructing a Cash Flow Forecast
 Constructing a Cash Flow Forecast Method and Worked Example A cash flow forecast shows the estimates of the timing and amounts of cash inflows and outflows over a period of time. The sections of a cash
THE CURRENCY- IRANIAN RIAL (IRR)
") THE CURRENCY- IRANIAN RIAL (IRR) THE VIEW ON FX JANUARY 2018 ASSET MANAGEMENT AND PRIVATE EQUITY 1978 1979 1980 1981 1982 1983 1984 1985 1986 1987 1988 1989 1990 1991 1992 1993 1994 1995 1996 1997 1998
THE CURRENCY- IRANIAN RIAL (IRR) THE VIEW ON FX JANUARY 2018 ASSET MANAGEMENT AND PRIVATE EQUITY 1978 1979 1980 1981 1982 1983 1984 1985 1986 1987 1988 1989 1990 1991 1992 1993 1994 1995 1996 1997 1998
Department of Public Welfare (DPW)
") Department of Public Welfare (DPW) Office of Income Maintenance Electronic Benefits Transfer Card Risk Management Report Out-of-State Residency Review FISCAL YEAR 2014-2015 September 2014 (June, July and
Department of Public Welfare (DPW) Office of Income Maintenance Electronic Benefits Transfer Card Risk Management Report Out-of-State Residency Review FISCAL YEAR 2014-2015 September 2014 (June, July and
Clerk of the Circuit Court and Comptroller, Escambia County MEMORANDUM
 Pam Childers Clerk of the Circuit Court and Comptroller, Escambia County Clerk of Courts County Comptroller Clerk of the Board of County Commissioners Recorder Auditor MEMORANDUM TO: Honorable Board of
OTHER DEPOSITS FINANCIAL INSTITUTIONS DEPOSIT BARKAT SAVING ACCOUNT
 WEIGHTAGES JAN FEB MAR APR MAY JUN JUL AUG SEPT OCT NOV DEC ANNOUNCEMENT DATE 19.Dez.14 27.Jän.15 24.Feb.15 26.Mär.15 27.Apr.15 26.Mai.15 25.Jun.15 28.Jul.15 26.Aug.15 23.Sep.15 27.Okt.15 25.Nov.15 MUDARIB
CONTENTS COMMENTARY CHARTS TABLES GLOSSARY. Section 1: Headline Inflation Section 2: Core Inflation
 COMMENTARY CONTENTS Section 1: Headline Inflation Section 2: Core Inflation CHARTS 1. National Rates of Inflation, January 2010 April 2013 2. Monthly Changes in the Cost-of-Living Index, January 2010 April
University of Wisconsin - Madison Retirement Association Fundamental Concepts of Investing. September 15, Jim Hamre Steve Hawk
 University of Wisconsin - Madison Retirement Association Fundamental Concepts of Investing September 15, 2009 Jim Hamre Steve Hawk 1 Investment Environment Large Federal Budget Deficits Potential for Higher
Orange Unified School District
 Orange Unified School District Financing Information Ron Lebs Assistant Superintendent, Facilities and Planning Orange Unified School District Tel: 714.628.4500 rlebs@orangeusd.org Adam Bauer Chief Executive
HIPIOWA - IOWA COMPREHENSIVE HEALTH ASSOCIATION Unaudited Balance Sheet As of July 31
 Unaudited Balance Sheet As of July 31 Total Enrollment: 407 Assets: Cash $ 9,541,661 $ 1,237,950 Invested Cash 781,689 8,630,624 Premiums Receivable 16,445 299,134 Prepaid 32,930 34,403 Assessments Receivable
HIPIOWA - IOWA COMPREHENSIVE HEALTH ASSOCIATION Unaudited Balance Sheet As of January 31
 Unaudited Balance Sheet As of January 31 Total Enrollment: 371 Assets: Cash $ 1,408,868 $ 1,375,117 Invested Cash 4,664,286 4,136,167 Premiums Receivable 94,152 91,261 Prepaid 32,270 33,421 Assessments
CBER Indexes for Nevada and Southern Nevada
 CBER Indexes for Nevada and Southern Nevada Published June 23, 2017 Stephen M. Miller, PhD, Director Nicolas Prada, Graduate Research Assistant Summary of CBER s Nevada Indexes Coincident Index (March)
The year to date is less than budget and prior year by 15.4 million and 11.6 million, respectively.
 To: Chicago Transit Authority Board From: Jeremy Fine, Chief Financial Officer Re: Financial Results for September 2016 Date: November 16, 2016 I. Summary CTA s financial results are $0.3 million unfavorable
Clerk of the Circuit Court and Comptroller, Escambia County MEMORANDUM
 Pam Childers Clerk of the Circuit Court and Comptroller, Escambia County Clerk of Courts Count y Com MEMORANDUM TO: Honorable Board of County Commissioners DATE: August 9, 2018 SUBJECT: Tourist Development
Public-Private Partnerships in Maryland. Canada-US Forum on Public-Private Partnerships October 3, 2013
 Public-Private Partnerships in Maryland Canada-US Forum on Public-Private Partnerships October 3, 2013 Towards a More Comprehensive P3 Approach 2010 P3 Law (Chapters 640 and 641 of 2010) Joint Legislative
QUARTERLY FINANCIAL REPORT December 31, 2017
 California Independent System Operator QUARTERLY FINANCIAL REPORT December 31, 2017 Preliminary and Unaudited 250 Outcropping Way Folsom, CA 95630 (916) 351-4000 CALIFORNIA INDEPENDENT SYSTEM OPERATOR
FINANCIAL MANAGEMENT STRATEGY REPORT ON OUTCOMES FOR THE YEAR ENDED MARCH 31, 2016
 FINANCIAL MANAGEMENT STRATEGY REPORT ON OUTCOMES FOR THE YEAR ENDED MARCH 31, 2016 Manitoba Finance General Inquiries: Room 109, Legislative Building Winnipeg, Manitoba R3C 0V8 Phone: 204-945-5343 Fax:
LOAN MARKET DATA AND ANALYTICS BY THOMSON REUTERS LPC
 LOAN MARKET DATA AND ANALYTICS BY THOMSON REUTERS LPC GLOBAL LOAN MARKET DATA AND ANALYTICS BY THOMSON REUTERS LPC Secondary Market Bid Levels: Europe Slide 2 European CLO New Issue Volume Monthly Slide
THE B E A CH TO WN S O F P ALM B EA CH
 THE B E A CH TO WN S O F P ALM B EA CH C OU N T Y F LO R I D A August www.luxuryhomemarketing.com PALM BEACH TOWNS SINGLE-FAMILY HOMES LUXURY INVENTORY VS. SALES JULY Sales Luxury Benchmark Price : 7,
The national monthly CPI (2008=100) increased from per cent in September, 2017 to per cent
 increased from per cent in September, 2017 to per cent") CONSUMER PRICE INDEX (CPI) October, 2017: PRESS RELEASE Released on Monday November 21, 2017 at 1:00 pm OCTOBER 2017 MONTHLY INFLATION RATE INCREASES SLIGHTLY The national monthly CPI (2008=100) increased
CONSUMER PRICE INDEX (CPI) October, 2017: PRESS RELEASE Released on Monday November 21, 2017 at 1:00 pm OCTOBER 2017 MONTHLY INFLATION RATE INCREASES SLIGHTLY The national monthly CPI (2008=100) increased
200 Years Of The U.S. Stock Market
 200 Years Of The U.S. Stock Market Professor John McConnell Krannert School of Management Purdue University September 25, 2018 1 200 Years Of The U.S. Stock Market Market Overview The long term The averages
SCHEDULE 10 INDEX FACTOR
 SCHEDULE 10 INDEX FACTOR SCHEDULE 10 INDEX FACTOR 1. GENERAL 1.1 Capitalized Terms Capitalized terms used in this Schedule have the definitions as set out in the Agreement to Design, Build, Finance and
PASSENGER REJECTION REDUCTION INITIATIVE KIRK PEREIRA. 24 th April 2018
 PASSENGER REJECTION REDUCTION INITIATIVE KIRK PEREIRA 24 th April 2018 WHAT IS THIS PROJECT ABOUT? Well we are not going into that again this year! Nearly everyone in this room knows about the project
Monthly Chartbook. April 1, Reasons We Think the World is Not Ending. Copyright All rights reserved. investwithcornerstone.
 Monthly Chartbook April 1, 2009 20 Reasons We Think the World is Not Ending Copyright 2003-2009 All rights reserved. The market had priced in the worst possible scenario that of a second Great Depression.
Beginning Date: January 2016 End Date: June Managers in Zephyr: Benchmark: Morningstar Short-Term Bond
 Beginning Date: January 2016 End Date: June 2018 Managers in Zephyr: Benchmark: Manager Performance January 2016 - June 2018 (Single Computation) 11200 11000 10800 10600 10400 10200 10000 9800 Dec 2015
Historical Pricing PJM COMED, Around the Clock. Cal '15 Cal '16 Cal '17 Cal '18 Cal '19 Cal '20 Cal '21 Cal '22
 $50 Historical Pricing PJM COMED, Around the Clock $48 $46 $44 $42 $40 $38 $36 $34 $32 $30 $28 $26 Cal '15 Cal '16 Cal '17 Cal '18 Cal '19 Cal '20 Cal '21 Cal '22 The information presented above was gathered
Consumer Price Index (Base year 2014) Consumer Price Index
 Consumer Price Index") Consumer Price Index December 2017 (Base year 2014) Consumer Price Index 1 Release Date: January 2018 Detailed by: Expenditure groups Household welfare levels Household type Regions Briefing This publication
Consumer Price Index December 2017 (Base year 2014) Consumer Price Index 1 Release Date: January 2018 Detailed by: Expenditure groups Household welfare levels Household type Regions Briefing This publication
Consumer Price Index (Base year 2014) Consumer Price Index
 Consumer Price Index") Consumer Price Index December 2016 (Base year 2014) Consumer Price Index 1 Release Date: January 2017 Detailed by: Expenditure groups Household welfare levels Household type Regions Briefing This publication
Consumer Price Index December 2016 (Base year 2014) Consumer Price Index 1 Release Date: January 2017 Detailed by: Expenditure groups Household welfare levels Household type Regions Briefing This publication
Beginning Date: January 2016 End Date: September Managers in Zephyr: Benchmark: Morningstar Short-Term Bond
 Beginning Date: January 2016 End Date: September 2018 Managers in Zephyr: Benchmark: Manager Performance January 2016 - September 2018 (Single Computation) 11400 - Yorktown Funds 11200 11000 10800 10600
Division of Bond Finance Interest Rate Calculations. Revenue Estimating Conference Interest Rates Used for Appropriations, including PECO Bond Rates
 Division of Bond Finance Interest Rate Calculations Revenue Estimating Conference Interest Rates Used for Appropriations, including PECO Bond Rates November 16, 2018 Division of Bond Finance Calculation
DBS Asia Treasures Membership
 DBS Asia Treasures Membership Frequently Asked Questions 1. How do I join as a DBS Asia Treasures member? The DBS Asia Treasures membership is by invitation only. The membership may be extended to clients
Development of Economy and Financial Markets of Kazakhstan
 Development of Economy and Financial Markets of Kazakhstan National Bank of Kazakhstan Macroeconomic development GDP, real growth, % 116 112 18 14 1 113,5 11,7 216,7223,8226,5 19,8 19,8 19,3 19,619,7 199,
METRO INVESTMENT REPORT ALL FUNDS
 METRO INVESTMENT REPORT ALL FUNDS DECEMBER 2012 Metropolitan Transit Authority of Harris County Investment Report Portfolio Summary Management Report The following is a summary of METRO's Investment Portfolios:
Algo Trading System RTM
 Year Return 2016 15,17% 2015 29,57% 2014 18,57% 2013 15,64% 2012 13,97% 2011 55,41% 2010 50,98% 2009 48,29% Algo Trading System RTM 89000 79000 69000 59000 49000 39000 29000 19000 9000 2-Jan-09 2-Jan-10
PRESS RELEASE. Securities issued by Hungarian residents and breakdown by holding sectors. January 2019
 7 March 2019 PRESS RELEASE Securities issued by Hungarian residents and breakdown by holding sectors January 2019 According to securities statistics, the amount outstanding of equity securities and debt
Mechanics of Cash Flow Forecasting
 Texas Association Of State Senior College & University Business Officers July 13, 2015 Mechanics of Cash Flow Forecasting Susan K. Anderson, CEO Anderson Financial Management, L.L.C. 130 Pecan Creek Drive
May 2016 MLS Statistical ReportREALTORS
 May 216 MLS Statistical ReportREALTORS 3 Year over Year Sales Comparison - Total Sales 25 2 15 1 5 213 214 215 216 Jan Feb Mar Apr May Jun Jul Aug Sep Oct Nov Dec Summary Overall Since the beginning of
Illinois Job Index. Growth Rate %
 Illinois Job Index Release Data Issue 03/14/2011 Jan 1990 / Jan 2011 2011.02 www.real.illinois.edu For January Illinois Job Index, the Nation, RMW and the state all had positive job growth. The monthly
1.2 The purpose of the Finance Committee is to assist the Board in fulfilling its oversight responsibilities related to:
 Category: BOARD PROCESS Title: Terms of Reference for the Finance Committee Reference Number: AB-331 Last Approved: February 22, 2018 Last Reviewed: February 22, 2018 1. PURPOSE 1.1 Primary responsibility
Consumer Price Index (Base year 2014) Consumer Price Index
 Consumer Price Index") Consumer Price Index July 207 (Base year 204) Consumer Price Index Release Date: Augest 207 Detailed by: Expenditure groups Household welfare levels Household type Regions Briefing This publication provides
Consumer Price Index July 207 (Base year 204) Consumer Price Index Release Date: Augest 207 Detailed by: Expenditure groups Household welfare levels Household type Regions Briefing This publication provides
Illinois Job Index Note: BLS revised its estimates for the number of jobs and seasonal adjustment method at the beginning of 2010.
 Illinois Job Index Release Data Issue 4/21/2010 Jan 1990 / Mar 2010 Note: BLS revised its estimates for the number of jobs and seasonal adjustment method at the beginning of 2010. For April Illinois Job
Fiscal Year th Quarter Report Quarterly Report of Actual Traffic and Toll Revenue For period ending August 31, 2018
 Fiscal Year 2018 4 th Quarter Report Quarterly Report of Actual Traffic and Toll Revenue For period ending August 31, 2018 Footer Text Date Table of Contents Section Page Number Disclaimer 3 Notes and
Historical Pricing PJM PSEG, Around the Clock. Cal '15 Cal '16 Cal '17 Cal '18 Cal '19 Cal '20 Cal '21 Cal '22
 $70 Historical Pricing PJM PSEG, Around the Clock $65 $60 $55 $50 $45 $40 $35 $30 $25 Cal '15 Cal '16 Cal '17 Cal '18 Cal '19 Cal '20 Cal '21 Cal '22 The information presented above was gathered and compiled
NOVEMBER 22, : MONTHLY INFLATION RATE INCREASES SIGNIFICANTLY
 CONSUMER PRICE INDEX (CPI) November, 2016: PRESS RELEASE Released on Thursday December 22, 2016 at 1:00 pm NOVEMBER 2016 MONTHLY INFLATION RATE INCREASES SIGNIFICANTLY The national monthly CPI (2008=100)
CBER Economic Indexes for Nevada and Southern Nevada
 CBER Economic Indexes for Nevada and Southern Nevada Published February 9, 2018 Stephen M. Miller, PhD, Director Marshall Krakauer, Graduate Research Assistant Summary of CBER s Nevada Indexes Coincident
FOR RELEASE: MONDAY, MARCH 21 AT 4 PM
 Interviews with 1,012 adult Americans conducted by telephone by Opinion Research Corporation on March 18-20, 2011. The margin of sampling error for results based on the total sample is plus or minus 3
Choosing a Cell Phone Plan-Verizon Investigating Linear Equations
 Choosing a Cell Phone Plan-Verizon Investigating Linear Equations I n 2008, Verizon offered the following cell phone plans to consumers. (Source: www.verizon.com) Verizon: Nationwide Basic Monthly Anytime
TD Securities 2011 Calgary Unconventional Energy Conference July 7, Dawn Farrell Chief Operating Officer
 TD Securities 2011 Calgary Unconventional Energy Conference July 7, 2011 Dawn Farrell Chief Operating Officer 1 Forward looking statements This presentation may contain forward looking statements, including
Voya Indexed Universal Life-Protector
 calculation examples Values as of 07/28/2018 Voya ed Universal Life-Protector Issued by Security Life of Denver Insurance Company Required training! VFA Registered Representatives must review the Required
METRO. Monthly Board Report. June 2006
 METRO Monthly Board Report Operating Capital Service Performance June 26 7/17/26 June 26 MONTHLY BOARD REPORT INDEX Section A Section B Section C Section D Section E Section F Section G Operating Budget
Economic Activity Index ( GDB-EAI ) For the month of May 2013 G O V E R N M E N T D E V E L O P M E N T B A N K F O R P U E R T O R I C O
 For the month of May 2013 G O V E R N M E N T D E V E L O P M E N T B A N K F O R P U E R T O R I C O") Economic Activity Index ( GDB-EAI ) For the month of May 2013 General Commentary May 2013 GDB-EAI for the month of May registered a 3.4% year-over-year ( YOY ) reduction May 2013 EAI was 126.7, a 3.4%
Economic Activity Index ( GDB-EAI ) For the month of May 2013 General Commentary May 2013 GDB-EAI for the month of May registered a 3.4% year-over-year ( YOY ) reduction May 2013 EAI was 126.7, a 3.4%
Alameda Health System
 Alameda Health System Status Report Long Term Financial Planning Compliance with the Permanent Agreement March 9, 2015 Dan Boggan, Jr., Interim CEO David Cox, CFO 1 AHS Monthly Report Cash, Accounts Payable,
Review of Membership Developments
 RIPE Network Coordination Centre Review of Membership Developments 7 October 2009/ GM / Lisbon http://www.ripe.net 1 Applications development RIPE Network Coordination Centre 140 120 100 80 60 2007 2008
PRESS RELEASE. Securities issued by Hungarian residents and breakdown by holding sectors. October 2018
 PRESS RELEASE 10 December 2018 Securities issued by Hungarian residents and breakdown by holding sectors October 2018 According to securities statistics, the amount outstanding of equity securities and
CERVEJAS AMERICANAS. Distributing Beer in Brazil. MIT Center for Transportation Studies Cambridge, MA & Amaxon Beer Company Miami, FL
 CERVEJAS AMERICANAS Distributing Beer in Brazil MIT Center for Transportation Studies Cambridge, MA & Amaxon Beer Company Miami, FL Matthew Burt, Sanjeev Kalanidhi, Hector Lozano, Gokhan Usanmaz and Wen
LOUISVILLE GAS AND ELECTRIC COMPANY Gas Rates 2018 Monthly Billing Adjustments
 2018 Monthly Billing Adjustments GAS LINE TRACKER CHARGES GAS LINE TRACKER CHARGES DSM (2) PER MONTH PER METER PER MONTH PER CCF TAX CUTS AND JOBS ACT $ Per CCF Firm Trans. SURCREDIT ($ per ccf) (3) GAS
Operating Reserves Educational Session Part B
 Operating Reserves Educational Session Part B Energy Market Uplift Senior Task Force September 17, 2013 Joseph Bowring Joel Romero Luna Operating Reserves Operating reserves can be grouped into five categories:
Health Connector Administrative Finance Update (VOTE)
") Health Connector Administrative Finance Update (VOTE) KARI MILLER Chief Financial Officer NUPUR GUPTA Senior Financial Analyst Board of Directors Meeting, July 12, 2018 Overview The purpose of this presentation
Health Connector Administrative Finance Update (VOTE) KARI MILLER Chief Financial Officer NUPUR GUPTA Senior Financial Analyst Board of Directors Meeting, July 12, 2018 Overview The purpose of this presentation
Asset Manager Performance Comparison
 Cape Peninsula University of Technology Retirement Fund August 2017 DISCLAIMER AND WARNINGS: Towers Watson (Pty) Ltd, a Willis Towers Watson company, is an authorised financial services provider. Although
Fiscal Year 2018 Project 1 Annual Budget
 Fiscal Year 2018 Project 1 Annual Budget Table of Contents Table Page Summary 3 Summary of Costs Table 1 4 Treasury Related Expenses Table 2 5 Summary of Full Time Equivalent Table 3 6 Positions Cost-to-Cash
Capturing equity gains whilst protecting portfolios
 Capturing equity gains whilst protecting portfolios Edward Park Q2 2018 MSCI North America Total Return in USD (2017 Discrete Calendar Months) 4.00% 3.50% 3.00% 2.50% 2.00% 1.50% 1.00% 0% 0.00% Jan-17
City of Joliet 2014 Revenue Review. October 2013
 City of Joliet 2014 Revenue Review October 2013 General Fund 2014 Est. Revenues = $163.6 M Licenses, Permits, Fees Gaming Taxes 5% 12% Sales Taxes 27% Income Taxes 9% Charges for Services 14% Other Taxes
Asset Manager Performance Comparison
 Cape Peninsula University of Technology Retirement Fund September 2017 DISCLAIMER AND WARNINGS: Towers Watson (Pty) Ltd, a Willis Towers Watson company, is an authorised financial services provider. Although