2010 ETC Institute 725 W Frontier Circle Olathe, KS /9/2010
|
|
|
- Betty James
- 5 years ago
- Views:
Transcription


1 2010 Kansas City Area Transportation Authority Onboard Survey By ETC Institute 725 W Frontier Circle Olathe, KS /9/20100
2 Table of Contents Summary... 1 Survey method... 2 Weekly use of The Metro and of MAX... 3 Purpose of trip... 4 Quality of Service... 5 Demographics... 7 Frequency of using The Metro Frequency of using MAX Cross-use of The Metro and MAX Cost/Fare Trip Purpose Mode to the bus stop Modal choice Transfers Service Ratings: The Metro and MAX Regional Call Center Expected use of The Metro and MAX next year Willingness to recommend The Metro and MAX Importance of various service improvements to all riders of The Metro Weekend service Tabular Data Survey Instrument
3 Executive Summary A survey was conducted in April 2010 on board KCATA buses. ETC Institute employees were used for data collection under the supervision of Dr. Bob Cicerone and Aaron Hekele. A total of 1,489 usable responses were collected. A total of 32 routes were includedd in the runs sampled. A similar survey was conducted in November 2007 and can be used for comparison. A similar survey was conducted in 2005 and 2002 and to a limited extent some of its results can also be compared to the current study. KCATA riders in 2010 use the bus services intensively. Three-fourths (76%) of riders on The Metro use the bus four or more days each week, and fifty-eight percent (58%) of MAX riders use MAX four or more days a week. Forty-six percent (46%) of KCATA riders in 2007 had no vehicle and were dependent upon transit, but in 2010, sixty-four percent (64%) had no vehicle. In other words, more riders in than in 2007 are dependent on transportation. The number of unemployed riders has doubled since 2007 (8% in 2007 to 16% in 2010), which given the current status of the economy is no surprise. Given this significant shift and the economic impact KCATA services have on the City it will be increasingly important to provided affordable services to KCATA users. Of riders using The Metro, seventy percent (70%), rate overall service on The Metro as excellent or very good. When compared to the mean rating reported in 2007, overall quality of service provided on The Metro increased from 7.90 in 2007 to 8.09 in Satisfaction scores for MAX continue to be extremely high. More than 75% of MAX riders score every aspect of MAX service measured in the survey as excellent or very good (an 8 or above on a scale from 1 to 10). The scores for The Metro were also good. Seventy-five percent (75%) of The Metro riders gave positive ratings to the onboard stop announcers on buses. Only sixteen percent of The Metro riders surveyed were unhappy with the cost of services. In 2007, 90% of The Metro riders, and 91% of MAX riders said they would recommend the service. Similarly, in 2010, ninety percent (90%) of MAX riders and ninety-one percent of The Metro riders would recommend the service to a friend or relative. Riders on The Metro were asked how important various services were to them. Ninety percent (90%) of the riders felt weekday service (6am-6pm) was either very important or important. Eighty-six percent felt convenient transfers between routes were very important or important. When asked which items were most important, twenty-five percent (25%) selected weekend service as one of their top three choices. ETC Institute (2010) 1


4 Survey method Surveys were conducted on board KCATA buses. ETC Institute employees distributed and collected questionnaires, working under the supervision of Dr. Bob Cicerone and Aaron Hekele. The 2010 survey expanded upon and systematized a survey approach first used by KCATA in That approach breaks down the sampled ridership into several groups of riders based on which element of service they use such as AM Express, mid-day service, rush-hour service and so forth. That approach to analysis was maintained in 2005 and 2007, and MAX was added to the service mix beginning in The surveys were conducted on random samples of runs. Surveyors rode for the duration of each run that was sampled. Their task was to hand out printed questionnaires to every rider who boarded the bus and to collect them before the passenger alighted. Surveyors were identified as such by wearing smocks which identified that they were transit surveyors. The questionnaires were printed on card stock to make completion easier. They were printed in English on one side and Spanish on the other with references to the alternate language printed at the top of each side thus enabling the respondent to choose his or her language. At the end of each run, questionnaires were collected by the supervisor and bundled into sets related to the specific run. As an added control, questionnaires were serially numbered so that the serial number could be associated with a particular run and route. Separate questionnaires (reprinted in the appendix) were used for MAX and for The Metro. However, approximately half of the questions were identical for the two surveys. Prior to the analysis on which this report is based, the data were weighted to reflect the proportions of riders on each route as determined by ridership figures provided by KCATA. The purpose of the weighting is to correct any minor distortion that might affect the proportions of data collected from the several routes sampled depending on whether there were exceptional circumstances on the days the routes were sampled that would affect the normal relative sizes of the ridership of routes. The weighting is based on the routes included in the sample. A sample of this size of 1,489, when used as a whole has a 95% probability of being accurate within a range of +/-2.5%. ETC Institute (2010) 2
 using it five days, another thirtyone percent (31%) using it six or seven days for a total of")
5 Basic Passenger Characteristics Frequency of Using The Metro and MAX. Riders were asked on how many days each week they regularly use The Metro. The predominant tendency is to use The Metro five or more days per week, with twenty-six percent (26%) using it five days, another thirtyone percent (31%) using it six or seven days for a total of fifty-seven-percent (57%) using The Metro five or more days each week. MAX is used less often than The Metro. For example of all KCATA riders thirty-four percent (34%) said they use MAX less than one day a week or not at all compared to only seven percent (7%) saying this about The Metro. Conversely, only twenty-four percent (24%) of KCATA riders said they use MAX five or more days a week compared with fiftyseven percent (57%) of all riders saying this about The Metro. Frequency of using MAX. MAX riders are also intensive users, with thirtynine percent (39%) using it five or more days a week. There is also a significant segment of the ridership (14%) who are occasional users, using MAX one day per week or less. This infrequent user segment has increased from ten percent (10%) in Such an increase may suggest a desire to go green. ETC Institute (2010) 3
6 Trip Purpose. Riders were asked to identify the main purpose of your bus trip today. Of all riders, fifty-four percent (54%) said the purpose was work-related, down slightly from 2007 (57%). The slight decrease is largely accounted for by a 4% increase in job-seeking status of the current economy. More riders indicated that they were unemployed (16% unemployed in 2010 compared to 8% in 2007) which more than likely is impacting the shift from work trips to job seeking trips and school/college trips. School/college trips increased three percent (3%) from 2007 while shopping trips decreased two percent (2%). Transfer rate. MAX riders were asked whether and how often they transfer during their trips. Of all MAX bus service riders, twentyeight percent (28%) in 2010 said they make no transfers on their trips - i.e. seventy-two percent (72%) said that they do transfer. This is slightly lower than in 2007 when thirty-three percent (33%) reported no transfers during their trip. However, the percent making three or more transfers decreased from twelve percent (12%) to nine percent (9%) in Mode to the bus stop. The increased tendency to transfer is also apparent in the slight increase in percentage from twenty-one percent (21%) in 2007 to twenty-two percent (22%) in 2010 who said they got to their bus stops from other buses. However, the percentages who were driven by someone else (from 9% to 5%) decreased. Those walking to the bus stop increased the most (63% to 67%) from The percentage driving themselves and those bicycling stayed the same. The chart on the following page compares the findings in 2007 to ETC Institute (2010) 4

7 Quality of Service KCATA bus riders were asked to rate the overall quality of MAX and The Metro service. The table displays the distribution of ratings based on a scale from one to ten which has been condensed to three categories as shown in the table. Both MAX and The Metro received positive ratings, although MAX received higher scores, as one would expect for such a unique service. From 2007 to 2010, the scores for The Metro increased by five percent (5%) among Metro users. In addition, from 2007 to 2010, the scores for MAX increased by two percent (2%) among MAX users. ETC Institute (2010) 5
8 Intent to continue using KCATA. Another way to measure customer perceptions of service is to ask whether they intend to continue using the service in the future. A high percentage (69%) of all KCATA users said they would continue using KCATA services in the future (+3% from 2007). The Metro increased by six percent (6%) from sixty-four percent (64%) to seventy percent (70%). Rating MAX. Twenty aspects of MAX service were rated by MAX users on a scale from one to ten on which ten was the most positive score. The chart shows the mean (i.e. simple average scores) for 2007 and The scores for MAX are all above eight on the scale from one to ten. This is unusually positive for any bus service and represents a real achievement by KCATA. All twenty aspects of MAX rated on the survey by MAX users increased since How real-time arrival signs work showed the largest increase (+.61), followed by; The cleanliness of the MAX stations (+.52), safety at MAX stations (+.49), and MAX buses running on schedule (+.36). No decreases were reported in The change in the performance of the realtime arrival signs suggest that such signs are very popular with and helpful to riders. The recent improvements to the functionality of these signs appear to have raised satisfaction levels among MAX bus riders. ETC Institute (2010) 6
9 Rating The Metro. Ratings of services of The Metro are also positive, though less so than for MAX. Services of The Metro are also better rated than is typical for most transit systems. Generally, scores for transit systems will include some that fall below a mean of seven on the ten point scale. All the scores for The Metro exceed eight. For 14 of the 15 aspects rated for The Metro increases were reported. The one exception is with the cost of the service. Fare increases may be the cause for the rating decline. The most significant improvements pertained to the following; the onboard stop announcer on buses (+.42), buses running on schedule (+.30), and reliability of service (+.29). Desire for service improvements. Although the ratings of current service are positive, there is always room for improvement. One possible area to improve might be with the Regional Call Center. Only forty-seven percent (47%) of all KCATA riders who had contacted the hotline gave positive ratings with regard to length of time waited. It also received the highest percentage of negative ratings (21% poor or very poor ) In addition Metro riders were asked how important various service items were to them. Ninety percent (90%) of The Metro riders felt service between the hours of 6 am and 6 pm was either very important or important. When asked which two service items were most important to them twenty-five percent (25%) of the Metro riders selected weekend service and twenty one percent (21%) selected service between 6 am and 6 pm. Demographics Age. Riders tend to be young. Approximately one-fourth (23%) are twenty-five or younger. Nearly half of the ridership is thirty-four or younger. Most transit systems in the United States have a ridership that is relatively young compared to the population. Frequently, people in the United States use transit for a period of years when they enter the workforce. As their incomes increase, they tend to buy cars and cease using transit. This is one reason why ridership tends to be young. The connection of rising income and attrition from transit use makes rider retention a very important element of marketing transit services. ETC Institute (2010) 7
10 Employment. As in 2007, riders tend to be employed (although the percent of employed dropped from seventy percent (70%) to sixty-four percent (64%), most likely due to the current economic situation); sixty-two percent (62%) say they are employed outside the home, twelve percent (12%) are students only, and two percent (2%) are employed at home. Unemployment among riders is up nearly eight percent (8%) from eight percent (8%) in 2007 to sixteen percent (16%) currently. This is double Kansas City s overall unemployment (Kansas City s overall unemployment was reported at 8.3% in May 2010). Income. Riders tend to be young. Income also tends, for most people, to rise with age (until retirement). Thus the tendency for the riders to be younger accentuates the lower income levels of the riders. One of the challenges is to retain younger riders as their incomes rise by providing them with truly excellent service. Ethnic self-identification. Riders were asked to which of several racial or ethnic groups they considered themselves to belong. The largest single group (63%) identified themselves as African-American, while the next largest group (27%) identified themselves as white. There have been no statistically significant changes in this regard since Conclusions Both The Metro and MAX have good service ratings. MAX is very popular, and received extremely high ratings. As MAX continues to grow in ridership it will be increasingly important to pay close attention to the Real-Time-Arrival signs, as these signs are very popular and have crucial functions for customer satisfaction and attraction of new riders, for when such signs function well, they help reduce the inherent uncertainties about the length of wait, and the destinations of the next bus, uncertainties the greatly inhibit new riders. The KCATA system clearly serves a major economic function for the community, carrying primarily work-trips plus a substantial number of students and job-seekers. The overall impression of riders toward KCATA service is highly positive. ETC Institute (2010) 8
11 Charts and Graphs ETC Institute (2010) 9
12 Frequency of using The Metro Currently in 2010, nearly one-fourth of Metro (21%) use The Metro routes every day, and another ten percent (10%) use them six days a week, for a total of thirty-one percent (31%) using The Metro more than just weekdays. Another forty-five percent (45%) use it four or five days a week, mostly to commute. ETC Institute (2010) 10
 to six percent (6%).")
13 Frequency of using MAX Frequency of using MAX Since 2007, the percentage of MAX riders that said they use MAX less than one day per week has declined from ten percent (10%) to six percent (6%). ETC Institute (2010) 11
 of The Metro riders use The Metro on less than one day a week, but forty percent (40%) of them use MAX less than once a week.")
14 Cross-use of The Metro and MAX Cross-use of The Metro and MAX To what extent do The Metro and MAX rider markets cross-over? In the charts below, we can see that: In 2007 only three percent (3%) of The Metro riders use The Metro on less than one day a week, but forty percent (40%) of them use MAX less than once a week. In 2010 only six percent (6%) of The Metro riders use The Metro on less than one day a week, but thirty-eight percent (38%) of them use MAX less than once a week. Many of The Metro users who do use MAX, do so only one (12%) or two (11%) days a week. Only nine percent (9%) use MAX seven days a week. ETC Institute (2010) 12
 of MAX users use The Metro less than one day a week, and fourteen percent (14%) use The Metro seven days a week.")
15 Cross-use of The Metro and MAX MAX users, in contrast, use The Metro more frequently than The Metro users use MAX. For example, fourteen percent (14%) of MAX users use The Metro less than one day a week, and fourteen percent (14%) use The Metro seven days a week. In 2007, eighteen percent (18%) of MAX users used The Metro less than one day a week, and twenty percent (20%) used The Metro seven days a week. The primary difference in MAX users' use of MAX compared to their use of The Metro is that many more MAX users use MAX five days a week (20%) presumably commuting than use The Metro that often (7%). All of this simply demonstrates that MAX riders, as one would expect, represent a clear segment within the larger KCATA service in which The Metro provides the primary level of service. ETC Institute (2010) 13
")
16 Cost/Fare ETC Institute (2010) 14
17 Trip purpose Purpose of trip Of all MAX and Metro riders, fifty seven percent (57%) said in 2005 that on the day they were surveyed they were traveling to or from work. In 2010, that percentage had declined somewhat to fifty-four percent (54%). Since ridership overall grew between 2007 and 2010, this does not necessarily mean that the absolute number of work trips declined, but only that the percentage declined. That decrease may be accounted for by the increased use of KCATA for the various other purposes shown in the chart and due to the higher number of unemployed riders. School trips and job-seeking trips increased slightly. ETC Institute (2010) 15
18 Mode to the bus stop Comparison of mode to the bus stop from 2007 and 2010 surveys The general tendencies of how riders got to their bus stops from 2005 through 2010 were similar. Each year, more people walked than transferred from other buses and more people transferred from other buses than drove. All of those relationships remain the same. However, there was one change. In 2007, nine percent (9%) indicated they were dropped off by someone else, while in 2010, five percent (5%) indicated they were dropped off. The difference involved a slightly higher transfer rate (21% in 2007 and 22% in 2010), and a higher rate of walking in 2010 (67%) than in 2007 (63%). ETC Institute (2010) 16

19 When KCATA riders began riding once a week or more 2007 & 2010 Duration of KCATA ridership Transit systems typically experience considerable turnover in their customers. Ridership generally can be divided into two major segments, short and long-term riders. Shortterm riders use transit for roughly two or three or perhaps four years, usually when they are young and lack income. Longterm riders continue riding indefinitely. Each survey asked the number of years in which the respondent had been riding once a week or more. Twenty-six percent (26%) of all riders surveyed indicated that they have used The Metro or MAX for more than 10 years; sixteen percent (16%) 6 to 10 years, twenty-six percent (26%) 3 to 5 years, twenty-one percent (21%) 1 to 2 years, and eleven percent (11%) less than one year. Modal choice / Transit dependency Riders were asked if they had any working vehicles available to them within the household, and how many licensed drivers there are in the household. The charts show the frequency distributions for both questions on the survey. ETC Institute (2010) 17
20 Transfers MAX Transfers Of all MAX riders, twenty-eight percent (28%) in 2010 and thirty-three percent (33%) in 2007 said that they do not transfer during the one-way trip they were making when they completed the questionnaire. ETC Institute (2010) 18
21 Route and Schedule Information Sources of information about KCATA How do riders obtain information about MAX and The Metro? As in 2007, most riders (57% now, and 60% in 2007) obtain information most often from printed schedules. Many (29% now and 22% in 2007) most often obtain information at the bus stops. Six percent (6%) (10% in 2007) most often use the Call Center, and six percent (6%) in each year most often use the website. ETC Institute (2010) 19
22 Use of the Metro Trip Planner Use of the Trip Planner Fifteen-percent (15%) of all riders said they use the Trip Planner at least once per week. As expected most (82%) use their cell phones once per week, fifty-four percent (54%) , forty-one percent (41%) text messages, and twenty-eight percent (28%) social networking sites like Facebook, Twitter and Myspace. A substantial number of respondents (15%) volunteered that they use the Trip Planner. ETC Institute (2010) 20

23 Service Ratings: The Metro and MAX Service Ratings, 2007 and 2010 Ratings of quality of service overall for The Metro and MAX The charts on the following pages show the rating of overall quality of service for The Metro and MAX by their riders. The ratings of overall quality of service among all of the permutations of the 2010 samples shown in the chart are highly positive, with very few negative scores, and scores primarily in the seven to ten range. The Metro Service Ratings Ratings of The Metro s services The Metro s ratings, while generally favorable, are considerably less positive than the MAX. Instead of a pattern of finding many top box percentages in the eighty percent (80%) and higher range, The Metro has no scores in that high range. The top two scores are; seventy-six percent (76%) ease of understanding printed route information, and seventy-six percent (76%) driver safety. This contrast with MAX is hardly surprising given the newness and special appeal of MAX service. ETC Institute (2010) 21
24 Ratings of The Metro s services While the ratings of The Metro services are not as positive as those of MAX, this does not mean that they are negative. More than half of The Metro s riders rated nine of the fifteen aspects of service as excellent. Cost and availability of service at needed times received the lowest mean rating among all 15 aspects rated on the survey. ETC Institute (2010) 22
 (see chart below).")
25 MAX Ratings Ratings of MAX The first thing to notice in the chart below is that all aspects of MAX service receive top Very high ratings (80%+). Ratings this high are unusual in transit studies. Only three aspects of service to fell below eighty percent (80%) (see chart below). More than ninety percent (90%) of MAX riders rate many aspects of MAX service in the eight to ten range; Availability of route and schedule info (93%), ease of identifying MAX buses (93%), ease of understanding printed route information (92%), and seat comfort on MAX buses (90%). ETC Institute (2010) 23
26 MAX Ratings 2010 and 2007 Comparing 2010 and 2007 MAX service ratings based on mean scores The chart below displays mean scores. We use mean scores here rather than percentages for two reasons. First, because they make it easier to compare the 2010 and 2007 results in graphic form. Also, the simple average, or mean, score is a measure of "central tendency." That is, it averages the entire range of scores. Unlike the "frequency distribution" approach, it does not focus on only one end of the rating scale of one to ten. Instead, it considers all scores, high and low. The mean is a useful statistic because it incorporates the lower range of scores as well as the upper range. Changes from 2007 to 2010 Although the changes are small, several are statistically significant. All of the aspects of service that changed are scored very positive with mean scores above eight on the scale of one to ten. The most significant increase pertains to; Real-Time Arrival Signs and safety at MAX stations. ETC Institute (2010) 24
 of all KCATA riders in the")
 have called between one and five times, the remaining")
27 Use of The Metro Information Line The information line The information line has been used at least once by over half (59%) of all KCATA riders in the past twelve months. Many riders (43%) have called between one and five times, the remaining (17%) have used it more frequently. ETC Institute (2010) 25
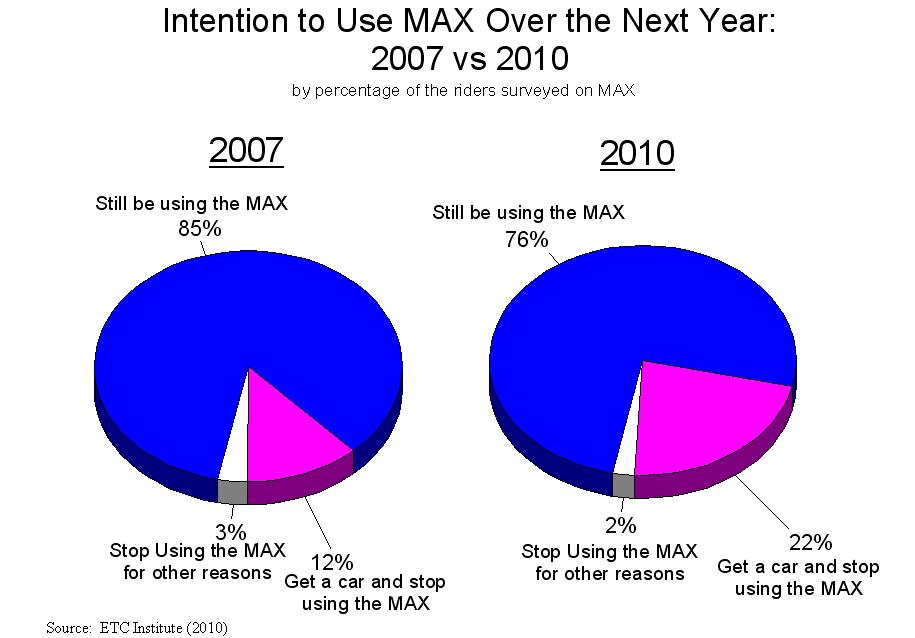
28 Intention to Use KCATA Next Year Other attitudes toward The Metro and MAX Riders were asked two other evaluative questions: What their expectations were about using transit next year. Whether they are willing to recommend The Metro or MAX The three charts below show the intention of all KCATA users, just The Metro users and just the MAX users to continue using the service over the next year. ETC Institute (2010) 26

29 ETC Institute (2010) 27
30 Willingness to Recommend ETC Institute (2010) 28
31 ETC Institute (2010) 29

32 Service Improvements Importance of various service improvements to all riders of The Metro Riders on The Metro (but not on MAX) were asked how important various services were to them. 90% feel service between the hours of 6am and 6pm is very important or important. Convenient transfers between routes was also indentified as an important service aspect by riders. ETC Institute (2010) 30

33 Weekend service Earlier hour of service desired Riders expressed a desire for weekend service by selecting it most frequently as one of their top two choices with regard to service. Service between the hours of 6am and 6pm was the second most important service to riders, followed by shelters at bus stops and service after 6pm. ETC Institute (2010) 31
34 Tabular Data ETC Institute (2010) 32
35 Is this an Express Route? Express Route Number Percent 1=Yes % 2=No % 3=MAX % Total % WEIGHTED SAMPLE What TIME is it? What time is it? Number Percent 0=Metro Express AM % 1=4-6am % 2=6-9am % 3=9am-4pm % 4=4-6pm % 5=6pm-1am % 6=MAX % Total % ALL RIDERS In a typical week how many days do you use The Metro? In a week number times use The Metro Number Percent 0=not regular ride % 1= % 2= % 3= % 4= % 5= % 6= % 7= % Total % ETC Institute (2010) 33
36 THE METRO RIDERS ONLY In a typical week how many days do you use The Metro? In a week number times use The Metro Number Percent 0=not regular ride % 1= % 2= % 3= % 4= % 5= % 6= % 7= % Total % MAX RIDERS ONLY In a typical week how many days do you use The Metro? In a week number times use The Metro Number Percent 0=not regular ride % 1= % 2= % 3= % 4= % 5= % 6= % 7= % Total % ETC Institute (2010) 34
37 ALL RIDERS How many days per week, if at all, do you use The Metro's MAX Bus Rapid Transit service? Number days/week do you use MAX bus Number Percent 0=none % 1= % 2= % 3= % 4= % 5= % 6= % 7= % Total % THE METRO RIDERS ONLY How many days per week, if at all, do you use The Metro's MAX Bus Rapid Transit service? Q2 Number days/week do you use MAX bus Number Percent 0=none % 1= % 2= % 3= % 4= % 5= % 6= % 7= % Total % MAX RIDERS ONLY How many days per week, if at all, do you use The Metro's MAX Bus Rapid Transit service? Number days/week do you use MAX bus Number Percent 0=none % 1= % 2= % 3= % 4= % 5= % 6= % 7= % Total % ETC Institute (2010) 35
38 ALL RIDERS How many years have you used The Metro or MAX at least once a week? Number years used Metro once a week Number Percent 1=less than 1 year % 2=1-2 years % 3=3-5 years % 4=6-10 years % 5=11-15 years % 6=16-20 years % 7=21+ years % 9=Not sure % Total % ETC Institute (2010) 36
39 ALL RIDERS How did you get to the stop where you got ON this Metro/MAX bus? How d did you get to stop where got on Number Percent 1=Walked % 2=Biked % 3=Was driven by someone % 4=Transferred from another bus % 5=Drove a car % Total % MAX RIDERS ONLY How did you get to the stop where you got ON this Metro/MAX bus? How d did you get to stop where got on Number Percent 1=Walked % 2=Biked % 3=Was driven by someone % 4=Transferred from another bus % 5=Drove a car % Total % ETC Institute (2010) 37
40 ALL RIDERS How did you pay the fare on the first bus you used today? How did you pay on 1st bus used today Number Percent 1=Monthly Pass % 2=3 Day Visitor Pass % 3=Metro Day Pass % 4=Change Card % 5=Cash Fare % 6=1-Ride Pass % Total % ALL RIDERS The most important PURPOSE of your bus trip today is to get to/from which of the following locations? Purpose get to/from what location Number Percent 1=Work % 2=School/College % 3=Shopping % 4=Job seeking % 5=Social/Recreation % 6=Health/Medical % Total % Other Other AND BACK HOME ANTIOCH SHOPPING CTR ANTIOCH SHOPPING CTR BANK BAR BUSINESS BUSINESS BUSINESS BUSINESS BUSINESS CHURCH CHURCH CHURCH CHURCH CITY HALL CITY HALL COMMUNITY SERVICE COMMUNITY SERVICE CONVENTION ETC Institute (2010) 38
41 Other Other COURT COURT COURT DOCTOR FILE TAXES FRIEND GET DAUGHTER TO SCH GO TAKE CARE OF DAD HOME HOME HOME HOME HOME HOME HOME JURY DUTY JUST RIDING JUST RIDING JUST RIDING KIDS SCHOOL LIBRARY FOR WORK LIBRARY FOR WORK LIBRARY FRIEND LOOK AT LAWNMOWERS LOOK AT LAWNMOWERS MEETING DAUGHTER MOMS MOTHERS HOUSE NEW ID NEW ID NURSING HOME PAN HANDLING PAN HANDLING PERSONAL PERSONAL PERSONAL BUSINESS PERSONAL BUSINESS PERSONAL BUSINESS PERSONAL BUSINESS RECOVERY MEETINGS RECOVERY MEETINGS RESTAURANT SCHOOL TO WORK SKATEBOARD TREATMENT TREATMENT TREATMENT VISIT FAMILY VISIT FRIENDS VISTING VISTING VOLUNTEER WORK ETC Institute (2010) 39
42 ALL RIDERS Are you a resident of the Kansas City area? Are you a resident of the KC area Number Percent 1=Yes % 2=No % Total % ALL RIDERS A year from now will you: (excluding no response) A year from now will you? Number Percent 1=still be using The Metro % 2=not be using The Metro because you plan to get a car % 3=not be using The Metro for other reasons % Total % THE METRO RIDERS ONLY A year from now will you: (excluding no response) A year from now will you? Number Percent 1=still be using The Metro % 2=not be using The Metro because you plan to get a car % 3=not be using The Metro for other reasons % Total % MAX RIDERS ONLY A year from now will you: (excluding no response) A year from now will you? Number Percent 1=still be using The Metro % 2=not be using The Metro because you plan to get a car % 3=not be using The Metro for other reasons % Total % ETC Institute (2010) 40
43 ALL RIDERS 2010 KCATA Onboard Survey Would you recommend The Metro/MAX to a friend or relative? (excluding no response) Would you recommend to friend/relative Number Percent 1=Yes % 2=No % 9=Don't know % Total % THE METRO RIDERS ONLY Would you recommend The Metro to a friend or relative? (excluding no response) Would you recommend to friend/relative Number Percent 1=Yes % 2=No % 9=Don't know % Total % MAX RIDERS ONLY Would you recommend MAX to a friend or relative? (excluding no response) Would you recommend to friend/relative Number Percent 1=Yes % 2=No % 9=Don't know % Total % Q10. Circle ALL of the items listed below that you use at least once per week. Q10 What you use at least once a week Number Percent 1=cell phone % 2= % 3=social networking sites % 4=The Metro's trip planner % 5=The Metro's website % 6=Google Transit % 7=text messages % 8=mobile applications for an iphone or blackberry % Total 3741 ETC Institute (2010) 41
44 METRO RIDERS ONLY How do you rate The Metro service based on the following items? (excluding no response) Q11 Overall quality of bus service 1.4% 0.5% 1.1% 2.5% 6.5% 8.7% 9.8% 18.6% 17.2% 33.6% Q12 Convenience of the service 1.6% 0.9% 1.9% 2.9% 7.1% 6.7% 11.8% 16.6% 16.7% 33.6% Q13 Busses running on schedule 2.7% 1.6% 1.8% 3.6% 6.2% 8.3% 11.4% 17.7% 15.4% 31.2% Q14 Cost 4.7% 3.8% 4.2% 3.1% 6.8% 6.5% 8.4% 15.5% 14.9% 32.1% Q15 Availability at time you need it 2.0% 2.1% 3.6% 3.8% 6.4% 8.7% 11.2% 16.2% 14.1% 31.9% Q16 Ease of transferring 1.0% 0.8% 1.2% 2.2% 6.7% 7.2% 11.4% 17.6% 15.5% 36.4% Q17 Reliability of service 1.3% 1.1% 1.0% 2.8% 5.7% 6.4% 10.1% 16.2% 18.9% 36.3% Q18 Comfort of the buses 1.7% 1.0% 1.4% 3.5% 8.8% 7.0% 10.9% 15.5% 15.2% 34.9% Q19 Driver safety 1.4% 0.5% 1.2% 1.3% 3.9% 6.0% 9.7% 14.3% 18.0% 43.7% Q20 Convenience of transit centers 2.0% 0.8% 2.0% 2.6% 6.1% 8.4% 10.8% 15.4% 14.4% 37.4% Q21 Courtesy of Metro drivers 2.9% 0.6% 1.9% 3.5% 4.1% 5.3% 11.0% 14.0% 16.0% 40.6% Q22 Availability route & schedule infor 1.3% 0.4% 1.5% 1.9% 4.8% 6.2% 10.5% 14.6% 18.2% 40.6% Q23 Ease of understanding printed infor 0.4% 0.5% 1.2% 1.3% 4.8% 5.1% 10.5% 14.9% 16.9% 44.4% Q24 The on board stop announcer on bus 1.4% 0.8% 0.4% 1.9% 5.2% 6.3% 9.7% 15.0% 15.7% 43.8% Q25 Cleanliness of The Metro vehicles 2.8% 0.9% 1.7% 4.0% 5.8% 8.4% 11.2% 16.3% 13.8% 34.9% ETC Institute (2010) 42
45 METRO RIDERS ONLY How do you rate The Metro service based on the following items? (excluding no response) Mean Total Q11 Overall quality of bus service Q12 Convenience of the service Q13 Busses running on schedule Q14 Cost Q15 Availability at time you need it Q16 Ease of transferring Q17 Reliability of service Q18 Comfort of the buses Q19 Driver safety Q20 Convenience of transit centers Q21 Courtesy of Metro drivers Q22 Availability route & schedule infor Q23 Ease of understanding printed infor Q24 The on board stop announcer on bus Q25 Cleanliness of The Metro vehicles ETC Institute (2010) 43
46 If you have had any problems with any of the items listed in Questions 11-25, please explain: If prob #13 SHOULD RUN 24/7 #13 SHOULD RUN 24/7 12&15 THIS BUS ONLY RUNS EVERY TWO HOURS 24 INDEP SHOULD RUN EVERY 30 MINS AND LATER IN EVENING 54 DID NOT PICK ME UP AT PASEO 4/12 6:00PM A LOT OF TRASH/SPILLED DRINKS A LOT OF TRASH/SPILLED DRINKS ARROW PASEO DOESN'T RUN ENOUGH ARROW PASEO DOESN'T RUN ENOUGH BAD CUSTOMER SERVICE BAD DRIVERS BAD DRIVERS BUS 47 SKIPPING STOPS BUS 47 SKIPPING STOPS BUS DRIVERS TEXTING BUS DRIVERS TEXTING BUS SEAT -VERY DUSTY & DIRTY BUSES MISS EACH OTHER ALL THE TIME, STOP COMING EARLY BUSES NEED TO BE CLEANED MORE OFTEN BUSES RUN EARLIER THAN THEY ARE SUPPOSED TO BUSES SOMETIMES RUN EARLY BUSES SPACED OUT SO IF MISS TAKE LONG TIME BUSES SPACED OUT SO IF MISS TAKE LONG TIME CLEANER BUSES COST AND TIME COST IS TOO HIGH! COST IS TOO HIGH! DRIVER DRIVER DRIVER WAS MEAN ONE TIME DRIVER WAS MEAN ONE TIME DRIVERS NEVER STOP WHEN YOU NEED TO GO TO ANOTHER BUS DRIVERS NEVER STOP WHEN YOU NEED TO GO TO ANOTHER BUS DRIVERS PASSING WHEN TRANSFER DRIVERS PASSING WHEN TRANSFER DRIVERS UNFRIENDLY DRUNKS DRUNKS EVERYTHING LISTED GETTING COMPREHENSIVE SCHEDULE IS IMPOSSIBLE HAD SOME SNOTTY DRIVERS & NEED MORE BUSES HAT IT WHEN BUS COMES EARLY I AM A TALL GUY CRAMMED INTO A SMALL SEAT I DON'T SEE A LOT OF TRANSIT CENTERS I HAD TO SIT ON A WET SEAT ON MY WAY TO WORK INFO CENTER CLOSES EARLY AND ON WEEKENDS KEEP 24TH ST & HARDESTY ST SHELTER CLEANER LOUD TALKING, CURSING, CELL PHONES, DRUNKS NEED BETTER ROUTES FOR EVENINGS NEED TO CLEAN BUSES BETTER NEED TO CLEAN BUSES ON DAILY BASIS ETC Institute (2010) 44
47 If you have had any problems with any of the items listed in Questions 11-25, please explain: If prob NEWER BUSES ARE MORE COMFORTABLE NIGHT BUS DRIVERS ARE MEAN NO NO NO SATURDAY SERVICE ON #251 NO SO POLITE DRIVERS NO SUNDAY SERVICE NOISE THE BUS MAKES NOISE THE BUS MAKES NOT ENOUGH BUS ROUNTES IN GLADSTONE NOT ENOUGH SERVICE IN INDEPENDENCE NOT ENOUGH SERVICE NORTH OF THE RIVER NOT ENOUGH SERVICE NORTH OF THE RIVER NOT ENOUGH SPANISH FOR MY CLIENTS NOT ENOUGH SPANISH FOR MY CLIENTS NOT STRAPPED DOWN NOT STRAPPED DOWN ON BOARD ANNOUNCEMENTS ARE ANNOYING TO REGULAR RIDERS ON BOARD ANNOUNCEMENTS ARE ANNOYING TO REGULAR RIDERS OVERCROWDING OVERCROWDING POOR ATTITUDES OF MOST DRIVERS REDUCED FREQUENCY DURING THE DAY REDUCED FREQUENCY DURING THE DAY RUDE BUS DRIVERS RUDE DRIVER RUDE DRIVERS-ABUSIVE RUDENESS OF DRIVER RUDENESS OF DRIVER SOME ARE RUDE SOME BUS DRIVERS ARE NOT COURTEOUS SOME BUS OPERATORS ARE VERY RUDE SOME BUSES NEED TO RUN LONGER SOME DRIVERS NEED ATTITUDE COURSES SOME DRIVERS NEED TO BE TRAINED SOME DRIVERS NEED TO BE TRAINED SOME DRIVERS WILL LEAVE YOU IF YOU ARE WALKING SLOWLY SOME OF HTE BUS DRIVERS ARE NOT NICE SOME OF HTE BUS DRIVERS ARE NOT NICE SOME RUDE DRIVERS SOMETIMES BUSES DON'T RUN SOMETIMES DRIVERS ARE RUDE OR UPSET SOMETIMES DRIVERS LURCH MORE THAN SEEMS NECESSARY sometimes comes earlier SUDDEN STOPS-INJURY NO LIABILITY THE BUS DOESN'T GO TO MY HOUSE THE BUS IS NEVER ON TIME THE PEOPLE MAKE THE BUS BAD THE SEATS ARE HARD AND THE BUSES ARE DIRTY THERE NEEDS TO BE BUS STOPS IN GRANDVIEW THIS BUS STINKS! ETC Institute (2010) 45
48 How often have you called The Metro's information line during the past year? (excluding no response) Times you called Metro info last yr Number Percent 00=Never % 1= % 2= % 3= % 4= % 5= % 6= % 7= % 8= % 9= % 10= % Total % ETC Institute (2010) 46
49 ALL RIDERS If you have called the information line, please rate the following: (excluding no response) Q27 Time waited to talk to someone 8.4% 2.4% 4.5% 6.0% 12.7% 7.4% 11.9% 13.8% 11.7% 21.1% Q28 Courtesy/professionalism of employee 5.0% 2.4% 1.6% 4.0% 8.3% 5.2% 10.8% 17.8% 15.9% 28.9% Q29 Ability to resolve your issue 3.1% 2.0% 2.0% 4.1% 6.2% 5.7% 9.0% 16.8% 16.0% 35.2% Q30 Accuracy of information provided 3.3% 1.1% 1.8% 2.3% 5.4% 6.8% 8.1% 15.1% 15.9% 40.5% Q31 Responsiveness to your needs 3.7% 1.9% 1.4% 3.5% 5.6% 7.5% 9.5% 17.1% 16.5% 33.4% Q32 Quality service provided-info line 3.8% 1.4% 1.2% 2.6% 5.4% 7.3% 9.7% 15.6% 14.4% 38.6% ETC Institute (2010) 47
50 What was the reason you called the Information Line? (excluding no response) Reason you called information line Number Percent 1=Information % 2=Complaint % 3=Other % Total % Other Other BE LATE BE LATE BE LATE BUSE ROUTES BUSE ROUTES BUSE ROUTES CAN'T RECALL COURT COURT LEFT ITEM LOST A BOOK BAG LOST AND FOUND LOST AND FOUND LOST BILLFOLD LOST ITEM LOST ITEM LOST KEYS LOST PERSONAL ITEM MISSING KEYS MISSING PHONE TWICE NO BUS REROUGH SCHEDULE SCHEDULE OF ROUTES SCHEDULE OF ROUTES ETC Institute (2010) 48
51 ALL RIDERS Where do you get most of your route and schedule information? Where do you get route/schedule information Number Percent 1=Printed schedules % 2=Bus stop % 3=Call the regional call center/information line % 4=The Metro's website % 5=Other % Total % Other Other 12/LOCUST FEDERAL BLDG ASK QUESTIONS BUS DRIVER COMPUTER/ONLINE COMPUTER/ONLINE DRUG STORE FEDERAL BUILDING FRIEND GOOGLE TRANSIT GOOGLE TRANSIT GOOGLE TRANSIT GOOGLE TRANSIT INVENT METRO PAD-NO PAPER JUST KNOW FROM RIDING JUST KNOW FROM RIDING LIBRARY LIBRARY LIBRARY LIBRARY LIBRARY OCCASIONALLY OTHER PEOPLE OCCASIONALLY OTHER PEOPLE ON ROUTE OTHER RIDERS OTHER RIDERS WORK WORK YEARS OF RIDING THE BUS ETC Institute (2010) 49
52 METRO RIDERS ONLY How important are the following services? (excluding no response) Q35 Weekend service (Sat & Sun) 4.2% 1.6% 2.2% 2.7% 4.0% 3.2% 6.1% 7.2% 13.9% 55.0% Q36 Service before 6AM in the morning 6.6% 1.4% 2.0% 3.1% 5.6% 5.8% 5.5% 7.7% 12.4% 49.9% Q37 Service between 6AM and 6PM 1.3% 0.4% 0.7% 0.7% 3.1% 3.9% 5.0% 9.4% 10.1% 65.4% Q38 Service after 6PM in the evening 3.6% 0.5% 1.7% 2.8% 4.2% 4.8% 5.8% 10.7% 10.6% 55.3% Q39 Improvements to the condition of bus 3.0% 0.7% 1.1% 2.4% 5.7% 5.8% 9.7% 13.1% 11.2% 47.3% Q40 Shelters at bus stops 2.3% 1.2% 2.4% 3.0% 3.8% 4.6% 7.4% 9.8% 11.3% 54.1% Q41 Convenient transfers between routes 2.0% 0.3% 1.1% 1.8% 4.2% 4.8% 7.3% 10.3% 9.9% 58.2% Which of the services listed in Questions are most important to you? (Top 2) Q42 Most important Number Percent 35=Weekend service (Sat & Sunday) % 36=Service before 6am in the morning % 37=Service between 6am and 6pm % 38=Service after 6pm in the evening % 39=Improvements to the condition of buses % 40=Shelters at bus stops % 41=Convenient transfers between routes % 99= % Total 2334 ETC Institute (2010) 50
53 Including YOU, how many licensed drivers live in your household? How many licensed drivers in house Number Percent 0= % 1= % 2= % 3= % 4=4 or more % Total % Do you have a working car or other vehicle that you could have used for this trip instead of taking the bus today? (excluding no response) Could you have driven car Number Percent 1=Yes % 2=No % Total % What is your age? What is your age? Number Percent Not provided % Under % % % % % % % Total % Are you male or female? Your gender Number Percent 1=Male % 2=Female % Total % ETC Institute (2010) 51
54 Which of these BEST describes your level of education? What is your level of education Number Percent 1=Less than Highschool % 2=Highschool Diploma % 3=2 yr College % 4=4 yr College % 5=Graduate Degree % Total % Which of these BEST describes your race/ethnicity? Race/Ethnicity Number Percent 1=African/American % 2=Native American % 3=Asian % 4=Hispanic % 5=White % 6=Other % Total % Are you? Are you? Number Percent 1=Employed outside your home % 2=Employed at your home % 3=Student % 4=Homemaker % 5=Retired % 6=Unemployed % Total % Which of the following BEST describes your household's total annual income? Annual income Number Percent 1=$0-$19, % 2=$20,000-$29, % 3=$30,000-$39, % 4=$40,000-$49, % 5=$50,000-$69, % 6=$70,000-$99, % 7=$100,000 or more % Total % ETC Institute (2010) 52
55 MAX QUESTION ONLY How many times, if any, do you have to change buses to get where you are going on this one-way trip? MAX Only How many times to you change buses Number Percent 0= % 1= % 2= % 3=3 or more % Total % ETC Institute (2010) 53
56 MAX QUESTION ONLY How do you rate MAX service based on the following items? MAX ONLY(excluding no response) Q12 Quality of Metro bus other than MAX 0.0% 0.7% 0.7% 1.5% 4.5% 5.2% 7.5% 17.9% 16.4% 45.5% Q13 Quality of MAX service 0.7% 0.0% 0.0% 0.7% 2.2% 2.2% 8.0% 19.6% 27.5% 39.1% Q14 Convenience of MAX service 1.5% 0.0% 0.7% 0.7% 1.5% 1.5% 6.0% 17.9% 30.6% 39.6% Q15 MAX buses running on schedule 0.7% 0.0% 0.7% 0.7% 2.2% 3.7% 8.1% 22.1% 23.5% 38.2% Q16 Cost of MAX service 1.5% 2.3% 0.0% 1.5% 1.5% 4.6% 4.6% 26.0% 20.6% 37.4% Q17 Availability at time you need it 1.5% 0.0% 0.0% 3.7% 1.5% 3.7% 5.1% 16.2% 25.0% 43.4% Q18 Ease of transferring 0.8% 0.0% 0.0% 0.8% 6.3% 3.1% 13.3% 15.6% 26.6% 33.6% Q19 Reliability of service 0.7% 0.0% 0.0% 0.0% 2.2% 1.5% 10.2% 13.1% 32.1% 40.1% Q20 Seat comfort on MAX buses 0.8% 0.0% 0.0% 0.0% 2.3% 1.5% 5.3% 18.8% 21.1% 50.4% Q21 Driver safety 1.5% 0.0% 0.0% 0.0% 0.7% 3.7% 8.1% 14.0% 22.1% 50.0% Q22 Courtesy of MAX drivers 1.5% 0.0% 0.0% 1.5% 1.5% 2.2% 9.6% 14.8% 19.3% 49.6% Q23 Availability route & schedule infor 0.7% 0.0% 0.0% 0.0% 0.7% 1.5% 4.4% 16.1% 26.3% 50.4% Q24 Ease of understanding printed infor 0.7% 0.0% 0.0% 0.0% 0.7% 2.9% 3.7% 18.4% 17.6% 55.9% Q25 The on board stop announcer on bus 0.8% 0.0% 0.8% 1.5% 2.3% 3.1% 6.9% 13.7% 23.7% 47.3% Q26 Smoothness of MAX ride 0.7% 0.0% 0.7% 2.9% 5.1% 5.8% 8.8% 11.7% 21.2% 43.1% ETC Institute (2010) 54
57 MAX QUESTION ONLY How do you rate MAX service based on the following items? MAX ONLY(excluding no response) Q27 Cleanliness of the MAX vehicles 0.7% 0.7% 0.0% 0.0% 0.0% 6.7% 9.6% 9.6% 21.5% 51.1% Q28 Safety at MAX stations 0.8% 0.0% 0.0% 1.5% 0.0% 5.3% 9.1% 14.4% 17.4% 51.5% Q29 How well real-time arrive signs work 1.5% 0.7% 0.0% 0.7% 2.2% 3.7% 8.1% 9.6% 25.9% 47.4% Q30 Cleanliness of MAX stations 1.5% 0.0% 0.0% 2.2% 1.5% 3.6% 7.3% 17.5% 22.6% 43.8% Q31 Convenience of transit centers 0.8% 0.8% 0.0% 2.4% 1.6% 4.8% 10.4% 10.4% 19.2% 49.6% Q32 Ease of identifying MAX buses 0.7% 0.0% 0.0% 0.0% 0.0% 3.0% 3.7% 5.2% 11.9% 75.6% How do you rate MAX service based on the following items? MAX ONLY(excluding no response) Mean Total Q12 Quality of Metro bus other than MAX Q13 Quality of MAX service Q14 Convenience of MAX service Q15 MAX buses running on schedule Q16 Cost of MAX service Q17 Availability at time you need it Q18 Ease of transferring Q19 Reliability of service Q20 Seat comfort on MAX buses Q21 Driver safety Q22 Courtesy of MAX drivers Q23 Availability route & schedule infor Q24 Ease of understanding printed infor Q25 The on board stop announcer on bus Q26 Smoothness of MAX ride Q27 Cleanliness of the MAX vehicles Q28 Safety at MAX stations Q29 How well real-time arrive signs work Q30 Cleanliness of MAX stations Q31 Convenience of transit centers Q32 Ease of identifying MAX buses ETC Institute (2010) 55
58 Survey Instrument ETC Institute (2010) 56
59 El cuestionario está impreso en español al dorso To help us improve our service, please take a few minutes to complete this important survey. What ROUTE are you currently on? Is this an Express Route? YES NO What TIME is it? 4-6am 6-9am 9am-4pm 4-6pm 6pm-1am 1. In a typical week how many days do you use The Metro? not a regular rider/just started 2. How many days per week, if at all, do you use The Metro's MAX Bus Rapid Transit service? none 3. How many years have you used The Metro at least once a week? less than How did you get to the stop where you got ON this Metro bus? (1) Walked (3) Was driven by someone (5) Drove a car (2) Biked (4) Transferred from another bus 5. How did you pay the fare on the first bus you used today? (1) Monthly Pass (3) Metro Day Pass (5) Cash fare (2) 3-day visitor Pass (4) Change card (6) 1-ride Pass 6. The most important PURPOSE of your bus trip today is to get to/from which of the following locations? (1) Work (3) Shopping (5) Social/Recreation (2) School/college (4) Job Seeking (6) Health/Medical (7) Other: 7. Are you a resident of the Kansas City area? (1) yes (2) no 8. A year from now will you: (1) still be using The Metro (2) not be using The Metro because you plan to get a car (3) not be using The Metro for other reasons 9. Would you recommend The Metro to a friend or relative? (1) yes (2) no 10. Circle ALL of the items listed below that you use at least once per week? (1) cell phone (2) (3) social networking sites (Facebook, Twitter, My Space, etc.) (4) The Metro s trip planner ( (5) The Metro s website ( for information (6) Google Transit (7) text messages (8) mobile applications for an iphone or blackberry How Do You Rate The Metro Service? Excellent Poor 11. Overall quality of bus service 12. Convenience of the service 13. Buses running on schedule 14. Cost Availability of service at the time of 15. day you need it 16. Ease of transferring 17. Reliability of service 18. Comfort of the buses 19. Driver safety 20. Convenience of transit centers 21. Courtesy of Metro drivers Availability of route and schedule 22. information Ease of understanding printed 23. route and schedule information The on-board stop announcer on 24. the Metro buses 25. Cleanliness of The Metro vehicles 26. If you have had any problems with any of the items listed above, please explain below: Information Line & Sources of Information 27. How often have you called the Metro s information line during the past year? 0-Never If you have called the Information line, please rate the following: Excellent Poor Length of time you had to wait to 27. speak with someone Courtesy and professionalism 28. of the employees Ability of employees to answer 29. your question/resolve your issue Accuracy of the information 30. provided The responsiveness of 31. employees to your needs Overall quality of service 32. provided by the information line 33. What was the reason you called the Information Line? (1) Information (2) Complaint (3) Other:: 34. Where do you get most of your route and schedule information? (1) Printed schedules (2) Bus stop (3) Call the regional call center/information line (4) The Metro s website (5) Other: How Important Are These Services? VERY NOT 35. Weekend service (Sat & Sunday) 36. Service before 6am in the morning 37. Service between 6am and 6pm 38. Service after 6pm in the evening Improvements to the condition of 39. buses 40. Shelters at bus stops Convenient transfers between 41. routes 42. Which of the services listed above in Q35-41 are most important to you? Write the numbers that corresponds to your top 2 choices below. 1 st : 2 nd : Information About You 43. Including YOU, how many licensed drivers live in your household? or more 44. Do you have a working car or other vehicle that you could have used for this trip instead of taking the bus today? (1) yes (2) no 45. What is your age? years 46. Are you male or female? (1) male (2) female 47. Which of these BEST describes your level of education? (1) less than high school (3) 2-Yr college (5) Graduate degree (2) High school diploma (4) 4-Yr college 48. Which of these BEST describe your race/ethnicity?? (1) African/American (3) Asian (5) White (2) Native American (4) Hispanic (6) Other 49. Are you? (circle all that apply) (1) Employed outside your home (2) Employed at your home (3) Student (4) Homemaker (5) Retired (6) Unemployed 50. Which of the following BEST describes your household s total annual income? (1) $0- $19,999 (4) $40,000-$49,999 (6) $70,000-$99,999 (2) $20,000- $29,999 (5) $50,000-$69,999 (7) $100,000 or more (3) $30,000- $39,999 Optional: If you would be willing to participate in future focus groups and/or surveys, please provide your name & phone number: Your Name: ETC Institute (2010) Phone: 57
ONBOARD ORIGIN-DESTINATION STUDY
 REPORT ONBOARD ORIGIN-DESTINATION STUDY 12.23.2014 PREPARED FOR: ANCHORAGE METROPOLITAN AREA TRANSPORTATION SYSTEM (AMATS) 55 Railroad Row White River Junction, VT 05001 802.295.4999 www.rsginc.com SUBMITTED
Customers experience of the Tax Credits Helpline
 Customers experience of the Tax Credits Helpline Findings from the 2009 Panel Study of Tax Credits and Child Benefit Customers Natalie Maplethorpe, National Centre for Social Research July 2011 HM Revenue
2013 Triennial Customer Survey Results
 2013 Triennial Customer Survey Results Board of Directors May 1, 2014 Objectives Determine who our customers are Demographics Trip purpose Mode of access Frequency of use Reasons for riding Measure whether
2017 Paratransit Customer Satisfaction Study Access-A-Ride
 2017 Paratransit Customer Satisfaction Study Access-A-Ride Final Report Prepared for: Prepared by: Date: February 2018 0 Table of Contents Headlines... 3 Background & Objectives... 6 Methodology... 7 Key
Virginia Railway Express Annual Customer Survey Customer Opinion Survey Results
 Virginia Railway Express Annual Customer Survey 2017 Customer Opinion Survey Results 1. What train do you normally take in the evening? Train Responses % of Total Manassas 325 (Departs Union Station at
2016 Q4 CUSTOMER SATISFACTION SURVEY
 2016 Q4 CUSTOMER SATISFACTION SURVEY Quarterly Report PREPARED IN PARTNERSHIP WITH: TABLE OF CONTENTS Methodology 3 Executive Summary 4 Summary of Findings 6 Key Drivers by Mode 27 Individual Measures
2008 Cecil County Public Opinion Survey Results Summary
 Cecil County Public Opinion Survey Results Summary Survey completed by Public National Research Center Inc. Report created by WILMAPCO September www.wilmapco.org September 29, About the Survey PURPOSE
2013 STA Passenger Survey Results. Attachment E Title VI Attachment E
 2013 STA Passenger Survey Results Attachment E 1 2014 Title VI Attachment E 2013 STA Passenger Survey Results Overview Spokane Transit Authority (STA) conducted its most recent passenger survey in December
Heartland Monitor Poll XXI
 National Sample of 1000 AMERICAN ADULTS AGE 18+ (500 on landline, 500 on cell) (Sample Margin of Error for 1,000 Respondents = ±3.1% in 95 out of 100 cases) Conducted October 22 26, 2014 via Landline and
Demographic Survey of Texas Lottery Players 2011
 Demographic Survey of Texas Lottery Players 2011 December 2011 i TABLE OF CONTENTS List of Figures... ii List of Tables... iii Executive Summary... 1 I. Introduction and Method of Analysis... 5 II. Sample
SURVEY OF POTENTIAL OVERNIGHT SERVICE PASSENGERS 1/30/17 OPMI
 SURVEY OF POTENTIAL OVERNIGHT SERVICE PASSENGERS 1/30/17 OPMI Survey Background & overview In March 2016, the FMCB ended Late Night service In Fall 2016, the FMCB directed staff to conduct a survey and
2006 MEMBER SATISFACTION SURVEY
 2006 MEMBER SATISFACTION SURVEY Prepared for: Teacher Retirement System of Texas By: Samantha Durst Paul Ruggiere James Glass Survey Research Center University of North Texas May 23, 2006 TABLE OF CONTENTS
PERSONAL FINANCIAL SURVEY
 PERSONAL FINANCIAL SURVEY 2004 2004 JUMP$TART QUESTIONNAIRE (Mean score=52.3%. Scores are in bold type. *Indicates correct answer) 1. If each of the following persons had the same amount of take home pay,
Medicaid and PeachCare for Kids Member Survey: Customer Service Satisfaction. Fall Prepared for ACS. By the Georgia Health Policy Center
 Medicaid and PeachCare for Kids Member Survey: Customer Service Satisfaction Prepared for ACS By the Georgia Health Policy Center CONTENTS EXECUTIVE SUMMARY... 2 BACKGROUND... 5 METHODOLOGY... 7 Sample...
Arvada, Colorado. Citizen Survey. Report of Results October Prepared by:
 Arvada, Colorado Citizen Survey Prepared by: 2955 Valmont Road Suite 300 Boulder, Colorado 80301 t: 303-444-7863 f: 303-444-1145 www.n-r-c.com Prepared by National Research Center, Inc. Arvada Citizen
For reference, the following is the full text of the concept as tested with respondents.
 KEY: Concept For reference, the following is the full text of the concept as tested with respondents. In today s healthcare system, patients often have to wait several days, or even weeks, to see physician
Marketing to New Residents
 TRANSPORTATION RESEARCH RECORD 1402 43 Cost-Effectiveness of Direct Mail Marketing to New Residents CAROL PEDERSEN AMBRUSO In January 1989 the Tri-County Metropolitan Transportation District of Oregon
The Potential for Shared Use Mobility in Affordable Housing Complexes in Rural California
 The Potential for Shared Use Mobility in Affordable Housing Complexes in Rural California A Research Report from the University of California Institute of Transportation Studies Susan Pike, Ph.D., Post-Doctoral
PASSENGER HANDBOOK. Cody Roggatz Transportation Director City of Aberdeen
 1 P u b l i c T r a n s p o r t a t i o n A B E R D E E N R I D E L I N E PASSENGER HANDBOOK Effective: May 1999 R e v i s e d : M a r c h 2 0 1 6 T r a n s i t S y s t e m S p o n s o r e d b y t h e
2018 Budget Planning Survey General Population Survey Results
 2018 Budget Planning Survey General Population Survey Results Results weighted to ensure statistical validity to the Leduc Population Conducted by: Advanis Inc. Suite 1600, Sun Life Place 10123 99 Street
Loans: Banks or credit unions can loan you money. You pay the money back a little at a time. They charge you interest for the loan.
 Basic Banking Services and Checking Accounts Intermediate MATERIALS What Can a Bank Do for You? Lesson 1: Introduction to Banking Services Worksheet 1-1 page 1 Beginner & Low- What Can a Bank Do for You?
2005 Health Confidence Survey Wave VIII
 2005 Health Confidence Survey Wave VIII June 30 August 6, 2005 Hello, my name is [FIRST AND LAST NAME]. I am calling from National Research, a research firm in Washington, D.C. May I speak to the youngest
The National Citizen Survey
 C I T Y O F E L K G R O V E, C A 2011 Supplemental Web Survey Results 3005 30th Street 777 North Capitol Street NE, Suite 500 Boulder, CO 80301 Washington, DC 20002 ww.n-r-c.com 303-444-7863 www.icma.org
City of San Rafael: 2011 City Satisfaction Survey Topline Report March 2011
 Godbe Research City of San Rafael: 2011 City Satisfaction Survey Topline Report March 2011 The City of San Rafael commissioned Godbe Research to conduct a telephone survey of voters to assess overall perceptions
Hunger Free Colorado
 Hunger Free Colorado Colorado Statewide Public Opinion Tracking & Issues Survey TOPLINE RESULTS December 1, 2016 Prepared By Kupersmit Research This survey of 400 telephone interviews was conducted among
Voices of 50+ Delaware: Dreams & Challenges
 2011 Voices of 50+ Delaware: Dreams & Challenges Executive Summary AARP has a strong commitment to help improve the lives of the 50+ population. As part of the Association s continuous communication with
This document provides additional information on the survey, its respondents, and the variables
 This document provides additional information on the survey, its respondents, and the variables that we developed. Survey response rates In terms of the survey, its response rate for forum invitees was
Healthcare and Health Insurance Choices: How Consumers Decide
 Healthcare and Health Insurance Choices: How Consumers Decide CONSUMER SURVEY FALL 2016 Despite the growing importance of healthcare consumerism, relatively little is known about consumer attitudes and
CHAPTER V. PRESENTATION OF RESULTS
 CHAPTER V. PRESENTATION OF RESULTS This study is designed to develop a conceptual model that describes the relationship between personal financial wellness and worker job productivity. A part of the model
Client Experience With Investment Call Centers 2011 Investment Call Center Satisfaction Survey
 Client Experience With Investment Call Centers 2011 Investment Call Center Satisfaction Survey Jim S Miller President, Prime Performance www.primeperformance.net *FREE VERSION* Table of Contents Page 2
2002 JUMP$TART QUESTIONNAIRE. (Mean score = Scores are in bold type. *Indicates correct answer Percentages in red are the totals for Wisconsin)
") 2002 JUMP$TART QUESTIONNAIRE (Mean score = 50.2. Scores are in bold type. *Indicates correct answer Percentages in red are the totals for Wisconsin) 1. Heather has a good job on the production line of
2002 JUMP$TART QUESTIONNAIRE (Mean score = 50.2. Scores are in bold type. *Indicates correct answer Percentages in red are the totals for Wisconsin) 1. Heather has a good job on the production line of
FINAL REPORT. February 28, 2012
 100 LIBERTY CITY BANKING SURVEY FINAL REPORT February 28, 2012 1101 Brickell Ave, Suite S-200 Miami, FL 33131 Phone: 305-779-7872 Fax: 305-779-7880 Website: http://metropolitan.fiu.edu/ EXECUTIVE SUMMARY
Harris Interactive. ACEP Emergency Care Poll
 ACEP Emergency Care Poll Table of Contents Background and Objectives 3 Methodology 4 Report Notes 5 Executive Summary 6 Detailed Findings 10 Demographics 24 Background and Objectives To assess the general
Kansas Speaks 2012 Statewide Public Opinion Survey
 Kansas Speaks 2012 Statewide Public Opinion Survey Prepared For The Citizens of Kansas By The Docking Institute of Public Affairs Fort Hays State University Copyright October 2012 All Rights Reserved Fort
Metropolitan Council: Regional Parks System Visitor Study Report. November, 2016
 Metropolitan Council: s System Visitor Study Report November, 2016 Table of Contents Contents Background, objectives and methodology..... 3 Total respondents by agency and sample demographics summary...
IV. EXPECTATIONS FOR THE FUTURE
 IV. EXPECTATIONS FOR THE FUTURE Young adults in Massachusetts widely view their future in positive terms. Those who are doing well financially now generally see that continuing. Those doing less well express
Patterns of Unemployment
 Patterns of Unemployment By: OpenStaxCollege Let s look at how unemployment rates have changed over time and how various groups of people are affected by unemployment differently. The Historical U.S. Unemployment
Segmentation Survey. Results of Quantitative Research
 Segmentation Survey Results of Quantitative Research August 2016 1 Methodology KRC Research conducted a 20-minute online survey of 1,000 adults age 25 and over who are not unemployed or retired. The survey
18 th Annual Transamerica Retirement Survey Influences of Household Income on Retirement Readiness. June 2018 TCRS
 1 th Annual Transamerica Retirement Survey Influences of Household Income on Retirement Readiness June 01 TCRS -01 Transamerica Institute, 01 Welcome to the 1 th Annual Transamerica Retirement Survey Welcome
Maintaining Health and Long-Term Care: A Survey on Arkansas Food, Medicine, and Soda Pop Tax
 Maintaining Health and Long-Term Care: A Survey on Arkansas Food, Medicine, and Soda Pop Tax Data Collected by Southeastern Institute of Research, Inc. Report Prepared by Joanne Binette Copyright 2002
Enclosed is a registration packet that provides you with a Passenger Information Sheet, Waiver Form, Registration Form and an Agreement Checklist.
 Dear Friend, Thank you for your interest in Neighbor Ride. Neighbor Ride is a nonprofit organization providing Howard County s residents, age 60 and older, with reasonably priced, reliable supplemental
Saving and Investing Among High Income African-American and White Americans
 The Ariel Mutual Funds/Charles Schwab & Co., Inc. Black Investor Survey: Saving and Investing Among High Income African-American and Americans June 2002 1 Prepared for Ariel Mutual Funds and Charles Schwab
Camden Higher Education and Health Care Task Force Housing Survey Camden Higher Education and Health Care Task Force
 Camden Higher Education and Health Care Task Force Housing Survey 2017 Camden Higher Education and Health Care Task Force NOVEMBER 1, 2017 THIS STUDY WAS SPONSORED BY THE CAMDEN HIGHER EDUCATION AND HEALTH
Downtown Boulder User Survey October 2014
 Downtown Boulder User Survey 2014 October 2014 Presentation Overview o Methodology o Key Findings and Highlights o Visitor Profile o Marketing & Media o Spending Patters o Transportation & Parking o Impact
CENTER FOR APPLIED RURAL INNOVATION
 CENTER FOR APPLIED RURAL INNOVATION A Research Report* Access and Affordability: Rural Nebraskans View of Health Care 2004 Nebraska Rural Poll Results John C. Allen Rebecca Vogt Randolph L. Cantrell Center
One Quarter Of Public Reports Having Problems Paying Medical Bills, Majority Have Delayed Care Due To Cost. Relied on home remedies or over thecounter
 PUBLIC OPINION HEALTH SECURITY WATCH June 2012 The May Health Tracking Poll finds that many Americans continue to report problems paying medical bills and are taking specific actions to limit personal
City of Tacoma, WA Citizen Survey Report of Results
 City of Tacoma, WA Citizen Survey Report of Results October 2010 Prepared by: 3005 30th Street Boulder, CO 80301 303-444-7863 www.n-r-c.com Table of Contents Executive Summary... 1 Survey Background...
T. Rowe Price 2015 FAMILY FINANCIAL TRADE-OFFS SURVEY
 T. Rowe Price 2015 FAMILY FINANCIAL TRADE-OFFS SURVEY Contents Perceptions About Saving for Retirement & College Education Respondent College Experience Family Financial Profile Saving for College Paying
Montana State Planning Grant A Big Sky Opportunity to Expand Health Insurance Coverage. Interim Report
 Montana State Planning Grant A Big Sky Opportunity to Expand Health Insurance Coverage Interim Report Submitted to Health Resources and Services Administration (HRSA) U.S. Department of Health and Human
City of Sugar Land Community Survey. Prepared by:
 City of Sugar Land Community Survey Prepared by: Creative Consumer Research www.ccrsurveys.com Table of Contents Snapshot of Result Trends 3 Objectives and Methodology 5 Key Findings 10 Research Findings
Voices of 50+ New York:
 2011 Voices of 50+ New York: Dreams & Challenges Executive Summary AARP has a strong commitment to help improve the lives of the 50+ population. As part of the Association s continuous communication with
Alaska Member Opinion Survey Annotated Questionnaire
 Alaska 2012 Member Opinion Survey Annotated Questionnaire 2012 Weighted n= 599; Response Rate=24.0%; Sampling Error= ±3.9% NATIONAL 2012 Weighted n= 36,947; Response Rate=27%; Sampling Error= ±.051% Not
LONG ISLAND INDEX SURVEY CLIMATE CHANGE AND ENERGY ISSUES Spring 2008
 LONG ISLAND INDEX SURVEY CLIMATE CHANGE AND ENERGY ISSUES Spring 2008 Pervasive Belief in Climate Change but Fewer See Direct Personal Consequences There is broad agreement among Long Islanders that global
Durham City and County Resident Survey
 Durham City and County Resident Survey helping organizations make better decisions since 1982 Findings Report Submitted to Durham County, North Carolina: ETC Institute 725 W. Frontier Lane, Olathe, Kansas
Voices of 50+ Hispanics in New York: Dreams & Challenges
 2011 Voices of 50+ Hispanics in New York: Dreams & Challenges Executive Summary AARP has a strong commitment to help improve the lives of the 50+ population. As part of the Association s continuous communication
Arizona Member Opinion Survey Annotated Questionnaire
 Arizona 2012 Member Opinion Survey Annotated Questionnaire 2012 Weighted n= 744; Response Rate=29.7%; Sampling Error= ±3.5% NATIONAL 2012 Weighted n= 36,947; Response Rate=27%; Sampling Error= ±.051% Not
New Hampshire Member Opinion Survey Annotated Questionnaire
 New Hampshire 2012 Member Opinion Survey Annotated Questionnaire 2012 Weighted n= 685; Response Rate=27.4%; Sampling Error= ±3.7% NATIONAL 2012 Weighted n= 36,947; Response Rate=27%; Sampling Error= ±.051%
Idaho Member Opinion Survey Annotated Questionnaire
 Idaho 2012 Member Opinion Survey Annotated Questionnaire 2012 Weighted n= 767; Response Rate=30.9%; Sampling Error= ±3.5% NATIONAL 2012 Weighted n= 36,947; Response Rate=27%; Sampling Error= ±.051% Not
Rhode Island Member Opinion Survey Annotated Questionnaire
 Rhode Island 2012 Member Opinion Survey Annotated Questionnaire 2012 Weighted n= 683; Response Rate=27.3%; Sampling Error= ±3.7% NATIONAL 2012 Weighted n= 36,947; Response Rate=27%; Sampling Error= ±.051%
CHESAPEAKE MATH AND IT ACADEMY BUS CONTRACT (AUGUST 2013 JUNE 2014)
") CHESAPEAKE MATH AND IT ACADEMY BUS CONTRACT (AUGUST 2013 JUNE 2014) - Please read the entire contract with your child and sign / initial the appropriate areas as instructed. Incomplete contracts will not
CHESAPEAKE MATH AND IT ACADEMY BUS CONTRACT (AUGUST 2013 JUNE 2014) - Please read the entire contract with your child and sign / initial the appropriate areas as instructed. Incomplete contracts will not
PUBLIC TRANSPORT TRIP GENERATION PARAMETERS FOR SOUTH AFRICA
 PUBLIC TRANSPORT TRIP GENERATION PARAMETERS FOR SOUTH AFRICA P Onderwater SMEC South Africa, 2 The Cresent, Westway office park, Westville 3629, Durban Tel: 031 277 6600; Email: pieter.onderwater@smec.com
Voices of African Americans 50+ in New York: Dreams & Challenges
 2011 Voices of African Americans 50+ in New York: Dreams & Challenges Executive Summary AARP has a strong commitment to help improve the lives of the 50+ population. As part of the Association s continuous
Wake County. People love to be connected. In our cyberspace. transit plan CONNECTING PEOPLE, CONNECTING THE COUNTY
 Wake County transit plan CONNECTING PEOPLE, CONNECTING THE COUNTY EXECUTIVE SUMMARY People love to be connected. In our cyberspace driven world, people can stay connected pretty much all of the time. Connecting
The margin of error for 807 interviews is ± 3.5%
 HART RESEARCH ASSOCIATES / PUBLIC OPINION STRATEGIES Study #10863d--page 1 1724 Connecticut Avenue, NW Interviews: 807 adults, including Washington, DC 20009 205 who only have a cell phone (202) 234-5570
Indiana Member Opinion Survey Annotated Questionnaire
 Indiana 2012 Member Opinion Survey Annotated Questionnaire 2012 Weighted n= 723; Response Rate=28.9%; Sampling Error= ±3.6% NATIONAL 2012 Weighted n= 36,947; Response Rate=27%; Sampling Error= ±.051% Not
Special Report. Retirement Confidence in America: Getting Ready for Tomorrow EBRI EMPLOYEE BENEFIT RESEARCH INSTITUTE. and Issue Brief no.
 December 1994 Jan. Feb. Mar. Retirement Confidence in America: Getting Ready for Tomorrow Apr. May Jun. Jul. Aug. EBRI EMPLOYEE BENEFIT RESEARCH INSTITUTE Special Report and Issue Brief no. 156 Most Americans
Puerto Rico Member Opinion Survey Annotated Questionnaire
 Puerto Rico 2012 Member Opinion Survey Annotated Questionnaire 2012 Weighted n= 680; Response Rate=28.4%; Sampling Error= ±3.7% NATIONAL 2012 Weighted n= 36,947; Response Rate=27%; Sampling Error= ±.051%
BOARD OF SUPERVISORS 2018 TRANSIT SUMMIT INFORMATION ITEM. Countywide
 Date of Meeting: June 25, 2018 #I-1 BOARD OF SUPERVISORS 2018 TRANSIT SUMMIT INFORMATION ITEM SUBJECT: ELECTION DISTRICT(S): STAFF CONTACTS: Advisory Boards Comments Countywide Scott Gross, Transportation
Boomers at Midlife. The AARP Life Stage Study. Wave 2
 Boomers at Midlife 2003 The AARP Life Stage Study Wave 2 Boomers at Midlife: The AARP Life Stage Study Wave 2, 2003 Carol Keegan, Ph.D. Project Manager, Knowledge Management, AARP 202-434-6286 Sonya Gross
Medicaid and PeachCare for Kids Provider Survey: Customer Service Satisfaction Survey Spring Prepared for ACS
 Medicaid and PeachCare for Kids Provider Survey: Customer Service Satisfaction Survey Spring 2004 Prepared for ACS Prepared by the Georgia Health Policy Center At Georgia State University 1 EXECUTIVE SUMMARY...
IDENTITY THEFT: WHO S AT RISK?
 IDENTITY THEFT: WHO S AT RISK? G. Oscar Anderson Senior Research Advisor, ganderson@aarp.org September 2014 https://doi.org/10.26419/res.00087.001 Methodology OBJECTIVES & METHODOLOGY AARP Fraud Watch
Roundtable on Income Equality, Social Inclusion and Mobility OECD Paris
 National Issues in the USA in Economic Development, Mobility and Income Inequality Roundtable on Income Equality, Social Inclusion and Mobility OECD Paris April 4,5 2016 Intent of this Paper This paper
Health Insurance Coverage in the District of Columbia
 Health Insurance Coverage in the District of Columbia Estimates from the 2009 DC Health Insurance Survey The Urban Institute April 2010 Julie Hudman, PhD Director Department of Health Care Finance Linda
The margin of error for 812 interviews is ± 3.4%
 HART RESEARCH / PUBLIC OPINION STRATEGIES Study #10863c--page 1 1724 Connecticut Avenue, NW Interviews: 812 adults, including Washington, DC 20009 201 who only have a cell phone (202) 234-5570 Dates: September
Paralegal Change of Status Research
 Paralegal Change of Status Research 2012-2014 Law Society of Upper Canada May 2015 Table of Contents Background and Research Methodology 1 Executive Summary 4 Demographic Characteristics of Survey Respondents
The American College Defined Contribution Rollover Survey
 The American College Defined Contribution Rollover Survey January 2016 Table of Contents Methodology 3 Key Findings 5 The Rollover Decision 14 Retirement Financial Planning 33 Investment Management 52
Research Library. Treasury-Federal Reserve Study of the U. S. Government Securities Market
 Treasury-Federal Reserve Study of the U. S. Government Securities Market INSTITUTIONAL INVESTORS AND THE U. S. GOVERNMENT SECURITIES MARKET THE FEDERAL RESERVE RANK of SE LOUIS Research Library Staff study
2016 Retirement Confidence Survey
 2016 Retirement Confidence Survey A Secondary Analysis of the Findings from Respondents Age 50+ Alicia R. Williams, PhD and Eowna Young Harrison, BS AARP Research https://doi.org/10.26419/res.00159.001
2008 Recycling Survey FINAL REPORT Submitted to by 725 W. Frontier Olathe, KS (913) April 2008
 April 2008") 2008 Recycling Survey FINAL REPORT Submitted to The City of Lawrence, Kansas by ETC Institute 725 W.. Fronttiier Ollatthe,, KS 66061 ((913)) 829-- 1215 April 2008 Contents Executive Summary... i Section
2008 Recycling Survey FINAL REPORT Submitted to The City of Lawrence, Kansas by ETC Institute 725 W.. Fronttiier Ollatthe,, KS 66061 ((913)) 829-- 1215 April 2008 Contents Executive Summary... i Section
Community Survey 2017
 Community Survey 2017 Brown University Department of Public Safety Prepared by the Office of Institutional Research for the Department of Public Safety Summary of Results The Community Survey was administered
NEBRASKA RURAL POLL. A Research Report. Earning a Living in Nonmetropolitan Nebraska Nebraska Rural Poll Results
 NEBRASKA RURAL POLL A Research Report Earning a Living in Nonmetropolitan Nebraska 2014 Nebraska Rural Poll Results Rebecca Vogt Cheryl Burkhart-Kriesel Randolph Cantrell Bradley Lubben Nebraska Rural
AMERICA AT HOME SURVEY American Attitudes on Homeownership, the Home-Buying Process, and the Impact of Student Loan Debt
 AMERICA AT HOME SURVEY 2017 American Attitudes on Homeownership, the Home-Buying Process, and the Impact of Student Loan Debt 1 Objective and Methodology Objective The purpose of the survey was to understand
MoneyMinded in the Philippines Impact Report 2013 PUBLISHED AUGUST 2014
 in the Philippines Impact Report 2013 PUBLISHED AUGUST 2014 1 Foreword We are pleased to present the Philippines Impact Report 2013. Since 2003, ANZ's flagship adult financial education program, has reached
Family Registration Form
 Family Registration Form Family Details Family Surname Home Language Residential Address Parents Details Parent 1 Details for: Mother Father Name & Surname Parent 2 Details for: Mother Father Name & Surname
The margin of error for 810 interviews is ± 3.4% The margin of error for 414 employed interviews is ± 4.8%
 HART/McINTURFF Study #10863b--page 1 1724 Connecticut Avenue, NW Interviews: 810 adults, including Washington, DC 20009 204 who only have a cell phone (202) 234-5570 Dates: June 13-17, 2013 FINAL Study
Evaluation of the 100,000 Homes Campaign in Chicago
 Evaluation of the 100,000 Homes Campaign in Chicago Final Quantitative Data Report Center for Urban Research and Learning (CURL) Loyola University Chicago Christine George, PhD Angela Muccino, MPP William
Part 1: 2017 Long-Term Care Research
 Part 1: 2017 Long-Term Care Research Findings from Surveys of Advisors and Consumers Lincoln Financial Group and Versta Research February 2018 2018 Lincoln National Corporation Contents Page Research Methods...
Voices of 50+ Hispanics in Arizona: Dreams & Challenges
 2011 Voices of 50+ Hispanics in Arizona: Dreams & Challenges Executive Summary AARP has a strong commitment to help improve the lives of the 50+ population. As part of the Association s continuous communication
Minnesota State Survey Annotated Questionnaire Weighted n=402; Sampling Error= ±5.0%
 S1. Are you over or under age 50? 50 and over 100% 49 or younger 0% S2. May I speak to someone in your household who is age 50 or older? Yes 100% No 0% S3. Are you a resident of... Minnesota 2011 53 State
17 th Annual Transamerica Retirement Survey Influences of Ethnicity on Retirement Readiness
 1 th Annual Transamerica Retirement Survey Influences of Ethnicity on Retirement Readiness December 01 TCRS 1-11 Transamerica Institute, 01 Welcome to the 1 th Annual Transamerica Retirement Survey Welcome
Maintaining Health and Long-Term Care: A Survey on Addressing the Revenue Shortfall in California
 Maintaining Health and Long-Term Care: A Survey on Addressing the Revenue Shortfall in California Data Collected by Woelfel Research, Inc. Report Prepared by Rachelle Cummins Copyright 2002 AARP Knowledge
Satisfaction with getting to work 57% 14% 13% 9% Total distance travelled. miles per week
 Page/... Headlines All Organisations Travel to Work Survey March 0 Number of respondents Main modes of travel (%) % Satisfaction with getting to work % % % Satisfaction with getting % % (driver with others/
Right direction 33% 34% Wrong track 57% 56% Neither 3% 2% Don t know / Refused 7% 7%
 Heartland Monitor Poll XIII ALLSTATE/NATIONAL JOURNAL HEARTLAND MONITOR POLL XIII National Sample of 1000 ADULTS AGE 18+ (Margin of Error = +/-3.1% in 95 out of 100 cases) Conducted May 19-23, 2012 via
Customer Survey Results
 Customer Survey Results 2016-2017 Run from April 2016 to March 2017 Number of surveys analysed Thank you to all of you who spared the time to fill in the questionnaires we gave you last year, especially
The CFSI Underbanked Consumer Study Underbanked Consumer Overview & Market Segments Fact Sheet
 The CFSI Underbanked Consumer Study - Fact Sheet June 8, 28 The CFSI Underbanked Consumer Study Underbanked Consumer Overview & Market Segments Fact Sheet Released: June 8, 28 Introduction The purpose
National Survey of Small Businesses
 Highlights and Chartpack The Kaiser Family Foundation National Survey of Small Businesses April 2002 Methodology: The Kaiser Family Foundation s National Survey of Small Businesses reports findings from
Final Report June Transit Survey for GBRNTC. moore & associates
 June 2017 Transit Survey for GBRNTC moore & associates Table of Contents Chapter 1: Executive Summary... 01 Chapter 2: Overview and Methodology... 07 Chapter 3: Analysis and Key Findings... 19 Chapter
Community Survey 2014
 Community Survey 2014 Brown University Department of Public Safety Prepared by the Office of Institutional Research for the Department of Public Safety Summary of Results The Community Survey was administered
Charlottesville, VA. Supplemental Online Survey Results
 Charlottesville, VA Supplemental Online Survey Results 2016 2955 Valmont Road Suite 300 777 North Capitol Street NE Suite 500 Boulder, Colorado 80301 Washington, DC 20002 n-r-c.com 303-444-7863 icma.org
List of Figures...ii. List of Tables...iii. Executive Summary I. Introduction and Method of Analysis II. Sample Characteristics...
 i ii TABLE OF CONTENTS List of Figures...ii List of Tables...iii Executive Summary... 1 I. Introduction and Method of Analysis... 3 II. Sample Characteristics... 5 III. Game Findings... 10 a. Any Game