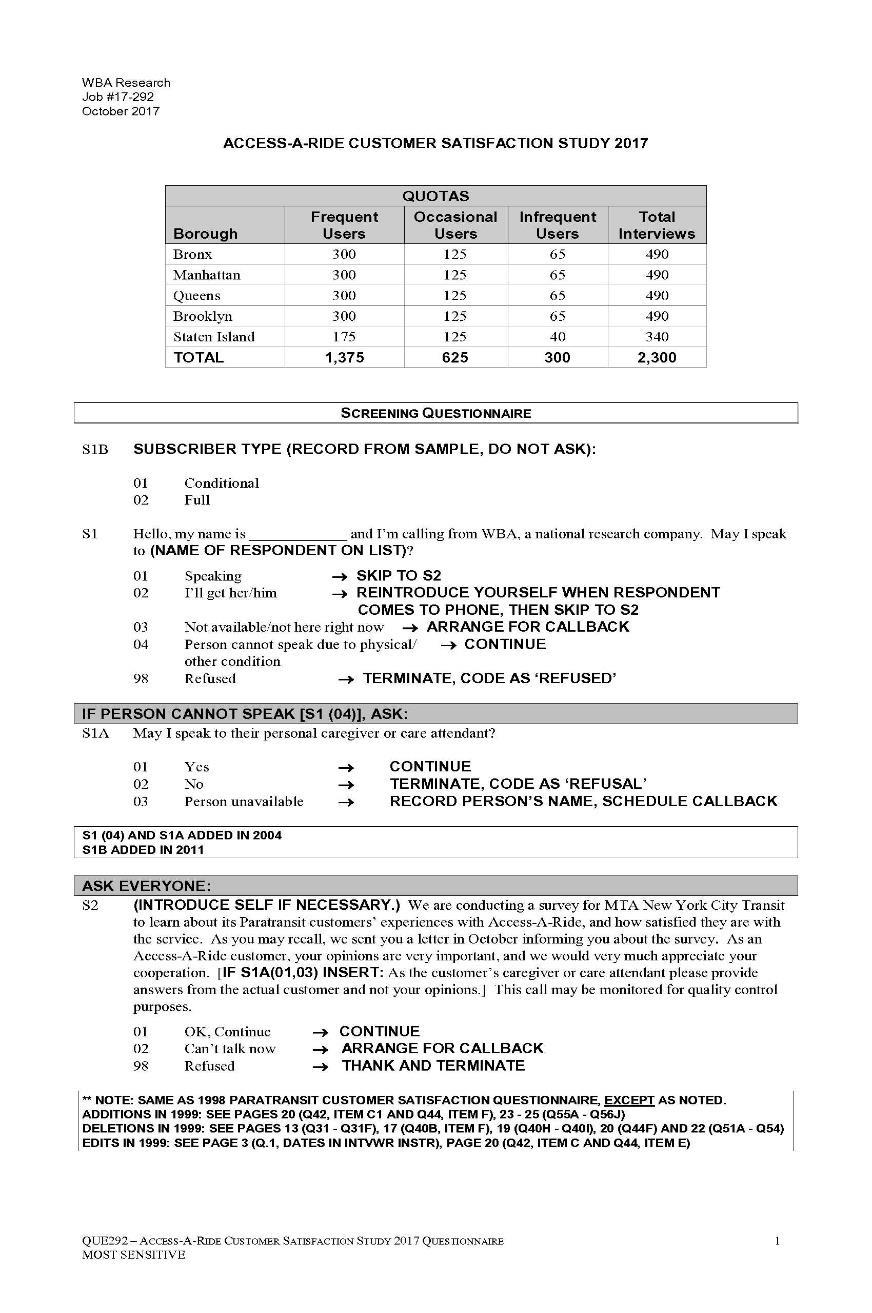
2017 Paratransit Customer Satisfaction Study Access-A-Ride
|
|
|
- Amos Robbins
- 5 years ago
- Views:
Transcription
1 2017 Paratransit Customer Satisfaction Study Access-A-Ride Final Report Prepared for: Prepared by: Date: February
2 Table of Contents Headlines... 3 Background & Objectives... 6 Methodology... 7 Key Findings... 9 Supporting Tables Page # Summary Tables Overall Satisfaction with Access-A-Ride Aspects in Need of Improvement Perceptions of Access-A-Ride as a Good Value Overall Satisfaction with Last Access-A-Ride Trip Satisfaction with Specific Aspects of Access-A-Ride Frequency of On-Time Pickup Perceptions of Changes in Overall Service Perceptions of Changes in Access-A-Ride Reservation Service Reasons for Changes in Access-A-Ride Reservation Service Overview of Performance of Key Elements of Last Trip Ever Called to Ask a Question or Report a Problem Level of Satisfaction with Results of Last Call Expected Future Use of Access-A-Ride Interest in Access-A-Ride MetroCard Trips Approval/Usage of Specific Vehicles Concerns with Accessible Taxi Providing Access-A-Ride Trip Recertification and Assessment Centers Access to Mobile Phone When Using Access-A-Ride
3 Table of Contents (continued) Page # Accessibility to Other Transportation During Weather Emergency Calling Access-A-Ride and Selecting Option Calling Access-A-Ride and Selecting Option Rider Profile Appendix History Tables Methodology Charts Questionnaire 2
4 Headlines In 2017, overall satisfaction with Access-A-Ride increased from 2016, with roughly three in four frequent and occasional customers (74%) saying they are very or somewhat satisfied with the service overall (up from 65% in 2016). This follows a decreasing trend in overall satisfaction, since matching an all time high of 80% in Ratings in 2017 increased from 2016 findings among residents of three of the five boroughs Bronx (73%, up from 62%), Queens (76%, up from 67%), and Brooklyn (75%, up from 63%). page 59 In 2017, the number of Access-A-Ride trips completed was 6,170,876, a decrease of 4% from the prior year. page 16 More than three in ten frequent and occasional customers mentioned that the overall Access-A-Ride service has improved in the past year (36%, up from 29% in 2016), while about four in ten mentioned that the service stayed about the same (39%, consistent with 2016). The proportion who say Access-A-Ride service has gotten worse is now at 19%, down from 29% in page 19 Nine in ten frequent and occasional customers (91%) said Access-A-Ride is a good value for the money, up from 89% in 2016, discontinuing the downward trend that began in page 62 A key strength for Access-A-Ride is the reservation service, with attributes relating to the reservations process receiving high ratings overall. Frequent users were asked to rate several aspects of the reservation process in general, and many of these attributes continue to see high ratings similar to past results. Specifically: The courtesy of the reservations staff (92%); How long it takes for them to confirm the reservation (92%); Being able to get through to make a reservation (91%); The competence of the reservations staff (90%); The ability to get a ride for the day or time requested (87%, up from 83% in 2016); and How far in advance they need to call to make a reservation (84%). page 20 3
5 Headlines (continued) On-time performance drives overall satisfaction, an area where Access-A-Ride has shown improvement. Frequent users were asked to rate several aspects regarding pick ups and trip experience. Several of these attributes saw significant increases from Specifically: Being picked up no later than 30 minutes after the scheduled pick-up time (69%, up from 60%); The drivers driving carefully and safely (92%, up from 88%); The drivers knowing how to get where they are going (83%, up from 78%); and Length of trips (75%, up from 66%). page 20 When asked to provide which area of service is most in need of improvement, more than one in four (27%) suggested on-time performance, more than any other aspect of service. page 26 Among frequent and occasional users, one-half (50%) noted that Access-A-Ride usually picks them up on time. This is the first time since 2013 that at least one-half of users have reported usually being picked up on time. In contrast, four in ten frequent and occasional customers (39%) said that Access-A-Ride sometimes picks them up on time, down from 44% in Satisfied customers are more likely to give positive ratings for how often they are picked up on time. Specifically, about six in ten frequent and occasional customers who are satisfied (59%, up from 48% in 2016) said that Access-A-Ride usually picks them up on time, compared to one in four dissatisfied frequent and occasional customers (25%). Furthermore, less than one in twenty satisfied frequent and occasional customers (4%) said Access-A-Ride rarely or never picks them up within the standard for on time pick-up, compared to nearly two in ten dissatisfied frequent and occasional users (17%). page 34 4
6 Headlines (continued) Results of New Questions New questions added in 2017 focused on mobile phone availability and customers experiences when calling Access-A-Ride to give a commendation or make a complaint. More than nine in ten Access-A-Ride customers (91%) own a cell phone, with nearly half of those (49%) using a smart phone. Nearly all customers who have a mobile phone (99%) carry it with them when traveling with Access-A-Ride. page 49 Of customers who call Access-A-Ride to give a commendation or make a complaint, seven in ten (70%) do so to make a complaint, while one in four (25%) call to give a commendation. About four in ten customers who call to make a complaint (41%) do not receive a phone call or written follow-up response. Those who are dissatisfied with the experience of calling Access-A-Ride to give a commendation or make a complaint most often noted their dissatisfaction is due to not receiving feedback or a response (27%), the problem not being resolved (14%), rude representatives (13%), and/or the commendation or complaint is not reviewed (11%). page 51 About four in ten (39%) said they would be interested in receiving a MetroCard by calling Access-A-Ride and selecting option 1 to request one. page 45 5
7 Background & Objectives In 1990, the Federal Americans with Disabilities Act (ADA) established standards for public services and buildings to include transportation systems such as Metropolitan Transportation Authority (MTA) s New York City Transit (NYC Transit). Therefore, NYC Transit developed Access-A-Ride (AAR) Paratransit services to provide service to ADA eligible citizens in the five boroughs, and up to three-quarter miles in adjacent Nassau and Westchester counties, who are unable to ride the bus or subway system provided. AAR provides shared ride, door-to-door service with limited assistance getting on and off the vehicle. The fare for this ride is the same fare that would be incurred for a standard public transportation ride. If more assistance is required, the individual may ride with a personal care attendant who rides free of charge. Since 1996, New York City Transit has engaged a research consultant to conduct quantitative research to obtain customer ratings of the service and determine ways in which AAR could be improved. These yearly surveys allow the Paratransit program to track customer opinions and identify problem areas. This study was last conducted in What follows are the results from the 2017 wave of this research. 6
8 Methodology In order to meet the research objectives, telephone interviews were conducted among registered riders of Access-A-Ride. Interviews were conducted between October 23, 2017 and December 3, 2017 by professional WBA interviewers from WBA s telephone facilities located in Crofton, Maryland and by WBA s MBE/WBE partners, Medina Marketing Services and Survey Service, Inc. In order to qualify for the study, respondents had to currently live in one of the five boroughs of New York City. If respondents were unable to participate in the survey due to a physical or other condition, their personal caregiver or care attendant (when available) was interviewed. Interviews were conducted among three types of user segments: Frequent Users, Occasional Users and Infrequent Users. These groups are defined by the frequency of AAR ride requests made between July and September page 70 July September 2017 AAR User Segment # of Interviews Frequency of Ride Requests % of Registrants % of Requests Frequent Users requests July-September 5% 76% Occasional Users requests July-September 12% 18% Infrequent Users requests July-September 24% 6% Total 2303 Among those contacted, nine in ten (89%) qualified for the study. Interviews averaged about 25 minutes in length. Using sampling techniques, we can estimate the responses of an entire population without having to interview everyone in the target group. There are mathematical means to measure how close our random-sample estimate comes to the 'true' value of the population. For the 2,303 interviews conducted for the Customer Satisfaction survey, we can expect the values from our sample to be within 2 percentage of the true population value, 95 percent of the time. That means, if we get a value of 50 percent from our sample, we can be 95 percent sure that the population value is somewhere between 48 and 52 percent. This measure of the difference of the sample value from the true value, called the 'margin of error, will vary with the size of the sample and the results received. A chart detailing the margin of error is in the appendix, on page 69. 7
9 Methodology (continued) When reading the charts in this report, note that some charts may not equal 100% due to rounding. Within the charts and graphs of the supporting tables comparing each year s data, arrows and boldface numbers are used to show where statistical differences exist at the 95% confidence level. Up arrows (h) indicate when there was a statistical increase in 2017 versus 2016, while down arrows (i) show a statistical decrease. When comparing boroughs and years, bold/italicized numbers indicate where a piece of data is statistically higher for one borough compared to another, with a footnote at the bottom of the chart detailing the statistical difference. It is important to note that there was not a customer satisfaction survey conducted in 2002, 2009, or The following are demographic characteristics of the 2017 AAR Customer Satisfaction respondents, which are consistent with previous years: Average age is 66 years old; 88% are not employed; and 80% use a support device when they travel. pages Charts are also included in the Appendix showing the user segments surveyed by borough and the weights that were applied to this year s data. 8
10 Key Findings Overall Satisfaction After three consecutive years of decline, overall satisfaction with Access-A-Ride is again increasing, with 74% of customers being very or somewhat satisfied with the service in 2017 (up from 65% in 2016 and 67% in 2015). This increase in satisfaction can also be seen among residents in three of the five boroughs Bronx (74%, up from 63%), Manhattan (69%, from 67%), Queens (75%, up from 67%), Brooklyn (74%, up from 63%), and Staten Island (70%, from 72%). page 19 Nine in ten customers (91%) noted that Access-A-Ride is a good value for the money. This is consistent with 2016 findings and represents a very high proportion of customers recognizing the value of the program. page 18 Perception of Past Year Service Overall in 2017, more than three in ten frequent and occasional users (36%) indicated that service has improved over the past year, an increase from 29% in saw notable increases among residents of the Bronx (36%, up from 25%), Manhattan (35%, up from 26%) and Brooklyn (37%, up from 29%) when compared to 2016 figures. The proportion of customers indicating that service has gotten worse in the past year has decreased from 2016 findings, with about two in ten frequent and occasional users (19%, down from 29%) responding as such. Similar to the shift in improved ratings, the proportion of participants saying service has gotten worse saw a notable decrease in 2017 compared to 2016 among residents of the Bronx (18%, down from 34%), Manhattan (18%, down from 30%), Queens (18%, down from 27%), and Brooklyn (20%, down from 29%). page 61 9
11 Key Findings (continued) Service Attributes Among frequent users, satisfaction with many reservation service attributes continue to perform well in 2017, with roughly nine in ten being satisfied with all of the following: The courtesy of the reservations staff (92%); How long it takes for them to confirm the reservation (92%); Being able to get through to make a reservation (91%); The competence of the reservations staff (90%); and The ability to get a ride for the day or time you request it (87%, up from 83 in 2016%). Being picked up no later than 30 minutes after the scheduled pick-up time continues to be an area in need of improvement, though satisfaction is up from Among frequent users, nearly seven in ten (69%, up from 60%) are satisfied on this measure. For service attributes related to the trip experience, frequent riders continued to provide high satisfaction ratings for attributes related to the driver, with more than eight in ten being very or somewhat satisfied with each of the following in 2017: The drivers driving carefully and safely (92%, up from 88% in 2016); The courtesy of the drivers (89%); The drivers knowing how to get where they are going (83%, up from 78% in 2016). The length of the trips continues to receive the lowest ratings of all service attributes related to trip experience; however, three in four (75%) are now satisfied with the length of their trips, in general, ending the downward trend from page 20 10
12 Key Findings (continued) Access-A-Ride MetroCard As the implementation and integration of the Access-A-Ride MetroCard program continues, questions related to the program that were added in the 2013 fielding of this study continued to be asked. Overall, more than six in ten Access-A-Ride customers (61%) are aware of the Access-A-Ride MetroCard Program, up from 52% in Of those who are aware of the program, more than six in ten (65%) have received their Access-A-Ride MetroCard, down from 74% in Among those who have not received their Access-A-Ride MetroCard, almost four in ten (39%) said they would be interested in receiving a MetroCard by calling Access-A-Ride and selecting option 1 to request one. page 45 On-Time Performance A key area in need of improvement is on-time performance. In fact, customers most often mentioned on-time performance as the one aspect of Access-A-Ride that is most in need of improvement (27%). page 26 Similarly, one-half of frequent and occasional users (50%) said that Access-A-Ride usually picks them up within the standard for ontime pickup, up from 39% in Similarly, two in five frequent and occasional customers (39%) noted that Access-A-Ride sometimes picks them up within the standard for on-time pick up, down from 44% in About one in twelve customers (8%) said that Access-A-Ride picks rarely or never picks them up on time, down from 15% in On-time pickup appears to be strongly associated with overall satisfaction, as only one in four dissatisfied frequent and occasional users (25%) said that they are usually picked up within the standard for on-time pickup, while about six in ten satisfied frequent and occasional users (59%) say they are usually picked up on-time, up from 48% in Furthermore, two in ten dissatisfied users (17%) noted that Access-A-Ride rarely or never picks them up on time, while less than one in twenty (4%) satisfied customers said the same. page 34 11
13 Key Findings (continued) Option 7 and Option 8 When Calling Access-A-Ride Regarding Option 8, which gives customers the ability to give a commendation or make a complaint, nearly one-half of customers (47%) have used this feature when calling Access-A-Ride. Among these customers, about two in three (67%) are very or somewhat satisfied with the process. However, 70% of those who have called, did so to make a complaint. page 51 Regarding Option 7, which gives customers the ability to check the status of a trip or cancel a trip, almost one-half of customers (48%) have used this feature when calling Access-A-Ride. Among those who have used Option 7: 82% are satisfied with the feature when getting the status of a trip; 77% are satisfied with the feature when cancelling trips; and 74% are satisfied when reviewing upcoming trips. Customers who have used Option 7 were asked what comments or concerns, if any, they have regarding the feature. Many customers had positive comments, most commonly that they are very satisfied, like it, and have had no problems (16%). However, a very small minority of customers had negative comments, including that they don t like talking to a machine or prefer a live person (5%), and/or that it sometimes doesn t record the ID or birthdate correctly (5%). page 52 12
14 Supporting Tables When reading the charts in this section, note that some totals may not equal 100% due to rounding. Within the charts and graphs of the supporting tables comparing each year s data, boldface numbers and arrows denote statistical differences at the 95% confidence level. Up arrows (h) indicate a statistical increase in 2017 versus 2016, while down arrows (i) show a statistical decrease. Some tables compare both results across boroughs in 2017 as well as data across years. For those tables with both borough and annual comparisons, bold/italicized numbers indicate where a piece of data is statistically higher for one borough compared to another, with a footnote at the bottom of the chart detailing the statistical difference. 13
15 Supporting Tables Overall Satisfaction with Access-A-Ride Among Frequent/Occasional Users Year n = (2003) (2001) (2003) % % % Total: Satisfied h Very satisfied h Somewhat satisfied Total: Dissatisfied i Somewhat dissatisfied i Very dissatisfied i This question asked of: Frequent/Occasional Users Q4 Overall Satisfaction with Access-A-Ride Among Infrequent Users Year n = (300) (300) (300) % % % Total: Satisfied Very satisfied Somewhat satisfied Total: Dissatisfied Somewhat dissatisfied Very dissatisfied This question asked of: Infrequent Users Q4 Overall Satisfaction with Access-A-Ride Among All Users Year n = (2303) (2301) (2303) % % % Total: Satisfied h Very satisfied h Somewhat satisfied Total: Dissatisfied i Somewhat dissatisfied i Very dissatisfied i This question asked of: Total Sample Q4 Q4. Now please tell me how satisfied you are with Access-A-Ride, overall. Would you say you are? 14
16 Supporting Tables (continued) Overall Satisfaction with Access-A-Ride Service By Borough of Residence Among Frequent/Occasional Users 2017 Borough Bronx Manhattan Queens Brooklyn Staten Island n= (425) (434) (428) (416) (300) % % % % % Total: Satisfied Very satisfied Somewhat satisfied Total: Dissatisfied Somewhat dissatisfied Very dissatisfied This question asked of: Frequent/Occasional Users Bronx Very dissatisfied is significantly higher than Queens Very dissatisfied. Q4 Q4. Now please tell me how satisfied you are with Access-A-Ride, overall. Would you say you are? 15
17 Supporting Tables (continued) Trip Requests Trips Completed Overall Satisfaction Trip Requests and Trips Completed Year Change from ,812,524 7,837,614 7,837,126 <1% 6,360,165 6,395,430 6,170,876-4% Overall Satisfaction 67% 65% 74% +7 This question asked of: Total Sample 16
18 Supporting Tables (continued) Overall Satisfaction Trip Requests and Trips Completed By Borough of Residence Year Change from Bronx Trip Requests 1,281,213 1,328,590 1,189,423-10% Trips Completed 1,024,543 1,067, ,220-12% Overall Satisfaction 65% 63% 74%h +11 Manhattan Trip Requests 1,061,596 1,049,416 1,721, % Trips Completed 862, ,722 1,316, % Overall Satisfaction 66% 67% 69% +2 Queens Trip Requests 1,924,258 1,911,631 1,696,448-13% Trips Completed 1,569,816 1,566,177 1,357,299-15% Overall Satisfaction 69% 67% 75%h +8 Brooklyn Trip Requests 2,842,427 2,851,885 2,616,406-9% Trips Completed 2,321,347 2,334,500 2,075,532-12% Overall Satisfaction 67% 63% 74%h +11 Staten Island Trip Requests 642, , ,042-23% Trips Completed 534, , ,972-23% Overall Satisfaction 71% 72% 70% -2 This question asked of: Total Sample 17
19 Supporting Tables (continued) Access-A-Ride is a Good Value for the Money This question asked of: Total Sample Q7 Year n= (2303) (2301) (2303) % % % % Yes Q7. Considering the fare and the service provided by Access-A-Ride, would you say it is? 18
20 Supporting Tables (continued) Overall Access-A-Ride Service Among Frequent/Occasional Users Year n= (2003) (2001) (2003) This question asked of: Frequent/Occasional Users Q3 % % % Improved h Stayed the same Gotten worse i Overall Access-A-Ride Service Among Infrequent Users Year n= (300) (300) (300) This question asked of: Infrequent Users Q3 % % % Improved Stayed the same Gotten worse Overall Access-A-Ride Service Among All Users Year n= (2303) (2301) (2303) This question asked of: Total Sample Q3 % % % Improved h Stayed the same Gotten worse i Q3. Would you say that during the past year, overall, Access-A-Ride service has? 19
21 Supporting Tables (continued) Satisfaction with Specific Aspects of Access-A-Ride Service % Very or Somewhat Satisfied Among Frequent Users Year Making Trip Reservations n= (1378) (1375) (1378) % % % The courtesy of the reservations staff How long it takes for them to confirm the reservation Being able to get through to make a reservation The competence of the reservations staff The ability to get a ride for the day or time you request it How far in advance you need to call to make reservations Pickups n= (1378) (1375) (1378) % % % Being picked up no later than 30 minutes after the scheduled pick-up time Trip Experience n= (1378) (1375) (1378) % % % The drivers driving carefully and safely Courtesy of the drivers The drivers knowing how to get where they are going Length of the trips This question asked of: Frequent Users Q42a-e, 43a, 44a-f Q Now thinking about your experience with Access-A-Ride in the past 3-4 months, I d like you to tell me how satisfied you are with some specific aspects of Access-A-Ride service. For each aspect I mention, please tell me whether you are very satisfied, somewhat satisfied, somewhat dissatisfied or very dissatisfied. 20
22 Supporting Tables (continued) Satisfaction Overall vs. Last Trip Very/Somewhat Satisfied Among Frequent/Occasional Users Year This question asked of: Frequent/Occasional Users Q4, n = (2003) (2001) (2003) % % % Access-A-Ride Overall h Last Access-A-Ride Trip Difference Trip Overall This question asked of: Frequent/Occasional Users (n=2003) 2017 Overall Very dissatisfied is significantly lower than Overall Dissatisfied is significantly lower than Overall Very satisfied is significantly higher than Overall Net: Satisfied is significantly higher than Last Trip Very dissatisfied is significantly higher than Last Trip Somewhat satisfied is significantly higher than Last Trip Very satisfied is significantly higher than Last Trip Don t know/ Refused is significantly higher than Q4, 38 Overall-2015 Last trip-2015 Overall-2016 Last trip-2016 Overall-2017 Last trip % 22% 29%h Satisfaction Overall vs. Last Trip Among Frequent/Occasional Users % 55% 65%h 43% 42% 45% 24% 27% 20% 20%i 21% 17%i Very satisfied Somewhat satisfied Somewhat dissatsfied Very dissatsfied Don't know/refused Q4. Now please tell me how satisfied you are with Access-A-Ride, overall. Would you say you are? Q38. Overall, how satisfied were you with the trip we just discussed? Would you say you were? 8% 8% 7% 9% 12% 8% 8% 7%i 6%i Net: Satisfied 66% 81% 65% 2% 83% 74%h 85% 3% 3% 3% 1% 2%h 21
23 Supporting Tables (continued) Expected Future Usage of Access-A-Ride Among Frequent/Occasional Users Frequent Occasional n= (1378) (1375) (1378) (625) (626) (625) % % % % % % More often h h Less often About the same Not sure/don t know/refused i This question asked of: Frequent/Occasional Users. Q50B Q50B. In the next year or so would you expect to use Access-A-Ride, including vans, taxi rides and (broker car/voucher) service? 22
24 Summary Tables When reading the charts in this section, note that some charts may not equal 100% due to rounding. 23
25 Overall Satisfaction with Access-A-Ride This question asked of: Total Sample Q4 Overall Satisfaction with Access-A-Ride Frequent/Occasional Users Infrequent Users n= (2003) (2001) (2003) (300) (300) (300) % % % % % % Total: Satisfied Very satisfied Somewhat satisfied Total: Dissatisfied Somewhat dissatisfied Very dissatisfied Don t know/refused This question asked of: Frequent/Occasional Users Q4 Overall Satisfaction with Access-A-Ride by Borough of Residence Among Frequent/Occasional Users 2017 Borough Staten Bronx Manhattan Queens Brooklyn Island n= (425) (434) (428) (416) (300) % % % % % Total: Satisfied Very satisfied Somewhat satisfied Total: Dissatisfied Somewhat dissatisfied Very dissatisfied Don t know/refused Q4. Now please tell me how satisfied you are with Access-A-Ride, overall. Would you say you are? 24
26 Overall Satisfaction with Access-A-Ride (continued) Change in Overall Satisfaction With Access-A-Ride By Borough of Residence Very or Somewhat Satisfied Among Frequent/Occasional Users Very/Somewhat Satisfied Very Satisfied % % % % % % Total (n=2003) Bronx (n=425) Manhattan (n=434) Queens (n=428) Brooklyn (n=416) Staten Island (n=300) Difference: Highest Lowest Borough (% Pts) This question asked of: Frequent/Occasional Users (n sizes for 2017) Q4 Change in Overall Satisfaction With Access-A-Ride By Borough of Residence Very or Somewhat Dissatisfied Among Frequent/Occasional Users Very/Somewhat Dissatisfied Very Dissatisfied % % % % % % Total (n=2003) Bronx (n=425) Manhattan (n=434) Queens (n=428) Brooklyn (n=416) Staten Island (n=300) Difference: Highest Lowest Borough (% Pts) This question asked of: Frequent/Occasional Users (n sizes for 2017) Q4 Q4. Now please tell me how satisfied you are with Access-A-Ride, overall. Would you say you are? 25
27 Aspects in Need of Improvement This question asked of: Total Sample Top Mentions Q6 Aspects of Access-A-Ride Most In Need of Improvement By Borough of Residence Borough 2017 Total Bronx Manhattan Queens Brooklyn Staten Island n= (2303) (492) (497) (493) (481) (340) % % % % % % On-time performance/wait time Broker Car/Voucher service Travel time Access-A-Ride Drivers Access-A-Ride Vehicles Reservationists Q6. What one aspect of Access-A-Ride service would you say is most in need of improvement? Is it the? 26
28 Perceptions of Access-A-Ride as a Good Value Perceptions of Access-A-Ride as a Good Value For the Money By Borough of Residence and Level of Overall Satisfaction with Access-A-Ride Among Frequent/Occasional Users Year % % % Total (n=2003) Bronx (n=425) Manhattan (n=434) Queens (n=428) Brooklyn (n=416) Staten Island (n=300) By Level of Satisfaction with Access-A-Ride Satisfied (n=1467) Dissatisfied (n=484) This question asked of: Frequent/Occasional Users (n sizes for 2017) Q7 Q7. Considering the fare and the service provided by Access-A-Ride, would you say it is? 27
29 Overall Satisfaction With Last Access-A-Ride Trip Overall Satisfaction With Last Access-A-Ride Trip By Borough of Residence Among Frequent/Occasional Users Total Borough Bronx Manhattan Queens Brooklyn Staten Island n= (2003) (2001) (2003) (425) (434) (428) (416) (300) % % % % % % % % Total: Satisfied Very satisfied Somewhat satisfied Total: Dissatisfied Somewhat dissatisfied Very dissatisfied Don t know/refused This question asked of: Frequent/Occasional Users Q38 Q38. Overall, how satisfied were you with the trip we just discussed? Would you say you were? 28
30 Overall Satisfaction With Last Access-A-Ride Trip (continued) Change in Overall Satisfaction With Last Access-A-Ride Trip By Borough of Residence Among Frequent/Occasional Users Very/Somewhat Satisfied Very Satisfied Very/Somewhat Dissatisfied % % % % % % % % % Total (n=2003) Bronx (n=425) Manhattan (n=434) Queens (n=428) Brooklyn (n=416) Staten Island (n=300) This question asked of: Frequent/Occasional Users (n sizes for 2017) Q38 Q38. Overall, how satisfied were you with the trip we just discussed? Would you say you were? 29
31 Satisfaction with Specific Aspects of Access-A-Ride Satisfaction With Specific Aspects of Access-A-Ride Service Among Frequent Users Very/Somewhat Satisfied Very Satisfied Somewhat Satisfied Making Trip Reservations % % % % % % % % % Being able to get through to make a reservation How far in advance you need to call to make reservations The courtesy of the reservations staff The competence of the reservations staff The ability to get a ride for the day or time you request it How long it takes for them to confirm the reservation Pickups Being picked up no later than 30 minutes after the scheduled pick-up time Trip Experience Length of the trips The drivers knowing how to get where they are going Courtesy of the drivers The drivers driving carefully and safely This question asked of: Frequent Users (2015 n=1378; 2016 n=1375; 2017 n=1378) Q42a-e, 43a, 44a-f Q Now thinking about your experience with Access-A-Ride in the past 3-4 months, I d like you to tell me how satisfied you are with some specific aspects of Access-A-Ride service. For each aspect I mention, please tell me whether you are very satisfied, somewhat satisfied, somewhat dissatisfied or very dissatisfied. 30
32 Satisfaction with Specific Aspects of Access-A-Ride (continued) Satisfaction With Specific Aspects of Access-A-Ride Service Among Frequent Users Very/Somewhat Dissatisfied Very Dissatisfied Somewhat Dissatisfied Making Trip Reservations % % % % % % % % % Being able to get through to make a reservation How far in advance you need to call to make reservations The courtesy of the reservations staff The competence of the reservations staff The ability to get a ride for the day or time you request it How long it takes for them to confirm the reservation Pickups Being picked up no later than 30 minutes after the scheduled pick-up time Trip Experience Length of the trips The drivers knowing how to get where they are going Courtesy of the drivers The drivers driving carefully and safely This question asked of: Frequent Users (2015 n=1378; 2016 n=1375; 2017 n=1378) Q42a-e, 43a, 44a-f Q Now thinking about your experience with Access-A-Ride in the past 3-4 months, I d like you to tell me how satisfied you are with some specific aspects of Access-A-Ride service. For each aspect I mention, please tell me whether you are very satisfied, somewhat satisfied, somewhat dissatisfied or very dissatisfied. 31
33 Satisfaction with Specific Aspects of Access-A-Ride (continued) Satisfaction With Specific Aspects of Access-A-Ride Service % Very or Somewhat Satisfied By Borough of Residence Among Frequent Users 2017 Borough Bronx Manhattan Queens Brooklyn Staten Island Making Trip Reservations n= (301) (309) (303) (291) (174) % % % % % Being able to get through to make a reservation How far in advance you need to call to make reservations The courtesy of the reservations staff The competence of the reservations staff The ability to get a ride for the day or time you request it How long it takes for them to confirm the reservation Pickups n= (301) (309) (303) (291) (174) % % % % % Being picked up no later than 30 minutes after the scheduled pick-up time Trip Experience n= (301) (309) (303) (291) (174) % % % % % Length of the trips The drivers knowing how to get where they are going Courtesy of the drivers The drivers driving carefully and safely This question asked of: Frequent Users Q42a-e, 43a, 44a-f Q Now thinking about your experience with Access-A-Ride in the past 3-4 months, I d like you to tell me how satisfied you are with some specific aspects of Access-A-Ride service. For each aspect I mention, please tell me whether you are very satisfied, somewhat satisfied, somewhat dissatisfied or very dissatisfied. 32
34 Satisfaction with Specific Aspects of Access-A-Ride (continued) Satisfaction With Specific Aspects of Access-A-Ride Service % Very or Somewhat Dissatisfied By Borough of Residence Among Frequent Users 2017 Borough Bronx Manhattan Queens Brooklyn Staten Island Making Trip Reservations n= (301) (309) (303) (291) (174) % % % % % Being able to get through to make a reservation How far in advance you need to call to make reservations The courtesy of the reservations staff The competence of the reservations staff The ability to get a ride for the day or time you request it How long it takes for them to confirm the reservation Pickups n= (301) (309) (303) (291) (174) % % % % % Being picked up no later than 30 minutes after the scheduled pick-up time Trip Experience n= (301) (309) (303) (291) (174) % % % % % Length of the trips The drivers knowing how to get where they are going Courtesy of the drivers The drivers driving carefully and safely This question asked of: Frequent Users Q42a-e, 43a, 44a-f Q Now thinking about your experience with Access-A-Ride in the past 3-4 months, I d like you to tell me how satisfied you are with some specific aspects of Access-A-Ride service. For each aspect I mention, please tell me whether you are very satisfied, somewhat satisfied, somewhat dissatisfied or very dissatisfied. 33
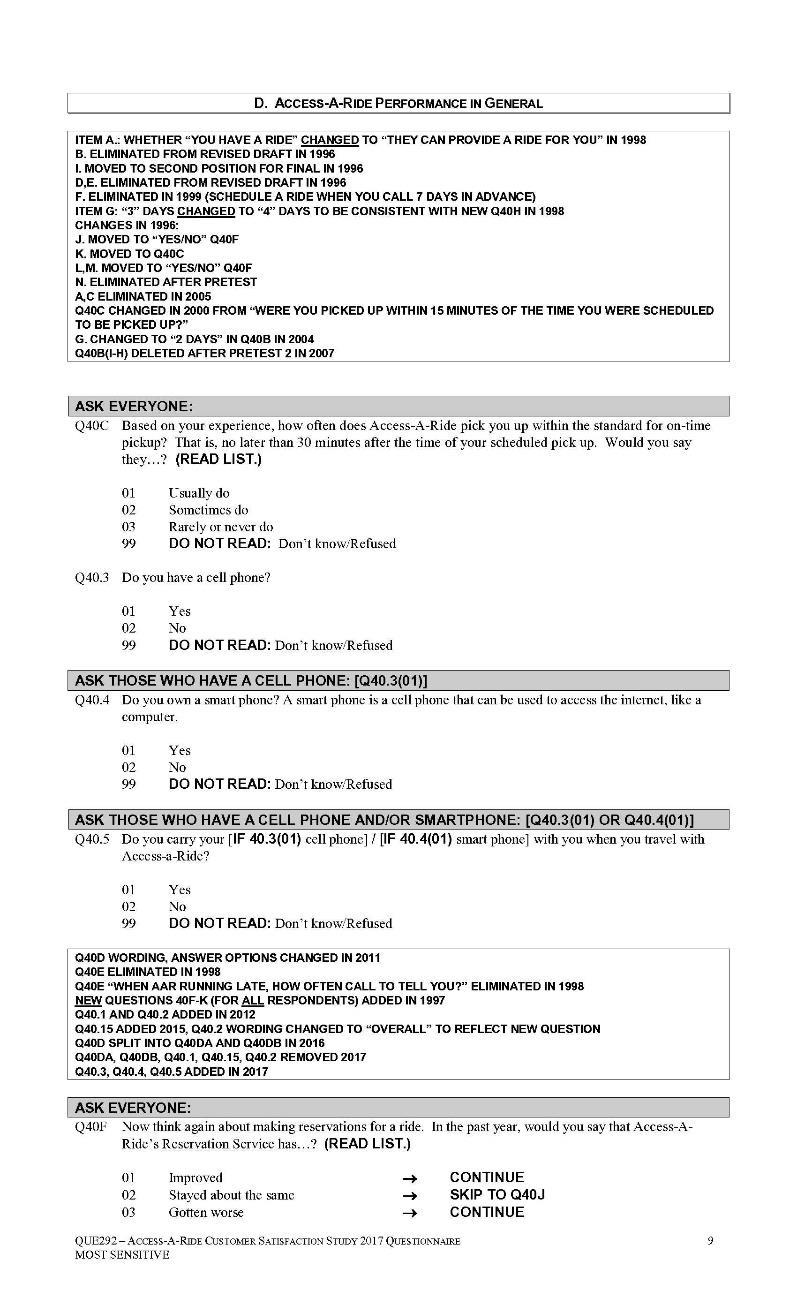
35 Frequency of On-Time Pickup How Often Access-A-Ride Picks You Up Within Its Standard for On-Time Pick-Up Among Frequent/Occasional Users 2015 Total Frequent Users Occasional Users This question asked of: Frequent/Occasional Users 1 Note: Satisfied are those very or somewhat satisfied with Access-A-Ride. Dissatisfied are those very or somewhat dissatisfied with Access-A-Ride. Q40C n= (2003) (2001) (2003) (1378) (625) % % % % % Usually Sometimes Rarely or Never Don t know/refused This question asked of: Frequent/Occasional Users Q40C How Often Access-A-Ride Picks You Up Within Its Standard for On-Time Pick-Up By Overall Satisfaction Among Frequent/Occasional Users Satisfied Overall Satisfaction 1 Dissatisfied n= (1328) (1316) (1467) (607) (638) (484) % % % % % % Usually Sometimes Rarely or Never Don t know/refused Q40C. Based on your experience, how often does Access-A-Ride pick you up within the standard for on-time pickup? That is, no later than 30 minutes after the time of your scheduled pick up. Would you say they? 34
36 Frequency of On-Time Pick-up (continued) How Often Access-A-Ride Picks You Up Within Its Standard for On-Time Pick-Up By Borough of Residence Among Frequent/Occasional Users 2017 Borough Bronx Manhattan Queens Brooklyn Staten Island n= (425) (434) (428) (416) (300) % % % % % Usually Sometimes Rarely or Never Don t know/refused This question asked of: Frequent/Occasional Users Q40C Q40C. Based on your experience, how often does Access-A-Ride pick you up within the standard for on-time pickup? That is, no later than 30 minutes after the time of your scheduled pick up. Would you say they? 35
37 Frequency of On-Time Pick-up (continued) Change in How Often Access-A-Ride Picks You Up Within Its Standard for On-Time Pick-Up By Frequency of Use, Overall Satisfaction and Borough Among Frequent/Occasional Users Usually Sometimes % % % % % % Total User Frequency Frequent Occasional Overall Satisfaction Satisfied Dissatisfied Borough of Residence Bronx Manhattan Queens Brooklyn Staten Island This question asked of: Frequent/Occasional Users (2015 n=2003; 2016 n=2001; 2017 n=2003) Q40C Q40C. Based on your experience, how often does Access-A-Ride pick you up within the standard for on-time pickup? That is, no later than 30 minutes after the time of your scheduled pick up. Would you say they? 36
38 Perceptions of Changes in Overall Service Perceptions of Changes in Overall Access-A-Ride Service During the Past Year By Borough of Residence Among Frequent/Occasional Users Total Borough Bronx Manhattan Queens Brooklyn Staten Island n= (2003) (2001) (2003) (425) (434) (428) (416) (300) % % % % % % % % Improved Stayed about the same Gotten worse Don t know/refused This question asked of: Frequent/Occasional Users Q3 Q3. Would you say that during the past year, overall, Access-A-Ride service has? 37
39 Perceptions of Changes in Overall Service (continued) Changes in Access-A-Ride Reservation Service/Trips Experience Among Frequent/Occasional Users Year Access-A-Ride s Reservation Service n= (2003) (2001) (2003) % % % Improved Stayed the same Gotten worse Don t know/refused Access-A-Ride s Trips n= (2003) (2001) (2003) This question asked of: Frequent/Occasional Users Q40F, 40J % % % Improved Stayed the same Gotten worse Don t know/refused Q40F. Now think again about making reservations for a ride. In the past year, would you say that Access-A-Ride s Reservation Service has? Q40J. Now think again about the rides or trips provided by Access-A-Ride. In the past year, would you say that your experience with Access-A-Ride trips has? 38
40 Perceptions of Changes in Access-A-Ride Reservation Service Perceptions of Changes in Access-A-Ride Reservation Service Among Frequent/Occasional Users This question asked of: Frequent/Occasional Users Q40F Year n= (2003) (2001) (2003) % % % Improved Stayed about the same Gotten worse Don t know/refused Perceptions of Changes in Access-A-Ride s Reservation Service During the Past Year By Borough of Residence Among Frequent/Occasional Users 2017 Borough Staten Bronx Manhattan Queens Brooklyn Island n= (425) (434) (428) (416) (300) This question asked of: Frequent/Occasional Users Q40F % % % % % Improved Stayed about the same Gotten worse Don t know/refused Q40F. Now think again about making reservations for a ride. In the past year, would you say that Access-A-Ride s Reservation Service has? 39
41 Reasons for Changes in Access-A-Ride Reservation Service Ways in Which the Access-A-Ride Reservation Service Has Improved/Gotten Worse by Perceptions of Changes in Access-A-Ride Reservation Service Among Frequent/Occasional Users Improved Gotten Worse n= (849) (721) (729) (88) (150) (110) % % % % % % Manner/Performance of reservationists Phone answering promptness On-time performance Availability of rides Reservationists knowledge Number of errors Hours/Schedules/Routes Can t understand them/don t speak English Reference to reservation system (Unspecified) This question asked of: Frequent/Occasional Users who feel the Reservation Service has changed Multiple Responses Accepted; Select Mentions Q40G Non-specific reference to service 2 < Get put on hold too long/too frequently n/a n/a n/a Q40G. In what ways has the Reservation Service (improved/gotten worse)? 40
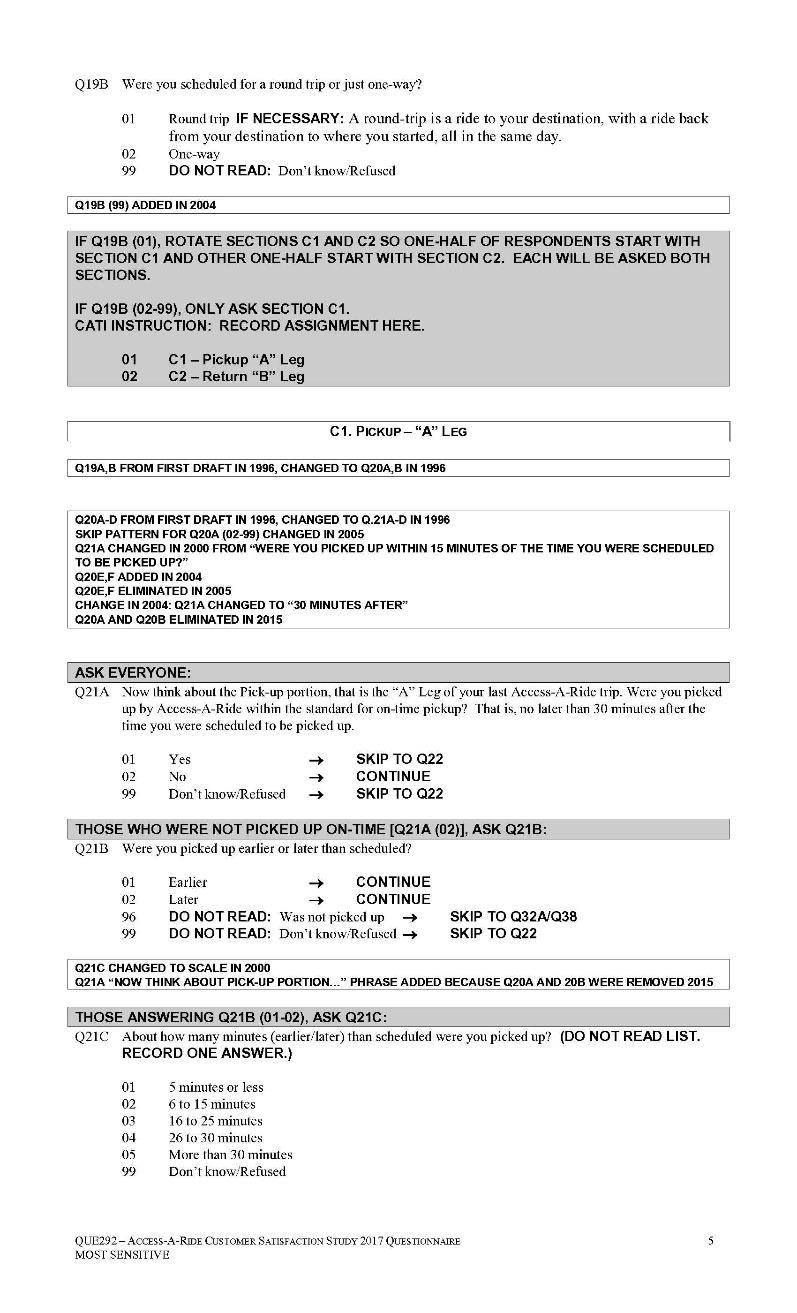
42 Overview of Performance of Key Elements of Last Trip Overview of Performance of Key Elements of the Last Trip with Access-A-Ride Among Frequent/Occasional Users Year On-Time Pick-up n= (2003) (2001) (2003) Picked up no later than 30 minutes after the time you were scheduled to be picked up 76% 78% 81% Courtesy of Driver 1 n= (2003) (2001) (1998) Driver was courteous 96% 93% 96% Operation of Vehicle 1 n= (2003) (2001) (1998) Driver operated the vehicle in a careful and safe manner 96% 95% 97% Trip Time 1 n= (2003) (2001) (1998) Trip took a reasonable amount of time 86% 85% 88% Driver s Assistance 1 n= (2003) (2001) (1998) Needed driver s assistance after out of the vehicle 38% 37% 35% Driver s Offer of Assistance 2 n= (759) (725) (689) Driver offered to assist 93% 91% 91% This question asked of: Frequent/Occasional Users 1 This question asked of: Frequent/Occasional Users who were picked-up 2 This question asked of: Frequent/Occasional Users who needed driver s assistance Q21A, 23, 23A, 24, 30A-B Q21A. Were you picked up by Access-A-Ride within the standard for on-time pickup? That is, no later than 30 minutes after the time you were scheduled to be picked up. Q23. Was the driver courteous? Q23A. Did the driver operate the vehicle in a careful and safe manner? Q24. Did the trip take a reasonable amount of time? Q30A. Speaking again about your last Access-A-Ride trip, did you need the driver s assistance after you were out of the vehicle? Q30B. Did the driver assist you after you were getting out of the vehicle? 41
43 Ever Called to Ask a Question or Report a Problem Ever Called Access-A-Ride to Ask a Question or Report a Problem By User Frequency, Level of Satisfaction and Borough of Residence Year Total n= (2303) (2301) (2303) 62% 64% 59% Frequent Users n= (1378) (1375) (1378) 70% 72% 68% Occasional Users n= (625) (626) (625) 55% 55% 51% Infrequent Users n= (300) (300) (300) 39% 47% 38% Satisfied (Frequent/Occasional Users) n= (1328) (1316) (1467) 60% 61% 58% Dissatisfied (Frequent/Occasional Users) n= (607) (638) (484) 78% 79% 80% Bronx (Frequent/Occasional Users) n= (428) (422) (425) 69% 70% 67% Units Called When Asking a Question or Reporting a Problem 2017 Year 2017 n= (1396) Eligibility 22% Subscriptions 9 Some other unit 60 Don t know/can t recall 19 This question asked of: Those who have called or had someone call Access- A-Ride to ask a question or report a problem *Multiple responses accepted Q57F1 Manhattan (Frequent/Occasional Users) n= (430) (427) (434) This question asked of: Total Sample Q57 69% 70% 65% Queens (Frequent/Occasional Users) n= (425) (431) (428) 65% 65% 57% Brooklyn (Frequent/Occasional Users) n= (417) (419) (416) 64% 67% 64% Staten Island (Frequent/Occasional Users) n= (303) (302) (300) 57% 58% 60% Q57. Besides calling for reservations, or calling on the day of your trip, have you ever called Access-A-Ride to ask a question or report a problem? Q57F1. Which of the following units did you call? 42
44 Level of Satisfaction with Results of Last Call Whether Satisfied With the Results of Last Call to Access-A-Ride By Overall Satisfaction Among Frequent/Occasional Users 2017 Overall Satisfaction 1 Satisfied Dissatisfied n= (853) (392) % % Satisfied Dissatisfied Don t know/refused 6 5 This question asked of: Frequent/Occasional Users who called to ask a question or report a problem 1 Note: Satisfied are those very or somewhat satisfied with Access-A-Ride. Dissatisfied those very or somewhat dissatisfied with Access-A-Ride. Q57F Whether Satisfied With the Results of Last Call to Access-A-Ride By Borough of Residence Among Frequent/Occasional Users Total Borough Bronx Manhattan Queens Brooklyn This question asked of: Frequent/Occasional Users who called to ask a question or report a problem Q57F Staten Island n= (1322) (1333) (1272) (288) (288) (246) (273) (177) % % % % % % % % Satisfied Dissatisfied Don t know/refused Q57F. How satisfied were you with the results? Would you say you were? 43
45 Expected Future Use of Access-A-Ride Expected Usage of Access-A-Ride in Upcoming Year This question asked of: Total Sample 1 This question asked of: Those who expect to use AAR less often in the next year *Multiple Responses Accepted, Top Mentions **Caution: Small Base Q50B-50C Frequent Users Occasional Users Infrequent Users Expected Use in Upcoming Year n= (2303) (2301) (2303) (1378) (625) (300) % % % % % % More often Less often About the same Not sure Refused Why Expect to Use AAR Less Often n= in the Next Year 1 * (45)** (61) (42)** (25)** (9)** (8)** % % % % % % Total: Less need Healthier/Better physical shape Fewer doctor s appointments Working less/retired Don t go out as much No need (not specific) Moving They are unreliable Medical limitations (i.e., less able to go out) Service (Other) People/Personnel/Poor treatment Other Q50B. In the next year or so would you expect to use Access-A-Ride, including vans, taxi rides and (broker car/voucher) service? Q50C. Why do you expect to use Access-A-Ride less often in the next year or so? 44
46 Interest in Access-A-Ride MetroCard Trips Awareness and Interest in MetroCard Program This question asked of: Total Sample 1 This question asked of: Those who are aware of the Access-A-Ride MetroCard 2 This question asked of: Those who do not have an Access-A-Ride MetroCard *New question added in Q B Awareness of AAR MetroCard That Will Allow Fixed-Route Transit Trips Free of Charge (2303) (2301) (2303) % Aware 51% 52% 61% Have AAR MetroCard 1 (1158) (1185) (1386) % Yes 76% 74% 65% Interest in Receiving Access-A-Ride MetroCard 2* (481) Yes 39% No 56 Q Are you aware of the Access-A-Ride MetroCard, which allows customers to take up to four free bus or subway rides per day? Q44.60A. Do you have an Access-A-Ride MetroCard? Q44.60B. Would you be interested in receiving an Access-A-Ride MetroCard, by calling Access-A-Ride and selecting option 1 to request one? 45
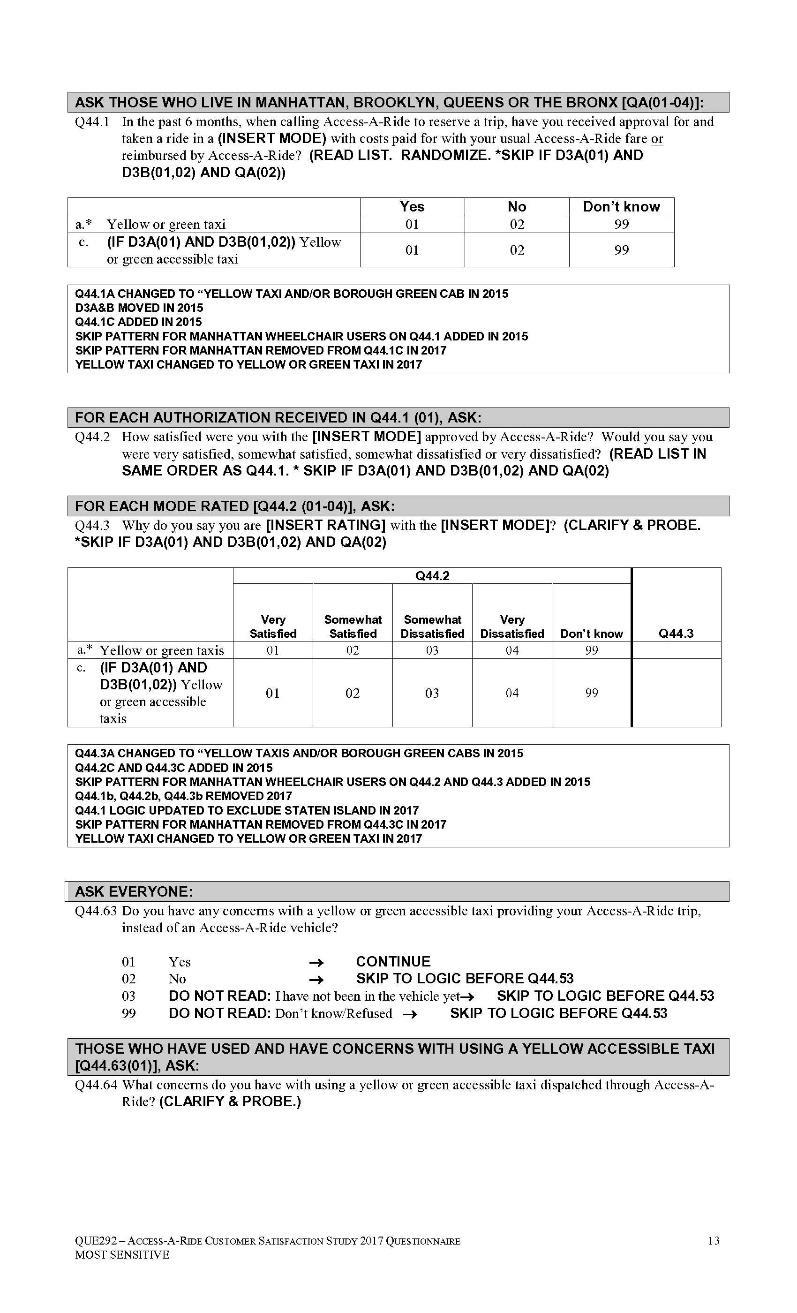
47 Approval/Usage of Specific Vehicles Approval and Usage of Yellow or Green Taxi Service Received Approval and Taken a Ride in Vehicles n= (1726) Yellow or green taxi 43% Satisfaction with Yellow or Green Taxi 1 n= (774) % Total: Satisfied 85 Very satisfied 64 Somewhat satisfied 21 Total: Dissatisfied 12 Somewhat dissatisfied 5 Very dissatisfied 6 Approval and Usage of Yellow or Green Accessible Taxi Service Received Approval and Taken a Ride in Vehicles n= (237) % Yellow or green accessible taxi 27 Satisfaction with Aspects of Yellow or Green Taxi 2* n= (654) On-time performance/don t have to wait/arrive early 40 Drivers are courteous/friendly/helpful 17 Good service/like the service (not specific) 10 Personnel/Employees are good/helpful/courteous/professional (not specific) 8 Dissatisfaction with Aspects of or Green Yellow Taxi 3* n= (97) Have trouble getting in and out of vehicles/vehicles are too small 19 (Some) Drivers not courteous/kind/helpful 13 Hard/Takes too long to get reimbursed 13 (Sometimes) Don t show up/cancel trips 12 Not on time/poor on-time performance (not specific) 8 (Some) Drivers don t wait/don t stop to pick me up/pass me by 8 % % Satisfaction with Yellow or Green Accessible Taxi 1* n= (67) % Total: Satisfied 78 Very satisfied 46 Somewhat satisfied 32 Total: Dissatisfied 16 Somewhat dissatisfied 11 Very dissatisfied 6 Those asked these questions altered in Trending impacted. This question asked of: Wheelchair users living in Brooklyn, Queens, Manhattan or the Bronx 1 This question asked of: Those who are have received approval and taken a ride in vehicle Q Those asked these questions altered in Trending impacted. This question asked of: Those who are not wheelchair users living in Brooklyn, Queens, Manhattan or the Bronx 1 This question asked of: Those who have received approval and taken a ride in vehicle 2 This question asked of: Those who are satisfied with the vehicle provided through AAR 3 This question asked of: Those who are dissatisfied with the vehicle provided through AAR *Multiple Responses Accepted; Top Mentions **Caution: Small Base Q Q44.1. In the past 6 months, when calling Access-A-Ride to reserve a trip, have you received approval for and taken a ride in a (INSERT MODE) with costs paid for with your usual Access-A-Ride fare or reimbursed by Access-A-Ride? Q44.2. How satisfied were you with the (INSERT MODE) approved by Access-A-Ride? Would you say you are very satisfied, somewhat satisfied, somewhat dissatisfied or very dissatisfied? Q44.3. Why do you say you are (INSERT RATING) with the (INSERT MODE)? 46
48 Concerns with Accessible Taxi Providing Access-a-Ride Trip Concerns with Accessible Yellow Taxi Providing Access-A-Ride Trip Year Have Concerns with Yellow or Green Accessible Taxi Providing Access-A-Ride Trip, Instead of an Access- A-Ride Vehicle (2301) (2303) Yes 22% 25% No Have not been in vehicle yet/don t know/refused Concerns with Using Yellow or Green Accessible Taxi Dispatched Through Access-A-Ride¹* (495) (573) Vehicles are difficult to get in and out of 20% 21% I required a lift/have a wheelchair/rollator/scooter Vehicles are uncomfortable/too small Late pick-ups/unreliability/no shows 7 12 Costs more money/sometimes I don t have money/have to wait for reimbursement Feel safer/prefer Access-A-Ride 8 10 Question wording changed in 2017 to include green accessible taxis. This question asked of: Total sample 1 This question asked of: Those who have concerns with using a yellow or green accessible taxi *Multiple Responses Accepted; Top Mentions Q44.63, Q44.64 Q44.63 Do you have any concerns with a yellow or green accessible taxi providing your Access-A-Ride trip, instead of an Access-A-Ride van or sedan? Q44.64 What concerns do you have with using a yellow or green accessible taxi dispatched through Access-A-Ride? 47
49 Recertification and Assessment Centers Recertification of Customers and Assessment Center Facilities By Borough of Residence Borough Bronx Manhattan Queens Brooklyn Staten Island Application/Recertification n= (2303) (2301) (2303) (492) (497) (493) (481) (340) Applied for/recertified in % 38% 37% 41% 37% 35% 36% 37% Personal Interviews 1 n= (840) (867) (860) (203) (185) (171) (172) (129) Gone to assessment center and had personal interview with health care professional 77% 76% 77% 82% 73% 71% 79% 82% Phone Reservationists 2 n= (600) (624) (628) (155) (132) (112) (129) (100) Phone reservationist was courteous 96% 96% 97% 98% 94% 93% 98% 97% Phone reservationist was competent This question asked of: Total Sample 1 This question asked of: Those who have applied for or been recertified in This question asked of: Those who spoke to a phone representative prior to assessment 3 This question asked of: Those who went to an assessment center and had a personal interview 4 This question asked of: Those who arrived at the assessment center at or before scheduled appointment time Q67A, 67, Arrival at Center 3 n= (640) (663) (665) (167) (135) (122) (136) (105) Arrived at assessment center at or before scheduled appointment 93% 94% 95% 99% 93% 93% 95% 96% Scheduled Evaluation 4 n= (593) (625) (634) (165) (126) (113) (129) (101) Evaluation took place at scheduled time/within a reasonable amount of time 91% 91% 93% 95% 90% 94% 92% 92% Assessment Facilities 3 n= (640) (663) (665) (167) (135) (122) (136) (105) Assessment facility was clean 94% 95% 95% 98% 96% 88% 97% 95% Assessment facility s waiting area was comfortable Treated with courtesy and respect by employees Q67A. Did you apply for or were you recertified for Access-A-Ride in 2017? Q67. Did you go to an assessment center and have a personal interview with a health care professional? Q67.1. When you were informed that you are required to go to an assessment center for an evaluation, was the phone representative courteous? Q67.2. Was the phone representative competent? Q Did you arrive at the assessment center at or before your scheduled appointment time? Q67.3. Did your evaluation take place at the scheduled appointment time, or within a reasonable amount of time of the scheduled time? Q67.4. Was the assessment facility clean? Q67.5. Was the assessment facility s waiting area comfortable? Q67.6. Were you treated with courtesy and respect by the employees at the assessment center? 48
50 Access to Mobile Phone When Using Access-A-Ride Access to Mobile Phone When Using Access-A-Ride 2017 Cell Phone Penetration n= (2303) Yes 91% No 9 Smart Phone Ownership 1 n= (2107) Yes 49% No 48 Mobile Phone Availability While Traveling on Access-A-Ride 1 n= (2107) Yes 99% No 1 This question asked of: Total Sample 1 This question asked of: Those who have a cell phone Q40.3-Q40.5 Q40.3. Do you have a cell phone? Q40.4. Do you own a smart phone? A smart phone is a cell phone that can be used to access the internet, like a computer. Q40.5. Do you carry your [cell phone/smart phone] with you when you travel with Access-A-Ride? 49
51 Accessibility to Other Transportation During Weather Emergency This question asked of: Total Sample Q68 Accessibility to Provided Transportation in the Event of a Weather Emergency By Borough of Residence Borough Bronx Manhattan Queens Brooklyn Staten Island n= (2303) (2301) (2303) (492) (497) (493) (481) (340) % % % % % % % % % Yes Q68. If you learned about a pending weather emergency, such as a hurricane, major snowstorm or flood, which required you to evacuate your home, do you have relatives, friends, or others that would provide you with transportation to an evacuation center or other safe location? 50
52 Calling Access-A-Ride and Selecting Option 8 Use of Option 8 When Calling Access-A-Ride Selected Option 8 When Calling Access-A-Ride to Give n= Commendation or Make a Complaint (2303) % (2301) % Yes % (2303) % Satisfaction When Giving Commendation or Making a n= (1056) Complaint 1 % (1131) Total: Satisfied Very satisfied Somewhat satisfied Total: Dissatisfied Somewhat dissatisfied Very dissatisfied % (1074) % Calling to Give a Commendation or Make a Complaint 1,3 n= (1074) Commendation 25% Complaint 70 Follow-Up to Making a Complaint *2,3 n= (746) Net: Received Follow-Up 55% Phone call 31 Written Response 29 None/Neither 41 Reasons Why Dissatisfied When Giving Commendation or n= Making a Complaint *1,3 (329) They never get back to you/no feedback/no response 27% They did not resolve the problem/it happened again 14% Some of the representatives are rude/don t seem to care 13% It feels like it goes nowhere/doesn t get looked at 11% Question wording changed in 2017 to remove reference to the toll-free number. This question asked of: Total Sample 1 This question asked of: Those who have called AAR and selected Option 8 to give a commendation or make a complaint 2 This question asked of: Those who have called AAR to make a complaint 3 Question added in *Multiple responses accepted, Top Mentions Q73-73D Q73. When calling Access-A-Ride, have you ever selected Option 8 to give a commendation or make a complaint? Q73A. How satisfied are you when calling to give a commendation or make a complaint? Would you say you are? Q73B. During your most recent call, was it to give a commendation or make a complaint? Q73C. Did you receive either a phone call or written follow-up to your complaint? Q73D. Why were you dissatisfied when giving a commendation or making a complaint? 51
53 Calling Access-A-Ride and Selecting Option 7 Use of Option 7 When Calling Access-A-Ride Selected Option 7 When Calling Access-A-Ride to Check Trip Status or Cancel a Trip (2303) (2301) (2303) % Yes 49% 53% 48% Comments or Concerns Regarding Automated Phone System 1* (1130) % (1217) % (1120) % Very satisfied/like it/no problems (not specific) Don t like talking to a machine/prefer a live person (Sometimes) Doesn t record ID or birthdate correctly Arrival times are not accurate It s This okay/alright question asked of: Total Sample This question asked of: Those who have called AAR and selected Option 7 to use the automated phone system for assistance *Multiple Responses Accepted, Top Mentions Q74, 75 Satisfaction With Option 7 When Calling Access-A-Ride Satisfaction With Automated Phone System When (1130) (1217) (1120) Getting the Status of a Trip % % % Total: Satisfied Very satisfied Somewhat satisfied Total: Dissatisfied Somewhat dissatisfied Very dissatisfied Have not used Satisfaction With Automated Phone System When Reviewing Upcoming Trips (1130) % (1217) % (1120) % Total: Satisfied Very satisfied Somewhat satisfied Total: Dissatisfied Somewhat dissatisfied Very dissatisfied Have not used Satisfaction With Automated Phone System When Cancelling Trips (1130) % (1217) % (1120) % Total: Satisfied Very satisfied Somewhat satisfied Total: Dissatisfied Somewhat dissatisfied Very dissatisfied Have not used This question asked of: Those who have called AAR and selected Option 7 to use the automated phone system for assistance Q74A-C Q74. When calling Access-A-Ride, have you ever selected the new Option 7 to use the automated phone system for assistance with checking the status of a trip, or cancelling a trip? Q74A-C. How satisfied are you with the automated phone system when using each of the following features? For each feature I mention, please tell me whether you are very satisfied, somewhat satisfied, somewhat dissatisfied or very dissatisfied, or if this is a feature you have not used? Q75. What comments or concerns, if any, do you have regarding the new automated phone system? 52
54 Rider Profile 53
55 Rider Profile Total This question asked of: Total Sample S1B Subscriber Type User Type Frequent Occasional Infrequent n= (2303) (1378) (625) (300) % % % % Conditional Full S1B. Subscriber Type (RECORD FROM SAMPLE, DO NOT ASK) 54
56 Rider Profile (continued) Demographics User Type User Type Total Frequent Occasional Infrequent Total Frequent Occasional Infrequent n= (2303) (1378) (625) (300) n= (2303) (1378) (625) (300) Age % % % % Employment % % % % Under Employed to Not employed to Don t know/refused <1 1 < to or older n= (259) (217) (28)* (14)* Refused 1 1 <1 1 Employment Status % % % % Mean (in years) Full-time Median (in years) Part-time Don t know/refused Gender % % % % Male Female This question asked of: Total Sample 1 This question asked of: Those who are employed *Caution: Small Base D1, B, D4-D4A D1. The following questions are for classification purposes only, and will be kept strictly confidential. Into which of the following categories does your age fall? B. Gender D4. Are you employed? D4A. Are you employed full-time or part-time? 55
57 Rider Profile (continued) Support Devices and Personal Care Attendants User Type Total Frequent Occasional Infrequent Use of Support Devices n= (2303) (1378) (625) (300) % % % % *Total: Any A support cane A walker/roller walker A manual wheel chair A motorized wheel chair Braces A long cane (for the blind) A scooter Do not/don t know if/refused if use a support device Travel with a personal care attendant 1 n= (1855) (1127) (494) (234) % % % % Yes This question asked of: Total Sample 1 This question asked of: Those who travel with a support device *Multiple Responses Accepted; Top Mentions D3A-D3C D3A. Do you normally use a support device of any kind when traveling? D3B. What type of support device do you use? D3C. Do you normally travel with a personal care attendant? 56
58 Appendix 57
59 History Tables Overall Satisfaction with Access-A-Ride Among Frequent/Occasional Users Year n= (1540) (1734) (1988) (2011) (2004) (2006) (2015) (2012) (2003) (2010) (2004) (2001) (2008) (2002) (2006) (2003) (2001) (2003) % % % % % % % % % % % % % % % % % % Total: Satisfied h Very satisfied h Somewhat satisfied Total: Dissatisfied i Somewhat dissatisfied i Very dissatisfied i This question asked of: Frequent/Occasional Users Q4 Overall Satisfaction with Access-A-Ride Among Infrequent Users Year n= (300) (300) (301) (303) (301) (301) (303) (301) (303) (302) (301) (300) (301) (301) (298) (300) (300) (300) % % % % % % % % % % % % % % % % % % Total: Satisfied Very satisfied Somewhat satisfied Total: Dissatisfied Somewhat dissatisfied Very dissatisfied This question asked of: Infrequent Users Q4 Q4. Now please tell me how satisfied you are with Access-A-Ride, overall. Would you say you are? 58
60 History Tables (continued) Change in Overall Satisfaction with Access-A-Ride By Borough of Residence Very or Somewhat Satisfied Among Frequent/Occasional Users Year % % % % % % % % % % % % % % % % % % Total (n=2003) h Bronx (n=425) h Manhattan (n=434) Queens (n=428) h Brooklyn (n=416) h Staten Island (n=300) Difference: Highest Lowest Borough (% Pts) This question asked of: Frequent/Occasional Users (n sizes for 2017) Q4 Change in Overall Satisfaction with Access-A-Ride By Borough of Residence Very Satisfied Among Frequent/Occasional Users Year % % % % % % % % % % % % % % % % % % Total (n=2003) h Bronx (n=425) h Manhattan (n=434) Queens (n=428) Brooklyn (n=416) h Staten Island (n=300) Difference: Highest Lowest Borough (% Pts) This question asked of: Frequent/Occasional Users (n sizes for 2017) Q4 Q4. Now please tell me how satisfied you are with Access-A-Ride, overall. Would you say you are? 59
61 History Tables (continued) Change in Overall Satisfaction with Access-A-Ride By Borough of Residence Very or Somewhat Dissatisfied Among Frequent/Occasional Users Year % % % % % % % % % % % % % % % % % % Total (n=2003) i Bronx (n=425) i Manhattan (n=434) Queens (n=428) i Brooklyn (n=416) i Staten Island (n=300) Difference: Highest Lowest Borough (% Pts) This question asked of: Frequent/Occasional Users (n sizes for 2017) Q4 Change in Overall Satisfaction with Access-A-Ride By Borough of Residence Very Dissatisfied Among Frequent/Occasional Users Year % % % % % % % % % % % % % % % % % % Total (n=2003) i Bronx (n=425) Manhattan (n=434) i Queens (n=428) i Brooklyn (n=416) i Staten Island (n=300) Difference: Highest Lowest Borough (% Pts) This question asked of: Frequent/Occasional Users (n sizes for 2017) Q4 Q4. Now please tell me how satisfied you are with Access-A-Ride, overall. Would you say you are? 60
62 History Tables (continued) This question asked of: Frequent/Occasional Users (n sizes for 2017) Q3 Perceptions of Changes in Overall Access-A-Ride Service During the Past Year Improved By Borough of Residence Among Frequent/Occasional Users Year % % % % % % % % % % % % % % % % % % Total (n=2003) h Bronx (n=425) h Manhattan (n=434) h Queens (n=428) Brooklyn (n=416) h Staten Island (n=300) This question asked of: Frequent/Occasional Users (n sizes for 2017) Q3 Perceptions of Changes in Overall Access-A-Ride Service During the Past Year Gotten Worse By Borough of Residence Among Frequent/Occasional Users Year % % % % % % % % % % % % % % % % % % Total (n=2003) i Bronx (n=425) i Manhattan (n=434) i Queens (n=428) i Brooklyn (n=416) i Staten Island (n=300) Q3. Would you say that during the past year, overall, Access-A-Ride service has? 61
63 History Tables (continued) Perceptions of Access-A-Ride as a Good Value For the Money By Borough of Residence And Level of Overall Satisfaction with Access-A-Ride Among Frequent/Occasional Users Year % % % % % % % % % % % % % % % % % % Total (n=2003) h Bronx (n=425) Manhattan (n=434) i Queens (n=428) h Brooklyn (n=416) h Staten Island (n=300) By Level of Satisfaction with Access-A-Ride Satisfied (n=1467) Dissatisfied (n=484) This question asked of: Frequent/Occasional Users (n sizes for 2017) Q7 Q7. Considering the fare and the service provided by Access-A-Ride, would you say it is? 62
64 History Tables (continued) Change in Overall Satisfaction with Last Access-A-Ride Trip By Borough of Residence Very/Somewhat Satisfied Among Frequent/Occasional Users % % % % % % % % % % % % % % % % % % Total (n=2003) Bronx (n=425) h Manhattan (n=434) h Queens (n=428) Brooklyn (n=416) Staten Island (n=300) This question asked of: Frequent/Occasional Users (n sizes for 2017) Q38 Change in Overall Satisfaction with Last Access-A-Ride Trip By Borough of Residence Very Satisfied Among Frequent/Occasional Users % % % % % % % % % % % % % % % % % % Total (n=2003) h Bronx (n=425) h Manhattan (n=434) h Queens (n=428) h Brooklyn (n=416) h Staten Island (n=300) This question asked of: Frequent/Occasional Users (n sizes for 2017) Q38 Change in Overall Satisfaction with Last Access-A-Ride Trip By Borough of Residence Very/Somewhat Dissatisfied Among Frequent/Occasional Users % % % % % % % % % % % % % % % % % % Total (n=2003) i Bronx (n=425) i Manhattan (n=434) i Queens (n=428) Brooklyn (n=416) Staten Island (n=300) This question asked of: Frequent/Occasional Users (n sizes for 2017) Q38 Q38. Overall, how satisfied were you with the trip we just discussed? Would you say you were? 63
65 History Tables (continued) Change in How Often Access-A-Ride Picks You Up Within the Standard for On-Time Pick-up By Frequency of Use, Overall Satisfaction and Borough Among Frequent/Occasional Users Usually Sometimes % % % % % % % % % % % % % % % % % % % % % % % % % % % % % % % % % % Total h i User Frequency Frequent Occasional h 54 h i Overall Satisfaction Satisfied h Dissatisfied i 55 h Borough of Residence Bronx Manhattan Queens Brooklyn This question asked of: Frequent/Occasional Users (2001 n=2004; 2003 n=2006; 2004 n=2015; 2005 n=2012; 2006 n=2003; 2007 n=2010; 2008 n=2004; 2011 n=2001; 2012 n=2008; 2013 n=2002; 2014 n=2006; 2015 n=2003; 2016 n=2001, 2017 n=2003) Q40C 51 h 47 h 53 h 48 h Staten Island i Q40C. Based on your experience, how often does Access-A-Ride pick you up within the standard for on-time pickup? That is, no later than 30 minutes after the time of your scheduled pick up. Would you say they? 64
66 History Tables (continued) Perceptions of Changes in Access-A-Ride Reservation Service Among Frequent/Occasional Users Year n= (1734) (1988) (2011) (2004) (2006) (2015) (2012) (2003) (2010) (2004) (2001) (2008) (2002) (2006) (2003) (2001) (2003) % % % % % % % % % % % % % % % % % Improved Stayed about the same Gotten worse i Don t know/refused h This question asked of: Frequent/Occasional Users Q40F Q40F. Now think again about making reservations for a ride. In the past year, would you say that Access-A-Ride s Reservation Service has? 65
67 History Tables (continued) Ways in Which the Access-A-Ride Reservation Service Has Improved/Gotten Worse by Perceptions of Changes in Access-A-Ride Reservation Service Among Frequent/Occasional Users Improved n= (452) (683) (676) (599) (826) (706) (632) (623) (651) (629) (542) (604) (1340) (1042) (849) (721) (729) % % % % % % % % % % % % % % % % % Manner/Performance of reservationists n/a n/a n/a n/a n/a Phone answering promptness On-time performance Reservationists knowledge n/a n/a n/a n/a n/a n/a Number of errors n/a n/a n/a n/a n/a n/a - < Can t understand/don t speak English n/a n/a n/a n/a n/a n/a < Reference to reservation system (Unspecified) n/a n/a n/a n/a n/a n/a < Hours/Schedules/Routes <1 < h Non-specific reference to service n/a n/a n/a n/a n/a n/a Get put on hold too long/too frequently n/a n/a n/a n/a n/a n/a n/a n/a n/a n/a n/a n/a n/a n/a n/a n/a n/a Ways in Which the Access-A-Ride Reservation Service Has Improved/Gotten Worse by Perceptions of Changes in Access-A-Ride Reservation Service Among Frequent/Occasional Users Gotten Worse n= (230) (247) (152) (155) (113) (91) (109) (115) (108) (149) (198) (159) (45)* (84) (88) (150) (110) This question asked of: Frequent/Occasional Users who feel the Reservation Service has changed Multiple Responses Accepted; Select Mentions *Caution: Small Base n/a=data not available Q40G % % % % % % % % % % % % % % % % % Manner/Performance of reservationists n/a n/a n/a n/a n/a n/a Phone answering promptness On-time performance Reservationists knowledge n/a n/a n/a n/a n/a n/a Number of errors n/a n/a n/a n/a n/a n/a Can t understand/don t speak English n/a n/a n/a n/a n/a n/a Reference to reservation system (Unspecified) n/a n/a n/a n/a n/a n/a Hours/Schedules/Routes Non-specific reference to service n/a n/a n/a n/a n/a n/a Get put on hold too long/too frequently n/a n/a n/a n/a n/a n/a Q40G. In what ways has the Reservation Service (improved/gotten worse)? 66
68 History Tables (continued) Overview of Performance of Key Elements of the Last Trip with Access-A-Ride Among Frequent/Occasional Users Year On Time Pick-up n= (1540) (1734) (1988) (2011) (2004) (2006) (2015) (2012) (2003) (2010) (2004) (2001) (2008) (2002) (2006) (2003) (2001) (2003) Picked up no later than 30 minutes after the time you were scheduled to be picked up* 82% 79% 74% 80% 82% 82% 84% 83% 81% 85% 84% 83% 85% 84% 79% 76% 78% 81%h Courtesy of Driver 1 n= (1540) (1734) (1988) (2011) (2004) (2006) (2015) (2012) (2003) (2010) (2004) (2001) (2008) (2002) (2006) (2003) (2001) (1998) Driver was courteous 96% 96% 95% 95% 95% 96% 96% 95% 96% 95% 96% 96% 96% 96% 96% 96% 93% 96%h Operation of Vehicle 1 n= n/a (1734) (1988) (2011) (2004) (2006) (2015) (2012) (2003) (2010) (2004) (2001) (2008) (2002) (2006) (2003) (2001) (1998) Driver operated the vehicle in a careful and safe n/a 96% 96% 96% 96% 96% 97% 96% 96% 97% 97% 97% 96% 96% 97% 96% 95% 97%h manner Trip Time 1 n= n/a (1734) (1988) (2011) (2004) (2006) (2015) (2012) (2003) (2010) (2004) (2001) (2008) (2002) (2006) (2003) (2001) (1998) Trip took a reasonable amount of time 86% 88% 89% 89% 90% 89% 89% 90% 91% 92% 89% 90% 91% 88% 87% 86% 85% 88%h Driver s Assistance 1 n= (1540) (1734) (1988) (2011) (2004) (2006) (2015) (2012) (2003) (2010) (2004) (2001) (2008) (2002) (2006) (2003) (2001) (1998) Needed driver s assistance after out of the vehicle 43% 42% 42% 38% 27% 27% 27% 23% 22% 28% 30% 35% 34% 34% 36% 38% 37% 35% Driver s Offer of Assistance 2 n= (679) (742) (837) (783) (597) (579) (565) (489) (459) (573) (598) (693) (680) (675) (723) (759) (725) (689) Driver offered to assist 91% 95% 95% 89% 90% 89% 88% 88% 88% 89% 89% 90% 92% 92% 93% 93% 91% 91% This question asked of: Frequent/Occasional Users 1 Starting in 2017, this question asked of: Frequent/Occasional Users who were picked-up 2 This question asked of: Frequent/Occasional Users who needed driver s assistance *Note: Changed in 2004 to no later than 30 minutes after the time of your scheduled pick-up n/a=data not available Q21A, 23, 23A, 24, 30A-B Q21A. Were you picked up by Access-A-Ride within the standard for on-time pickup? That is, no later than 30 minutes after the time you were scheduled to be picked up. Q23. Was the driver courteous? Q23A. Did the driver operate the vehicle in a careful and safe manner? Q24. Did the trip take a reasonable amount of time? Q30A. Speaking again about your last Access-A-Ride trip, did you need the driver s assistance after you were out of the vehicle? Q30B. Did the driver assist you after you were getting out of the vehicle? 67
69 History Tables (continued) Ever Called Access-A-Ride To Ask a Question or Report a Problem By User Frequency, Borough of Residence and Level of Satisfaction Year Total n= (1840) (2034) (2289) (2314) (2305) (2307) (2318) (2313) (2306) (2312) (2305) (2301) (2309) (2303) (2304) (2303) (2301) (2303) 43% 43% 43% 45% 40% 43% 42% 44% 42% 47% 44% 43% 51% 53% 58% 62% 64% 59%i Frequent Users n= (1064) (1204) (1350) (1385) (1377) (1381) (1385) (1384) (1375) (1384) (1376) (1376) (1377) (1376) (1380) (1378) (1375) (1378) 53% 50% 48% 52% 46% 48% 48% 49% 50% 54% 51% 51% 60% 62% 64% 70% 72% 68%i Occasional Users n= (476) (530) (638) (626) (627) (625) (630) (628) (628) (626) (628) (625) (631) (626) (626) (625) (626) (625) 37% 34% 37% 37% 32% 39% 33% 38% 35% 42% 36% 35% 42% 41% 52% 55% 55% 51% Infrequent Users n= (300) (300) (301) (303) (301) (301) (303) (301) (303) (302) (301) (300) (301) (301) (298) (300) (300) (300) 23% 27% 29% 31% 30% 32% 33% 34% 24% 27% 27% 25% 30% 33% 41% 39% 47% 38%i Satisfied (Frequent/Occasional Users) n= (1137) (1292) (1446) (1521) (1613) (1593) (1553) (1567) (1571) (1567) (1506) (1523) (1583) (1584) (1472) (1328) (1316) (1467) 42% 41% 39% 40% 37% 41% 39% 41% 41% 46% 43% 41% 50% 53% 55% 60% 61% 58% Dissatisfied (Frequent/Occasional Users) n= (396) (427) (510) (405) (377) (401) (390) (406) (382) (373) (412) (433) (375) (354) (505) (607) (638) (484) 64% 59% 63% 68% 60% 63% 59% 63% 61% 69% 60% 63% 72% 72% 77% 78% 79% 80% Bronx (Frequent/Occasional Users) n= (339) (364) (342) (432) (426) (426) (425) (426) (426) (423) (424) (424) (422) (425) (428) (428) (422) (425) 53% 51% 41% 48% 45% 42% 49% 49% 47% 51% 47% 47% 52% 56% 61% 69% 70% 67% Manhattan (Frequent/Occasional Users) n= (325) (373) (406) (427) (425) (426) (430) (425) (426) (434) (428) (428) (437) (430) (425) (430) (427) (434) 48% 52% 52% 54% 46% 52% 50% 48% 51% 53% 51% 50% 60% 62% 66% 69% 70% 65% Queens (Frequent/Occasional Users) n= (325) (375) (460) (426) (425) (426) (424) (426) (428) (424) (389) (427) (429) (419) (425) (425) (431) (428) 40% 44% 41% 48% 43% 48% 44% 46% 48% 51% 49% 43% 56% 54% 62% 65% 65% 57%i Brooklyn (Frequent/Occasional Users) n= (325) (376) (478) (425) (426) (429) (433) (432) (423) (429) (481) (420) (421) (426) (424) (417) (419) (416) 53% 45% 50% 47% 41% 44% 40% 45% 43% 51% 45% 48% 53% 56% 58% 64% 67% 64% Staten Island (Frequent/Occasional n= (226) (246) (302) (301) (302) (300) (303) (303) (300) (300) (282) (302) (299) (302) (304) (303) (302) (300) Users) 42% 34% 34% 34% 31% 37% 33% 35% 35% 40% 41% 37% 51% 51% 56% 57% 58% 60% This question asked of: Total Sample Q57 Q57. Besides calling for reservations or calling on the day of your trip, have you ever called Access-A-Ride to ask a question or report a problem? 68
70 Methodology Charts Using sampling techniques, we can estimate the responses of an entire population without having to interview everyone in the target group. There are mathematical means to measure how close our random-sample estimate comes to the 'true' value of the population. For the 2,303 interviews conducted for the Customer Satisfaction survey, we can expect the values from our sample to be within 2 percentage of the true population value, 95 percent of the time. That means, if we get a value of 50 percent from our sample, we can be 95 percent sure that the population value is somewhere between 48 and 52 percent. This measure of the difference of the sample value from the true value, called the 'margin of error' will vary with the size of the sample and the results received. The chart below details the margin of error by the user segments surveyed. If the percentage found is around: 50% Then, the standard error, in percentage would be: 40% or 60% 30% or 70% 20% or 80% 10% or 90% 1% or 99% Total Sample (n = 2303) ±2.0 ±2.0 ±1.9 ±1.6 ±1.2 ±0.4 Frequent Users (n = 1378) ±2.6 ±2.6 ±2.4 ±2.1 ±1.6 ±0.5 Occasional Users (n = 625) ±3.9 ±3.8 ±3.6 ±3.1 ±2.4 ±0.8 Infrequent Users (n = 300) ±5.7 ±5.5 ±5.2 ±4.5 ±3.4 ±1.1 For example, if a question in the study asked among the Total Sample yielded a percentage of 20%, then we can be sure 95 out of 100 times that the true percentage would lie between 18.4% and 21.6% (20% ± 1.6 percentage ). 69
71 Methodology Charts (continued) The charts below detail the user segments surveyed, as defined by the frequency of AAR ride requests made between July and September 2017: July-September 2017 AAR User Segment # of Interviews Frequency of Ride Requests % of Registrants % of Requests Frequent Users requests May-July 5% 76% Occasional Users requests May-July 12% 18% Infrequent Users requests May-July 24% 6% Total 2303 Completed Interviews n= (2303) Bronx 491 Frequent 301 Occasional 125 Infrequent 65 Brooklyn 490 Frequent 300 Occasional 125 Infrequent 65 Manhattan 492 Frequent 302 Occasional 125 Infrequent 65 Queens 490 Frequent 300 Occasional 125 Infrequent 65 Staten Island 340 Frequent 175 Occasional 125 Infrequent 40 This question asked of: Total Sample 70
72 Methodology Charts (continued) The survey data were weighted to better represent the actual number of active registrants in each borough (the universe). For example, the number of completed surveys among frequent users in the Bronx for the 2017 study was 301, which represents 21.8% of the total sample of 1,378 frequent users surveyed. However, in the real universe of 22,341 frequent users, the Bronx only represents 18.0%. Therefore, a weighting factor of less than one (in this case ) is applied to each respondent from the Bronx frequent user segment so that in total they will now represent only 18.0% of the total. The weighting factors are determined by dividing the target number of completes in a segment that will be representative of the actual universe (e.g., 248 actual Bronx frequent users) by the number of surveys completed among that segment (e.g. 301 Bronx frequent user completes), which in this case gives you Weights Completes % of Completes Universe % of Uni. Target Weight Bronx-Frequent % % Brooklyn-Frequent % % Manhattan-Frequent % % Queens-Frequent % % Staten Island-Frequent % % Total-Frequent Bronx-Occasional % % Brooklyn-Occasional % % Manhattan-Occasional % % Queens-Occasional % % Staten Island-Occasional % % Total-Occasional Bronx-Infrequent % % Brooklyn-Infrequent % % Manhattan-Infrequent % % Queens-Infrequent % % Staten Island-Infrequent % % Total-Infrequent
73 Questionnaire 72
74 Questionnaire 73
75 Questionnaire 74
76 Questionnaire 75
77 Questionnaire 76
78 Questionnaire 77
79 Questionnaire 78
80 Questionnaire 79
81 Questionnaire 80
82 Questionnaire 81
2016 Q4 CUSTOMER SATISFACTION SURVEY
 2016 Q4 CUSTOMER SATISFACTION SURVEY Quarterly Report PREPARED IN PARTNERSHIP WITH: TABLE OF CONTENTS Methodology 3 Executive Summary 4 Summary of Findings 6 Key Drivers by Mode 27 Individual Measures
SF Access Services SF Access Reservations and Where s My Ride
 SF Access Services SF Access Reservations and Where s My Ride 1-415-285-6945 SF Paratransit Main Administration 1-415-351-7000 TTY 1-415-351-3942 www.sfparatransit.com Table of Contents 3 Introduction
2016 uarterly Customer Satisfaction Survey
 Q 2016 uarterly Customer Satisfaction Survey Submitted to WaterOne 3 rd Quarter Results ETC Institute 725 W Frontier Ln, Olathe, KS 66061 913.829.1215 September 2016 Contents Executive Summary... 1 Section
Consumer Perceptions and Reactions to the CARD Act
 Consumer Perceptions and Reactions to the CARD Act Prepared for: Consumer Financial Protection Bureau Prepared by: Synovate Date: February 22 nd 11 Synovate 11 0 Contents Executive Summary 2 Research Overview
Transamerica Small Business Retirement Survey
 Transamerica Small Business Retirement Survey Summary of Findings October 16, 2003 Table of Contents Background and Objectives 3 Methodology 4 Key Findings 2003 8 Key Trends - 1998 to 2003 18 Detailed
2008 Cecil County Public Opinion Survey Results Summary
 Cecil County Public Opinion Survey Results Summary Survey completed by Public National Research Center Inc. Report created by WILMAPCO September www.wilmapco.org September 29, About the Survey PURPOSE
Public Agenda / WNYC New York Metro Area Survey
 Public Agenda / WNYC New York Metro Area Survey June 29 through July 21, 2015 and additional sample from August 25 through September 4, Collected by Social Science Research Solutions, Inc. TOPLINE Released
NEW YORK CITY TAXI AND LIMOUSINE COMMISSION. Notice of Public Hearing and Opportunity to Comment on Proposed Rules
 NEW YORK CITY TAXI AND LIMOUSINE COMMISSION Notice of Public Hearing and Opportunity to Comment on Proposed Rules What are we proposing? The Taxi and Limousine Commission is considering implementing Congestion
Paratransit Advisory Committee
 May 19, 2015 Meeting Minutes Paratransit Advisory Committee Attendance: Fr. James Bradley, Tom Coppola, Lyudmila Demikhovskya, David H. DePorte, Ellen Rubin, Mindy Jacobsen, Miriam Kimmelman, John Moynihan,
THE CAQ S SEVENTH ANNUAL. Main Street Investor Survey
 THE CAQ S SEVENTH ANNUAL Main Street Investor Survey DEAR FRIEND OF THE CAQ, Since 2007, the Center for Audit Quality (CAQ) has commissioned an annual survey of U.S. individual investors as a part of its
Medicaid and PeachCare for Kids Member Survey: Customer Service Satisfaction. Fall Prepared for ACS. By the Georgia Health Policy Center
 Medicaid and PeachCare for Kids Member Survey: Customer Service Satisfaction Prepared for ACS By the Georgia Health Policy Center CONTENTS EXECUTIVE SUMMARY... 2 BACKGROUND... 5 METHODOLOGY... 7 Sample...
2014 Citizen Survey. Prepared for: Prince William County. Prepared by: ORC International, Inc. September, PRIVATE complies with ISO 20252
 2014 Citizen Survey Prepared for: Prince William County Prepared by: ORC International, Inc. September, 2014 PRIVATE complies with ISO 20252 [Blank page inserted for pagination purposes when printing.]
Office of the City Manager CONSENT CALENDAR May 19, 2009
 Office of the City Manager CONSENT CALENDAR May 19, 2009 To: From: Honorable Mayor and Members of the City Council Phil Kamlarz, City Manager Submitted by: Jane Micallef, Acting Housing Director Subject:
Impact of the Living Wage on Paratransit Services
 Impact of the Living Wage on Paratransit Services January 25, 2008 Report No. 08-06 Office of the County Auditor Evan A. Lukic, CPA County Auditor Table of Contents Topic Page Executive Summary... 3 Purpose
09/03/2016 Communicating on Infrastructure Investments in Calgary
 Communicating on Infrastructure Investments in Calgary Report: March 2016 Prepared for The City of Calgary by: Contact: Jamie Duncan Vice President Ipsos 587.952.4863 jamie.duncan@ipsos.com 700 6 th Ave
Calgary Police Commission. Annual Citizen Satisfaction Survey Report
 Calgary Police Commission Annual Citizen Satisfaction Survey Report 2016 CONTENTS I n t r o d u c t i o n C i t i z e n Perceptions of Crime & Safety C o n f i d e n c e i n t h e C PS C i t i z e n Perceptions
Marist College Institute for Public Opinion Poughkeepsie, NY Phone Fax
 Marist College Institute for Public Opinion Poughkeepsie, NY 12601 Phone 845.575.5050 Fax 845.575.5111 www.maristpoll.marist.edu NY1-Marist Poll Almost Two-Thirds Expect Another Storm NYC Will Be Ready,
City of Lethbridge 2014 Community Satisfaction Survey. Key Findings August 2014
 City of Lethbridge 2014 Community Satisfaction Survey Key Findings August 2014 Background and Methodology Ipsos Reid conducted a telephone survey with a randomly selected sample of 400 residents of Lethbridge
2018 Report. July 2018
 2018 Report July 2018 Foreword This year the FCA and FCA Practitioner Panel have, for the second time, carried out a joint survey of regulated firms to monitor the industry s perception of the FCA and
PEW SOCIAL & DEMOGRAPHIC TRENDS JULY 2012 MIDDLE CLASS UPDATE SURVEY FINAL TOPLINE JULY 16-JULY 26, 2012 TOTAL N=2,508
 1 PEW SOCIAL & DEMOGRAPHIC TRENDS JULY 2012 MIDDLE CLASS UPDATE SURVEY FINAL TOPLINE JULY 16-JULY 26, 2012 TOTAL N=2,508 NOTE: ALL NUMBERS ARE PERCENTAGES. THE PERCENTAGES GREATER THAN ZERO BUT LESS THAN
Credit Card Market Study Interim Report: Annex 3: Results from the consumer survey
 MS14/6.2: Annex 3 Market Study Interim Report: Annex 3: November 2015 November 2015 0 Contents 1 Introduction 2 Definitions 2 Background to the 3 The structure of this document 4 2 Consumer understanding
Results by Oversampled Audiences June 2014
 Results by Oversampled Audiences June 2014 SURVEY OVERVIEW Methodology Penn Schoen Berland completed 3,279 telephone interviews between April 3, 2014 and May 6, 2014 This report includes the following
Annual Customer Survey Report Prepared by: For:
 Annual Customer Survey Report 2017 Prepared by: For: December 2017 TABLE OF CONTENTS METHODOLOGY & LOGISTICS 2 EXECUTIVE SUMMARY RESIDENTIAL 3 SATISFACTION 3 CUSTOMER SERVICE 4 PRICE & VALUE 5 RATING GREATER
Medicaid Non-Emergency Transportation Request for Proposals. Responses to Questions Received by the March 11 Deadline (Posted March 17, 2011)
") Medicaid Non-Emergency Transportation Request for Proposals Responses to Questions Received by the March 11 Deadline (Posted March 17, 2011) 1. Could the MPO please provide a link to (or an electronic
Medicaid Non-Emergency Transportation Request for Proposals Responses to Questions Received by the March 11 Deadline (Posted March 17, 2011) 1. Could the MPO please provide a link to (or an electronic
Customers experience of the Tax Credits Helpline
 Customers experience of the Tax Credits Helpline Findings from the 2009 Panel Study of Tax Credits and Child Benefit Customers Natalie Maplethorpe, National Centre for Social Research July 2011 HM Revenue
Canadian Mutual Fund Investor Survey. July,
 Canadian Mutual Fund Investor Survey July, 1 Table of Contents Slide Research Objectives and Methodology 3 Key Findings 7 Results in Detail 14 Attitudes toward Investment Products and Investment Strategy
Eagleton Institute of Politics Rutgers, The State University of New Jersey 191 Ryders Lane New Brunswick, New Jersey
 Eagleton Institute of Politics Rutgers, The State University of New Jersey 191 Ryders Lane New Brunswick, New Jersey 08901-8557 www.eagleton.rutgers.edu eagleton@rci.rutgers.edu 732-932-9384 Fax: 732-932-6778
LONG ISLAND INDEX SURVEY CLIMATE CHANGE AND ENERGY ISSUES Spring 2008
 LONG ISLAND INDEX SURVEY CLIMATE CHANGE AND ENERGY ISSUES Spring 2008 Pervasive Belief in Climate Change but Fewer See Direct Personal Consequences There is broad agreement among Long Islanders that global
2005 Health Confidence Survey Wave VIII
 2005 Health Confidence Survey Wave VIII June 30 August 6, 2005 Hello, my name is [FIRST AND LAST NAME]. I am calling from National Research, a research firm in Washington, D.C. May I speak to the youngest
A Compendium of Findings About American Employers 15 th Annual Transamerica Retirement Survey. April 2015 TCRS
 A Compendium of Findings About American Employers th Annual Transamerica Retirement Survey April TCRS - Table of Contents PAGE Introduction to the Retirement Study: Employer Perspective About the Transamerica
Transamerica Center for Health Studies Survey: Employer Attitudes Toward the Employer Mandate and the ACA
 Transamerica Center for Health Studies Survey: Employer Attitudes Toward the Employer Mandate and the ACA December 2016 Table of Contents About the Transamerica Center for Health Studies Page 3 About The
2007 Minnesota Department of Revenue Taxpayer Satisfaction with the Filing Process
 2007 Minnesota Department of Revenue Taxpayer Satisfaction with the Filing Process Prepared for: The Minnesota Department of Revenue July 2007 2007 Minnesota Department of Revenue Taxpayer Satisfaction
Minnesota Valley Prepaid Meter Study Consumer Survey
 Minnesota Valley Prepaid Meter Study Consumer Survey June, 2014 NRECA MARKET RESEARCH SERVICES Methodology A combination of telephone and on-line surveys were conducted with co-op members between June
311 Call Centre Satisfaction Study
 311 Call Centre Satisfaction Study Report January 2017 Context and Objectives The 311 Call Centre is a service provided by the City of Edmonton that allows citizens access to City of Edmonton information,
We recommend adding a password to your account for an extra layer of security.
 Corporate Profile Application Once approved, a Dial 7 Car & Limousine Service representative will contact you within 1 business day to obtain additional information to activate your account. Company Information
WILMAPCO Public Opinion Survey Summary of Results
 Wilmington Area Planning Council WILMAPCO Public Opinion Survey Summary of Results April 2018 Prepared by: 2955 Valmont Road, Suite 300 Boulder, Colorado 80301 t: 303-444-7863 f: 303-444-1145 www.n-r-c.com
Seniors Opinions About Medicare Rx
 **EMBARGOED UNTIL OCT. 3 AT 10AM EDT** Seniors Opinions About Medicare Rx October 2012 www.krcresearch.com Table of Contents Method 3 Executive Summary 7 Detailed Findings 9 Satisfaction 10 How Medicare
2015 DataHaven Community Wellbeing Survey Danbury, CT Crosstabs
 2015 Danbury, CT Crosstabs How To Read This Document These crosstabs present question-by-question weighted estimates from the 2015, disaggregated by various demographic and socioeconomic characteristics.
PASSENGER HANDBOOK. Cody Roggatz Transportation Director City of Aberdeen
 1 P u b l i c T r a n s p o r t a t i o n A B E R D E E N R I D E L I N E PASSENGER HANDBOOK Effective: May 1999 R e v i s e d : M a r c h 2 0 1 6 T r a n s i t S y s t e m S p o n s o r e d b y t h e
2015 DataHaven Community Wellbeing Survey Greater New Britain (Community Foundation of Greater New Britain Region) Crosstabs
 Crosstabs") 2015 Britain (Community Foundation of Britain Region) Crosstabs How To Read This Document These crosstabs present question-by-question weighted estimates from the 2015, disaggregated by various demographic
2015 Britain (Community Foundation of Britain Region) Crosstabs How To Read This Document These crosstabs present question-by-question weighted estimates from the 2015, disaggregated by various demographic
Once you have provided all necessary information, the TMS operator will tell you how your request will be met.
 CHESTER J. CULVER, GOVERNOR PATTY JUDGE, LT. GOVERNOR DEPARTMENT OF HUMAN SERVICES CHARLES J. KROGMEIER, DIRECTOR September 1, 2010 Dear Iowa Medicaid Member: Earlier this year, the Iowa Department of
National Survey of Small Businesses
 Highlights and Chartpack The Kaiser Family Foundation National Survey of Small Businesses April 2002 Methodology: The Kaiser Family Foundation s National Survey of Small Businesses reports findings from
2017 Quality of Life and Citizen Satisfaction Survey
 2017 Quality of Life and Citizen Satisfaction Survey Presentation Presented by: Jamie Duncan Vice President, Canada Ipsos Public Affairs Krista Ring Manager, Customer Experience & Research Customer Service
Experience and Satisfaction Levels of Long-Term Care Insurance Customers: A Study of Long-Term Care Insurance Claimants
 Experience and Satisfaction Levels of Long-Term Care Insurance Customers: A Study of Long-Term Care Insurance Claimants SEPTEMBER 2016 Table of Contents Executive Summary 4 Background 7 Purpose 8 Method
Telephone Survey in the City of Mercer Island n=304, Margin of Error = ± 5.7 Points Conducted April 6 th - 9 th, 2014 EMC Research #
 Telephone Survey in the City of Mercer Island n=304, Margin of Error = ± 5.7 Points Conducted April 6 th - 9 th, 2014 EMC Research #14-5209 When applicable, results are compared to previous Mercer Island
Canadian Mutual Fund Investors Perceptions of Mutual Funds and the Mutual Funds Industry. Report 2017
 Canadian Mutual Fund Investors Perceptions of Mutual Funds and the Mutual Funds Industry Report Table of Contents Research Objectives and Methodology 3 Key Findings 7 Results in Detail 14 Slide Attitudes
Reason-Rupe January 2015 National Poll Princeton Survey Research Associates International January 27, pm
 Reason-Rupe January 2015 National Poll Princeton Survey Research Associates International January 27, 2015 3pm N = 1,000 (500 from Landline RDD Sample / 500 from Cell RDD Sample) Interviewing dates: January
Medicaid and PeachCare for Kids Provider Survey: Customer Service Satisfaction Survey Spring Prepared for ACS
 Medicaid and PeachCare for Kids Provider Survey: Customer Service Satisfaction Survey Spring 2004 Prepared for ACS Prepared by the Georgia Health Policy Center At Georgia State University 1 EXECUTIVE SUMMARY...
Florida Department of Community Affairs & Regional Planning Councils of Florida STATEWIDE EVACUATION STUDY: East Central Report
 2008 Florida Department of Community Affairs & Regional Planning Councils of Florida STATEWIDE EVACUATION STUDY: Report Authors: Phillip E. Downs, Ph.D., Principal Investigator Sonia Prusaitis, Senior
Key Findings from a Citywide Voter Survey Conducted December 1-7, 2017 Commissioned by the San Francisco County Transportation Authority
 Key Findings from a Citywide Voter Survey Conducted December 1-7, 2017 Commissioned by the San Francisco County Transportation Authority 220-4934 1 Survey Methodology 1,013 online and telephone interviews
The Central Limit Theorem (Solutions) COR1-GB.1305 Statistics and Data Analysis
 COR1-GB.1305 Statistics and Data Analysis") The Central Limit Theorem (Solutions) COR1-GB1305 Statistics and Data Analysis 1 You draw a random sample of size n = 64 from a population with mean µ = 50 and standard deviation σ = 16 From this, you
The Central Limit Theorem (Solutions) COR1-GB1305 Statistics and Data Analysis 1 You draw a random sample of size n = 64 from a population with mean µ = 50 and standard deviation σ = 16 From this, you
Other MSAs Rochester Other MSAs 2017
 Q1. Which of the following industry categories best describes the type of business your company is engaged in? Total Total Total Total Engineering and Construction 10% 17% 19% 20% 18% 17% 16% 16% 18% 17%
Princeton Senior Shuttle Service
 Princeton Senior Shuttle Service By James Mejia Micah Perlin REPORT AS PART OF WWS 527A TRANSPORTATION POLICY ANALYSIS FALL 2003 1.0 Executive Summary The senior population in Princeton is underserved
The 14 th Annual Transamerica Retirement Survey: The Employer s Perspective
 The th Annual Transamerica Retirement Survey: The Employer s Perspective October TCRS - Transamerica Center for Retirement Studies, Transamerica Center for Retirement Studies, Table of Contents PAGE Introduction
311 Call Centre Satisfaction Study
 311 Call Centre Satisfaction Study Report November 2017 Context and Objectives The 311 Call Centre is a service provided by the City of Edmonton that allows citizens access to City of Edmonton information,
Other MSAs Buffalo Other MSAs 2017
 Q1. Which of the following industry categories best describes the type of business your company is engaged in? Total Total Total Total Engineering and Construction 13% 17% 19% 12% 18% 20% 11% 16% 12% 17%
The Employers Perspective on Retirement Benefits and Planning
 The Employers Perspective on Retirement Benefits and Planning th Annual Transamerica Retirement Survey TCRS 0-0 Transamerica Center for Retirement Studies, 0 Table of Contents PAGE Introduction to the
Commuter Benefit Solutions
 Commuter Benefit Solutions Learn more about the NYC Transit Ordinance 1 of 11 Contents What are Commuter Benefits? 3 What is the New York City Transit Ordinance? 5 Complying with the NYC Transit Ordinance
Marist College Institute for Public Opinion Poughkeepsie, NY Phone Fax
 Marist College Institute for Public Opinion Poughkeepsie, NY 12601 Phone 845.575.5050 Fax 845.575.5111 www.maristpoll.marist.edu Best NYC Mayor Bloomberg s Approval Rating Voters Views on Bloomberg s Third
Marist College Institute for Public Opinion Poughkeepsie, NY Phone Fax
 Marist College Institute for Public Opinion Poughkeepsie, NY 12601 Phone 845.575.5050 Fax 845.575.5111 www.maristpoll.marist.edu POLL MUST BE SOURCED: The Wall Street Journal/NBC 4 New York/Marist Poll*
Paratransit Advisory Committee (PAC)
") Paratransit Advisory Committee (PAC) May 16, 2017 Meeting Minutes Meeting commenced at 5:15 p.m. PAC Attendees: Thomas Coppola, Lyudmila Demikovskaya, Edward S. Friedman, Ellen Rubin, Jean Ryan, Ken Stewart,
Paratransit Advisory Committee (PAC) May 16, 2017 Meeting Minutes Meeting commenced at 5:15 p.m. PAC Attendees: Thomas Coppola, Lyudmila Demikovskaya, Edward S. Friedman, Ellen Rubin, Jean Ryan, Ken Stewart,
Flash Eurobarometer 458. Report. The euro area
 The euro area Survey requested by the European Commission, Directorate-General for Economic and Financial Affairs and co-ordinated by the Directorate-General for Communication This document does not represent
City of Tacoma, WA Citizen Survey Report of Results
 City of Tacoma, WA Citizen Survey Report of Results October 2010 Prepared by: 3005 30th Street Boulder, CO 80301 303-444-7863 www.n-r-c.com Table of Contents Executive Summary... 1 Survey Background...
Now I have some questions about work and family
 PEW SOCIAL & DEMOGRAPHIC TRENDS WORK/WOODSTOCK/GENERATION GAP SURVEY TOPLINE FOR SELECTED QUESTIONS July 20-Aug. 2, 2009 N=1,815 U.S. residents, ages 16+ (1,164 landline and 651 cell RDD) 1 NOTE: ALL NUMBERS
Marist College Institute for Public Opinion Poughkeepsie, NY Phone Fax
 Marist College Institute for Public Opinion Poughkeepsie, NY 12601 Phone 845.575.5050 Fax 845.575.5111 www.maristpoll.marist.edu POLL MUST BE SOURCED: NBC 4 New York/Wall Street Journal/Marist Poll* Optimism
Copyright 2005 Freddie Mac. All Rights Reserved. Foreclosure Avoidance Research
 Copyright 2005 Freddie Mac. All Rights Reserved. Foreclosure Avoidance Research Purpose & Methodology Over half of the borrowers in foreclosure proceedings have had no contact with their lender. Freddie
Evidence of Coverage:
 2018 Evidence of Coverage for MetroPlus Platinum Plan (HMO) 1 Table of Contents January 1 December 31, 2018 Evidence of Coverage: Your Medicare Health Benefits and Services and Prescription Drug Coverage
2018 Spring Pulse Survey Overview
 2018 Spring Pulse Survey Overview Strategic Meeting of Council July 4, 2018 Prepared for The City of Calgary by The Corporate Research Team Contact: Attachment 2 ISC: Unrestricted Krista Ring Manager,
CARING FOR YOUR SMALL BUSINESS. Off-Exchange 2018 Plans and Services for Groups With Up to 100 Employees
 CARING FOR YOUR SMALL BUSINESS Off-Exchange 2018 Plans and Services for Groups With Up to 100 Employees SMALL GROUP PLANS AT A GLANCE EmblemHealth offers small group plans with the needs and budgets of
2015 Town of Oakville Citizen Survey Presentation of Findings. February 23, 2015
 2015 Town of Oakville Citizen Survey Presentation of Findings February 23, 2015 S T R A T E G I C I N S I G H T S Objectives and Methodology In December of 2015, The Town of Oakville contacted Pollara
The Impact of TennCare A Survey of Recipients, 2017
 The Impact of TennCare A Survey of Recipients, 2017 Prepared by LeAnn Luna Professor, BCBER Emily Pratt Research Associate, BCBER September 2017 CONTENTS METHOD... 1 TABLE 1: Head of Household Age and
Virginia Registered Voters Concerned About Impact of Expenses on Retirement
 2018 VIRGINIA RETIREMENT SECURITY SURVEY HTTPS://DOI.ORG/10.26419/RES.00208.001 Many Feel Anxious and Behind Schedule About Retirement Survey findings show that many Virginia registered voters age 18-64
IPREO S CORPORATE ACCESS SURVEY
 www.ipreo.com 1 IPREO S CORPORATE ACCESS SURVEY 2016 www.ipreo.com 2 Corporate Access Survey Report 2016 Who is Ipreo? Ipreo powers the networks that connect capital to ideas. We are a leading global provider
Phone: (207)
") Regional Transportation Program 127 Saint John Street Portland, ME 04102 Phone: (207) 774-2666 www.rtprides.org Dear Rider: Thank you for choosing Regional Transportation Program for your mobility needs.
Regional Transportation Program 127 Saint John Street Portland, ME 04102 Phone: (207) 774-2666 www.rtprides.org Dear Rider: Thank you for choosing Regional Transportation Program for your mobility needs.
Satisfaction with getting to work 57% 14% 13% 9% Total distance travelled. miles per week
 Page/... Headlines All Organisations Travel to Work Survey March 0 Number of respondents Main modes of travel (%) % Satisfaction with getting to work % % % Satisfaction with getting % % (driver with others/
BUDGETWATCH October 2018 Flash Report
 October 2018 Flash Report Overall Latest Condition (reporting on operations through September and subsidies through October): Passenger Revenues were slightly below the Forecast in September, marginally
European Union. Overview EIB INVESTMENT SURVEY
 European Union Overview EIB INVESTMENT SURVEY Finance: EU overview European Investment Bank (EIB), 2017. All rights reserved. About the EIB Investment Survey (EIBIS) The Finance is a unique, EU-wide, annual
Fifth Annual Transamerica Center for Health Studies Survey: Employers Hold Steady in Time of Uncertainty
 Fifth Annual Transamerica Center for Health Studies Survey: Employers Hold Steady in Time of Uncertainty November 2017 Table of Contents About the Transamerica Center for Health Studies Page 3 About the
Seniors Opinions About Medicare Prescription Drug Coverage 9 th Year Update
 Seniors Opinions About Medicare Prescription Drug Coverage 9 th Year Update July 2014 Table of Contents Method 3 Executive Summary 7 Detailed Findings 10 Satisfaction with Medicare 11 Satisfaction with
Attitudes towards New Zealand s financial markets General public investor research May 2017
 Attitudes towards New Zealand s financial markets General public investor research May 2017 Methodology This is the fifth year that FMA has carried out investor research measuring attitudes towards, and
Most Tennessee Registered Voters are Behind Schedule in Saving for Retirement
 2018 TENNESSEE RETIREMENT SECURITY SURVEY HTTPS://DOI.ORG/10.26419/RES.00211.001 Most Tennessee Registered Voters are Behind Schedule in Saving for Retirement Survey findings show that many Tennessee registered
The contribution and benefit preferences of active members of the Ontario Teachers Pension Plan
 The contribution and benefit preferences of active members of the Ontario Teachers Pension Plan Prepared for: by: June 2007 IV. Level of awareness and understanding among plan members about the current
Sixth Annual Transamerica Center for Health Studies Employers Survey: U.S. Businesses Remain Committed to Employee Healthcare Benefits
 Sixth Annual Transamerica Center for Health Studies Employers Survey: U.S. Businesses Remain Committed to Employee Healthcare Benefits November 2018 1 Table of Contents About the Transamerica Center for
2016 AARP SURVEY: GUBERNATORIAL ISSUES FACING NORTH CAROLINA VOTERS AGES 45+
 2016 AARP SURVEY: GUBERNATORIAL ISSUES FACING NORTH CAROLINA VOTERS AGES 45+ This AARP survey of 1,000 registered voters ages 45 and older found nearly all plan on voting in November. Among the number
Public Says a Secure Job Is the Ticket to the Middle Class
 1 Public Says a Secure Job Is the Ticket to the Middle Class By Wendy Wang Americans believe that having a secure job is by far the most important requirement for being in the middle class, easily trumping
Hello, my name is from HAI, a national research firm.
 Copyright 2014 September 26 - October 2, 2014 400 Interviews Alaska HAI3272 Margin of Error: +/- 4.9% Hello, my name is from HAI, a national research firm. [IF LANDLINE] We're conducting a survey in Alaska
Patient Experience Survey
 Patient Experience Survey Final report Prepared for the Council of Ambulance Authorities October 2018 Ipsos Project: 18-025533-01 Contents Executive Summary... 3 1. Research Context... 6 1.1 Research context
City of Citrus Heights 2012 Community Survey
 City of Citrus Heights 2012 Community Survey Survey Conducted July 11-17, 2012 320-520 Methodology 403 telephone interviews with adult residents in Citrus Heights Interviews conducted between July 11-17,
Voices of 50+ Hispanics in New York: Dreams & Challenges
 2011 Voices of 50+ Hispanics in New York: Dreams & Challenges Executive Summary AARP has a strong commitment to help improve the lives of the 50+ population. As part of the Association s continuous communication
Federal Assistance 13% Charges for Services 5% Appropriated Fund Balance.5% Other 3% Administration 6% Building Maintenance 3% Other 2%
 TRANSIT FUND The Transit Fund is used to account for the operations of the Town s public transit system. Federal Assistance 13% Transit Revenues State Assistance 12% Charges for Services 5% Appropriated
Marist College Institute for Public Opinion Poughkeepsie, NY Phone Fax
 Marist College Institute for Public Opinion Poughkeepsie, NY 12601 Phone 845.575.5050 Fax 845.575.5111 www.maristpoll.marist.edu NY1-Marist Poll NYC Mayoralty: Quinn Leads Democratic Field Lhota Ahead
City of Mercer Island. February First Avenue Suite 451 Seattle, WA (206)
") City of Mercer Island February 2010 Telephone Survey EMC Research Inc EMC Research, Inc. 811 First Avenue Suite 451 Seattle, WA 98104 (206) 652-2454 Methodology 2 This is the fourth survey, conducted every
City of Mercer Island February 2010 Telephone Survey EMC Research Inc EMC Research, Inc. 811 First Avenue Suite 451 Seattle, WA 98104 (206) 652-2454 Methodology 2 This is the fourth survey, conducted every
AARP Election Survey Results. U.S. National. Prepared for AARP Strategic Issues Research
 AARP 2010 Election Survey Results U.S. National Prepared for AARP Strategic Issues Research Prepared by Gary Ferguson, Guy Molyneux and Jay Campbell October 2010 Table of Contents Introduction and Methodology
Up for Grabs: Taking Charge of Your Digital Identity
 Up for Grabs: Taking Charge of Your Digital Identity AARP Kentucky Survey of Internet Users Age 18+ Report prepared by Karla Pak, Doug Shadel, and Alicia Williams August 2018 https://doi.org/10.26419/res.00228.007
Austria. Overview EIB INVESTMENT SURVEY
 Austria Overview EIB INVESTMENT SURVEY Finance Country Overview: Austria European Investment Bank (EIB), 2017. All rights reserved. About the EIB Investment Survey (EIBIS) The Finance is a unique, EU-wide,
Public Opinion on Health Care Issues September 2011
 Public Opinion on Health Care Issues September 2011 This month, the bipartisan Congressional super committee began negotiations on a deficit reduction package that is likely to include at least some proposed
Survey Data Analysis ObamaCare Seminars
 Survey Data Analysis ObamaCare Seminars Japanese American Social Services, Inc. (JASSI) 100 Gold Street, Lower Level, New York, NY 10038 Phone: 347-482-1541; Email: info@jassi.org Website: http://jassi.org
THE AP-GfK POLL July, 2014
 Public Affairs & Corporate Communications THE AP-GfK POLL July, 2014 Conducted by GfK Public Affairs & Corporate Communications A survey of the American general population (ages 18+) Interview dates: July
2018 Evidence of Coverage
 Centers Plan for Medicare Advantage Care (HMO) 2018 Evidence of Coverage H6988_001_ANOC EOC1127 Accepted 09182017 January 1 December 31, 2018 Evidence of Coverage: Your Medicare Health Benefits and Services
The margin of error for 807 interviews is ± 3.5%
 HART RESEARCH ASSOCIATES / PUBLIC OPINION STRATEGIES Study #10863d--page 1 1724 Connecticut Avenue, NW Interviews: 807 adults, including Washington, DC 20009 205 who only have a cell phone (202) 234-5570