Final Report June Transit Survey for GBRNTC. moore & associates
|
|
|
- James Armstrong
- 5 years ago
- Views:
Transcription

1 June 2017 Transit Survey for GBRNTC moore & associates
2 Table of Contents Chapter 1: Executive Summary Chapter 2: Overview and Methodology Chapter 3: Analysis and Key Findings Chapter 4: Spatial Analysis Appendix A: Survey Instrument Bus Survey... A-1 Appendix B: Survey Instrument Rail Survey... B-1 Appendix C: Simple Frequencies Bus Survey... C-1 Appendix D: Simple Frequencies Rail Survey... D-1 Appendix E: Transfer Matrix... E-1 Appendix F: Data Dictionary... F-1
3 This page intentionally blank.
4 Chapter 1 Executive Summary In 2017, the Greater Buffalo-Niagara Transportation Council retained Moore & Associates to conduct an origin/destination study of fixed-route and rail riders within the Niagara Frontier Transportation Authority (NFTA) service area. NFTA-Metro operates 63 bus routes (including 47 local bus routes and 16 Express bus routes) as well as one light rail line serving Erie and Niagara counties. The survey was designed to gather primary data regarding the following: BY THE NUMBERS Origin and destination; Boarding and alighting; Trip purpose; Method of accessing transit stop; Travel distance to/from bus stop; Customer demographics; and Customer fare payment methods. This survey project was designed to collect data to inform planning and marketing decisions as well as support further NFTA compliance with FTA Title VI regulations. In addition, comparisons can be made with data collected during previous survey efforts to Sample target: 9,500 Total sample: 9,697 Confidence level: 95% Margin of error: ± 1% Survey dates: March 27 through April 12, 2017 Local routes: 7,828 surveys Express routes: 171 surveys Rail: 1,698 surveys identify trends. Two versions of the survey instrument were developed: one for bus passengers and one for rail riders. All customers boarding the surveyed routes were offered an opportunity to take the survey. Riders could also complete the survey online, or elect to receive a postage-paid envelope to facilitate the return of the completed survey. A total of 9,697 responses were received, including 180 returned by mail and 48 completed online. This sample represents just over 17 percent of daily unique riders and reflects a statistical accuracy of 95 percent and a ±1 percent margin of error at the system level. The sampling plan was calculated to reflect local and commuter routes, time of day, and direction of travel. To ensure NFTA-Metro riders had an equal opportunity to participate in the survey, the survey instrument was made available in four non-english languages present in Erie and Niagara counties (Spanish, Arabic, Burmese, and Karen). Printed versions of the English and alternate language surveys were available onboard buses; Arabic, Burmese, and Karen versions of the rail survey were available only online. The majority of respondents (98.3 percent) opted to complete the survey in English, with most other respondents choosing Spanish (1.6 percent). Five respondents completed the survey in Arabic, and three completed Burmese instruments. 3
5 TYPICAL SURVEY RESPONDENT Moore & Associates compiled a profile of the typical survey respondent: Self-identified as Black/African-American (45 percent); Speaks English at home (77 percent); Is a working-age adult (69 percent); Does not have access to a working vehicle (58 percent); Employed full-time or part-time (68 percent); Has an annual household income of less than $15,000 (48 percent); and Lives alone or with one other person (54 percent). Understanding the typical rider is useful in informing both planning and marketing decisions. OVERALL SATISFACTION Approximately 90 percent of respondents indicated satisfaction with NFTA-Metro services, including 51.5 percent who indicated being very satisfied. Response levels were similar across local routes, Express routes, and rail. TITLE VI INFORMATION Title VI of the Civil Rights Act of 1964 prohibits discrimination on the basis of race, color, and national origin in programs and activities receiving federal financial assistance. Income data is also relevant, as planning decisions must not have a disproportionate impact on transportation-disadvantaged persons. An analysis of survey responses regarding the NFTA-Metro system revealed no significant barriers arising from ethnicity, language, or income. The 2017 Onboard Survey revealed the following information which Moore & Associates believes could be helpful to future NFTA-Metro planning efforts: Ninety-six percent of respondents reported a high level of English proficiency. Respondents who cited Bengali/Bangla as a home language were most likely to also indicate a lack of English proficiency (nearly 37 percent, out of 30 total respondents). Twenty-five percent of respondents who indicated speaking Burmese at home also cited a lack of English proficiency. Fifty-eight percent of survey respondents can be classified as low-income under federal guidelines. An additional 16.0 percent are at risk of being classified as low-income. A person is classified as low-income if their taxable income does not exceed 150 percent of the federal poverty level amount for a household of their size. 4
6 TRANSIT DEPENDENCY Survey respondents indicated a high level of transit dependency. The survey data revealed: Sixty-two percent of respondents lack either a driver license or access to a personal vehicle; Twenty-seven percent have neither a valid driver license nor access to a personal vehicle; and Only 16 percent indicated having access to a personal vehicle in conjunction with the surveyed trip. TRAVEL BEHAVIOR Commonalities in survey responses provided the following insights into customer behavior: Eighty-five percent of respondents ride at least three days/week; Forty-four percent indicated making a transfer as part of the surveyed trip; Nearly 63 percent indicated a wait time of five minutes or less at their first transit stop; and Seventy-six percent indicated paying a full fare. BOARDING AND ALIGHTING Survey data provided insight into how riders reached their first bus or train from their starting point as well as how they reached their destination after completing their final bus trip: Eighty-eight percent of respondents began the surveyed trip by walking to the first stop. o Approximately 95 percent who walked traveled five blocks or less, including 74 percent who walk two blocks or less. Most respondents ended the surveyed trips by walking or utilizing a wheelchair to reach their destination (91.6 percent). o Ninety-five percent who walked from the last bus/train stop to their destination traveled five blocks or less. Seventy-six percent walked two blocks or less. Chapter 2 of the report provides an in-depth project overview as well as a detailed discussion of project methodology. Chapter 3 provides survey results and analysis. Chapter 4 addresses origin and destination data as well as distribution of demographic data. Survey instruments, as well as simple frequencies, are included in the Appendices. 5
7 This page intentionally blank. 6
8 Chapter 2 Overview and Methodology This section discusses the methodologies by which the survey was developed and administered along with the data collected. PROJECT OVERVIEW SURVEY DEVELOPMENT Moore & Associates worked with GBNRTC and NFTA to create individual survey instruments for NFTA fixed-route and rail services. The instruments were similar, with questions regarding fare payment as well as boarding and alighting differing so the rail survey would provide rail-specific response options. Following approval, the survey instruments were translated into four other languages: Spanish, Arabic, Burmese, and Karen. These languages were identified as the most-frequently occurring languages in Erie and Niagara counties. Printed versions of the English and alternate language surveys were available onboard buses; Arabic, Burmese, and Karen versions of the rail survey were available only online. Moore & Associates 25-year history of conducting customer surveys has provided us keen insight into strategies for ensuring a fully inclusive survey effort. Challenges to inclusiveness include low response rates from individuals speaking limited English, individuals with low levels of education and/or literacy, and for riders taking short trips which may impact/influence their possible participation. Methodologies utilized by Moore & Associates to increase rider participation include: Offering administration of the survey via intercept methodology to encourage participation from riders with limited education and/or literacy levels; Offering an online survey option to encourage participation from riders making short trips; Designing survey instruments to capture the most important information first; and Offering random drawings as a participation incentive. One measure of our methodology s success is that levels of English proficiency among survey respondents were nearly identical to those reported in Erie and Niagara county residents to the U.S. Census. SAMPLING PLAN Moore & Associates utilized a stratified random-sampling methodology to collect data that accurately represented all rider types on NFTA fixed-route and rail service. In doing so, we determined the sampling plan should be stratified reflective of the following: 1. Unique riders by mode and route (weighted by percentage of total unique riders), 2. Day-part (off-peak, AM peak, midday, and PM peak), and 3. Direction of travel. 7
9 A formal sampling target was calculated for each route reflective of actual recent average weekday ridership data as reported by NFTA. Weighted Sample Size Based on Unique Riders To gain a more accurate picture of how many unique riders were riding each route, Moore & Associates identified a multiplier for each service mode. An assumption of each rider making a round trip on an individual route would result in a multiplier of This means the number of unique riders is equal to half of the daily boardings. However, since not all riders make a round trip, the multiplier was adjusted to reflect one-way riders. Commuter routes had the lowest multiplier, as they are most likely to have customers who complete a round trip on any given day. Local routes had the highest multiplier, as customers would likely one-way trips or use a variety of routes for their travel. In conclusion, the following multipliers were used in calculating daily unique riders: Local routes: daily boardings * Commuter routes: daily boardings * Rail: daily boardings * Weighted Sample Based on Day-Part Once weighted sample was determined for each mode/route, we calculated the number of responses needed for each day-part based on the following distribution: Off-peak ( or after 1801) 10 percent; AM peak ( ) 30 percent; Midday ( ) 25 percent; and PM peak ( ) 35 percent. Moore & Associates initially stratified route sample targets by day-part. However, as data collection progressed, it was determined day-part stratification, which was not requested at the route level by GBNRTC or NFTA, was impacting the ability to collect route samples in an efficient manner, and attempts to achieve day-part stratification on individual routes were ended. However, as discussed in the section labeled Survey Collection by Day-Part, survey responses were representative of all day-parts and services in the NFTA-Metro system. Direction of Travel Further stratifying the sample by direction of travel resulted in extremely small sampling targets. Therefore, during data collection, we ensured that at least two trips were made in each direction, on each route, during each day-part, to ensure that both directions of travel were represented in the sample. Exceptions The following routes did not strictly utilize the method of stratification described above. Once the weighted sample was calculated, the following exceptions applied: 8
10 Low ridership routes were stratified by direction only. Commuter/Express routes were stratified by day-part or direction. The entire sample was collected on inbound trips. MetroLink Route 206 only operates during PM Peak hours so the entire sample for that route was collected during that time. Our sampling plan was weighted such that individual route sampling targets ensured a confidence level of 90 percent and a ±5 percent margin of error (based on daily average ridership by route and estimates of unique riders). The actual sample collected resulted in a confidence level of 95 percent and a ±1 percent margin of error at the system level. Sampling targets, as well as the actual samples, are presented in Exhibit
11 Route Number NFTA FINAL TALLY Moore & Actual Associates Sample Target Sample Collected Percentage Collected % % % % % % % % % % % % % % % % % Rail Total surveys collected 9697 Exhibit 2.1 Sampling by Route Target sample met or exceeded 95% or more of target sample collected 75% or more of target sample collected Less than 75% of target sample collected 10
12 SURVEY COLLECTION BY DAY-PART A key goal of this project was to ensure data collection across NFTA-Metro s wide range of services and day-parts. Surveyor schedules were designed to give riders across all day-parts the opportunity to participate. Exhibit 2.2 presents the overall tallies by day-part, while Exhibits 2.3 through 2.5 illustrate the results of surveys collected by day-part on local routes, Express routes, and rail, respectively. 11
13 NFTA Final Tally by Day-part Exhibit 2.2 Survey tallies by day-part daily unique Moore & Associates Target Off Peak 10% (4am-7am & AM Peak 30% Midday 25% PM Peak 35% Actual Sample Percentage Route riders riders % of total Sample after 6pm) (7am-10am) (10am-2pm) (2pm-6pm) Collected Collected 1 1, % % 26.1% 38.8% 29.1% % 2 1, % % 29.7% 34.1% 30.2% , % % 28.2% 28.1% 38.7% % 4 2, % % 33.0% 34.4% 24.9% % 2 6, % % 37.7% 21.9% 30.9% , % % 26.3% 27.8% 38.5% % % 0.0% 34.2% 63.2% , % % 21.4% 41.1% 30.4% % % 29.8% 39.5% 20.2% , % % 29.0% 27.7% 33.0% % 13 3, % % 28.4% 23.1% 37.4% , % % 34.4% 23.5% 30.8% , % % 14.5% 29.4% 49.1% , % % 33.8% 30.9% 28.0% % % 27.5% 29.4% 33.3% 51 71% 19 4, % % 37.7% 22.8% 28.2% , % % 31.7% 24.6% 33.5% , % % 39.1% 26.6% 31.3% 64 47% 23 4, % % 34.4% 28.1% 27.1% % 24 2, % % 27.4% 28.5% 34.1% % 25 3, % % 31.3% 26.4% 31.9% , % % 28.0% 33.5% 34.0% % % % 20.0% 40.0% 40.0% 5 29% 32 3, % % 27.5% 33.6% 34.6% % 34 1, % % 24.0% 32.0% 35.2% % % % 31.8% 30.7% 31.8% % % 20.0% 40.0% 36.7% 60 86% 40 1, % % 31.7% 22.2% 39.4% % % 19.2% 30.8% 50.0% % % 26.2% 23.4% 36.4% % % 14.3% 42.9% 28.6% % % 20.0% 38.3% 35.0% % % 23.6% 22.5% 47.2% 89 98% % % 9.1% 45.5% 45.5% % % 20.0% 40.0% 35.0% 40 80% % % 29.8% 27.7% 38.3% % % 27.3% 45.5% 27.3% , % % 29.2% 29.2% 35.8% % ML % 5 0.0% 0.0% 33.3% 66.7% % 6 0.0% 100.0% 0.0% 0.0% % 5 0.0% 100.0% 0.0% 0.0% % 5 0.0% 90.0% 0.0% 10.0% % 6 0.0% 95.0% 0.0% 5.0% % 7 0.0% 100.0% 0.0% 0.0% % 5 0.0% 100.0% 0.0% 0.0% % 5 0.0% 100.0% 0.0% 0.0% % 5 0.0% 85.7% 0.0% 14.3% % 5 0.0% 100.0% 0.0% 0.0% % % 90.9% 0.0% 9.1% % 5 0.0% 100.0% 0.0% 0.0% % % 85.7% 0.0% 14.3% % 5 0.0% 100.0% 0.0% 0.0% % 5 0.0% 100.0% 0.0% 0.0% 7 ML % % 88.9% 0.0% 11.1% 9 75% Rail 17, % % 28.7% 25.4% 31.0% 1698 Total % 30.8% 27.2% 32.5% Low Ridership Routes - Not stratified by day-part Express Routes - Primarily surveyed AM/Inbound
14 LOCAL ROUTES - SURVEYS BY DAY-PART Exhibit 2.3 Local routes - surveys by day-part 40% 35% 30% n = 7, % 28.2% 33.5% 25% 20% 15% 10% 8.5% 5% 0% AM Peak Midday Off Peak PM Peak EXPRESS ROUTES - SURVEYS BY DAY-PART 100% 90% 80% 70% 60% 50% 40% 30% 20% 10% 0% 95.9% AM Peak Exhibit 2.4 Express routes - surveys by day-part n = % PM Peak 13
15 RAIL - SURVEYS BY DAY-PART 2017 Niagara Frontier Transportation Authority Onboard Survey Exhibit 2.5 Rail surveys by day-part 35% 30% 25% 28.8% 25.5% n = 1, % 20% 15% 14.7% 10% 5% 0% AM Peak Midday Off Peak PM Peak SURVEY ADMINISTRATION STAFFING/RECRUITMENT Moore & Associates contracted with two local temporary staffing firms to recruit surveyor candidates. The goal was to recruit individuals with a professional appearance and demeanor as well as the skills necessary to conduct the survey. While the staffing firm conducted a background check and ensured each recruit was legally eligible to work in the United States, our criteria for selection included the following: Fluency in English (written and oral) (required), Ability to read and understand a bus schedule, Common sense problem solving capabilities, Ability to conform with appearance standards ( business casual dress code black or khaki pants, polo or collared shirt, and comfortable shoes), No facial tattoos or extensive visible piercings, The physical ability to board and ride the bus unassisted, Punctuality (ability to arrive 15 minutes before the start of the shift), Availability of reliable transportation (including public transit, bicycle, or ride from friend/family), and Possession of a cell phone for communication with field supervisory personnel. All surveyors were screened and then trained by our project team. Fifty-six surveyors were trained as part of this engagement. An initial team of 30 surveyors was trained on March 23, 2017 prior to survey pretest fielding. Training included an overview of the project, discussion of surveyor performance expectations, familiarization with the Metro system and survey instrument, onboard etiquette, protocol for conducting the survey, and a review of individual assignments. 14
16 Unacceptable behavior which included making or receiving calls from persons other than Moore & Associates field supervisors, listening to music on an ipod or phone, causing any type of disruption onboard the vehicle, use of profanity, failure to comply with appearance standards, and tardiness was communicated to all recruits as cause for immediate dismissal. DATA COLLECTION Data collection was accomplished using an onboard intercept methodology on weekdays only. All survey questionnaires were printed on 110-pound stock and color-coded for language and vehicle type. The bus surveys were printed in all language options; rail surveys were printed in English and Spanish only. Riders could also elect to receive a postage-paid return envelope so as to return a completed survey at a later date. Notices were also onboard vehicles with a URL directing riders to the online survey, where they could select to take the survey in any of the available languages. Surveyors were easily identified by an identification badge worn on a lanyard around the neck as well as a reflective vest. Prior to boarding the assigned vehicle, each surveyor was provided with a surveyor bag containing survey forms, pens, assignment schedule, and individual surveyor paddle. Each surveyor was also provided with the mobile phone contact information for his/her assigned field supervisor, who conducted spot-checks of surveyor performance and maintained a presence in the service area throughout the entire data collection period as a quality control measure. Surveyors offered the survey to all customers boarding the vehicle while also making themselves available to answer questions regarding the survey. Respondents were instructed to return the completed instrument to the surveyor or leave it on their seat for retrieval by our surveyor. At the conclusion of each day s surveying, all collected surveys, identification badges, and reflective vests were returned to Moore & Associates field personnel. SURVEY PRE-TEST To confirm each survey instrument's functionality, as well as to identify potential response bias or flaws in survey methodology, Moore & Associates fielding team conducted a pre-test, or pilot, survey. To achieve credible responses from which to draw conclusions as to instrument functionality, we planned to collect a pilot sample of no fewer than five percent of the total sample (approximately 475 surveys). The survey pre-test was conducted on March 23 and March 24, During the pre-test period, surveys were distributed across 23 routes during AM, mid-day, and PM peak trips. We also surveyed on AM and mid-day rail trips. In total, 646 bus survey and 350 rail survey were collected for a total of 996 valid surveys. This far exceeded the sample target. The pre-test failed to reveal any issues regarding question phrasing or clarity or with survey methodology. Therefore no revisions were made to the survey instruments. All responses collected during the pilot survey were ultimately incorporated into the total survey sample. Full surveying resumed on Monday, March 27,
17 SURVEY FIELDING Moore & Associates successfully managed the fielding of the transit rider survey using primarily an onboard intercept methodology across 13 weekdays (March 27 through April 12, 2017). The data collection covered all NFTA fixed-routes and rail line. Moore & Associates exceeded the target survey sample: 9,697 were collected against a target of 9,500. This includes 7,999 surveys collected from bus passengers and 1,698 collected from rail passengers. All but 228 surveys were completed onboard. Fortyeight were completed online while 180 were returned by mail. Slightly more than 98 percent of all surveys were completed in English. In total, 1.6 percent of surveys were completed in Spanish (116 on bus and 14 by rail), five were completed in Arabic, and three in Burmese. Although data collection was initially scheduled to span 10 weekdays, Monday, March 27 through Friday, April 7, 2017, Moore & Associates elected to extend the fielding period to ensure achievement of the sample target. After five days of data collection, our field team reported an increase in rider survey fatigue. Despite the opportunity for transit riders to compete multiple surveys (differing days, differing routes), Moore & Associates noted an increase in survey refusal rate. This can likely be attributed to a number of factors including survey length and inclement weather conditions. Further, we believe the actual number of unique riders was less than forecast. As noted, the sample exceeded the target of 9,500. Further details of the 9,697 sample includes: The target of two runs per stratum (day-part and direction) was met for all local routes. Of the 55 routes surveyed, 39 met or exceeded the sample target. Three additional routes were at or above 95 percent. Nine additional routes were at or above 75 percent. The four routes with lowest totals were 18, 22, 29, and 32. Observed ridership was considerably less than previously reported on these routes. DATA PROCESSING To expedite this task, our field team reviewed the completed survey forms at the end of each data collection day to determine degree of completeness, overall validity, and overall accuracy. Survey forms deemed accurate and complete were then returned to Moore & Associates offices for processing. DATA ENTRY All survey data was entered into a Microsoft Excel spreadsheet using trained data entry personnel. Moore & Associates staff monitored the entire data entry process, reviewing data entry work on a daily basis while also conducting spot-checks throughout each day. DATA CLEANING MS Excel shells were created for each survey type (bus, rail). Survey data was then entered, cleaned, and coded. Data cleaning was undertaken by trained personnel following completion of data entry. This process addressed differing data formatting that resulted in identical responses being sorted as different (i.e., University of Buffalo and Buffalo University would be combined to form a single response). 16
18 Boarding and alighting data was also logic-checked to ensure routes matched the data provided; inconsistencies were reconciled. Surveys that had been deemed complete in the field were further examined to ensure completeness and validity. Periodic quality control checks by Moore & Associates field staff were completed throughout data processing. The cleaned data was then imported into a Statistical Package for the Social Sciences (SPSS) database for further analysis. Following data cleaning, simple frequencies were compiled and submitted to NFTA S project manager. ANALYTICAL METHODS The SPSS database enabled our project team to compile simple frequencies as well as data crosstabulations within each dataset. Cross-tabulations allow comparisons between survey responses that can provide additional insight into customer profiles, travel patterns, perceptions of service, and demographics. In addition, cleaned origin and destination data was geocoded with origin and destination data to facilitate analysis using Traffic Analysis Zones (TAZ) provided by GBNRTC as well as NFTA-Metro route configurations. We utilized ArcGIS for Desktop 10.3 to spatially analyze the geocoded origin/destination data within the NAD 83, Zone 18 environment. 17
19 This page intentionally blank. 18
20 Chapter 3 Analysis and Key Findings This section details findings of the survey of NFTA-Metro fixed-route bus and rail passengers. Data collection resulted in 9,697 valid surveys, exceeding the sample target of 9,500. Of these, 180 were returned by mail, while 48 were completed online. Based on commonalities in response data, certain conclusions were drawn regarding survey participant attitudes, travel behavior, and demographics. TYPICAL SURVEY RESPONDENT Moore & Associates compiled a profile of the typical survey respondent: Self-identified as Black/African-American (45 percent); Speaks English at home (77 percent); Is a working-age adult (69 percent); Does not have access to a working vehicle (58 percent); Employed full-time or part-time (68 percent); Has an annual household income of less than $15,000 (48 percent); and Lives alone or with one other person (54 percent). OVERALL SATISFACTION Approximately 90 percent of respondents indicated satisfaction with NFTA-Metro services, including 51.5 percent who indicated being very satisfied. Response levels were similar across local routes, Express routes, and rail. TITLE VI INFORMATION Title VI of the Civil Rights Act of 1964 prohibits discrimination on the basis of race, color, and national origin in programs and activities receiving federal financial assistance. Income data is also relevant, as planning decisions must not have a disproportionate impact on transportation-disadvantaged persons. An analysis of survey responses regarding the NFTA-Metro system revealed no significant barriers arising from ethnicity, language, or income. The 2017 Onboard Survey revealed the following information which Moore & Associates believes could be helpful to future NFTA-Metro planning efforts: Ninety-six percent of respondents reported a high level of English proficiency. Respondents who cited Bengali/Bangla as a home language were most likely to also indicate a lack of English proficiency (nearly 37 percent, out of 30 total respondents). Twenty-five percent of respondents who indicated speaking Burmese at home also cited a lack of English proficiency. 19
21 Fifty-eight percent of survey respondents can be classified as low-income under federal guidelines. An additional 16.0 percent are at risk of being classified as low-income. TRANSIT DEPENDENCY Survey respondents indicated a high level of transit dependency. The survey data revealed: Sixty-two percent of respondents lack either a driver license or access to a personal vehicle; Twenty-seven percent have neither a valid driver license nor access to a personal vehicle; and Only 16 percent indicated having access to a personal vehicle in conjunction with the surveyed trip. TRAVEL BEHAVIOR Commonalities in survey responses provided the following insights into customer behavior: Eighty-five percent of respondents ride at least three days/week; Forty-four percent indicated making a transfer as part of the surveyed trip; Nearly 63 percent indicated a wait time of five minutes or less at their first transit stop; and Seventy-six percent indicated paying a full fare. BOARDING AND ALIGHTING Survey data provided insight into how riders reached their first bus or train from their starting point as well as how they reached their destination after completing their final bus trip: Eighty-eight percent of respondents began the surveyed trip by walking to the first stop. o Approximately 95 percent who walked traveled five blocks or less, including 74 percent who walk two blocks or less. Most respondents ended the surveyed trips by walking or utilizing a wheelchair to reach their destination (91.6 percent). o Ninety-five percent who walked from the last bus/train stop to their destination traveled five blocks or less. Seventy-six percent walked two blocks or less. The balance of this chapter further examines each question, offering data cross-tabulations where appropriate to explore certain findings further. For the majority of questions, we have provided two charts: 1. A chart illustrating percentages of respondents system-wide, and 2. A chart illustrating side-by-side comparisons of respondents by mode: on local and Express routes, on rail, and system-wide. 20
22 SURVEY LANGUAGE Nearly all survey participants (98.3 percent) elected to take the survey in English. Only 1.6 percent chose to complete the survey in Spanish. Five participants completed the survey in Arabic and three completed the survey in Burmese. The survey instrument was divided into four sections. Section 1 solicited contact information; Section 2 asked questions regarding the surveyed trip; and Section 3 asked questions regarding customer demographics; and Section 4 included questions regarding satisfaction. SECTION 1: PLEASE PROVIDE YOUR CONTACT INFORMATION Section 1 of the survey instrument asked respondents to provide name, phone number, city, and zip code. Partipants were advised that all information would be kept confidential. SECTION 2: TELL US ABOUT THIS ONE-WAY TRIP Question 1: Where did you get on the bus/train? Bus riders were asked to provide information which could be used to identify their boarding location, including a landmark or business name or cross-street information. Rail riders were asked to select from a list of rail stops. Exhibit 3.1.a Top boarding locations bus Boarding Location Frequency 1 University of Buffalo - South MTC or Downtown Buffalo Utica Station Thruway Mall ECC City Campus 80 6 Walden Galleria 66 7 Southgate Plaza 49 8 Buffalo State University 47 9 Amherst Rail Station Black Rock Transit Hub Buffalo & Erie County Library Buffalo Niagara International Airport Portage Road Transit Center Main Place Mall Erie County Medical Center Mckinley Mall City Hall AppleTree Business Park Kenmore Mercy Hospital Ellicot Square Building 20 21
23 Rail riders were most likely to board at University of Buffalo South Campus (35.2 percent). The secondmost common boarding location was Church Street. University LaSalle Amherst Street Humboldt Hospital Delevan/Canisius College Utica Summer-Best Allen Medical Campus Fountain Plaza Lafayette Square Church Street Seneca Street 3.3% 3.6% 2.7% 2.3% 3.9% 7.6% 6.3% 6.3% 6.8% 5.7% 10.2% Exhibit 3.1.b Boarding location rail 0% 5% 10% 15% 20% 25% 30% 35% 40% Erie Canal Harbor 5.9% Special Events Station 0.3% n = 1, % Question 2: How many minutes did you wait at this location for the bus/train to arrive? Nearly 63 percent of respondents indicated a wait time of five minutes or less, suggesting both a familiarity with the system and good on-time performance. 50% 45% 40% 35% 30% 25% 20% 15% 10% 5% 0% 19.3% less than 2 minutes 43.4% 23.7% 2-5 minutes 6-10 minutes Exhibit 3.2.a Arrival wait time system 10.8% minutes 1.9% 0.9% minutes n = 9,141 more than 30 minutes Wait times were 10 minutes or less for the vast majority of respondents across local, Express, and rail. 22
24 Exhibit 3.2.b Arrival wait time comparison 100% 90% 80% 70% 60% 50% 40% 30% 20% 10% 0% 11.7% 5.9% 6.5% 10.8% 17.0% 22.7% 24.1% 23.7% 47.9% 42.0% 68.6% 43.4% 18.9% 22.4% 19.3% 6.5% Local Express Rail System more than 30 minutes minutes minutes 6-10 minutes 2-5 minutes less than 2 minutes Question 3: Where will you get off this bus/train? Riders were asked to provide information which could be used to identify their alighting location, including a landmark or business name or cross-street information. Rail riders were asked to select from a list of rail stops. Exhibit 3.3.a Alighting location bus Alighting Location Frequency 1 MTC or Downtown Buffalo University of Buffalo - South Utica Station Walden Galleria 94 5 Buffalo State University 91 6 Thruway Mall 76 7 Amherst Rail Station 60 8 ECC City Campus 53 9 Erie County Medical Center Broadway Market Buffalo & Erie County Library Main Place Mall Mckinley Mall City Hall Seneca Casino Delevan Canisius College Station Black Rock Transit Hub Kenmore Mercy Hospital Southgate Plaza Buffalo Niagara International Airport 26 23
25 University of Buffalo South Campus was the most popular alighting location of the surveyed rail riders, cited by 17.2 percent. Church Street (13.3 percent), Lafayette Square (13.1 percent), and Fountain Plaza (9.7 percent) were also popular alighting locations. Exhibit 3.3.b Alighting location rail 0% 5% 10% 15% 20% University LaSalle Amherst Street Humboldt Hospital Delevan/Canisius College Utica Summer-Best Allen Medical Campus Fountain Plaza Lafayette square Church Street Seneca Street Erie Canal Harbor Special Events Station 2.5% 4.4% 5.7% 3.6% 3.7% 3.6% 3.1% 5.3% 6.4% 8.3% 9.7% 13.1% 13.3% n = 1, % 24
26 Question 4: Including this bus/train, how many total buses and/or trains will you ride to make this one-way trip? Fifty-six percent of respondents reported no transfers on the surveyed trip, while 33.5 percent indicated one transfer. The low incidence of respondents citing two or more transfers is indicative of a well-designed route network. 60% 50% 55.8% Exhibit 3.4.a Incidences of transfers system n = 9,699 40% 30% 33.5% 20% 10% 0% 8.2% 2.5% No transfer 1 transfer 2 transfers 3 transfers Respondents on Express routes were least likely to need a transfer to complete the surveyed trip. Exhibit 3.4.b Incidence of transfers comparison 100% 90% 80% 70% 60% 50% 40% 30% 20% 10% 0% 3.5% 2.6% 2.1% 2.5% 2.4% 7.9% 10.1% 8.2% 15.9% 78.2% 33.8% 33.7% 33.5% 55.7% 54.1% 55.8% Express Local Rail System 3 transfers 2 transfers 1 transfer No transfer 25
27 Question 5: List all the route numbers (or names) you will use on this one-way trip. A total of 5,493 transfers were recorded from 469 transfer pairs. More than 37 percent of all transfers included a transfer to/from rail. Exhibit 3.5.a lists the top twenty transfer pairs. These transfer pairs account for 34 percent of all transfers. Appendix E contains a matrix detailing all transfers. Exhibit 3.5.a Top transfer pairs Top 20 Transfer Pairs Rail and Route Rail and Route Rail and Route Rail and Route Rail and Route Rail and Route Rail and Route Rail and Route Rail and Route Route 5 and Rail and Route Rail and Route 3 69 Route 3 and 5 68 Rail and Route Rail and Route Rail and Route 4 59 Route 5 and Route 5 and Route 12 and Route 12 and
28 Question 6: When you got on the bus/train where you were given this survey, how did you pay? System-wide, the monthly pass was the most common fare payment method (31.9 percent) for the surveyed trip, followed by the day pass (25.8 percent), and cash (20.6 percent). Riders of Express routes were most likley to utilize a monthly pass (53.8 percent), followed by rail riders (44.3 percent). Exhibit 3.6.a Method of fare payment system 0% 5% 10% 15% 20% 25% 30% 35% Monthly Pass 31.9% Day Pass 25.8% Cash (one ride) 20.6% Student Pass 6.5% Round Trip Rail Ticket 1.1% NFTA Employee Pass 1.1% Free Fare Zone 1.0% 30-Day Pass 3.0% Token 2.3% Weekly Pass CRAM Pass 1.7% 5.0% n= 9,558 Exhibit 3.6.b Method of fare payment comparison 100% 90% 80% 70% 60% 6.2% 3.6% 3.7% 5.0% 5.4% 2.2% 8.0% 3.0% 6.4% 8.8% 6.5% 29.0% 9.2% 21.5% 11.1% 20.6% 7.7% 22.7% CRAM Pass Weekly Pass Token 30-Day Pass Free Fare Zone 50% 40% 30% 20% 10% 27.4% 31.7% 53.8% 29.2% 25.8% 44.3% 31.9% NFTA Employee Pass Round Trip Rail Ticket Student Pass Cash (one ride) Day Pass Monthly Pass 27 0% Local Express Rail System
29 Question 7: Was your fare? Seventy-six percent of respondents paid full fare for the surveyed trip. As Exhibit 3.7.b shows, percentages are similar across all modes, with riders of Express routes most likely to pay full fare (87.1 percent). Not applicable 11.4% Exhibit 3.7.a Fare type - system Senior/Disabled 12.4% Full fare 76.2% n = 9,344 Exhibit 3.7.b Fare type - comparison 100% 90% 80% 70% 60% 50% 40% 30% 20% 10% 0% 10.8% 4.9% 8.0% 14.9% 11.4% 12.9% 10.7% 12.4% 76.4% 87.1% 74.4% 76.2% Local Express Rail System Not applicable Senior/Disabled Full fare 28
30 Question 8: Did your employer or another organization pay for your fare? Approximately 16 percent of respondents cited at least partial fare subsidy from an employer or other organization. As Exhibit 3.8b shows, these percentages were similar across both transit modes in the NFTA-Metro system. Yes, entire fare 14.2% Exhibit 3.8.a Fare subsidy - system Yes, some of fare 2.3% No 83.5% n = 9,249 Exhibit 3.8.b Fare subsidy - comparison 100% 90% 80% 70% 60% 50% 40% 30% 20% 10% 0% 2.2% 6.1% 2.0% 2.3% 13.8% 13.9% 16.4% 14.2% 84.0% 80.0% 81.6% 83.5% Local Express Rail System Yes, some of fare Yes, entire fare No 29
31 Question 9: Where did you purchase your fare? Nearly 45 percent of respondents purchased their fare onboard vehicles. The second-most common purchase point was store outlet. Social services agencies (7.6 percent) and high schools (3.8 percent) were also important ticket sources. Few of the 5.6 percent of respondents who indicated other specified a valid response. Exhibit 3.9.a Fare purchase point - system 0% 10% 20% 30% 40% 50% Onboard bus or train 44.8% Store outlet 14.2% CRAM Pass Social services Ticket vending machine High school NFTA cash office Employer/Metro Perk Online purchase Other 8.5% 7.6% 7.3% 3.8% 3.5% 3.1% 1.5% 5.6% n = 7,831 Data cross-tabulation: Fare payment method vs. purchase point The following chart illustrates where each fare payment method is most commonly purchased. The top purchase location for each fare payment method is highlighted in green. How did you pay for this one-way trip? On the bus Where did you purchase your fare? Ticket Online vending purchase machine Store outlet Exhibit 3.9.b Fare payment vs. purchase point Employer /Metro Perk Social services NFTA cash office CRAM Pass High school Token 49.3% 12.3% 1.9% 7.6% 2.8% 11.4% 1.4% 1.9% 1.9% 9.5% Cash 78.5% 12.2% 0.4% 1.0% 0.6% 0.9% 0.5% 0.0% 0.2% 5.7% Day Pass 82.3% 11.3% 0.3% 1.0% 0.6% 1.9% 0.6% 0.3% 0.6% 1.1% Weekly Pass 11.4% 69.0% 0.6% 6.3% 0.6% 3.8% 3.2% 0.0% 0.0% 5.1% Monthly Pass 2.8% 8.7% 4.2% 38.7% 8.5% 18.6% 7.8% 1.7% 1.4% 7.6% 30-Day Pass 4.4% 43.1% 1.5% 21.5% 5.5% 11.3% 5.8% 1.1% 0.4% 5.5% Round Trip Rail Ticket 14.2% 81.1% 0.0% 0.9% 0.9% 0.0% 0.9% 0.0% 0.0% 1.9% Student Pass 5.0% 0.7% 0.0% 0.2% 0.7% 0.3% 1.2% 34.7% 50.2% 7.3% Free Fare Zone 0.0% 1.1% 0.0% 0.0% 0.0% 1.1% 1.1% 94.3% 1.1% 1.1% NFTA Employee Pass 17.9% 3.6% 1.8% 0.0% 0.0% 1.8% 1.8% 0.0% 7.1% 66.1% CRAM Pass 1.3% 0.0% 0.0% 0.4% 0.2% 0.4% 1.3% 92.7% 1.7% 2.1% Other 30
32 Data cross-tabulation: Payment Type vs. Route (Bus) A review of payment type by bus route reveales that monthly pass was the most utilized method of payment for 70 percent of bus routes. Cash was the preferred method of payment for 17 percent of routes, while a day pass was the preferred method of payment on 13.2 percent of routes. Exhibit 3.9.c Payment type vs. route - bus Route Token Cash (one ride) Day Pass Weekly Pass Monthly Pass 30-Day Pass Student Pass CRAM Pass 1 1.2% 16.7% 29.6% 0.6% 43.8% 1.2% 1.2% 5.6% 2 1.1% 27.1% 28.2% 2.8% 29.8% 1.7% 4.4% 5.0% 3 3.3% 21.7% 24.8% 0.6% 30.8% 1.9% 8.8% 8.1% 4 5.5% 20.7% 31.3% 4.6% 26.3% 3.2% 6.5% 1.8% 5 2.3% 19.1% 28.3% 2.1% 32.8% 3.1% 5.8% 6.5% 6 2.4% 20.1% 34.3% 0.9% 32.8% 2.4% 2.7% 4.3% 7 5.4% 35.1% 13.5% 0.0% 27.0% 5.4% 2.7% 10.8% 8 4.5% 14.4% 19.8% 2.7% 42.8% 6.3% 3.6% 5.9% % 31.5% 16.9% 4.0% 32.3% 1.6% 4.0% 9.7% % 16.7% 29.6% 2.1% 37.0% 2.5% 6.3% 3.8% % 16.7% 31.6% 2.4% 31.0% 2.1% 6.6% 7.5% % 13.7% 31.1% 1.8% 29.2% 0.9% 12.8% 9.1% % 25.5% 25.5% 0.0% 34.8% 3.0% 3.7% 6.0% % 25.7% 26.2% 3.4% 30.1% 1.9% 5.8% 3.9% % 20.0% 34.0% 0.0% 34.0% 2.0% 8.0% 2.0% % 18.3% 26.0% 1.8% 34.4% 2.8% 10.1% 3.8% % 20.9% 23.2% 1.0% 27.9% 3.1% 11.5% 10.9% % 21.0% 27.4% 1.6% 30.6% 4.8% 4.8% 0.0% % 24.8% 25.5% 2.3% 30.0% 2.5% 6.4% 5.3% % 19.9% 27.0% 2.2% 35.2% 3.7% 4.1% 4.9% % 21.6% 27.8% 1.3% 31.9% 3.4% 7.5% 5.0% % 21.1% 35.1% 0.5% 24.7% 1.5% 10.3% 6.2% % 40.0% 20.0% 0.0% 20.0% 0.0% 20.0% 0.0% % 18.0% 26.7% 1.0% 27.7% 1.9% 10.2% 13.1% % 13.7% 35.5% 4.8% 34.7% 4.8% 0.8% 5.6% % 33.3% 31.0% 0.0% 20.7% 4.6% 4.6% 5.7% % 33.3% 20.0% 3.3% 31.7% 0.0% 1.7% 6.7% % 33.0% 29.6% 1.7% 26.3% 3.9% 2.2% 2.2% % 19.2% 30.8% 0.0% 46.2% 3.8% 0.0% 0.0% % 29.9% 20.6% 2.8% 34.6% 2.8% 3.7% 5.6% % 12.2% 41.5% 2.4% 29.3% 7.3% 4.9% 2.4% % 10.0% 36.7% 0.0% 20.0% 1.7% 5.0% 25.0% % 19.1% 29.2% 4.5% 25.8% 1.1% 5.6% 14.6% % 9.5% 33.3% 0.0% 42.9% 4.8% 4.8% 4.8% % 50.0% 20.0% 0.0% 20.0% 2.5% 0.0% 0.0% % 42.6% 31.9% 2.1% 21.3% 2.1% 0.0% 0.0% % 36.4% 9.1% 0.0% 36.4% 18.2% 0.0% 0.0% % 54.7% 14.2% 0.9% 25.5% 2.8% 0.0% 0.0% % 40.0% 0.0% 0.0% 50.0% 0.0% 0.0% 0.0% % 28.6% 0.0% 0.0% 71.4% 0.0% 0.0% 0.0% % 20.0% 20.0% 0.0% 55.0% 5.0% 0.0% 0.0% % 44.4% 0.0% 0.0% 55.6% 0.0% 0.0% 0.0% % 0.0% 22.2% 0.0% 66.7% 11.1% 0.0% 0.0% % 0.0% 0.0% 0.0% 100.0% 0.0% 0.0% 0.0% % 21.4% 14.3% 0.0% 50.0% 0.0% 0.0% 14.3% % 28.6% 0.0% 0.0% 57.1% 14.3% 0.0% 0.0% % 33.3% 0.0% 0.0% 50.0% 0.0% 0.0% 0.0% % 36.4% 4.5% 0.0% 50.0% 4.5% 0.0% 4.5% % 23.1% 7.7% 0.0% 46.2% 0.0% 15.4% 7.7% % 57.1% 0.0% 0.0% 35.7% 0.0% 0.0% 7.1% % 0.0% 16.7% 0.0% 66.7% 0.0% 0.0% 16.7% % 14.3% 14.3% 14.3% 42.9% 14.3% 0.0% 0.0% % 14.3% 14.3% 14.3% 42.9% 14.3% 0.0% 0.0% 31
33 Data cross-tabulation: Payment Type vs. Route (Rail) One in two respondents onboard rail indicated paying for a trip with either a day pass or monthly pass. Exhibit 3.9.d Payment type vs. route - rail Monthly Pass Day Pass Cash (one ride) Student Pass Round Trip Rail Ticket NFTA Employee Pass Free Fare Zone 30-Day Pass Token Weekly Pass 7.7% 6.4% 6.1% 5.5% 3.8% 2.6% 1.3% 15.7% 20.3% 30.7% n = 1,658 0% 5% 10% 15% 20% 25% 30% 35% 32
34 Question 10: Origin Location: Where are you coming from? Survey participants were informed that this question was different from boarding location and sought to identify one-way trip origin. Question 10.A: What kind of place are you coming from? 100% 1.0% 0.6% 1.8% 3.5% 4.7% 2.5% 90% 4.6% 5.1% Exhibit 3.10.a. Kind of place - origin 3.0% 1.4% 3.7% 4.8% 2.5% 2.8% 4.8% 6.0% 4.8% 80% 5.1% 4.3% 5.1% 5.4% 5.9% 6.9% 70% 60% 18.2% 14.2% 19.6% 50% 40% 93.0% 27.7% 30% 20% 54.5% 51.1% 31.3% 10% 0% Local Express Rail System Home Work or work - related Recreation/personal business University/college Shopping Medical services High school Other (specify) Decline to state 33
35 Question 10.B: If you are not coming from home, what is the name of this place? Question 10.C: What is the exact street address of this place? Questions 10.B and 10.C provided alternatives to help identify trip origin locations. When survey data was cleaned, corresponding location names and addresses could be totalled to identify the most popular origin locations. Exhibit 3.10.b Most common origin locations Address Name Frequency Ellicott St, Buffalo Erie Community College City Campus Elmwood Avenue, Buffalo SUNY Buffalo State Galleria Dr, Cheektowaga Walden Galleria Mall Main St, Buffalo University of Buffalo South Campus Grider Street, Buffalo Erie County Medical Center Franklin Street, Buffalo Rath Building Main Street, Buffalo Main Place Mall Lafayette Square, Buffalo Buffalo & Erie County Library Main Street, Buffalo Middle Early College High School Genesee Street, Buffalo Buffalo Niagara International Airport Union Road, Cheektowaga AppleTree Business Park Harlem Rd, Buffalo Thruway Plaza Bailey Avenue, Buffalo Veterans Hospital Main Street, Buffalo Bryant & Stratton College Court Street and Pearl Street Downtown Buffalo 17 Respondents were instructed to provide nearest cross-streets if they did not know an exact address. Question 10.D: How did you get to the first bus/train on this one-way trip? Eighty-eight percent of respondents walked or utilized a wheelchair to begin their one-way trip. Slightly more than 11 percent reached their first bus/train via an automobile (carpool, taxi, single-occupancy vehicle, etc.). 34
36 Exhibit 3.10.D.a Mode of access system 0% 10% 20% 30% 40% 50% 60% 70% 80% 90% 100% Walked/wheelchair 88.0% Dropped off Drove alone Carpooled Bicycle Taxi 7.7% 2.5% 0.6% 0.8% 0.5% n= 8,626 Exhibit 3.10.D.b Mode of access comparison 100% 90% 80% 7.2% 29.4% 8.2% 9.3% 2.5% 7.7% 70% 60% 9.8% 50% 40% 90.4% 79.5% 88.0% 30% 59.5% 20% 10% 0% Local Express Rail System Taxi Bicycle Carpooled Drove alone Dropped off Walked/wheelchair 35
37 Approximately 95 percent of respondents indicated walking five blocks or less to board NFTA-Metro vehicles, including 74 percent who walk two blocks or less. Less than five percent walked six blocks or more. This suggests bus stops are placed appropriately throughout the system. As Exhibit 3.10.D.d shows, this pattern holds for all service modes. 70.0% 60.0% Exhibit 3.10.D.c Mode of access blocks walked - system 57.8% n = 4, % 40.0% 30.0% 20.0% 10.0% 0.0% 15.9% less than 1 block 21.5% 4.2% 0.5% 1 to 2 blocks 3 to 5 blocks 6 to 10 blocks more than 10 blocks Exhibit 3.10.D.d Mode of access blocks walked - comparison 100% 90% 80% 70% 60% 50% 40% 30% 20% 10% 0% 4.2% 3.3% 4.4% 4.2% 20.9% 18.0% 25.1% 21.5% 57.9% 62.3% 56.8% 57.8% 16.4% 16.4% 13.3% 15.9% Local Express Rail System more than 10 blocks 6 to 10 blocks 3 to 5 blocks 1 to 2 blocks less than 1 block 36
38 Approximately 88 percent of respondents who indicated driving in order to acces their first bus or train traveled five miles or less. 80% 70% 60% 50% 40% 30% 20% 72.8% Exhibit 3.10.D.e Mode of access blocks driven system 15.5% n = % 0% less than 3 miles Distance driven to access NFTA-Metro service varied considerably by mode. Eighty-one percent of riders on local routes drove three miles or less, while 36 percent of riders on Express routes drove three to file miles. 6.3% 2.0% 3.4% 3 to 5 miles 6-10 miles miles more than 15 miles Exhibit 3.10.D.f Mode of access blocks driven comparison 100% 90% 80% 70% 60% 50% 40% 30% 20% 10% 0% 3.2% 3.2% 3.8% 3.4% 3.9% 6.5% 3.2% 11.0% 8.3% 6.3% 19.4% 15.5% 20.5% 35.5% 80.9% 64.1% 72.8% 35.5% Local Express Rail System more than 15 miles miles 6-10 miles 3 to 5 miles less than 3 miles 37
39 Question 11: Destination location: where are you going to? Survey participants were informed that this question was different from alighting location and sought to identify one-way trip destination or trip purpose. Question 11.A: What kind of place are you going to? 100% 3.1% 1.2% 2.3% 1.8% 5.5% 4.1% 90% 2.2% 1.8% 1.8% 4.9% 0.6% Exhibit 3.11.A.a Trip purpose - destination 3.0% 3.1% 4.8% 5.3% 2.8% 2.3% 5.9% 5.1% 80% 6.4% 6.0% 6.2% 70% 9.0% 14.2% 9.7% 60% 9.0% 4.3% 8.0% 50% 23.6% 74.9% 27.7% 25.3% 40% 30% 20% 36.3% 31.3% 35.0% 10% 11.7% 0% Local Express Rail System Home Work or work-related Shopping Recreation/personal business Medical services University/college High school Other (specify) Decline to state 38
40 Question 11.B: If you are not going home, what is the name of this place? Question 11.C: What is the exact street address of this place? Questions 11.B and 11.C provided alternatives to help identify trip destination locations. When survey data was cleaned, corresponding location names and addresses could be totalled to identify the most popular origin locations. Exhibit 3.11.B Most common destination locations Address Name Frequency Elmwood Avenue, Buffalo SUNY Buffalo State Galleria Dr, Cheektowaga Walden Galleria Mall Ellicott St, Buffalo Erie Community College City Campus Grider Street, Buffalo Erie County Medical Center Franklin Street, Buffalo Rath Building Main St, Buffalo University of Buffalo South Campus Main Street, Buffalo Main Place Mall Lafayette Square, Buffalo Buffalo & Erie County Library High Street, Buffalo Buffalo General Medical Center Broadway, Buffalo Broadway Market Court Street and Pearl Street Downtown Buffalo Walden Avenue, Cheektowaga Walmart Niagara Square, Buffalo City of Buffalo Bryant, Buffalo Children s Hospital Elmwood Avenue, Buffalo Elmwood Plaza 19 Question 11.D: How will you get to your destination from the last bus/train on this one-way trip? As was the case when beginning their trips, respondents ended their trips by walking or utilizing a wheelchair to reach their destination. Responses were similar across all modes. 39
41 Exhibit 3.11.D.a Mode of egress system 0% 20% 40% 60% 80% 100% Walked/wheelchair 91.6% Get picked up Drove alone 1.1% 5.4% n= 8,182 Carpooled 0.5% Bicycle 0.9% Taxi 0.5% Exhibit 3.11.D.b Mode of egress - comparison 100% 90% 80% 70% 60% 50% 40% 30% 20% 10% 0% 3.2% 5.5% 3.6% 5.6% 5.4% 92.2% 94.2% 88.4% 91.6% Local Express Rail System Taxi Bicycle Carpooled Drove alone Get picked up Walked/wheelchair 40
42 Similar to Question 10, ninety-five percent of respondents cited walking from their final bus/train stop to their destination cited traveling five blocks or less, including nearly 76 percent who cited walking two blocks or less. 60% 50% Exhibit 3.11.D.c Mode of egress blocks walked system 54.5% n = 3,935 40% 30% 20% 21.2% 19.3% 10% 0% 4.3% 0.6% less than 1 1 to 2 3 to 5 6 to 10 more than 10 Exhibit 3.11.D.d Mode of egress blocks walked - comparison 100% 90% 80% 70% 60% 50% 40% 30% 20% 10% 0% 4.3% 3.4% 4.4% 4.3% 19.0% 18.0% 20.7% 19.3% 54.3% 53.9% 55.7% 54.5% 21.8% 24.7% 18.3% 21.2% Local Express Rail System Total more than 10 6 to 10 3 to 5 1 to 2 less than 1 41
43 Approximately 93 percent of respondents indicated driving five miles or less from their final bus/train to their destination, including 81.6 percent who drove less than three miles. 90% 80% 70% 60% 50% 40% 30% 20% 10% 0% 81.6% less than 3 miles Exhibit 3.11.D.e Mode of egress miles driven system 11.3% 5.7% 0.5% 0.9% n = to 5 miles 6-10 miles miles more than 15 miles Riders of Express routes were more likely to drive longer distances from their final bus/train to their final destination, including one-third who reported driving six to ten miles. Exhibit 3.11.D.f Mode of egress miles driven - comparison 100% 90% 80% 70% 60% 50% 40% 30% 20% 10% 0% 4.2% 5.7% 9.5% 10.8% 11.3% 33.3% 11.9% 33.3% 83.8% 76.2% 81.6% 33.3% Local Express Rail System more than 15 miles miles 6-10 miles 3 to 5 miles less than 3 miles 42
44 Question 12: In a typical week, how often do you ride NFTA-Metro? Eighty-five percent of respondents are frequent riders who cited riding at least three days per week. This supports our findings of a high level of transit dependency. 50% 45% 40% 35% 30% 25% 20% 15% 10% 5% 0% 44.2% 41.1% 6.7% Exhibit 3.12.a Ridership frequency 5.0% 6-7 days/week 3-5 days/week 1-2 days/week 1-3 days/month n = 8, % Less than once/month Ridership frequency levels were similar across service modes. However, riders of Express routes were more likely to report riding three to five days per week (71.3 percent). Exhibit 3.12.b Ridership frequency comparison 100% 90% 80% 70% 60% 50% 2.3% 4.8% 6.7% 40.1% 4.3% 7.0% 3.1% 5.0% 6.8% 6.7% 6.6% 41.1% 71.3% 42.3% Less than once/month 1-3 days/month 1-2 days/week 40% 30% 20% 10% 46.1% 23.2% 37.2% 44.2% 3-5 days/week 6-7 days/week 0% Local Express Rail System 43
45 SECTION 3: TELL US ABOUT YOURSELF. Question 13: Do you have a valid driver license? Just 43.1 percent of respondents indicated possession of a valid driver license. As Exhibit 3.13.b illustrates, riders of local routes were least likely to have a valid driver license, while riders of Express routes were most likely to possess a valid license (70.8 percent). Exhibit 3.13.a Driver license Yes, 43.1% No, 56.9% n= 7, % Exhibit 3.13.b Driver license comparison 90% 80% 70% 60% 50% 40% 30% 20% 10% 0% 29.2% 44.5% 60.3% 56.9% 70.8% 55.5% 39.7% 43.1% Local Express Rail System No Yes 44
46 Question 14: What is your age? Nearly 69 percent of all respondents were working-age adult (ages 25-64). Only 4.6 percent indicated being 65 years or older. Exhibit 3.14.a Age 30% 25% 24.6% 21.9% 22.4% n= 7,864 20% 18.1% 15% 10% 5% 0% 1.3% 7.1% NFTA-Metro riders are more likely to be ages 25 to 64 (68.9 percent) than the general populations of Erie and Niagara counties (42.6 percent). NFTA-Metro riders are less likely to be age 18 and under or 65 years and older. 4.6% Under years of age Exhibit 3.14.b Age Census comparison 30% 25% 23.7% 24.6% 21.9% 22.4% 21.6% 20% 18.1% 18.4% 16.4% 15% 12.8% 10% 8.4% 7.3% 5% 4.6% 0% 18 and under years of NFTA Riders Census age 45
47 The survey revealed similar age distribution among riders of local bus, rail, and the overall system. However, individuals age were strongly represented among Express bus riders (46.2 percent). Exhibit 3.14.c Age comparison 100% 90% 80% 70% 60% 50% 40% 30% 20% 10% 0% 7.1% 3.8% 5.7% 7.7% 7.1% 18.4% 12.0% 18.2% 18.1% 24.9% 24.7% 24.7% 24.6% 22.1% 20.9% 21.9% 46.2% 21.7% 22.6% 22.4% 4.5% 7.6% 5.0% 4.6% Local Express Rail System Under years of age Data cross-tabulation: Route vs. Age A data cross-tabulation between age and route was run to determine whether certain routes saw greater concentrations of riders of certain ages, particularly those under 19 and over age 65. Route 14 saw the highest percentage of respondents under age 19 (16.9 percent). Route 72 had the highest percentage of respondents age 65 and older (20 percent), though Routes 64 and 79 each had 16.7 percent of respondents citing being in that age group. 46
48 Exhibit 3.14.d Cross-tabulation age vs. route Route Under and older 1 0.0% 3.8% 11.4% 22.7% 23.5% 32.6% 6.1% 2 0.6% 4.3% 15.3% 27.0% 25.2% 23.3% 4.3% 3 1.0% 7.4% 20.7% 27.4% 20.7% 20.7% 2.1% 4 0.6% 5.1% 16.0% 20.0% 23.4% 29.7% 5.1% 5 1.8% 8.7% 20.2% 28.3% 18.9% 18.0% 4.1% 6 2.5% 8.2% 16.3% 27.0% 24.5% 17.4% 4.3% 7 0.0% 2.9% 22.9% 22.9% 25.7% 20.0% 5.7% 8 1.6% 9.6% 11.7% 21.8% 20.7% 30.3% 4.3% % 2.0% 14.0% 28.0% 29.0% 23.0% 4.0% % 7.2% 19.9% 25.7% 23.9% 18.3% 3.1% % 8.5% 11.9% 25.9% 24.8% 24.8% 4.1% % 9.2% 25.3% 25.3% 12.6% 18.4% 6.9% % 4.7% 14.9% 24.3% 27.2% 21.7% 5.5% % 6.1% 12.2% 28.3% 22.8% 24.4% 5.0% % 11.1% 16.7% 16.7% 13.9% 33.3% 8.3% % 12.4% 15.9% 17.7% 23.1% 21.9% 4.5% % 7.1% 23.8% 23.1% 21.2% 20.2% 3.8% % 6.3% 8.3% 25.0% 25.0% 22.9% 10.4% % 8.0% 16.9% 27.7% 22.2% 17.5% 5.2% % 3.6% 18.0% 25.2% 28.4% 20.3% 4.5% % 5.5% 14.2% 22.5% 21.1% 29.1% 6.9% % 9.5% 18.9% 25.7% 16.9% 23.0% 3.4% % 0.0% 100.0% 0.0% 0.0% 0.0% 0.0% % 7.5% 31.2% 27.2% 12.7% 15.6% 4.0% % 3.8% 19.2% 30.8% 24.0% 15.4% 5.8% % 5.6% 26.4% 30.6% 19.4% 12.5% 5.6% % 8.0% 18.0% 26.0% 22.0% 20.0% 4.0% % 2.6% 15.2% 19.9% 27.8% 29.1% 5.3% % 4.8% 9.5% 23.8% 23.8% 33.3% 4.8% % 3.7% 19.8% 29.6% 21.0% 24.7% 1.2% % 5.0% 15.0% 22.5% 25.0% 25.0% 7.5% % 4.4% 48.9% 13.3% 17.8% 15.6% 0.0% % 10.7% 20.0% 29.3% 16.0% 20.0% 4.0% % 0.0% 27.8% 27.8% 22.2% 22.2% 0.0% % 3.2% 25.8% 16.1% 22.6% 29.0% 3.2% % 5.6% 22.2% 2.8% 41.7% 22.2% 5.6% % 0.0% 28.6% 28.6% 42.9% 0.0% 0.0% % 3.3% 18.9% 22.2% 16.7% 30.0% 8.9% % 0.0% 0.0% 12.5% 25.0% 62.5% 0.0% % 0.0% 0.0% 28.6% 28.6% 28.6% 14.3% % 0.0% 5.6% 5.6% 5.6% 66.7% 16.7% % 0.0% 0.0% 5.9% 35.3% 47.1% 11.8% % 0.0% 0.0% 0.0% 14.3% 71.4% 14.3% % 0.0% 0.0% 0.0% 42.9% 57.1% 0.0% % 7.1% 7.1% 14.3% 21.4% 42.9% 7.1% % 0.0% 0.0% 16.7% 50.0% 33.3% 0.0% % 0.0% 0.0% 20.0% 0.0% 60.0% 20.0% % 0.0% 5.0% 15.0% 25.0% 50.0% 5.0% % 23.1% 7.7% 23.1% 23.1% 15.4% 7.7% % 7.1% 7.1% 7.1% 35.7% 42.9% 0.0% % 0.0% 33.3% 0.0% 33.3% 16.7% 16.7% % 14.3% 0.0% 14.3% 14.3% 57.1% 0.0% % 0.0% 22.2% 22.2% 22.2% 33.3% 0.0% Rail 0.9% 7.7% 18.2% 24.7% 20.9% 22.6% 5.0% 47
49 Data cross-tabulation: Payment Type vs. Age (Bus) A review of payment type by age reveals that respondents over the age of 25 paid for a bus trip with a monthly pass. Respondents in the 19 to 24 year old age group used a day pass, and not surprisingly, respondents 18 years or younger used a student pass. Exhibit 3.14.e Payment type vs. age - bus Age Token Cash Weekly Monthly 30-Day Student CRAM Day Pass (one ride) Pass Pass Pass Pass Pass Under % 11.5% 20.7% 1.1% 8.0% 0.0% 57.5% 0.0% % 15.6% 16.5% 1.1% 16.7% 1.3% 34.6% 11.8% % 22.7% 25.0% 1.4% 18.9% 1.9% 8.9% 19.0% % 21.8% 30.2% 1.7% 33.9% 3.3% 2.6% 4.3% % 22.0% 28.9% 2.7% 36.8% 2.9% 1.5% 2.7% % 21.8% 25.3% 1.6% 43.7% 3.3% 1.0% 1.3% 65 or older 1.0% 22.8% 34.3% 1.4% 38.4% 2.1% 0.0% 0.0% Data cross-tabulation: Payment Type vs. Age (Rail) Similar to bus, respondents over the age of 25 paid for a rail trip with a monthly pass. Respondents in the 19 to 24 year old age group used a day pass, and not surprisingly, respondents 18 years or younger used a student pass. Age Token Cash (one ride) Day Pass Weekly Pass Monthly Pass 30-Day Pass Exhibit 3.14.f Payment type vs. age - rail Round Free NFTA Trip Student Fare Employee Rail Pass Zone Pass Ticket Under % 0.0% 0.0% 0.0% 23.1% 0.0% 0.0% 76.9% 0.0% 0.0% % 12.5% 7.7% 1.0% 10.6% 1.0% 2.9% 50.0% 12.5% 1.0% % 22.4% 14.9% 1.2% 19.1% 4.6% 6.6% 7.9% 15.8% 5.0% % 17.3% 18.5% 1.5% 34.3% 5.1% 6.0% 1.8% 2.7% 9.9% % 16.6% 22.3% 1.4% 35.7% 4.2% 4.6% 2.5% 3.2% 7.4% % 13.1% 21.9% 2.0% 43.1% 2.6% 8.8% 0.0% 1.6% 3.9% 65 or older 0.0% 14.7% 23.5% 1.5% 39.7% 1.5% 16.2% 0.0% 0.0% 2.9% 48
50 Question 15: Are you? (check all that apply) Question 15 was designed to to identify employment status. Sixty-eight percent of respondents reported working full-time or part-time. Exhibit 3.15.a Employment status 0% 5% 10% 15% 20% 25% 30% 35% 40% 45% Full-time worker Part-time worker 25.0% 42.6% Homemaker 4.8% University/college student 12.4% High school student Retired 4.6% 6.8% Unemployed 12.4% Veteran 2.0% Active military 0.1% n= 7,519 49
51 Not surprisingly, 83.2 percent of Express riders reported being employed full-time. Percentages for other modes remained similar across all employment categories. 100% 90% 80% 70% 60% 50% 40% 30% 20% 10% 0% 1.9% 4.3% 2.1% 2.0% 13.0% 4.3% 10.7% 12% 6.8% 5.6% 7.2% 7% 4.6% 6.2% 5.2% 5% 11.8% 5.3% 3.0% 5% 26.5% 40.4% 83.2% 20.8% 47.9% Exhibit 3.15.b Employment status comparison 15.6% 12% 25% 42.6% Local Express Rail System Active military Veteran Unemployed Retired High school student University/college student Homemaker Part-time worker Full-time worker 50
52 Question 16: What is your ethnicity? (check all that apply) Black/African-American respondents were the most commonly represented in the survey sample (45.1 percent), followed by Caucasian/white respondents (39.0 percent). Note: The Census Bureau is considering adding Middle Eastern/North African as a ethnic category for Therefore, the survey instrument also included this ethnicity as a separate category. Current census data categorizes persons identifying as this ethnicity as Caucasian/White. Exhibit 3.16.a Ethnicity 0% 5% 10% 15% 20% 25% 30% 35% 40% 45% 50% Black/ African-American 45.1% Caucasian/White 39.0% Hispanic/Latino 9.9% Native American/Alaska Native Asian Middle Eastern/ North African Native Hawaiian or Pacific Islander 2.9% 3.8% 0.7% 0.3% Other 1.7% n= 7,675 51
53 NFTA-Metro riders are more likely to be Black/African-American (45.1 percent) versus residents of Erie and Niagara counties as a whole (11.9 percent). Meanwhile, the general population has a greater percentage of Caucasian/White individuals (74.3 percent) than NFTA-Metro riders (39.7 percent). Note: To enable comparisons with current Census data, respondents who self-identified as Middle Eastern/North African were included with respondents who self-identifed as as Caucasian/White. Exhibit 3.16.b Ethnicity Census comparison 0% 10% 20% 30% 40% 50% 60% 70% 80% Caucasian/White 39.7% 74.3% Hispanic/Latino Black/ African-American Native American/Alaska Native Asian Native Hawaiian or Pacific Islander Other 9.9% 4.4% 11.9% 2.9% 0.5% 3.8% 2.7% 0.3% 0.0% 1.7% 6.1% 45.1% NFTA Riders Census 52
54 Rider demographics were fairly evenly distibuted across tranist modes, with the exception of the Express routes. Nearly 70 percent of respondents on Express routes self-identified as Caucasian/White. Exhibit 3.16.c Ethnicity comparison 100% 90% 1.5% 2.5% 2.8% 1.7% 3.2% 2.9% 2.8% 2.5% 3.8% 4.4% 2.9% 7.6% 10.5% 9.9% Other 80% 70% 60% 50% 40% 37.0% 71.5% 44.8% 39.0% Native Hawaiian or Pacific Islander Middle Eastern/ North African Asian Native American/Alaska Native Hispanic/Latino 30% 20% 46.5% 41.8% 45.1% Caucasian/White Black/ African-American 10% 17.1% 0% Local Express Rail System Data cross-tabulation: Ethnicity vs. Route A data cross-tabulation was run to identify concentrations of various ethnicities by route. On many routes, the majority of riders were divided between Caucasian/White and Black/African-American. (These two categories represented more than 84 percent of all respondents.) However, a number of routes demonstrated significant concentrations of one of these ethnicities among survey respondents. For example, Route 76 was represented as 86.7 percent White and zero percent Black, while Route 29 was represented as 100 percent Black. Route 66 saw the highest percentage of Asian respondents (16.7 percent), while Route 49 had the highest concentration of Middle Eastern/North African respondents (10 percent). Route 3 had the highest percentage of respondents identifying as Hispanic/Latino (22.1 percent), while Route 61 had the greatest percentage of Native American respondents (16.7 percent). 53
55 Route Caucasian/ White Black/ African- American Exhibit 3.16.d Cross-tabulation: Ethnicity vs. route Hispanic/ Latino Asian Middle Eastern/ North African Native American/ Alaska Native Native Hawaiian or Pacific Islander Other % 42.9% 5.3% 3.0% 0.8% 3.0% 0.0% 0.8% % 28.5% 10.9% 0.6% 0.0% 2.4% 0.6% 2.4% % 34.6% 22.1% 2.8% 0.9% 4.0% 0.0% 0.9% % 51.7% 9.3% 1.7% 0.0% 1.2% 1.7% 0.6% % 36.5% 17.6% 3.6% 0.6% 2.2% 0.5% 2.2% % 56.0% 8.6% 2.3% 1.1% 1.9% 0.0% 1.5% % 20.0% 8.6% 0.0% 0.0% 8.6% 0.0% 2.9% % 60.2% 5.9% 1.6% 0.5% 2.2% 0.0% 2.7% % 27.6% 9.5% 3.8% 0.0% 3.8% 0.0% 0.0% % 64.8% 12.1% 3.0% 0.6% 3.0% 0.4% 1.3% % 77.5% 4.1% 2.2% 0.7% 2.6% 0.4% 1.5% % 31.6% 10.9% 0.6% 0.0% 2.3% 0.0% 0.6% % 21.0% 10.1% 0.8% 1.7% 3.4% 1.3% 0.8% % 22.5% 8.7% 1.2% 0.6% 2.3% 0.0% 1.7% % 85.3% 2.9% 2.9% 0.0% 0.0% 0.0% 0.0% % 58.1% 6.2% 2.0% 0.7% 2.7% 0.5% 2.2% % 31.3% 11.5% 4.8% 0.9% 4.4% 0.5% 1.2% % 57.1% 7.1% 2.4% 2.4% 2.4% 0.0% 0.0% % 56.0% 9.2% 2.2% 0.0% 2.2% 0.6% 0.6% % 65.8% 7.2% 1.7% 0.4% 2.1% 1.3% 0.0% % 31.2% 8.8% 2.4% 0.0% 4.1% 0.0% 2.4% % 73.9% 4.3% 0.7% 0.0% 0.7% 0.0% 0.7% % 100.0% 0.0% 0.0% 0.0% 0.0% 0.0% 0.0% % 52.3% 9.3% 1.7% 0.0% 3.5% 0.0% 0.6% % 43.9% 8.4% 1.9% 0.9% 5.6% 0.0% 4.7% % 30.9% 10.3% 1.5% 1.5% 0.0% 0.0% 1.5% % 35.8% 7.5% 1.9% 3.8% 5.7% 0.0% 0.0% % 35.4% 6.3% 5.6% 0.0% 4.2% 0.0% 3.5% % 36.0% 8.0% 0.0% 4.0% 0.0% 0.0% 0.0% % 38.8% 5.0% 6.3% 1.3% 2.5% 0.0% 2.5% % 33.3% 8.3% 8.3% 0.0% 0.0% 0.0% 2.8% % 44.9% 4.1% 4.1% 0.0% 4.1% 0.0% 0.0% % 44.4% 3.7% 4.9% 0.0% 3.7% 0.0% 1.2% % 45.0% 5.0% 5.0% 10.0% 0.0% 0.0% 5.0% % 36.4% 15.2% 12.1% 0.0% 3.0% 0.0% 3.0% % 51.6% 6.5% 0.0% 0.0% 0.0% 3.2% 3.2% % 37.5% 0.0% 0.0% 0.0% 12.5% 0.0% 0.0% % 40.0% 5.6% 7.8% 0.0% 3.3% 0.0% 1.1% % 12.5% 0.0% 0.0% 0.0% 0.0% 0.0% 0.0% % 0.0% 0.0% 0.0% 0.0% 16.7% 0.0% 0.0% % 5.6% 5.6% 5.6% 0.0% 0.0% 0.0% 0.0% % 11.1% 5.6% 16.7% 0.0% 0.0% 0.0% 16.7% % 42.9% 0.0% 0.0% 0.0% 0.0% 0.0% 0.0% % 0.0% 0.0% 0.0% 0.0% 0.0% 0.0% 14.3% % 26.7% 0.0% 0.0% 0.0% 0.0% 0.0% 0.0% % 16.7% 0.0% 0.0% 0.0% 0.0% 0.0% 0.0% % 20.0% 0.0% 0.0% 0.0% 0.0% 0.0% 0.0% % 14.3% 4.8% 0.0% 0.0% 4.8% 0.0% 0.0% % 28.6% 14.3% 7.1% 0.0% 0.0% 0.0% 0.0% % 0.0% 0.0% 0.0% 0.0% 13.3% 0.0% 0.0% % 16.7% 0.0% 0.0% 0.0% 0.0% 0.0% 0.0% % 71.4% 14.3% 0.0% 0.0% 0.0% 0.0% 0.0% % 11.1% 11.1% 11.1% 0.0% 11.1% 0.0% 0.0% Rail 42.7% 39.8% 7.2% 4.2% 0.8% 2.3% 0.2% 2.6% 54
56 Question 17: Including yourself, how many people live in your household? Nearly 54 percent of respondents reported living alone or with one other person. Exhibit 3.17.a Household size 30% 26.3% 27.2% n = 7,264 25% 20% 18.8% 15% 14.1% 13.6% 10% 5% 0% 1 person 2 persons 3 persons 4 persons 5 or more Exhibit 3.17.b Household size comparison 100% 90% 80% 70% 60% 50% 40% 30% 20% 10% 0% 14% 11% 13% 14% 14.2% 12.0% 14.2% 14.1% 19.3% 19.3% 16.3% 18.8% 26.5% 40.0% 28.7% 27.2% 26.3% 17.3% 27.5% 26.3% Local Express Rail System 5 or more 4 persons 3 persons 2 persons 1 person 55
57 Question 18: Including yourself, how many of the people in your household are employed full-time or part-time? Question 18 was designed to quantify the number of working within households. Nearly 63 percent cited living in a household with one or two employed persons. Nearly 26 percent indicated none, which would take into account unemployed and retired individuals as well as homemakers and students who do not work. 40% 35% 36.6% Exhibit 3.18.a Employment status household n = 7,570 30% 25% 20% 15% 25.6% 25.9% 10% 8.4% 5% 0% 3.5% None 1 person 2 persons 3 persons 4 or more As could be expected, riders of Express routes were least likely to report having no household members who are employed. Exhibit 3.18.b Employment status household 100% 90% 3.4% 3.9% 3.8% 3.5% 8.3% 8.6% 8.7% 8.4% 80% 70% 25.1% 32.9% 28.9% 25.9% 4 or more 60% 3 persons 50% 40% 30% 36.5% 44.1% 36.2% 36.6% 2 persons 1 person 20% 10% 0% 26.6% 10.5% 22.4% 25.6% Local Express Rail System None 56
58 Question 19: How many working vehicles are available to your household? 70% 60% 50% 58% Exhibit 3.19.a Personal vehicle access n = 7,637 40% 30% 20% 10% 0% 27% 10% 3% 1% None 1 vehicle 2 vehicles 3 vehicles 4 or more Respondents using local routes were most likely to lack access to a personal vehicle (62.0 percent). Just 20.5 percent of respondents on Express routes reported no access to personal vehicle, compared with 58.4 percent at the system level. Exhibit 3.19.b Personal vehicle access - comparison 100% 90% 80% 70% 60% 50% 40% 30% 20% 10% 0% 2.2% 8.6% 8.3% 5.6% 2.9% 10.4% 17.2% 26.4% 28.2% 27.2% 29.3% 41.0% 62.0% 58.4% 45.7% 20.5% Local Express Rail System 4 or more 3 vehicles 2 vehicles 1 vehicle None 57
59 Data cross-tabulation: driver license vs. personal vehicle access To gain further insight into the degree of transit-dependency present within survey respondents, a data cross-tabulation compared respondents driver license status with the number of personal vehicles available in their household. This cross-tabulation revealed: Sixty-two percent of respondents have either no driver license or no access to a personal vehicle. Twenty-seven percent of respondents have neither a driver license nor a personal vehicle. Question 20: Were any of those vehicles available to make this one-way trip? Only 16 percent of survey respondents indicated having access to a personal vehicle on the surveyed trip. This suggests a high degree of transit-dependency among NFTA-Metro riders. Exhibit 3.20.a Vehicle access/trip - system Yes 16.4% Not applicable 33.8% n= 7,413 No 49.8% 58
60 Access to a personal vehicle was limited across all service modes. Even on Express routes, where riders were most likely to have access to a personal vehicle, 44.1 percent did not have access to a vehicle for the surveyed trip. Exhibit 3.20.b Vehicle access/trip comparison 100% 90% 80% 70% 60% 50% 40% 30% 20% 10% 0% 35.7% 51.9% 12.5% 13.8% 30.3% 55.9% 27.4% 42.5% 30.1% 33.8% 49.8% 16.4% Local Express Rail System Not applicable No Yes Question 21: What languages are spoken in your home? (check all that apply) English was cited by 76.9 percent of respondent households. Exhibit 3.21.a Language spoken at home 0% 10% 20% 30% 40% 50% 60% 70% 80% 90% English 76.9% Spanish 7.6% Karen Burmese Nepali Arabic Somali Bengali/Bangla Swahili 0.2% 0.2% 0.3% 0.6% 0.2% 0.3% 0.3% French 1.2% Other 1.2% n= 9,697 59
61 The survey data revealed minimal differences among modes regarding languages spoken at home. Exhibit 3.21.b Language spoken at home comparison 100% 90% 80% 70% 60% 50% 40% 30% 20% 10% 0% 8.1% 5.8% 5.9% 7.6% 77.0% 91.2% 75.1% 76.9% Local Express Rail System Other French Swahili Bengali/Bangla Somali Arabic Nepali Burmese Karen Spanish English Data cross-tabulation: Language Spoken at Home vs. Route A review of language spoken at home by route shows that on eight bus routes (Routes 2, 3, 5, 12, 52, 60, 72, and 81), 10 percent or more of respondents indicated speaking Spanish in the home. Among other languages spoken at home, 14.3 percent of Route 79 respondents speak Arabic, and 22.2 percent of Route 50 respondents speak French. 60
62 Exhibit 3.21.c Cross-tabulation: Language spoken at home vs. route Route English Spanish Arabic Bengali Burmese French Karen Nepali Somali Swahili Other % 7.6% 0.0% 0.7% 0.0% 0.0% 0.0% 0.0% 0.0% 0.0% 1.4% % 12.1% 0.0% 0.0% 0.0% 0.5% 0.0% 0.0% 0.0% 0.0% 0.5% % 17.6% 1.7% 0.2% 0.8% 3.5% 1.0% 0.4% 0.0% 0.8% 1.7% % 7.9% 0.0% 0.5% 0.0% 2.1% 0.0% 0.0% 0.0% 0.0% 2.1% % 14.8% 1.2% 0.1% 0.3% 0.0% 0.9% 0.4% 0.3% 0.1% 1.3% % 6.9% 0.3% 0.3% 0.0% 1.0% 0.3% 0.0% 0.0% 0.3% 0.7% % 5.6% 0.0% 0.0% 0.0% 0.0% 0.0% 0.0% 0.0% 0.0% 0.0% % 5.6% 1.0% 0.0% 0.0% 1.0% 0.0% 0.5% 0.5% 1.0% 0.5% % 4.7% 0.0% 0.0% 0.0% 1.9% 0.0% 0.0% 0.9% 0.0% 0.9% % 11.0% 0.6% 0.0% 0.4% 1.0% 0.0% 0.2% 0.0% 0.2% 0.6% % 4.9% 0.0% 1.0% 0.0% 0.7% 0.0% 0.0% 0.0% 0.0% 1.0% % 6.3% 0.0% 0.0% 0.0% 2.6% 0.0% 0.0% 0.0% 0.0% 0.5% % 7.8% 0.8% 0.4% 0.4% 1.2% 0.4% 0.8% 0.0% 0.4% 1.2% % 7.4% 0.0% 0.0% 0.0% 0.5% 0.0% 0.0% 1.1% 0.5% 0.5% % 5.3% 0.0% 0.0% 0.0% 0.0% 0.0% 0.0% 0.0% 0.0% 0.0% % 6.6% 0.2% 0.9% 0.2% 1.6% 0.2% 0.9% 0.2% 0.7% 1.6% % 9.8% 1.2% 0.4% 0.0% 1.8% 0.4% 1.0% 0.6% 0.2% 1.8% % 6.0% 0.0% 0.0% 0.0% 4.0% 0.0% 0.0% 0.0% 0.0% 0.0% % 6.2% 0.3% 0.3% 0.3% 0.3% 0.0% 0.3% 0.3% 0.3% 0.9% % 8.7% 0.8% 0.4% 0.4% 0.8% 0.0% 0.4% 0.0% 0.8% 0.4% % 6.5% 0.7% 0.3% 0.3% 1.6% 0.0% 0.0% 0.3% 0.3% 2.3% % 4.0% 0.0% 0.0% 0.0% 0.0% 0.0% 0.0% 0.7% 0.7% 0.7% % 7.8% 2.6% 0.0% 0.0% 0.5% 0.0% 0.0% 0.0% 0.0% 0.5% % 7.9% 0.0% 0.0% 0.9% 1.8% 0.0% 0.0% 0.0% 0.0% 0.9% % 9.5% 2.7% 0.0% 0.0% 1.4% 0.0% 0.0% 0.0% 0.0% 1.4% % 9.4% 6.3% 0.0% 0.0% 1.6% 0.0% 0.0% 1.6% 1.6% 1.6% % 7.1% 0.6% 0.0% 0.0% 2.4% 0.6% 0.0% 0.0% 0.0% 4.1% % 4.3% 4.3% 0.0% 0.0% 0.0% 0.0% 0.0% 0.0% 0.0% 0.0% % 5.7% 1.1% 0.0% 0.0% 0.0% 0.0% 0.0% 0.0% 0.0% 3.4% % 5.0% 0.0% 0.0% 0.0% 0.0% 0.0% 0.0% 0.0% 0.0% 0.0% % 8.0% 0.0% 0.0% 0.0% 2.0% 0.0% 0.0% 0.0% 0.0% 2.0% % 8.4% 0.0% 0.0% 0.0% 1.2% 0.0% 0.0% 0.0% 0.0% 1.2% % 4.5% 4.5% 4.5% 0.0% 4.5% 0.0% 0.0% 0.0% 0.0% 0.0% % 4.4% 0.0% 0.0% 0.0% 22.2% 0.0% 0.0% 0.0% 0.0% 2.2% % 10.5% 0.0% 0.0% 0.0% 0.0% 0.0% 0.0% 0.0% 0.0% 0.0% % 0.0% 0.0% 0.0% 0.0% 0.0% 0.0% 0.0% 0.0% 0.0% 0.0% % 4.3% 0.0% 0.0% 0.0% 0.0% 0.0% 0.0% 0.0% 0.0% 2.2% % 12.5% 0.0% 0.0% 0.0% 0.0% 0.0% 0.0% 0.0% 0.0% 0.0% % 0.0% 0.0% 0.0% 0.0% 0.0% 0.0% 0.0% 0.0% 0.0% 0.0% % 9.5% 0.0% 0.0% 0.0% 0.0% 0.0% 0.0% 0.0% 0.0% 0.0% % 5.3% 0.0% 0.0% 0.0% 0.0% 0.0% 0.0% 0.0% 0.0% 5.3% % 0.0% 0.0% 0.0% 0.0% 0.0% 0.0% 0.0% 0.0% 0.0% 0.0% % 0.0% 0.0% 0.0% 0.0% 0.0% 0.0% 0.0% 0.0% 0.0% 0.0% % 0.0% 0.0% 0.0% 0.0% 0.0% 0.0% 0.0% 0.0% 0.0% 6.7% % 0.0% 0.0% 0.0% 0.0% 0.0% 0.0% 0.0% 0.0% 0.0% 0.0% % 20.0% 0.0% 0.0% 0.0% 0.0% 0.0% 0.0% 0.0% 0.0% 0.0% % 9.5% 0.0% 0.0% 0.0% 0.0% 0.0% 0.0% 0.0% 0.0% 0.0% % 7.7% 0.0% 0.0% 0.0% 0.0% 0.0% 0.0% 0.0% 0.0% 0.0% % 0.0% 0.0% 0.0% 0.0% 0.0% 0.0% 0.0% 0.0% 0.0% 0.0% % 0.0% 14.3% 0.0% 0.0% 0.0% 0.0% 0.0% 0.0% 0.0% 0.0% % 12.5% 0.0% 0.0% 0.0% 0.0% 0.0% 0.0% 0.0% 0.0% 0.0% % 10.0% 0.0% 0.0% 0.0% 0.0% 0.0% 0.0% 0.0% 0.0% 0.0% Rail 87.5% 6.9% 0.3% 0.8% 0.1% 1.4% 0.1% 0.3% 0.2% 0.5% 1.9% 61
63 Question 22: How well do you speak English? Reinforcing the findings of Question 21, 96.3 percent of respondents reported a high level of English proficiency. This suggests that language proficiency is not a barrier to transit usage. This level of English proficiency is consistent with Census data, in which 97 percent of people residing in Erie and Niagara counties also report a high level of English proficiency. This correspondence indicates that survey methodologies designed for inclusiveness of Limited English Proficiency individuals were successful. Exhibit 3.22.a English proficiency Less than very well, 3% Not at all, 1% Very well, 96.3% n = 7,611 Exhibit 3.22.b English proficiency comparison 100% 90% 80% 70% 60% 50% 40% 30% 20% 10% 0% 2.7% 0.6% 2.3% 2.6% 96.1% 98.7% 96.9% 96.3% Local Express Rail System Not at all Less than very well Very well 62
64 Data cross-tabulation: Language spoke at home vs. English proficiency A data cross-tabulation helps identify which languages were spoken in the homes of respondents who indicated a lack of English proficiency. This information will support development of service information that removes barriers for individuals who lack English proficiency. Respondents who cited Bengali/Bangla as a home language were most likely to cite a lack of English prociency (nearly 37 percent, out of 30 total respondents). Twenty-five percent of respondents who indicated Burmese also cited a lack of English proficiency. 100% 90% 80% 1.5% 1.7% 0.4% 2.8% 5.3% 6.3% 4.0% 1.7% 3.4% 7.3% 5.3% 8.0% 10.0% 18.8% 18.6% 12.0% Exhibit 3.22.c English proficiency vs. Language spoken at home 5.9% 3.3% 3.4% 2.6% 3.3% 1.8% 3.4% 8.5% 11.8% 17.2% 13.2% 30.0% 70% 60% 50% 40% 30% 96.4% 79.8% 89.5% 75.0% 76.0% 76.3% 82.4% 63.3% 79.3% 82.5% 88.1% 20% 10% 0% English Spanish Karen Burmese Nepali Arabic Somali Bengali/Bangla Swahili French Other Very well Less than very well Not at all Decline to state 63
65 Data cross-tabulation: English Proficiency vs. Route A review of English proficiency by route suggests that 90 percent or more of respondents on all routes speak English very well with the except of Route 49 (82.4 percent). On the other end of the spectrum, 6.3 percent of Route 50 respondents and 7.7 percent of Route 75 respondents spoke little to no English at all. Route Very well Less than very well Exhibit 3.22.d English proficiency vs. route English Proficiency Not at all Route Very well Less than very well Not at all % 2.3% 1.5% % 0.0% 0.0% % 5.7% 1.9% % 1.3% 1.3% % 6.2% 3.9% % 5.3% 2.6% % 1.8% 1.2% % 2.1% 0.0% % 4.5% 1.9% % 1.4% 1.4% % 2.2% 1.5% % 17.6% 0.0% % 5.6% 0.0% % 3.1% 6.3% % 1.6% 0.5% % 0.0% 5.6% % 1.0% 0.0% % 0.0% 0.0% % 4.5% 1.2% % 2.2% 1.1% % 2.3% 0.4% % 0.0% 0.0% % 0.0% 0.0% % 0.0% 0.0% % 2.3% 0.0% % 0.0% 0.0% % 1.7% 0.6% % 0.0% 0.0% % 0.0% 2.9% % 0.0% 0.0% % 0.8% 0.0% % 0.0% 0.0% % 2.6% 1.0% % 0.0% 0.0% % 2.2% 0.0% % 0.0% 0.0% % 1.6% 0.0% % 0.0% 0.0% % 1.8% 2.7% % 0.0% 0.0% % 0.7% 0.4% % 0.0% 7.7% % 2.9% 1.4% % 7.1% 0.0% % 1.1% 1.7% % 0.0% 0.0% % 2.0% 0.0% % 0.0% 0.0% % 3.2% 0.0% % 0.0% 0.0% % 3.8% 0.0% Rail 96.9% 2.3% 0.8% % 2.7% 0.7% 64
66 Question 23: What was your total household income in 2016 before taxes? Sixty-six percent of respondents reported a household income of less than $25,000, including 48.3 percent who reported a household income of less than $15,000. Percentages shown in Exhibit 3.23.a are adjusted to remove the 42 percent of respondents who declined to state. Exhibit 3.23.a Household income - system 0% 5% 10% 15% 20% 25% Less than $5, % $5,000 - $9,999 $10,000 - $14, % 12.3% $15,000 - $24, % $25,000 - $34, % $35,000 - $49,999 $50,000 - $74, % 8.3% $75,000 - $99,999 $100,000 or more 2.8% 2.4% n = 5,579 65
67 Exhibit 3.23.b compares survey respondent income levels with Census 2015 estimates for Erie and Niagara counties Respondents are much more likely than average residents to be in the lowest income range (36.0 percent compared to 8.1 percent). Meanwhile, 50.9 percent of residents report an annual income of $50,000 or more, compared to 12 percent of NFTA-Metro survey participants. Exhibit 3.23.b Household income Census comparison 40% 35% 36.0% 30% 25% 20% 18.0% 18.0% 20.4% 15% 10% 5% 8.1% 12.3% 5.8% 13.4% 11.4% 10.5% 8.3% 13.2% 6.8% 12.5% 2.8% 2.4% 0% Less than $10,000 $10,000 - $14,999 $15,000 - $24,999 $25,000 - $34,999 $35,000 - $49,999 $50,000 - $74,999 $75,000 - $99,999 $100,000 or more NFTA Riders Census 66
68 Riders on local routes and rail reported similar income levels, while riders of Express routes reported relatively high incomes. Exhibit 3.23.c Household income mode comparison 100% 90% 80% 70% 60% 50% 40% 30% 20% 10% 0% 2.0% 2.4% 5.3% 7.3% 2.8% 15.8% 7.7% 5.5% 6.8% 8.3% 12.0% 13.6% 16.8% 13.4% 10.6% 19.4% 23.8% 12.7% 18.0% 13.1% 12.8% 12.3% 11.9% 9.8% 13.3% 12.4% 9.9% 9.1% 5.9% 24.6% 5.0% 20.2% 23.6% 9.9% Local Express Rail System $100,000 or more $75,000 - $99,999 $50,000 - $74,999 $35,000 - $49,999 $25,000 - $34,999 $15,000 - $24,999 $10,000 - $14,999 $5,000 - $9,999 Less than $5,000 67
69 Data cross-tabulation: Household size vs. Annual Income A data cross-tabulation was run to help determine what percentage of respondents could be defined as low-income under federal guidelines. A household is classified as low-income if its taxable income does not exceed 150 percent of the federal poverty level amount for a household of that size. As Exhibit 3.23.c shows, 58.0 percent of survey respondents can be classified as low-income. An additional 16.0 percent are at risk of being classified as low-income. Annual Household Income Exhibit 3.23.d Household income comparison Household Size 1 person 2 persons 3 persons 4 persons 5 or more Less than $5, % 5.3% 3.9% 3.6% 3.4% $5,000 - $9, % 3.1% 2.3% 1.8% 1.5% $10,000 - $14, % 3.0% 2.3% 1.4% 1.2% $15,000 - $24, % 5.7% 3.2% 2.0% 1.8% $25,000 - $34, % 4.1% 2.9% 1.6% 1.3% $35,000 - $49, % 2.6% 1.7% 1.0% 1.1% $50,000 - $74, % 2.4% 1.4% 0.9% 0.9% $75,000 - $99, % 1.1% 0.3% 0.5% 0.5% $100,000 or more 0.1% 0.8% 0.6% 0.4% 0.4% 58.0% considered low income 16.0% at risk of being considered low income Data cross-tabulation: Income vs. Route A data cross-tabulation was run to assess the distribution of income among NFTA Metro routes. Not surprisingly, routes identified as Express saw higher distribution of respondents among the higher annual income categories. Local routes tended to have larger concentrations of respondents among lower income categories. 68
70 Exhibit 3.23.e Cross-tabulation income vs. route Route Less than $5,000 $5,000 - $9,999 $10,000 - $14,999 $15,000 - $24,999 $25,000 - $34,999 $35,000 - $49,999 $50,000 - $74,999 $75,000 - $99,999 $100,000 or more Decline to state % 7.3% 8.5% 12.2% 7.9% 4.3% 4.3% 0.6% 0.6% 38.4% % 8.8% 8.2% 11.5% 6.0% 6.6% 5.5% 1.6% 0.0% 34.6% % 8.4% 7.7% 9.6% 6.7% 3.1% 2.3% 1.1% 0.4% 42.7% % 10.5% 9.5% 10.9% 8.6% 5.9% 1.8% 0.0% 0.0% 38.2% % 7.1% 7.7% 11.6% 8.5% 3.2% 2.1% 1.0% 0.5% 42.8% % 9.3% 6.0% 10.8% 8.4% 5.7% 2.1% 0.3% 0.0% 41.0% 7 7.9% 7.9% 13.2% 10.5% 15.8% 10.5% 2.6% 2.6% 5.3% 23.7% % 12.6% 5.0% 7.7% 9.5% 4.5% 3.2% 0.0% 0.9% 39.6% % 1.6% 8.9% 13.7% 9.7% 7.3% 8.9% 4.8% 4.0% 37.9% % 8.0% 9.3% 9.7% 6.2% 3.2% 0.9% 0.9% 0.6% 42.8% % 6.8% 8.3% 12.1% 7.4% 3.8% 2.4% 0.0% 0.0% 44.5% % 4.1% 4.5% 11.8% 8.6% 6.8% 4.1% 1.8% 1.8% 43.0% % 8.2% 10.4% 11.2% 7.8% 6.0% 4.9% 1.1% 0.7% 33.6% % 6.8% 9.7% 13.1% 8.7% 4.9% 3.9% 1.5% 0.5% 35.9% % 6.1% 8.2% 10.2% 4.1% 2.0% 0.0% 2.0% 0.0% 46.9% % 8.0% 6.5% 11.0% 7.6% 4.1% 3.5% 1.2% 0.6% 46.8% % 7.8% 6.8% 12.3% 7.0% 3.5% 6.3% 2.5% 0.8% 42.3% % 10.9% 9.4% 10.9% 9.4% 1.6% 1.6% 0.0% 0.0% 42.2% % 8.2% 5.2% 8.2% 6.3% 4.3% 1.1% 0.7% 0.0% 53.1% % 10.4% 7.5% 14.9% 7.1% 3.0% 1.1% 0.0% 0.4% 38.8% % 8.0% 9.8% 11.0% 11.0% 6.7% 6.7% 1.2% 0.3% 34.7% % 7.0% 7.5% 13.1% 6.0% 5.5% 1.0% 1.0% 0.0% 48.7% % 9.0% 5.2% 9.0% 10.9% 3.3% 1.9% 0.5% 1.4% 43.1% % 5.7% 1.6% 16.3% 8.1% 12.2% 4.1% 1.6% 0.0% 38.2% % 9.1% 6.8% 15.9% 8.0% 4.5% 1.1% 3.4% 0.0% 43.2% % 6.8% 10.2% 11.9% 11.9% 5.1% 6.8% 3.4% 0.0% 35.6% % 4.4% 10.6% 16.1% 7.2% 2.8% 2.8% 2.2% 1.1% 36.1% % 3.8% 3.8% 26.9% 3.8% 11.5% 0.0% 0.0% 0.0% 30.8% % 4.8% 4.8% 10.6% 8.7% 4.8% 4.8% 4.8% 1.0% 43.3% % 11.9% 14.3% 9.5% 7.1% 7.1% 0.0% 0.0% 0.0% 26.2% % 5.0% 1.7% 11.7% 6.7% 5.0% 10.0% 3.3% 3.3% 48.3% % 4.7% 7.1% 11.8% 18.8% 5.9% 3.5% 0.0% 1.2% 32.9% % 13.6% 13.6% 22.7% 4.5% 9.1% 0.0% 0.0% 0.0% 18.2% % 10.0% 20.0% 2.5% 7.5% 5.0% 2.5% 0.0% 0.0% 45.0% % 0.0% 4.3% 6.4% 4.3% 2.1% 0.0% 0.0% 4.3% 59.6% % 10.0% 0.0% 0.0% 10.0% 10.0% 0.0% 0.0% 0.0% 50.0% % 7.5% 10.4% 11.3% 5.7% 1.9% 2.8% 0.0% 1.9% 41.5% % 0.0% 0.0% 0.0% 10.0% 10.0% 10.0% 20.0% 10.0% 40.0% % 0.0% 0.0% 0.0% 0.0% 0.0% 14.3% 0.0% 28.6% 57.1% % 0.0% 0.0% 0.0% 0.0% 0.0% 20.0% 5.0% 5.0% 65.0% % 0.0% 0.0% 0.0% 0.0% 10.5% 21.1% 15.8% 21.1% 31.6% % 0.0% 0.0% 22.2% 0.0% 0.0% 11.1% 11.1% 0.0% 33.3% % 0.0% 0.0% 0.0% 0.0% 14.3% 14.3% 14.3% 14.3% 42.9% % 7.1% 0.0% 7.1% 7.1% 0.0% 28.6% 14.3% 0.0% 21.4% % 0.0% 0.0% 0.0% 0.0% 14.3% 14.3% 14.3% 28.6% 28.6% % 0.0% 0.0% 0.0% 0.0% 0.0% 0.0% 16.7% 16.7% 66.7% % 0.0% 0.0% 0.0% 4.5% 4.5% 18.2% 9.1% 9.1% 45.5% % 0.0% 7.7% 7.7% 0.0% 0.0% 0.0% 7.7% 0.0% 69.2% % 0.0% 7.1% 0.0% 21.4% 21.4% 7.1% 7.1% 14.3% 21.4% % 0.0% 0.0% 16.7% 0.0% 33.3% 16.7% 16.7% 0.0% 16.7% % 0.0% 0.0% 14.3% 42.9% 0.0% 0.0% 0.0% 0.0% 14.3% % 0.0% 33.3% 0.0% 11.1% 11.1% 11.1% 0.0% 0.0% 33.3% Rail 11.4% 5.1% 5.5% 7.3% 7.2% 6.0% 6.8% 3.1% 4.1% 43.5% 69
71 Data cross-tabulation: Payment Type vs. Income (Bus) A review of payment type by income reveals 60 percent or more of respondents earning less than $75,000 chose day or monthly pass as the preferred methods of payment. Respondents earning greater than $75,000 preferred cash payment. Income Token Cash (one ride) Day Pass Weekly Pass Exhibit 3.23.f Payment type vs. income - bus Monthly Pass 30-Day Pass Student Pass CRAM Pass Less than $5, % 19.8% 26.0% 1.8% 36.0% 2.8% 4.1% 5.8% $5,000 - $9, % 21.2% 26.9% 1.5% 32.6% 1.8% 5.4% 8.5% $10,000 - $14, % 21.8% 27.2% 1.5% 35.5% 4.3% 3.9% 4.4% $15,000 - $24, % 19.8% 32.2% 2.1% 34.8% 2.3% 3.3% 4.6% $25,000 - $34, % 25.5% 27.3% 2.9% 32.1% 2.3% 3.9% 4.5% $35,000 - $49, % 25.5% 29.1% 2.2% 30.3% 3.9% 2.0% 5.3% $50,000 - $74, % 24.2% 29.2% 1.1% 33.0% 1.9% 1.9% 6.8% $75,000 - $99, % 31.4% 22.9% 1.9% 28.6% 2.9% 4.8% 6.7% $100,000 or more 6.3% 36.5% 11.1% 1.6% 34.9% 4.8% 0.0% 4.8% Payment Type vs. Income (Rail) A review of payment type by income reveals monthly pass as the preferred methods of payment among all income levels. Day pass and cash were the next two preferred methods of payment for rail. Income Token Cash (one ride) Day Pass Weekly Pass Monthly Pass Exhibit 3.23.g Payment type vs. income - rail 30-Day Pass Round Trip Rail Ticket Student Pass Free Fare Zone NFTA Employee Pass Less than $5, % 17.1% 15.5% 1.1% 36.4% 4.8% 2.1% 6.4% 8.0% 2.7% $5,000 - $9, % 15.7% 16.9% 1.2% 48.2% 2.4% 2.4% 2.4% 6.0% 2.4% $10,000 - $14, % 8.8% 34.1% 1.1% 35.2% 7.7% 3.3% 2.2% 3.3% 2.2% $15,000 - $24, % 17.4% 26.4% 2.5% 33.1% 4.1% 5.0% 2.5% 5.8% 2.5% $25,000 - $34, % 17.6% 25.2% 4.2% 29.4% 0.8% 5.9% 3.4% 5.9% 7.6% $35,000 - $49, % 20.0% 23.0% 1.0% 28.0% 3.0% 9.0% 5.0% 4.0% 5.0% $50,000 - $74, % 18.9% 15.3% 0.9% 36.9% 5.4% 6.3% 7.2% 0.9% 8.1% $75,000 - $99, % 15.4% 9.6% 0.0% 25.0% 9.6% 11.5% 3.8% 7.7% 13.5% $100,000 or more 2.9% 21.7% 10.1% 0.0% 34.8% 0.0% 13.0% 2.9% 2.9% 11.6% Data cross-tabulation: Income vs. Trip Purpose A data cross-tabulation was run to between household income and trip purpose (based on type of origin and destination combined) to determine what impact income had on respondents trip purposes. Apart from traveling to or from home, work was the most frequent trip purpose across all income categories. However, respondents in higher income categories ($15,000 and higher) were more likely to be using Metro to travel to work. Lower-income bus riders were more likely to use the bus to access shopping than higher-income bus riders or rail riders. Rail riders across all income categories were more likely to use the train to access recreation/personal business. 70
72 100% 90% 80% 70% 60% 50% Exhibit 3.23.h Cross-tabulation income vs. trip purpose (bus) 6.1% 4.2% 4.6% 3.2% 3.1% 2.7% 3.0% 1.9% 2.4% 7.3% 7.5% 6.4% 5.3% 6.7% 7.0% 6.7% 5.5% 7.8% 3.3% 1.0% 1.6% 4.7% 5.0% 2.9% 4.3% 6.4% 4.2% 3.9% 8.2% 8.2% 7.0% 7.7% 7.3% 3.8% 3.7% 3.8% 5.5% 7.8% 8.0% 6.5% 3.4% 3.4% 3.7% 4.6% 6.4% 29.4% 31.2% 36.7% 30.7% 27.4% 28.4% 15.3% 17.6% 23.1% 40% 30% 20% 49.3% 47.2% 46.1% 46.1% 47.9% 45.7% 46.8% 44.8% 48.0% 10% 0% Less than $5,000 $5,000 - $9,999 $10,000 - $14,999 $15,000 - $24,999 $25,000 - $34,999 $35,000 - $49,999 $50,000 - $74,999 $75,000 - $99,999 $100,000 or more Home Work or work - related University/college High school Shopping Medical services Recreation/personal business Other 71
73 Exhibit 3.23.i Cross-tabulation income vs. trip purpose (rail) 100% 90% 80% 70% 60% 5.9% 8.6% 9.1% 2.9% 5.4% 18.2% 10.0% 7.7% 10.6% 12.1% 11.2% 8.2% 2.4% 4.4% 3.3% 4.7% 4.9% 2.9% 2.5% 2.5% 1.8% 1.9% 3.6% 9.6% 8.8% 5.5% 11.6% 10.7% 4.5% 3.3% 4.6% 2.5% 1.0% 15.9% 3.1% 5.0% 2.9% 4.0% 1.8% 4.9% 5.8% 6.3% 6.2% 3.9% 2.2% 36.8% 26.7% 29.4% 34.0% 34.2% 37.0% 50% 20.6% 20.3% 40% 30% 20% 46.9% 38.8% 39.0% 45.4% 44.1% 43.3% 40.4% 42.7% 39.9% 10% 0% Less than $5,000 $5,000 - $9,999 $10,000 - $14,999 $15,000 - $24,999 $25,000 - $34,999 $35,000 - $49,999 $50,000 - $74,999 $75,000 - $99,999 $100,000 or more Home Work or work - related University/college High school Shopping Medical services Recreation/personal business Other 72
74 Data cross-tabulation: Income vs. Working Vehicle A data cross-tabulation was run to assess the availability of working vehicles in the household based on reported annual income. Not surprisingly, access to a working vehicle can be correlated with annual household income. Among respondents who cited an annual income of less than $5,000, nearly 92 percent indicated having zero or one working vehicle available in their household. Similar distributions were noted among respondetns making up to $24,999 annually. Availability of two or more working vehicles increased significantly with each subsequent income category. Among respondents in the highest income category, just 27.3 percent cited having zero or one vehicle, while 72.8 percent have two or more vehicles. This group also had the highest incidence of four or more vehicles (5.3 percent) in the household. 100% 90% 80% 70% 60% Exhibit 3.23.j Cross-tabulation income vs. working vehicle 1.2% 0.3% 0.4% 0.4% 1.7% 1.8% 1.3% 1.0% 1.8% 0.4% 1.3% 1.3% 5.2% 5.3% 5.3% 4.1% 1.5% 3.0% 4.3% 5.3% 6.8% 10.3% 12.2% 17.0% 20.4% 18.2% 25.8% 23.1% 22.0% 32.8% 31.6% 43.0% 50% 45.5% 45.5% 40% 30% 74.8% 72.2% 74.7% 68.6% 57.1% 40.0% 20% 10% 0% Less than $5,000 $5,000 - $9,999 $10,000 - $14,999 $15,000 - $24,999 $25,000 - $34, % $35,000 - $49, % $50,000 - $74, % $75,000 - $99, % 7.6% $100,000 or more None or more 73
75 SECTION 4: TELL US ABOUT YOUR NFTA-METRO EXPERIENCE Question 24: How do you prefer to receive information about NFTA-Metro? (check all that apply) The most popular information source was the NFTA-Metro website (38.6 percent), followed by printed schedules (23.0 percent). Another 20.8 percent receive information as part of their transit trip, either at the bus stop or onboard the bus. Exhibit 3.24.a Means of obtaining transit information - system 0% 5% 10% 15% 20% 25% 30% 35% 40% 45% Online (metro.nfta.com) 38.6% Printed schedules 23.0% Calling NFTA customer service 9.7% Printed advertisements 4.8% At the bus stop 11.8% Facebook/Twitter Text/ updates Google/Google Transit Radio TV Onboard the bus Word of mouth Other 4.8% 8.5% 9.8% 3.2% 4.9% 9.0% 4.0% 1.6% n = 9,697 74
76 Exhibit 3.24.b Means of obtaining transit information - comparison Local Express Rail System Online (metro.nfta.com) 38.1% 57.3% 39.0% 38.6% Printed schedules 23.8% 30.4% 18.8% 23.0% Calling NFTA customer service Printed advertisements 10.0% 12.9% 8.0% 9.7% 4.8% 5.8% 4.7% 4.8% At the bus stop 12.0% 14.6% 11.1% 11.8% Facebook/Twitter 4.8% 4.7% 5.1% 4.8% Text/ updates Google/Google Transit 8.5% 18.1% 7.4% 8.5% 10.4% 6.4% 7.2% 9.8% Radio 3.1% 5.8% 3.5% 3.2% TV 4.7% 8.8% 5.6% 4.9% Onboard the bus 8.8% 17.5% 9.4% 9.0% Word-of-mouth 3.8% 4.7% 4.9% 4.0% Other 1.6% 1.2% 1.7% 1.6% 75
77 Question 25: Overall, how satisfied are you with NFTA-Metro services? Approximately 90 percent of respondents indicated satisfaction with NFTA-Metro services. Response levels were similar across all modes. 60.0% 50.0% 40.0% 51.5% 38.3% Exhibit 3.25.a Overall satisfaction - system n= 7, % 20.0% 10.0% 7.5% 2.7% 0.0% Very satisfied Somewhat satisfied Somewhat dissatisfied Very dissatisfied Exhibit 3.25.b Overall satisfaction - comparison Local Express Rail System Very satisfied 51.5% 55.8% 50.8% 51.5% Somewhat satisfied 38.2% 38.5% 39.1% 38.3% Somewhat dissatisfied 7.5% 4.5% 7.9% 7.5% Very dissatisfied 2.8% 1.3% 2.3% 2.7% Data cross-tabulation: overall satisfaction vs. ridership frequency A data cross-tabulation enables a comparison of satisfaction levels among respondents of varying ridership frequency. Although satisfaction levels are similar for each ridership frequency level, respondents who ride most often were least likely to indicate being very satisfied. Exhibit 3.25.c Overall satisfaction vs. ridership frequency Very satisfied Somewhat Somewhat Very satisfied dissatisfied dissatisfied 6-7 days/week 49.3% 38.3% 9.4% 2.9% 3-5 days/week 51.5% 40.3% 6.0% 2.1% 1-2 days/week 56.0% 36.4% 5.2% 2.4% 1-3 days/month 58.6% 31.9% 5.8% 3.6% Less than once/month 60.7% 31.8% 4.7% 2.8% 76
78 SECTION 1: ORIGIN & DESTINATION Chapter 4 Spatial Analysis The following is an assessment of the geographic distribution of origin and destination (O&D) activity occurring onboard both bus and rail service. Mapping survey responses provides NFTA and GBNRTC decision-makers with relevant information to support service changes and/or route development. To help identify origin and destination locations of the surveyed trip, respondents were asked to provide a location name, street address, and/or cross streets of both origin and destination locations. O&D activity is displayed using Traffic Analysis Zones (TAZ). A TAZ is a unit of geography which in this case represents subsets of the service area. There are 1,636 TAZs in the service area. In this chapter, we have incorporated survey data and Census data to provide pertinent information regarding residential and travel patterns. Each TAZ within a map is color-coded to represent the number of origins or destinations that occurred within that geographic boundary. BUS ORIGIN Exhibit presents where respondents riding the bus began their surveyed trip. As expected, the greatest concentration of trip origins took place within five miles of Buffalo. More than 50 percent (53 percent) of the 1,636 TAZs contained at least one originating trip. Of those TAZs, 16.4 percent contained 10 or more originating trips. TAZs with more than 50 origin locations: TAZ 81 - Erie Community College, TAZ SUNY Buffalo State, TAZ Erie Medical Center, and TAZ University of Buffalo. BUS DESTINATION Exhibit presents where respondents riding the bus completed their surveyed trip. Similar to origin trips, the greatest concentration of trip destinations occurred within five miles of Buffalo. Slightly less than half (49 percent) of the 1,636 TAZs contained at least one destination trip. However, only 14 percent of those TAZs contained 10 or more destination trips. TAZs with more than 50 destination locations: TAZ 10 - Rath Building, TAZ 25 - Cathedral Park, TAZ 81 - Erie Community College, 77
79 TAZ SUNY Buffalo State, TAZ Erie Medical Center, TAZ University of Buffalo, and TAZ Walden Galleria Mall. 78

80 Exhibit Origin locations - bus 79

81 Exhibit Destination locations bus 80
82 RAIL ORIGIN Exhibit presents where respondents riding Metro Rail began their surveyed trip. As expected, the greatest concentration of trip origins took place along the Metro Rail line. Many of the trips are clustered around the University of Buffalo. Trip origins were concentrated in 383 of the 1,636 TAZs in the service area (23.4 percent of TAZs). Of those TAZs, 14.4 percent contained five or more originating trips. TAZ s with more than 20 origin locations: TAZ Canisius College, TAZ University of Buffalo, and TAZ University of Buffalo North Campus. RAIL DESTINATION Exhibit presents where respondents riding Metro Rail concluded their surveyed trip. Similar to rail origins, the greatest concentration of trip destinations occurred along the Metro Rail line. The majority of trip destinations are clustered around the University of Buffalo and in the central business district (CBD). Trip destinations were concentrated in 313 of the 1,636 TAZs in the service area (19.1 percent of TAZs). Of those TAZs, 15.1 percent contained five or more destination trips. TAZ s with more than 20 destination locations: TAZ 2 Main Place Mall, TAZ 10 - Rath Building, TAZ 24 Government facilities, TAZ 25 - Cathedral Park, TAZ 81 - Erie Community College, TAZ 280 Larkin Center of Commerce, TAZ University of Buffalo, and TAZ 645 Adjacent to Boulevard Mall. 81

83 Exhibit Origin locations rail 82
84 Exhibit Destination locations rail 83
85 SECTION 2: DEMOGRAPHIC ASSESSMENT The following is an assessment of the geographic distribution of the minority and low-income populations within the NFTA service area. This allowed us to identify locations within both Erie and Niagara counties still in need of NFTA services. This analysis is intended to provide decision-makers with relevant information when determining service changes or route development. Data was gathered from the American Community Survey. MINORITY POPULATIONS The minority populations include all races and ethnicities other than white non-hispanic/latino. NFTA Service Area Exhibit presents the distribution of minority populations across the NFTA service area. Outside of Buffalo and Niagara Falls, the greatest concentrations of minorities exist near Versailles, Lockport, Crittenden, Tuscarora Nation Reservation, and near the Tonawanda Reservation. Two of these locations have access to an NFTA transit route, while the Tonawanda Reservation, Versailles, and Crittenden do not. Buffalo Exhibit presents the distribution of minority populations within Buffalo. The greatest concentrations of minority populations exist northeast of the central business district. This cluster extends as north as the University of Buffalo. As with other older industrial cities, minority populations decrease farther away from the city center. Access to public transit is prevalent throughout the city s clusters of minority populations. Niagara Falls Exhibit presents the distribution of minority populations within Niagara Falls. Similar to Buffalo, the greatest concentration exists toward the center of the city. As discussed above, the Tonawanda Reservation does not have direct access to an NFTA transit route. 84

86 Exhibit Concentration of minority population NFTA service area 85

87 Exhibit Concentration of minority population City of Buffalo 86

88 Exhibit Concentration of minority population Niagara Falls 87
89 LOW-INCOME POPULATIONS Low-income are those persons living below the federal poverty line ($11,670 CY 2014). NFTA Service Area Exhibit presents the concentration of low-income individuals across the NFTA service area. Outside of Buffalo and Niagara Falls, the greatest concentration of low-income individuals exists near Cheektowaga, North Tonawanda, Lockport, and Versailles. With the exception of Versailles, all of these locations have access to an NFTA transit route. Buffalo Exhibit presents the distribution of low-income individuals within Buffalo. The greatest concentrations exist north of the central business district along the Niagara River, and between Fillmore Avenue and Bailey Avenue. The University of Buffalo North Campus also has a high concentration of low-income individuals. However, this can be explained by a large student population who earn very little income on average while attending school. All of these areas have access to an NFTA transit route. Niagara Falls Exhibit presents the distribution of low-income individuals within Niagara Falls. Similar to Buffalo, the greatest concentration exists toward the center of the city. Clusters of low-income individuals exist near Hyde Park, along Highland Avenue, Walnut Avenue, and Main Street. Portions of the Tonawanda Reservation are below the federal poverty line and do not have direct access to an NFTA transit route. 88

90 Exhibit Concentration of low-income population NFTA service area 89

91 Exhibit Concentration of low-income population City of Buffalo 90

92 Exhibit Concentration of low-income population Niagara Falls 91
93 This page intentionally blank. 92
94 Appendix A Survey Instruments - Bus Contained herein are the survey instruments used in the 2017 Onboard Bus Survey. Included is the English survey as well as the Spanish, Arabic, Burmese, and Karen versions of the survey. A-1
95 This page intentionally blank. A-2

96 Bus survey English instrument, page 1 A-3
97 Bus survey English instrument, page 2 A-4

98 Bus survey Spanish instrument, page 1 A-5

99 Bus survey Spanish instrument, page 2 A-6
100 Bus survey Arabic instrument, page 1 A-7
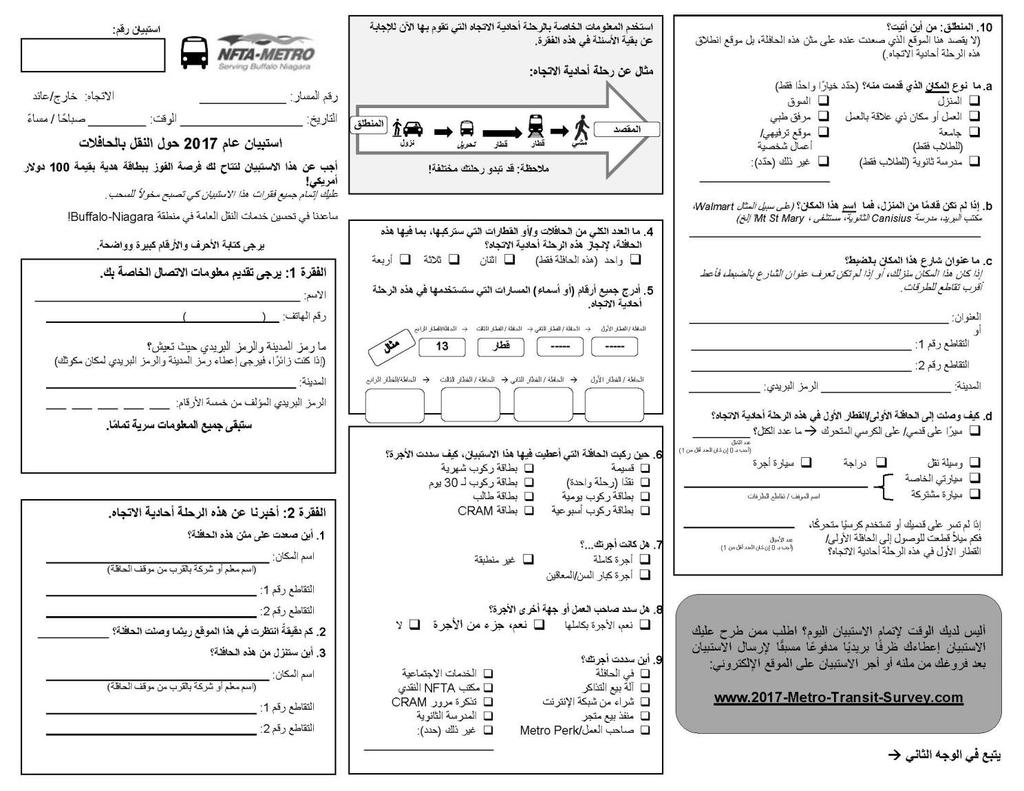
101 A-8
102 Bus survey Arabic instrument, page 2 A-9
103 A-10

104 Bus survey Burmese instrument, page 1 A-11

105 Bus survey Burmese instrument, page 2 A-12

106 Bus survey Karen instrument, page 1 A-13
107 Bus survey Karen instrument, page 2 A-14
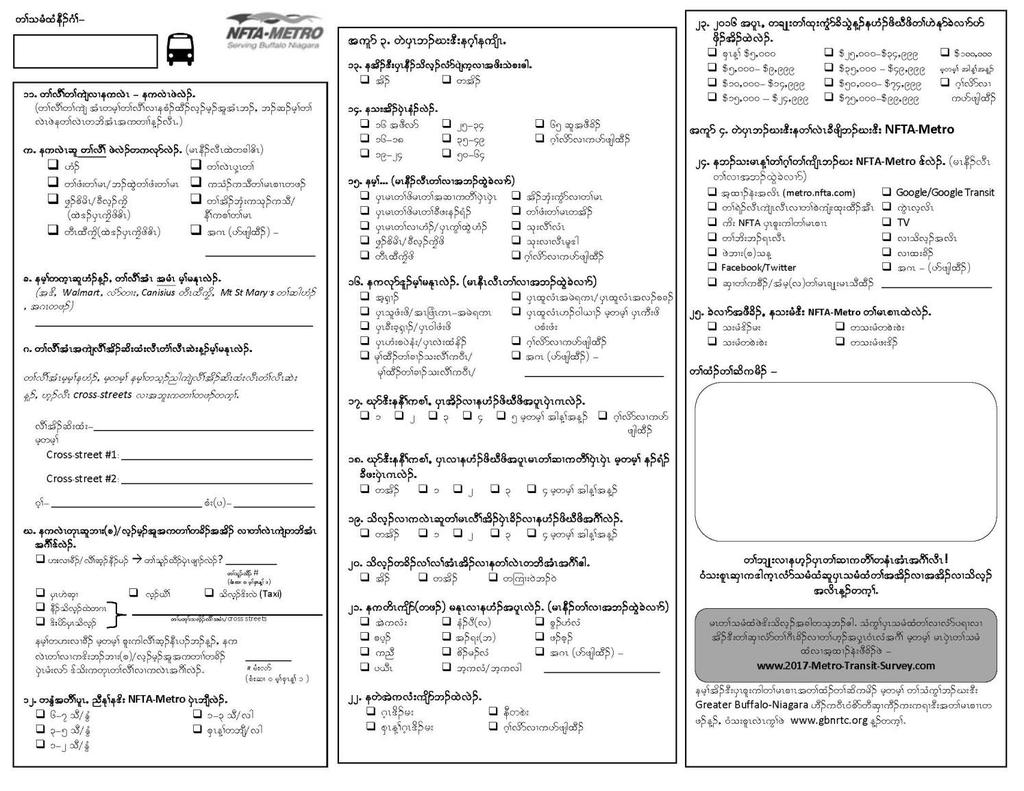
108 A-2
109 Appendix B Survey Instruments - Rail Contained herein are the survey instruments used in the 2017 Onboard Rail Survey. Included is the English survey as well as the Spanish, Arabic, Burmese, and Karen versions of the survey. B-1
110 This page intentionally blank. B-2
111 Rail survey English instrument, page 1 B-3

112 Rail survey English instrument, page 2 B-4

113 B-5

114 Rail survey Spanish instrument, page 1 B-6
115 B-7 Rail survey Spanish instrument, page 2

116 Rail survey Arabic instrument, page 1 B-8
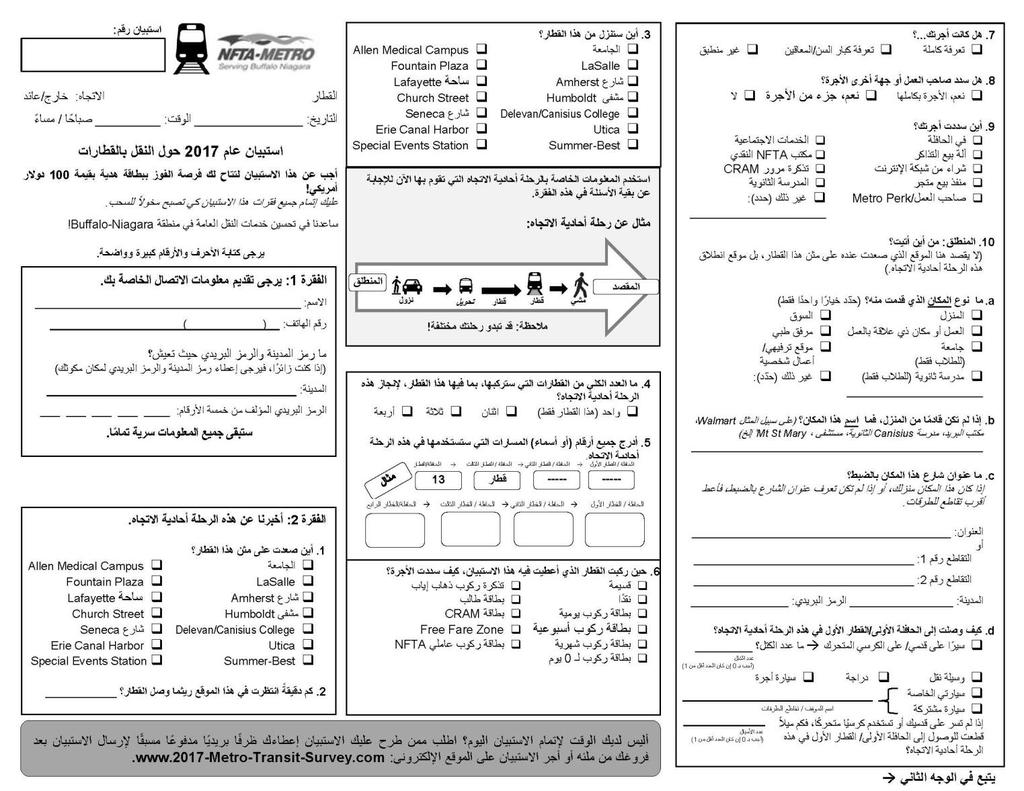
117 B-9
118 Rail survey Arabic instrument, page 2 B-10
119 Rail survey Burmese instrument, page 1 B-11

120 Rail survey Burmese instrument, page 2 B-12

121 Rail survey Karen instrument, page 1 B-13
122 Rail survey Karen instrument, page 2 B-14
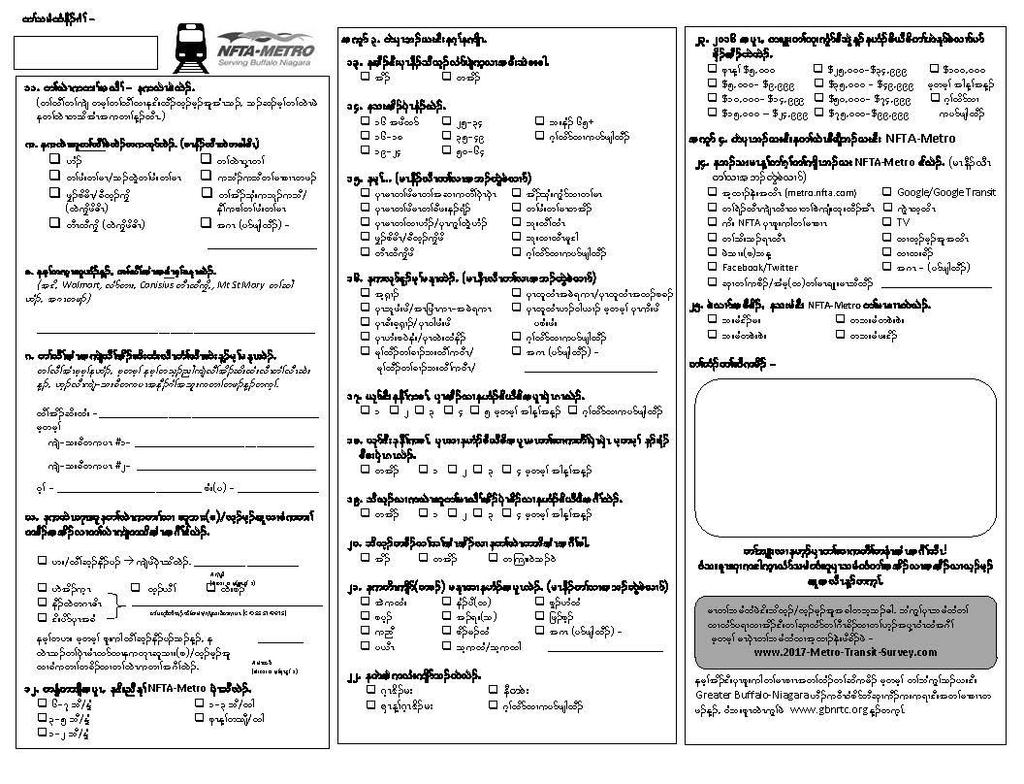
123 B-2
124 Appendix C Simple Frequencies - Bus Route Number Frequency Percent Valid Percent Valid C-1
125 Did not specify Total 7, Direction of travel Frequency Percent Valid Percent Cumulative Percent Valid Inbound 3, Outbound 4, Total 7, Date of survey Frequency Percent Valid Percent Valid 3/23/ /24/ /27/ /28/ /29/ /30/ /31/ /3/ /4/ /5/ /6/ /7/ /10/ /11/ /12/ Total 7, C-2
126 Day-part Valid Frequency Valid Percent AM Peak % Midday % Off Peak % PM Peak % Total 7, City of residence Frequency Percent Valid Percent Cumulative Percent Valid Alden Amherst Angelica Angola Auburn Blasdell Boston Bowmansville Brockport Bronx Brookline Brooklyn Brownsville Buffalo 6, Chautauqua Cheektowaga Clarence Clarence Center Cleveland Colden Corfu Deniston Denver Depew Derby Dundas Dunkirk East Amherst East Aurora Elma Erie Foshan (China) C-3
127 Fredonia city Gasport Getzville Glendale Heights Gowanda Grand island Grand Island Hamburg Harbor High Point Jamaica Jamestown Kaisetown Kansas City Kenmore Lackawanna Lake View Lancaster Larchmont Lewiston Lockport Los Angeles Marion Mason Medina Middleport Mumford Nashua New York Newfane Niagara Falls North Collins North Tonawanda Orchard park Orchard Park Pike Ransomville Ridgeway Riverside Rochester Silver Spring Sloan Snyder South Buffalo South Wales C-4
128 Syracuse Tonawanda Toronto Towson Tucson Village Hamburg Warren West New York West Seneca Wheatfield White Plains Williamsville Total 7, Valid Q2. How many minutes did you wait at this location for the bus to arrive? Frequency Valid Percent No wait % 5 minutes or less % 10 minutes or less % 20 minutes or less % 30 minutes or less % More than 30 minutes % Did not specify % Total 7, Q4. How many total buses and/or trains will you ride to make this one-way trip? Frequency Percent Valid Percent Cumulative Percent Valid One (this bus only) 4, Two 2, Three Four Total 7, List all the route numbers you will use on this one-way trip: 1st bus/rail Cumulative Frequency Percent Valid Percent Percent Valid C-5
129 C-6
130 Rail Total 7, List all the route numbers you will use on this one-way trip: 2nd bus/rail Cumulative Frequency Percent Valid Percent Percent Valid 4, C-7
131 Rail Total 7, List all the route numbers you will use on this one-way trip: 3rd bus/rail Frequency Percent Valid Percent Cumulative Percent Valid 7, C
132 Rail Total 7, List all the route numbers you will use on this one-way trip: 4th bus/rail Cumulative Frequency Percent Valid Percent Percent Valid 7, C
133 C
134 Rail Total 7, Q6. When you got on the bus where you were given this survey, how did you pay? Cumulative Frequency Percent Valid Percent Percent Valid Token Cash (one ride) 1, Day Pass 2, Weekly Pass Monthly Pass 2, Day Pass Student Pass CRAM Pass Total 7, Missing System Total 7, Q7. Was your fare...? Frequency Percent Valid Percent Cumulative Percent Valid Full fare 5, Senior/Disabled Not applicable Total 7, Missing System Total 7, Q8. Did your employer or another organization pay for your fare? Frequency Percent Valid Percent Cumulative Percent Valid Yes, entire fare 1, Yes, some of fare No 6, Total 7, Missing System Total 7, C-11
135 Q9. Where did you purchase your fare? Frequency Percent Valid Percent Cumulative Percent Valid On the bus 3, Ticket vending machine Online purchase Store outlet 1, Employer/Metro Perk Social services NFTA cash office CRAM Pass High school Other (specify) Total 7, Missing System Total 7, Q9. Where did you purchase your fare? - Other (specify) Frequency Percent Valid Percent Cumulative Percent Valid 7, Did not specify N/A School Total 7, C-12
136 Q10d. How did you get to the bus/train on this one-way trip? Frequency Percent Valid Percent Cumulative Percent Valid Walked/wheelchair 6, Dropped off Drove alone Carpooled Bicycle Taxi Total 7, Missing System Total 7, Q10d. If you selected "Walked/wheelchair," how many blocks? Valid Frequency Valid Percent Less than 1 block % 1 block % 2 blocks % 3 blocks % 4 blocks % 5 or more blocks % 10 or more blocks % Did not specify % Total 6, Q10d. If you selected "Drove alone/carpooled," indicate the Parking lot name/cross streets. Frequency Percent Valid Percent Cumulative Percent Valid 7, Crosspoint Parkway AppleTree Athol Springs Park N Ride Broad St/Delaware St Buffalo Transportation Ce Crosspoint Park N Ride Delton Plaza Eastern Hills Mall ECMC Elmwood Ave/North St Emslie St /Swan St Genesee St/Union Rd Grand Island Plaza Humbolt Station Laffayette Ave/ Main St Locust St/Walnut St Main St/Market St C-13
137 Park Rite Rite Aid Scranton Camp South Gate Plaza South Park Subdelicious Lot Tops Plaza University Rail Station Total 7, Q10d. If did not walk or use a wheelchair," how many miles did you travel to get to the first bus/train on this one-way trip? Valid Frequency Valid Percent Less than 1 mile % 1 mile % 2 miles % 3 miles % 4 miles % 5 or more miles % 10 or more miles % Did not specify % Total Q11d. How will you get to your destination from the last bus/train on this one-way trip? Frequency Percent Valid Percent Cumulative Percent Valid Walk/wheelchair 6, Get picked up Drive alone Carpool Bicycle Taxi Total 6, Missing System 1, Total 7, C-14
138 Q11d. If you selected "Walk/wheelchair," how many blocks? Valid Frequency Valid Percent Less than 1 block % 1 block % 2 blocks % 3 blocks % 4 blocks % 5 or more blocks % 10 or more blocks % Did not specify % Total 6, Q11d. If you selected "Drive alone/carpool," indicate the Parking lot name/cross streets. Cumulative Frequency Percent Valid Percent Percent Valid 7, Main Street Casino Grant St/W Ferry St Mohawk Parking Ramp Niagara St/Ontario St University Station Total 7, Q11d. If will not walk or use a wheelchair," how many miles will you travel to get from the last bus/train to your destination? Valid Frequency Percent Valid Less than 1 mile % 1 mile % 2 miles % 3 miles 8 1.5% 4 miles 6 1.1% 5 or more miles 9 1.7% 10 or more miles 6 1.1% Did not specify % Total C-15
139 Q12. In a typical week, how often do you ride NFTA-Metro? Frequency Percent Valid Percent Cumulative Percent Valid 6-7 days/week 3, days/week 3, days/week days/month Less than once/month Total 7, Missing System Total 7, Q13. Do you have a valid driver's license? Frequency Percent Valid Percent Cumulative Percent Valid Yes 2, No 3, Total 6, Missing System 1, Total 7, Q14. What is your age? Frequency Percent Valid Percent Cumulative Percent Valid Under , , , , years of age Decline to state 1, Total 7, Missing System Total 7, C-16
140 Q15. What is your employment status? Valid Frequency Percent Valid Full-time worker 2, % Part-time worker 1, % Homemaker % University/college student % High school student % Retired % Unemployed % Veteran % Active military 8 0.1% Decline to state 1, % Total 7, Q16. What is your ethnicity? Valid Frequency Percent Valid Asian % Black/ African-American 2, % Caucasian/White 2, % Hispanic/Latino % Middle Eastern/ North African % Native American/Alaska Native % Native Hawaiian or Pacific Islander % Decline to State 1, % Other (specify) % Total 7, C-17
141 Q16. What is your ethnicity? - Other (specify): Frequency Percent Valid Percent Cumulative Percent Valid 7, Did not specify Dominican French Irish Israelite Italian Jamacian Jewish Lebanese Mexican Indian Multiracial Polish Sephardic Jew Sicilian South African Total 7, C-18
142 Q17. Including yourself, how many people live in your household? Frequency Percent Valid Percent Cumulative Percent Valid 1 1, , , or more Decline to state 1, Total 7, Missing System Total 7, Q18. Including yourself, how many of the people in your household are employed full-time or part-time? Frequency Percent Valid Percent Cumulative Percent Valid None 1, , , or more Total 6, Missing System 1, Total 7, Q19. How many working vehicles are available to your household? Frequency Percent Valid Percent Cumulative Percent Valid None 3, , or more Total 6, Missing System 1, Total 7, Q20. Were any of those vehicles available to make this one-way trip? Frequency Percent Valid Percent Cumulative Percent Valid Yes No 3, Not applicable 2, Total 6, Missing System 1, Total 7, C-19
143 Q21. What language(s) are spoken in your home? Valid Frequency Percent Valid English 6, % Spanish % Karen % Burmese % Nepali % Arabic % Somali % Bengali/Bangla % Swahili % French % Other (specify) % Total 7, Q21. What language(s) are spoken in your home? Other (specify): Cumulative Frequency Percent Valid Percent Percent Valid 7, AJC American Sign Language Amharic Bulgarian Cayuga Chinese Creole Did not specify Dutch/Papaioannou Farsi German Hebrew Hindi Italian Jamacian Japanese Karenni Kibembe Kizigua Korean Laos Lingala Mandingo C-20
144 Native American Pamunkey Polish Portuguese Punjabi Russian Serbian Tagalog Tamil Telugu Various Total 7, Q22. How well do you speak English? Frequency Percent Valid Percent Cumulative Percent Valid Very well 6, Less than very well Not at all Decline to state 1, Total 7, Missing System Total 7, Q23. What was your total household income in 2016 before taxes? Frequency Percent Valid Percent Cumulative Percent Valid Less than $5,000 1, $5,000 - $9, $10,000 - $14, $15,000 - $24, $25,000 - $34, $35,000 - $49, $50,000 - $74, $75,000 - $99, $100,000 or more Decline to state 3, Total 7, Missing System Total 7, C-21
145 Q24. How do you prefer to receive information about NFTA-Metro? Valid Frequency Percent Valid Online (metro.nfta.com) 3, % Printed schedules 1, % Calling NFTA customer service % Printed advertisements % At the bus stop % Facebook/Twitter % Text/ updates % Google/Google Transit % Radio % TV % Onboard the bus % Word of mouth % Other (specify) % Total 7, Q24. How do you prefer to receive information about NFTA-Metro? Other (specify): Frequency Percent Valid Percent Cumulative Percent Valid 7, Bill board Bus driver Did not specify Mail Mobile app Phone Total 7, Q25. Overall, how satisfied are you with NFTA-Metro services? Frequency Percent Valid Percent Cumulative Percent Valid Very satisfied 3, Somewhat satisfied 2, Somewhat dissatisfied Very dissatisfied Total 6, Missing System 1, Total 7, C-22
146 Appendix D Simple Frequencies Rail Direction of travel Frequency Percent Valid Percent Cumulative Percent Valid Inbound Outbound Total 1, Total 1, Valid Date of survey Frequency Percent Valid Percent Cumulative Percent 3/23/ /24/ /27/ /28/ /29/ /30/ /31/ /11/ /12/ /23/ /3/ /4/ /5/ /7/ Total 1, Valid Day-part Frequency Valid Percent AM Peak % Midday % Off Peak % PM Peak % Total 1, D-1
147 City of residence Frequency Percent Valid Percent Cumulative Percent Valid Amherst Angola Argenthia Barker Blasdell Bronx Brooklyn Buffalo 1, Burgess Hill Casper Cheektowaga Clarence Collins Corfu Depew Derby Dunkirk East Amherst East Aurora East Buffalo Eden Eggertsville Elma Elmwood Erie Fredonia Gasport Getzville Grand Island Hamburg Kenmore Lackawanna Lakeview Lancaster Lewiston Lockport Lyndonville New York Newfane Niagara Falls North Tonawanda D-2
148 Old Westbury Orchard Park Pendleton Penn Yan Ransomville Rochester San Dimas Sanborn Sloan Snyder Springfield Tonawanda Warrensburg West Seneca Wheatfield Williamsville Total 1, Q1. Where did you get on this train? Frequency Percent Valid Percent Cumulative Percent Valid University LaSalle Amherst Street Humboldt Hospital Delevan/Canisius College Utica Summer-Best Allen Medical Campus Fountain Plaza Lafayette Square Church Street Seneca Street Erie Canal Harbor Special Events Station Total 1, Missing System Total 1, D-3
149 Q2. How many minutes did you wait at this location for the train to arrive? Valid Frequency Valid Percent No wait % Less than 5 minutes % Less than 10 minutes % Less than 15 minutes % 15 minutes or more % Did not specify % Total 1, Q3. Where will you get off this train? Frequency Percent Valid Percent Cumulative Percent Valid University LaSalle Amherst Street Humboldt Hospital Delevan/ Canisius College Utica Summer-Best Allen Medical Campus Fountain Plaza Lafayette square Church street Seneca Street Erie Canal Harbor Special Events Station Total 1, Missing System Total 1, Q4. How many total buses and/or trains will you ride to make this one-way trip? Frequency Percent Valid Percent Cumulative Percent Valid One (this bus only) Two Three Four Total 1, Total 1, D-4
150 Valid List all the route numbers you will use on this one-way trip: 1st bus/rail Valid Frequency Percent Percent Cumulative Percent Rail Total 1, D-5
151 List all the route numbers you will use on this one-way trip: 2nd bus/rail Valid Frequency Percent Percent Cumulative Percent Valid Rail Total 1, List all the route numbers you will use on this one-way trip: 3rd bus/rail Valid Frequency Percent Percent Cumulative Percent Valid 1, D-6
152 Rail Total 1, List all the route numbers you will use on this one-way trip: 4th bus/rail Valid Frequency Percent Percent Cumulative Percent Valid 1, D-7
153 Rail Total 1, Q6. When you got on the bus where you were given this survey, how did you pay? Valid Frequency Percent Percent Cumulative Percent Valid Token Cash (one ride) Day Pass Weekly Pass Monthly Pass Day Pass Round Trip Rail Ticket Student Pass Free Fare Zone NFTA Employee Pass Total 1, Missing System Total 1, Q7. Was your fare...? Frequency Percent Valid Percent Cumulative Percent Valid Full fare 1, Senior/Disabled Not applicable Total 1, Missing System Total 1, D-8
154 Q8. Did your employer or another organization pay for your fare? Valid Frequency Percent Percent Cumulative Percent Valid Yes, entire fare Yes, some of fare No 1, Total 1, Missing System Total 1, D-9
155 Q9. Where did you purchase your fare? Frequency Percent Valid Percent Cumulative Percent Valid On the bus Ticket vending machine Online purchase Store outlet Employer/Metro Perk Social services NFTA cash office CRAM Pass High school Other (specify) Total 1, Missing System Total 1, Q9. Where did you purchase your fare? - Other (specify) Valid Frequency Percent Percent Cumulative Percent Valid 1, Did not specify N/A Free Fare Zone School Total 1, Q10a. What kind of places are you coming from? Frequency Percent Valid Percent Cumulative Percent Valid Home Work or work - related University/college High school Shopping Medical services Recreation/personal business Other (specify) Total 1, Missing System Total 1, D-10
156 Q10a. What kind of places are you coming from? - Other (specify) Valid Frequency Percent Percent Cumulative Percent Valid 1, Daycare Doctor Downtown Downtown Bart Downtown Clinic Education Hair Salon Hotel Niagra falls Parking Lot Rental Car Restaurant Social services Visiting friends/family WIA Total 1, Q10d. How did you get to the bus/train on this one-way trip? Valid Frequency Percent Percent Cumulative Percent Valid Walked/wheelchair 1, Dropped off Drove alone Carpooled Bicycle Taxi Total 1, Missing System Total 1, Q10d. If you selected "Walked/wheelchair," how many blocks? Valid Frequency Valid Percent Less than 1 block % 1 block % 2 blocks % 3 blocks % 4 or more blocks % 10 or more blocks % Did not specify % Total 1, D-11
157 Q10d. If you selected "Drove alone/carpooled, " indicate the Parking lot name/cross streets. Valid Frequency Percent Percent Cumulative Percent Valid 1, Adam Ramp East Chippewa St/Washington East Huron St/Main St Exchange St/Van Rensselaer St Exchange St/Washington St Franklin St & Genesee St KeyBank Center Parking LaSalle Station Michigan Ave/Scott St Military Seneca One Ramp Skyways Parking Lot Starin Ave/St Lawrence Ave University Station Total 1, Q10d. If did not walk or use a wheelchair," how many miles did you travel to get to the first bus/train on this one-way trip? Valid Frequency Valid Percent Less than 1 mile % 1 mile % 2 miles % 3 miles % 4 miles 4 1.3% 5 or more miles % 10 or more miles % Did not specify % Total D-12
158 Q11a. What kind of places are you going to? Frequency Percent Valid Percent Cumulative Percent Valid Home Work or work-related University/college High school Shopping Medical services Recreation/personal business Other (specify) Total 1, Missing System Total 1, Q11a. What kind of places are you going to? - Other (specify) Valid Frequency Percent Percent Cumulative Percent Valid 1, Bank Child School Church Court Daycare Decline to state Did not specify Downtown Education Food Gym Haircut Hotel Library Nursing Home Parking Lot Pay Bills Practice Public TV Round trip just wandering Social services Vacation Visiting friends/family Total 1, D-13
159 Q11d. How will you get to your destination from the last bus/train on this one-way trip? Valid Frequency Percent Percent Cumulative Percent Valid Walk/wheelchair 1, Get picked up Drive alone Carpool Bicycle Taxi Total 1, Missing System Total 1, Q11d. If you selected "Walk/wheelchair," how many blocks? Valid Frequency Valid Percent Less than 1 block % 1 block % 2 blocks % 3 blocks % 4 or more blocks % 10 or more blocks % Did not specify % Total 1, Q11d. If you selected "Drove alone/carpool," indicate the Parking lot name/cross streets. Valid Frequency Percent Percent Cumulative Percent Valid 1, Pearl St LaSalle Station M&T Bank Military NF University Station Total 1, D-14
160 Q11d. If will not walk or use a wheelchair," how many miles will you travel to get from the last bus/train to your destination? Valid Frequency Percent Valid 1, Less than 1 mile mile miles miles miles or more miles or more miles Did not specify Total Q12. In a typical week, how often do you ride NFTA-Metro? Valid Frequency Percent Percent Cumulative Percent Valid 6-7 days/week days/week days/week days/month Less than once/month Total 1, Missing System Total 1, Q13. Do you have a valid driver's license? Frequency Percent Valid Percent Cumulative Percent Valid Yes No Total 1, Missing System Total 1, D-15
161 Q14. What is your age? Frequency Percent Valid Percent Cumulative Percent Valid Under years of age Decline to state Total 1, Missing System Total 1, Q15. What is your employment status? Valid Frequency Percent Valid Full-time worker % Part-time worker % Homemaker % University/college student % High school student % Retired % Unemployed % Veteran % Active military 2 0.1% Decline to state % Total 1,698 Q16. What is your ethnicity? Valid Frequency Percent Valid Asian % Black/ African-American % Caucasian/White % Hispanic/Latino % Middle Eastern/ North African % Native American/Alaska Native % Native Hawaiian or Pacific Islander 3 0.2% Decline to State % Other (specify) % Total 1,698 D-16
162 Q16. What is your ethnicity? - Other (specify) - Other Valid Frequency Percent Percent Cumulative Percent Valid 1, Canadian Did not specify Italian American Multiracial Polish/German Slavic Total 1, Q17. Including yourself, how many people live in your household? Frequency Percent Valid Percent Cumulative Percent Valid or more Decline to state Total 1, Missing System Total 1, Q18. Including yourself, how many of the people in your household are employed full-time or part-time? Frequency Percent Valid Percent Cumulative Percent Valid None or more Total 1, Missing System Total 1, Q19. How many working vehicles are available to your household? Frequency Percent Valid Percent Cumulative Percent Valid None or more Total 1, Missing System Total 1, D-17
163 Q20. Were any of those vehicles available to make this one-way trip? Frequency Percent Valid Percent Cumulative Percent Valid Yes No Not applicable Total 1, Missing System Total 1, Q21. What language(s) are spoken in your home? Valid Frequency Percent Valid English 1, % Spanish % Karen 1 0.1% Burmese 2 0.1% Nepali 5 0.3% Arabic 5 0.3% Somali 3 0.2% Bengali/Bangla % Swahili 8 0.5% French % Other (specify) % Total 1, Q21. What language(s) are spoken in your home: Other (specify) - Other Frequency Percent Valid Percent Cumulative Percent Valid 1, ASL Bosnian Chinese Did not specify German Greek Gujarati Hindi Italian Konkani Mandarin Nigerian Portuguese Total 1, D-18
164 Q22. How well do you speak English? Frequency Percent Valid Percent Cumulative Percent Valid Very well 1, Less than very well Not at all Decline to state Total 1, Missing System Total 1, Q23. What was your total household income in 2016 before taxes? Frequency Percent Valid Percent Cumulative Percent Valid Less than $5, $5,000 - $9, $10,000 - $14, $15,000 - $24, $25,000 - $34, $35,000 - $49, $50,000 - $74, $75,000 - $99, $100,000 or more Decline to state Total 1, Missing System Total 1, Q24. How do you prefer to receive information about NFTA-Metro? Valid Frequency Percent Valid Online (metro.nfta.com) % Printed schedules % Calling NFTA customer service % Printed advertisements % At the bus stop % Facebook/Twitter % Text/ updates % Google/Google Transit % Radio % TV % Onboard the bus % Word of mouth % Other (specify) % Total 1, D-19
165 Q24. How do you prefer to receive information about NFTA-Metro: Other (specify)- Other Valid Frequency Percent Percent Cumulative Percent Valid 1, App Did not specify Mail Mobile App School Total 1, Q25. Overall, how satisfied are you with NFTA-Metro services? Valid Frequency Percent Percent Cumulative Percent Valid Very satisfied Somewhat satisfied Somewhat dissatisfied Very dissatisfied Total 1, Missing System Total 1, D-20
166 Appendix E Transfer Matrix E-1
167 This page intentionally blank. E-2
168 Route Rail E-3
169 Route Rail E-4
170 Route Rail E-5
171 This page intentionally blank. E-6
172 Appendix F Data Dictionary F-1
173 This page intentionally blank. F-2

174 Bus Code Book Page 1 F-1

175 Bus Code Book Page 2 F-2

176 Bus Excel Key Page 1 F-3

177 Bus Excel Key Page 2 F-4

178 Rail Code Book Page 1 F-5

179 Rail Code Book Page 2 F-6
180 Rail Excel Key Page 1 F-7

181 Rail Excel Key Page 2 F-8
ONBOARD ORIGIN-DESTINATION STUDY
 REPORT ONBOARD ORIGIN-DESTINATION STUDY 12.23.2014 PREPARED FOR: ANCHORAGE METROPOLITAN AREA TRANSPORTATION SYSTEM (AMATS) 55 Railroad Row White River Junction, VT 05001 802.295.4999 www.rsginc.com SUBMITTED
Peer Agency: King County Metro
 Peer Agency: King County Metro City: Seattle, WA Fare Policy: Service Type Full Fare Reduced Fare Peak: - 1 Zone $2.75 $1.00* or $1.50** - 2 Zones $3.25 $1.00* or $1.50** Off Peak $2.50 $1.00* or $1.50**
2013 STA Passenger Survey Results. Attachment E Title VI Attachment E
 2013 STA Passenger Survey Results Attachment E 1 2014 Title VI Attachment E 2013 STA Passenger Survey Results Overview Spokane Transit Authority (STA) conducted its most recent passenger survey in December
Proposed Service Change Title VI Compliance Review
 Proposed Service Change Title VI Compliance Review May 2014 Submitted by: Table of Contents 1. Purpose... 3 2. Background... 3 3. Definition of Title VI and Environmental Justice Impact Policies... 3 3.1
2013 Household Travel Survey: High Level Overview
 Report for: Infrastructure Services Department 2013 Household Travel Survey: High Level Overview April 14, 2014 Submitted by: Reid 200 1285 West Pender Street Vancouver BC V6E 4B1 www.ipsos.ca Contact:
Item #11. May 11, 2018 VENTURA COUNTY TRANSPORTATION COMMISSION MARTIN R. ERICKSON, PUBLIC TRANSIT DIRECTOR TITLE VI FARE EQUITY SURVEY RESULTS
 1 of 90 May 11, 2018 Item #11 MEMO TO: FROM: SUBJECT: VENTURA COUNTY TRANSPORTATION COMMISSION MARTIN R. ERICKSON, PUBLIC TRANSIT DIRECTOR TITLE VI FARE EQUITY SURVEY RESULTS RECOMMENDATION: Receive a
NEW YORK STATE OFFICE OF THE STATE COMPTROLLER
 NEW YORK STATE OFFICE OF THE STATE COMPTROLLER H. Carl McCall STATE COMPTROLLER COMMUTER CHOICE PROGRAMS AT FOUR UPSTATE PUBLIC TRANSPORTATION AUTHORITIES 2000-S-30 DIVISION OF MANAGEMENT AUDIT AND STATE
2008 Cecil County Public Opinion Survey Results Summary
 Cecil County Public Opinion Survey Results Summary Survey completed by Public National Research Center Inc. Report created by WILMAPCO September www.wilmapco.org September 29, About the Survey PURPOSE
Chapter 10 Equity and Environmental Justice
 Chapter 10 Equity and Environmental Justice Introduction An important consideration for the 2040 Transportation Policy Plan is its impact on all populations in the Minneapolis-Saint Paul region, particularly
The Potential for Shared Use Mobility in Affordable Housing Complexes in Rural California
 The Potential for Shared Use Mobility in Affordable Housing Complexes in Rural California A Research Report from the University of California Institute of Transportation Studies Susan Pike, Ph.D., Post-Doctoral
2013 Triennial Customer Survey Results
 2013 Triennial Customer Survey Results Board of Directors May 1, 2014 Objectives Determine who our customers are Demographics Trip purpose Mode of access Frequency of use Reasons for riding Measure whether
Title VI Fare Equity Analysis
 Pioneer Valley Transit Authority Title VI Fare Equity Analysis Prepared by the Pioneer Valley Planning Commission April 12, 2012 PVTA TITLE VI FARE EQUITY ANALYSIS APRIL 12, 2012 1. CONFORMANCE WITH REGULATORY
Service and Fare Change Policies. Revised Draft
 Revised Draft June 19, 2013 1. INTRODUCTION It is the policy of the Sacramento Regional Transit District (RT) to provide quality service to all customers regardless of race, color, national origin, or
One Gateway Plaza Metropolitan Transportation Authority Los Angeles, CA goo REQUIRES 213 VOTE PER Administrative Code , Part D
 Metro Los Angeles County One Gateway Plaza Metropolitan Transportation Authority Los Angeles, CA goo12 2952 OPERATIONS COMMITTEE OCTOBER 15,2009 SUBJECT: LINE 910 FARE STRUCTURE ACTION: APPROVE PROPOSED
Princeton Senior Shuttle Service
 Princeton Senior Shuttle Service By James Mejia Micah Perlin REPORT AS PART OF WWS 527A TRANSPORTATION POLICY ANALYSIS FALL 2003 1.0 Executive Summary The senior population in Princeton is underserved
Virginia Railway Express Annual Customer Survey Customer Opinion Survey Results
 Virginia Railway Express Annual Customer Survey 2017 Customer Opinion Survey Results 1. What train do you normally take in the evening? Train Responses % of Total Manassas 325 (Departs Union Station at
CHERRIOTS 2018 SERVICE PLAN APPENDIX A EQUITY ANALYSIS
 CHERRIOTS 2018 SERVICE PLAN APPENDIX A EQUITY ANALYSIS 1. Background... 1 2. Title VI requirements... 1 3. SAMTD Title VI compliance... 2 3.1 Major service changes policy... 2 3.2 Definition of adverse
University Link LRT Extension
 (November 2007) The Central Puget Sound Regional Transit Authority, commonly known as Sound Transit, is proposing to implement an extension of the Central Link light rail transit (LRT) Initial Segment
RTD Pass Program Portfolio: The Current State. An Overview of RTD Pass Programs June 6, 2017
 RTD Pass Program Portfolio: The Current State An Overview of RTD Pass Programs June 6, 2017 Outline 1. The Budget 2. Pass Programs By The Numbers 3. Equity The Budget How fare revenue and pass programs
RTD Pass Program Portfolio: The Current State. An Overview of RTD Pass Programs June 6, 2017
 RTD Pass Program Portfolio: The Current State An Overview of RTD Pass Programs June 6, 2017 Outline 1. The Budget 2. Pass Programs By The Numbers 3. Equity The Budget How fare revenue and pass programs
Title VI Approval of Major Service Change, Disparate Impact and Disproportionate Burden
 Customer Service and Operations Committee Board Action Item III-A October 10, 2013 Title VI Approval of Major Service Change, Disparate Impact and Disproportionate Burden Page 3 of 42 Washington Metropolitan
Regional Travel Study
 PSRC S Regional Travel Study 1999 KEY COMPARISONS OF 1999,, AND TRAVEL SURVEY FINDINGS Puget Sound Regional Council JUNE 2015 PSRC S Regional Travel Study / JUNE 2015 Funding for this document provided
POLICY AND PROCEDURES MANUAL
 NUMBER EFF. DATE POLICY AND PROCEDURES MANUAL RESPONSIBLE DEPARTMENT Finance/Service Planning TITLE Fare Policy (DRAFT as of 11-13-13) APPLIES TO Development of Fare Structure, General Public SUPERSEDED
Parking Services and Transportation Planning
 Prepared for the Board of Governors April 10, 2014 Table of Contents PARKING SERVICES AND TRANSPORTATION PLANNING... 1 Background:... 2 Transportation Demand Management (TDM)... 2 Safety Initiatives:...
Parking Cash Out. Transportation Solutions Workshop Series April 19, 2017
 Parking Cash Out Transportation Solutions Workshop Series April 19, 2017 Workshop Series Sponsors Welcome from the Chamber of Commerce Grand Rapids is Changing New Approach to Transportation Workshop Agenda
~ NOTICE OF MEETING ~ CAPITAL METROPOLITAN TRANSPORTATION AUTHORITY BOARD OF DIRECTORS MEETING
 ~ NOTICE OF MEETING ~ CAPITAL METROPOLITAN TRANSPORTATION AUTHORITY BOARD OF DIRECTORS MEETING 2910 East Fifth Street Austin, TX 78702 ~ AGENDA ~ Executive Assistant/Board Liaison Gina Estrada 512-389-7458
Centro Rider Survey Final Report
 Centro Rider Survey Final Report June 2018 Centro Rider Survey Syracuse Metropolitan Transportation Council Final Report June 2018 This document was prepared with financial assistance from the Federal
Enclosed is a registration packet that provides you with a Passenger Information Sheet, Waiver Form, Registration Form and an Agreement Checklist.
 Dear Friend, Thank you for your interest in Neighbor Ride. Neighbor Ride is a nonprofit organization providing Howard County s residents, age 60 and older, with reasonably priced, reliable supplemental
2010 ETC Institute 725 W Frontier Circle Olathe, KS /9/2010
 2010 Kansas City Area Transportation Authority Onboard Survey By ETC Institute 725 W Frontier Circle Olathe, KS 66061 7/9/20100 Table of Contents Summary... 1 Survey method... 2 Weekly use of The Metro
Title VI Service Equity Analysis
 Pierce Transit Title VI Service Equity Analysis Pursuant to FTA Circular 4702.1B March 2017 Restructure December 2016 Pierce Transit -- Transit Development Dept. PIERCE TRANSIT TITLE VI SERVICE EQUITY
Title VI Service Equity Analysis: FY2019 Annual Service Plan. Department of Diversity & Transit Equity
 Title VI Service Equity Analysis: FY2019 Annual Service Plan Department of Diversity & Transit Equity April 26, 2018 Executive Summary TriMet is proposing to implement several service improvements in fall
Travel Forecasting for Corridor Alternatives Analysis
 Travel Forecasting for Corridor Alternatives Analysis Purple Line Functional Master Plan Advisory Group January 22, 2008 1 Purpose of Travel Forecasting Problem Definition Market Analysis Current Future
May 31, 2016 Financial Report
 2016 May 31, 2016 Financial Report Capital Metropolitan Transportation Authority 7/13/2016 Table of Contents SUMMARY REPORTS Budgetary Performance - Revenue 2 - Sales Tax Revenue 6 - Operating Expenses
Washington Metropolitan Area Transit Authority Metro Budget Overview
 Washington Metropolitan Area Transit Authority Metro Budget Overview February 2011 Metro 10,877 Employees (10,974 budgeted) 1,491 Buses 588 Escalators and 237 Elevators 106 Miles of Track 92 Traction Power
Medicaid Non-Emergency Transportation Request for Proposals. Responses to Questions Received by the March 11 Deadline (Posted March 17, 2011)
") Medicaid Non-Emergency Transportation Request for Proposals Responses to Questions Received by the March 11 Deadline (Posted March 17, 2011) 1. Could the MPO please provide a link to (or an electronic
Medicaid Non-Emergency Transportation Request for Proposals Responses to Questions Received by the March 11 Deadline (Posted March 17, 2011) 1. Could the MPO please provide a link to (or an electronic
Public Authorities by the Numbers: Capital District Transportation Authority
 Public Authorities by the Numbers: Capital District Transportation Authority June 2016 Table of Contents I. EXECUTIVE SUMMARY... 1 II. CAPITAL DISTRICT TRANSPORTATION AUTHORITY BY THE NUMBERS... 2 Introduction...
PASSENGER HANDBOOK. Cody Roggatz Transportation Director City of Aberdeen
 1 P u b l i c T r a n s p o r t a t i o n A B E R D E E N R I D E L I N E PASSENGER HANDBOOK Effective: May 1999 R e v i s e d : M a r c h 2 0 1 6 T r a n s i t S y s t e m S p o n s o r e d b y t h e
Wake County. People love to be connected. In our cyberspace. transit plan CONNECTING PEOPLE, CONNECTING THE COUNTY
 Wake County transit plan CONNECTING PEOPLE, CONNECTING THE COUNTY EXECUTIVE SUMMARY People love to be connected. In our cyberspace driven world, people can stay connected pretty much all of the time. Connecting
APPENDIX F-1: CATS Baseline Conditions and Needs Assessment
 APPENDIX F-1: CATS Baseline Conditions and Needs Assessment Prepared by: As a subconsultant to: January 2016 Appendix F-1: CATS Baseline Conditions and Needs Assessment TABLE OF CONTENTS 1 INTRODUCTION...
COOPERATIVE AGREEMENT FY 2004/05 VENTURA INTERCITY SERVICE TRANSIT AUTHORITY (VISTA) CONEJO CONNECTION
 CONEJO CONNECTION") COOPERATIVE AGREEMENT FY 2004/05 VENTURA INTERCITY SERVICE TRANSIT AUTHORITY (VISTA) CONEJO CONNECTION This Agreement is made and entered into by the City of Calabasas (Calabasas) and the Ventura County
COOPERATIVE AGREEMENT FY 2004/05 VENTURA INTERCITY SERVICE TRANSIT AUTHORITY (VISTA) CONEJO CONNECTION This Agreement is made and entered into by the City of Calabasas (Calabasas) and the Ventura County
PUBLIC TRANSIT OPERATORS in the United States have long known that
 Discounting Transit Passes BY CORNELIUS NUWORSOO PUBLIC TRANSIT OPERATORS in the United States have long known that fare hikes do not increase total revenues. Although while fare reductions might boost
2017 Paratransit Customer Satisfaction Study Access-A-Ride
 2017 Paratransit Customer Satisfaction Study Access-A-Ride Final Report Prepared for: Prepared by: Date: February 2018 0 Table of Contents Headlines... 3 Background & Objectives... 6 Methodology... 7 Key
FINDINGS FOR INFRASTRUCTURE 2014
 Opinion Research Strategic Communication FINDINGS FOR INFRASTRUCTURE 2014 Introduction The following report covers the results for the Infrastructure 2014 survey of decision makers in the public and private
Funding Local Public Transportation
 Funding Local Public Transportation I. Metro A. SORTA, early history In 1969 the Southwest Ohio Regional Transit Authority was established by Hamilton County with Hamilton County as its jurisdiction. In
Overview of the Final New Starts / Small Starts Regulation and Frequently Asked Questions
 Overview of the Final New Starts / Small Starts Regulation and Frequently Asked Questions The Federal Transit Administration s (FTA) New Starts and Small Starts program represents the federal government
METROPOLITAN TRANSIT AUTHORITY OF HARRIS COUNTY, TEXAS. Independent Accountants Report on Applying Agreed-Upon Procedures
 METROPOLITAN TRANSIT AUTHORITY OF HARRIS COUNTY, TEXAS Independent Accountants Report on Applying Agreed-Upon Procedures Year ended September 30, 2012 KPMG LLP 811 Main Street Houston, TX 77002 Independent
Operating Protocol & Procedure
 Details: Number: 262 Operating Protocol & Procedure Title: Category: Use of PCC Van Employees Office of Primary Responsibility: Facility Services Approval Date: 4/10/17 Effective Date: 4/10/17 Revised:
SURVEY OF POTENTIAL OVERNIGHT SERVICE PASSENGERS 1/30/17 OPMI
 SURVEY OF POTENTIAL OVERNIGHT SERVICE PASSENGERS 1/30/17 OPMI Survey Background & overview In March 2016, the FMCB ended Late Night service In Fall 2016, the FMCB directed staff to conduct a survey and
2016 Q4 CUSTOMER SATISFACTION SURVEY
 2016 Q4 CUSTOMER SATISFACTION SURVEY Quarterly Report PREPARED IN PARTNERSHIP WITH: TABLE OF CONTENTS Methodology 3 Executive Summary 4 Summary of Findings 6 Key Drivers by Mode 27 Individual Measures
Business Survey Report
 Who is TOD in Metro Denver? September 2009 Benchmarking the Evolution of TOD in Metro Denver Business Survey Report Who is TOD in Metro Denver? Business Survey Report September 2009 Acknowledgments Preparation
Public Transportation Department Anchorage: Performance. Value. Results.
 Anchorage: Performance. Value. Results. Mission Serve Anchorage residents and visitors by providing public transportation that emphasizes quality, safety, cost effectiveness, and economic vitality. Core
City of Littleton Page 1
 City of Center 2255 West Berry Avenue, CO 80120 Meeting Agenda Planning Commission Monday, February 13, 2017 6:30 PM Community Room Study Session 1. Biennial Light Rail Station Survey Results a. ID# 17-37
Program Evaluation and Audit COUNTY CONTRACTOR ADA COST REVIEW DARTS AND SCOTT COUNTY
 Program Evaluation and Audit COUNTY CONTRACTOR ADA COST REVIEW DARTS AND SCOTT COUNTY October 27, 2006 Background INTRODUCTION The Metropolitan Council contracts with four County governments (Anoka, Dakota,
School Reform Commission 311. Employee Travel and Expense Reimbursement
 School Reform Commission 311 Employee Travel and Expense Reimbursement Approved at the School Reform Commission Meeting: February 17, 2010 REVISED: October 1, 2009 Policy 311 Should be used In conjunction
SOLTRANS BOARD MEETING SUPPLEMENTAL REPORTS / HANDOUTS December 19, 2013 MEETING HANDOUTS
 SOLTRANS BOARD MEETING SUPPLEMENTAL REPORTS / HANDOUTS December 19, 2013 MEETING HANDOUTS Agenda Item 8 SolTrans Curtola Park and Ride Hub Project Update PowerPoint Presentation Agenda Item 9 SolTrans
THE IMPACT OF TENNCARE
 THE IMPACT OF TENNCARE A Survey of Recipients, 2011 Prepared by William Hamblen Research Associate, CBER and William F. Fox Director, CBER November 2011 716 Stokely Management Center Knoxville, Tennessee
University of North Alabama. Travel Policies
 University of North Alabama Travel Policies I. INTRODUCTION The travel policies of the University of North Alabama have been developed in accordance with Alabama law and Internal Revenue Service regulations
NIAGARA FRONTIER TRANSPORTATION AUTHORITY (A Component Unit of the State of New York) SINGLE AUDIT REPORTING PACKAGE MARCH 31, 2017
 SINGLE AUDIT REPORTING PACKAGE MARCH 31, 2017") NIAGARA FRONTIER TRANSPORTATION AUTHORITY SINGLE AUDIT REPORTING PACKAGE MARCH 31, 2017 Table of Contents March 31, 2017 Independent Auditors Report 1 Management Certification: Management s Certification
NIAGARA FRONTIER TRANSPORTATION AUTHORITY SINGLE AUDIT REPORTING PACKAGE MARCH 31, 2017 Table of Contents March 31, 2017 Independent Auditors Report 1 Management Certification: Management s Certification
Guide for Investigators. The American Panel Survey (TAPS)
") Draft (to be updated in January) Guide for Investigators The American Panel Survey (TAPS) Weidenbaum Center Washington University Steven S. Smith, Director About The American Panel Survey (TAPS) TAPS is
Draft (to be updated in January) Guide for Investigators The American Panel Survey (TAPS) Weidenbaum Center Washington University Steven S. Smith, Director About The American Panel Survey (TAPS) TAPS is
Transit Development Plan (FY ) Executive Summary
 Executive Summary") Transit Development Plan (FY 2019-2028) Executive Summary December 2018 TABLE OF CONTENTS Introduction... 1 System Profile... 2 Public Outreach... 4 Key Findings/Direction... 5 Implementation Plan... 6
Transit Development Plan (FY 2019-2028) Executive Summary December 2018 TABLE OF CONTENTS Introduction... 1 System Profile... 2 Public Outreach... 4 Key Findings/Direction... 5 Implementation Plan... 6
LIGHT RAIL FARE COMPLIANCE PROGRAM EVALUATION AND AUDIT
 LIGHT RAIL FARE COMPLIANCE PROGRAM EVALUATION AND AUDIT April 2015 INTRODUCTION Background METRO Fare Payment System Both the METRO Blue Line, which opened in 2004, and the METRO Green Line, which opened
One (1) Calendar Year from date of award with possible contract extension based on mutual agreement
 Calendar Year from date of award with possible contract extension based on mutual agreement") Request for Proposal This Request for Proposals (RFP) is for the purpose of obtaining competitive proposals to provide Transportation Services for CSUSA schools (see Attachment B). The goal of CSUSA s
Request for Proposal This Request for Proposals (RFP) is for the purpose of obtaining competitive proposals to provide Transportation Services for CSUSA schools (see Attachment B). The goal of CSUSA s
SOUND TRANSIT STAFF REPORT MOTION NO. M Select a draft Sounder fare structure change and fare increase for public review and comment
 SOUND TRANSIT STAFF REPORT MOTION NO. M2007-21 Select a draft Sounder fare structure change and fare increase for public review and comment Meeting: Date: Type of Action: Staff Contact: Phone: Finance
BOARD OF SUPERVISORS BUSINESS MEETING ACTION ITEM
 Date of Meeting: June 7, 2016 # 7 BOARD OF SUPERVISORS BUSINESS MEETING ACTION ITEM SUBJECT: ELECTION DISTRICT: Title VI Policies for Transit Service Countywide CRITICAL ACTION DATE: June 7, 2016 STAFF
V E H I C L E U S E POL I C I E S AND PROC E D U R E S LAWRENCE UNIVERSITY
 V E H I C L E U S E POL I C I E S AND PROC E D U R E S LAWRENCE UNIVERSITY Vehicle Policies and Procedures The goal of this document is to ensure the safety of Lawrence University employees and students
Metropolitan Council: Regional Parks System Visitor Study Report. November, 2016
 Metropolitan Council: s System Visitor Study Report November, 2016 Table of Contents Contents Background, objectives and methodology..... 3 Total respondents by agency and sample demographics summary...
MEETING DATE: November 17, SUBJECT: 2005 Wheel-Trans Operating Budget
 MEETING DATE: November 17, 2004 SUBJECT: 2005 Wheel-Trans Operating Budget RECOMMENDATION It is recommended that the Commission approve: 1/ The 2005 Wheel-Trans Operating Budget of $53.1 million provided
THE CITY UNIVERSITY OF NEW YORK VEHICLE USE POLICY
 Policy 3.07 Use and Operation of University Vehicles A. Purpose and Applicability THE CITY UNIVERSITY OF NEW YORK VEHICLE USE POLICY This Policy addresses the use and operation of University vehicles.
Equity Analysis: Honored Citizen Fare Increase DRAFT. Department of Diversity & Transit Equity
 Equity Analysis: Honored Citizen Increase DRAFT Department of Diversity & Transit Equity March 23, 2015 Executive Summary: Honored Citizen Increase Equity Analysis In accordance with Title VI of the Civil
Affordable Fares Task Force Recommendations. March 26, 2015
 Affordable Fares Task Force Recommendations March 26, 2015 Low income individuals make up a disproportionate amount of RTD users. Percent of RTD riders Percent of individuals in the district Less than
Puget Sound 4K Model Version Draft Model Documentation
 Puget Sound 4K Model Version 4.0.3 Draft Model Documentation Prepared by: Puget Sound Regional Council Staff June 2015 1 Table of Contents Trip Generation 9 1.0 Introduction 9 Changes made with Puget Sound
CTRP. Corporate Travel and Expense Reimbursement Policy. Manual Number CTRP. Revision /22/17
 Corporate Travel and Expense Reimbursement Policy Manual Number Revision 000 02/22/17 Page 1 of 2 Corporate Travel and Expense Reimbursement Policy Revision Recordy Revision No. Date Inserted By 000 02/22/17
Registration of bus transport
 Registration of bus transport Parents are referred to the Company s website (www.tongtar.com) to register their children online. By validating the terms and conditions at the point of registration, parents
Acknowledgments. Special thanks to public- and private-sector financial contributors: Arapahoe County. City of Arvada.
 Acknowledgments Preparation of this report has been financed in part through grants from the U.S. Department of Transportation, Federal Transit Administration and Federal Highway Administration. Special
Customers experience of the Tax Credits Helpline
 Customers experience of the Tax Credits Helpline Findings from the 2009 Panel Study of Tax Credits and Child Benefit Customers Natalie Maplethorpe, National Centre for Social Research July 2011 HM Revenue
Marketing to New Residents
 TRANSPORTATION RESEARCH RECORD 1402 43 Cost-Effectiveness of Direct Mail Marketing to New Residents CAROL PEDERSEN AMBRUSO In January 1989 the Tri-County Metropolitan Transportation District of Oregon
METROPOLITAN TRANSIT AUTHORITY OF HARRIS COUNTY, TEXAS. Independent Accountants Report on Applying Agreed-Upon Procedures
 METROPOLITAN TRANSIT AUTHORITY OF HARRIS COUNTY, TEXAS Independent Accountants Report on Applying Agreed-Upon Procedures Year ended September 30, 2017 KPMG LLP 811 Main Street Houston, TX 77002 Independent
Healthcare and Health Insurance Choices: How Consumers Decide
 Healthcare and Health Insurance Choices: How Consumers Decide CONSUMER SURVEY FALL 2016 Despite the growing importance of healthcare consumerism, relatively little is known about consumer attitudes and
Greyhound Lines, Inc. Title VI Program
 Greyhound Lines, Inc. Title VI Program 350 N St. Paul Street Dallas, TX 75201 214-849-8000 www.greyhound.com This document was prepared in accordance with the FTA Circular 4702.1B, dated October 1, 2012.
Capital Metropolitan Transportation Authority
 Capital Metropolitan Transportation Authority Monthly Performance Report (Covering Performance Data Through March and April 2010) Capital Metropolitan Transportation Authority 1 Performance Report Contents
Appendix C: Modeling Process
 Appendix C: Modeling Process Michiana on the Move C Figure C-1: The MACOG Hybrid Model Design Modeling Process Travel demand forecasting models (TDMs) are a major analysis tool for the development of long-range
Fare evasion at NYCT
 Fare evasion at NYCT Fare evasion is up significantly in 2018 Evasion rates Percent 8% 2 7% 5% 3% 1% 13 210K daily 109K daily Buses 1 10. Subway 14.8% 2.1% 348K daily 1. 12. 208K daily 18.9% 16.3% 3.8%
MiWay Business Plan and 2015 Budget
 MiWay 2015-2018 Business Plan and 2015 Budget Agenda Existing Core Services Vision and Mission Service Delivery Model Service Level Issues and Trends Service Area Information Accomplishments Benchmarks
Central Puget Sound Regional Transit Authority
 Central Puget Sound Regional Transit Authority Single Audit Reports for the Year Ended December 31, 2014 TABLE OF CONTENTS Audited Financial Statements Management s Discussion and Analysis... 1 Independent
Subject: Creation of an Eco Pass
 To: Board of Directors Date: April, 2014 From: Anne Muzzini, Director of Planning & Marketing Reviewed by: Subject: Creation of an Eco Pass Summary: The concept of creating an Eco Pass has been reviewed
Collin County Community College District Business Administrative Services Procedures Manual Section 10 Travel and Professional Development
 Revision Log: Collin County Community College District Business Administrative Services Procedures Manual Section 10 Travel and Professional Development Sub Section Revision Date Summary of Change 10.1
Downtown Boulder User Survey October 2014
 Downtown Boulder User Survey 2014 October 2014 Presentation Overview o Methodology o Key Findings and Highlights o Visitor Profile o Marketing & Media o Spending Patters o Transportation & Parking o Impact
COMMUTER CONNECTIONS WASHINGTON DC METROPOLITAN REGION GUARANTEED RIDE HOME (GRH) PROGRAM 2016 GRH APPLICANT SURVEY REPORT
 PROGRAM 2016 GRH APPLICANT SURVEY REPORT") COMMUTER CONNECTIONS WASHINGTON DC METROPOLITAN REGION GUARANTEED RIDE HOME (GRH) PROGRAM 2016 GRH APPLICANT SURVEY REPORT Prepared for: Metropolitan Washington Council of Governments Commuter Connections
COMMUTER CONNECTIONS WASHINGTON DC METROPOLITAN REGION GUARANTEED RIDE HOME (GRH) PROGRAM 2016 GRH APPLICANT SURVEY REPORT Prepared for: Metropolitan Washington Council of Governments Commuter Connections
ADMINISTRATIVE PROCEDURE MANUAL
 TRAVEL 04-1001 1 OF 7 Purpose The purpose of this procedure is to govern travel and the payment of costs associated with such travel of Florida State College at Jacksonville (FSCJ) District Board of Trustees
Minutes NASHVILLE METROPOLITAN TRANSIT AUTHORITY BOARD OF DIRECTORS MEETING. January 26, 2017
 Minutes NASHVILLE METROPOLITAN TRANSIT AUTHORITY BOARD OF DIRECTORS MEETING January 26, 2017 I. CALL TO ORDER: The regular meeting of the Nashville Metropolitan Transit Authority (MTA) Board of Directors
OSU INSTITUTE OF TECHNOLOGY POLICY & PROCEDURES. A. provide a framework for safe and efficient travel while on official university business, and
 Travel 3-023 FISCAL SERVICES June 2016 POLICY 1.01 The purpose of this policy is to: A. provide a framework for safe and efficient travel while on official university business, and B. ensure university
Allen ISD Travel Guidelines
 Allen ISD Travel Guidelines 2015-2016 Table of Contents General Guidelines for Employee Travel 2-3 Local Travel 3 Out of District Travel 4 Meals 4-5 Lodging/Hotels 5-6 Air Fare 6 Car Rental/Personal Vehicle
RCTC Additional Instructions for the SEMA4 Employee Expense Report Form 08/02/2013
 RCTC Additional Instructions for the SEMA4 Employee Expense Report Form 08/02/2013 There are two forms which generally have to be completed in order to have your work related expenses reimbursed. The Travel/Professional
Recession Reinforced Federal Role
 Policy Development and Research MARCH 2013 Recession Reinforced Federal Role Executive Summary A new survey conducted by APTA indicates that over half of public transportation agencies are still reporting
CORPORATE POLICY. Attachments: Appendix 1 Appendix 2 Related Documents/Legislation: CAO Key Word(s): Parking, Employee
: Parking, Employee") CORPORATE POLICY Policy Title: Employee Paid Parking Policy Category: Human Resources Policy No.: H-001 Department: Human Resources Approval Date: December 5, 2011 Revision Date: Author: Karen Boa Attachments:
CORPORATE POLICY Policy Title: Employee Paid Parking Policy Category: Human Resources Policy No.: H-001 Department: Human Resources Approval Date: December 5, 2011 Revision Date: Author: Karen Boa Attachments:
Central Puget Sound Regional Transit Authority
 Central Puget Sound Regional Transit Authority Single Audit Reports for the Year Ended December 31, 2013 TABLE OF CONTENTS Audited Financial Statements Management s Discussion and Analysis...1 Independent
THE SCHOOL DISTRICT OF PHILADELPHIA ADOPTED:
 No. 331 THE SCHOOL DISTRICT OF PHILADELPHIA SECTION: TITLE: ADOPTED: EMPLOYEES Expense Reimbursement REVISED: October 1, 2009 331 EXPENSE REIMBURSEMENT Purpose To establish the policies and procedures
Votran Transit Development Plan (TDP) River To Sea TPO Committees September 2016
 River To Sea TPO Committees September 2016") Votran Transit Development Plan (TDP) River To Sea TPO Committees September 2016 Agenda What is a TDP? Baseline Conditions Public Involvement Peer and Trend Review Situation Appraisal Goals Proposed Alternatives
Votran Transit Development Plan (TDP) River To Sea TPO Committees September 2016 Agenda What is a TDP? Baseline Conditions Public Involvement Peer and Trend Review Situation Appraisal Goals Proposed Alternatives
Exam 1 Review. 1) Identify the population being studied. The heights of 14 out of the 31 cucumber plants at Mr. Lonardo's greenhouse.
 Identify the population being studied. The heights of 14 out of the 31 cucumber plants at Mr. Lonardo's greenhouse.") Exam 1 Review 1) Identify the population being studied. The heights of 14 out of the 31 cucumber plants at Mr. Lonardo's greenhouse. 2) Identify the population being studied and the sample chosen. The
Exam 1 Review 1) Identify the population being studied. The heights of 14 out of the 31 cucumber plants at Mr. Lonardo's greenhouse. 2) Identify the population being studied and the sample chosen. The
REGIONAL TRANSIT ISSUE PAPER Page 1 of 3 Agenda Item No.
 REGIONAL TRANSIT ISSUE PAPER Page 1 of 3 Agenda Item No. Board Meeting Date Open/Closed Session Information/Action Item Issue Date 13 07/27/15 Open Action 07/08/15 Subject: Setting a Public Hearing on