Title VI Service Equity Analysis: FY2019 Annual Service Plan. Department of Diversity & Transit Equity
|
|
|
- Jennifer Barker
- 5 years ago
- Views:
Transcription

1 Title VI Service Equity Analysis: FY2019 Annual Service Plan Department of Diversity & Transit Equity April 26, 2018
2 Executive Summary TriMet is proposing to implement several service improvements in fall 2018 and spring In accordance with Title VI of the Civil Rights Act of 1964 and FTA Circular B, TriMet conducts an Equity Analysis any time Major Service Changes are proposed to ensure that changes do not unfairly impact people of color and low-income populations. The service proposal includes Major Service Changes to twelve bus lines, including two brand new lines. Thus, an analysis is required prior to the TriMet Board of Directors taking action. Methodology TriMet s Title VI Program outlines the agency s Major Service Change, Disparate Impact, and Disproportionate Burden policies, as well as the way in which TriMet conducts Equity Analyses. Major Service Changes are analyzed for both potential adverse effects and distribution of benefits. This is done at both the individual linelevel and system-level, and the analysis seeks to identify any potential disparities based on race/ethnicity or income. Major Service Changes The proposed addition of two brand new bus lines, a line split into two lines, and the proposed changes to nine existing lines meet TriMet s established thresholds for Major Service Changes: Line Airport Bus Line (New) Line 31 - Webster Line (New) Line 4 - Division/Fessenden Line 24 - Fremont Line 61 - Marquam Hill/Beaverton Line 64 - Marquam Hill/Tigard Line 66 - Marquam Hill/Hollywood Line 68 - Marquam Hill/Collins Circle Line nd Avenue Line 79 - Clackamas/Oregon City Line 81 - Kane/257 th Line 96 - Tualatin/I-5 Findings 1. No system level disparate impact or disproportionate burden for the 12 major service increases. 2. A slightly greater percentage of the District s non-minority population stands to benefit from the proposed service improvements compared to the minority population (20% vs. 19.1%, respectively). 3. The vast majority of improvements are on lines with average-or-above low-income populations in their service areas. As a result, a greater share of the region s low-income populations stand to benefit as compared to higher income populations. 4. No disproportionate and adverse effects from the one major service reduction (Line 79). The minority and low-income populations in this service area are below the disparate impact and disproportionate burden thresholds. FY2019 Annual Service Plan Equity Analysis Page ES-1
3 Table of Contents I. Background...1 II. TriMet Title VI Compliance...1 A. Major Service Change Policy...2 B. Disparate Impact Policy...3 C. Disproportionate Burden Policy...4 III. Proposed Service Changes...4 A. Description of Changes...4 B. Major Service Change Test...6 C. Line-level Analyses...8 D. System-level Analysis IV. Community Engagement V. Summary of Findings Attachment A: Analysis of impact on access to employment, education, health care, and food for minority and low-income populations DRAFT FY2019 Annual Service Plan Equity Analysis
4 I. Background Building upon several years of ongoing service improvements, TriMet s Annual Service Plan for FY proposes Major Service Changes to ten bus lines and the addition of two new bus lines. Other changes will involve all night service on several lines, additional peak hour trips on an over-loaded line, and improvements in on-time performance for lines with high ridership but lower current reliability. Though these changes will represent improvements for riders on those lines, they are not large enough changes to be reviewed as Major Service Changes. The Major Service Changes presented here represent the large majority of TriMet s proposed changes for FY19. The TriMet Board s approval of a ten-year payroll and self-employment tax rate increase in 2015 makes the changes possible. TriMet has engaged the community for the past few years to develop a shared vision for future transit service that will guide how the additional revenue is invested. Each year, TriMet staff will use information developed from the shared vision planning efforts and outreach, updated analyses and measures, and additional outreach to prioritize incremental service improvements for that year. The efforts will focus on five factors defined by the TriMet Board: demand, productivity, connections, equity, and growth. Each year s plan will also consider safety, budget availability, and availability of staff and equipment to provide for expanded service. This report documents the equity analysis conducted for these changes. II. TriMet Title VI Compliance As a recipient of Federal Transit Administration ( FTA ) financial assistance, TriMet must ensure that service changes both increases and reductions comply with Title VI of the Civil Rights Act of 1964, which states: No person in the United States shall, on the ground of race, color, or national origin, be excluded from participation in, be denied the benefits of, or be subjected to discrimination under any program or activity receiving Federal financial assistance. The FTA has provided specific implementing guidelines and regulations for complying with Title VI in Circular B ( Circular ). The Circular instructs transit agencies to consider impacts of Major Service Changes on low-income populations as well as minority populations by conducting a service equity analysis. Figure 1 shows the general sequence of steps and considerations in the equity analysis process. TriMet s Title VI Program 2 outlines the agency s policies, definitions and procedures for complying with Title VI and performing equity analyses. As required by the Circular, this includes the agency s Major Service Change, Disparate Impact, and Disproportionate Burden policies, as set forth below. 1 Fiscal year 2019 runs from July 1, 2018 to June 30, TriMet s Title VI Program was updated and submitted to FTA in fall 2017 FY2019 Annual Service Plan Equity Analysis Page 1

5 A. Major Service Change Policy All changes in service meeting the definition of Major Service Change are subject to a Title VI Equity Analysis prior to Board approval of the service change. A Title VI Equity Analysis will be completed for all Major Service Changes and will be presented to the Board for its consideration and included in the subsequent TriMet Title VI Program with a record of action taken by the Board. A Major Service Change is defined as: 1. A change to 15% or more of a line s route miles. This includes routing changes where route miles are neither increased nor reduced (i.e. re-routes), or; 2. A change of 15% or more to a line s span (hours) of service on a daily basis for the day of the week for which a change is made, or; Figure 1: Overview of TriMet's Title VI Equity Analysis process 3. A change of 15% or more to a line s frequency of service on a daily basis for the day of the week for which a change is made, or; 4. A single transit line is split into two or more transit lines, or; 5. A new transit line is established. A Major Service Change occurs whether the above thresholds are met: a) Within a single service proposal, or; b) Due to a cumulative effect of routing, span, or frequency changes over the three years prior to the analysis FY2019 Annual Service Plan Equity Analysis Page 2
6 B. Disparate Impact Policy Testing for Disparate Impact evaluates effects on minority riders or populations as compared to nonminority riders or populations. Minority is defined as all persons who identify as being part of racial/ethnic groups besides white, non-hispanic. In the course of performing a Title VI Equity Analysis for possible disparate impact, TriMet will analyze how the proposed major service change or fare change action could impact minority populations, as compared to non-minority populations. In the event the proposed action has an adverse impact that affects protected populations more than other populations at a level that exceeds the benchmarks established in the adopted Disparate Impact Policy, or that restricts the benefits of the service change to protected populations, the finding would be considered as a potential Disparate Impact. Given a potential Disparate Impact, TriMet will evaluate whether there is an alternative that would serve the same objectives and with a more equitable impact. Otherwise, TriMet will take measures to minimize or mitigate the adverse impact of the proposed action. The Disparate Impact Policy defines measures for determination of potential Disparate Impact on minority populations resulting from Major Service Changes or any change in fares. The policy is applied to both adverse effects and benefits of Major Service Changes. Adverse effects of service changes are defined as: 1. A decrease in the level of transit service (span in days and/or hours, and/or frequency); and/or 2. Decreased access to comparable transit service, which is defined as an increase of the access distance to beyond one-quarter mile of bus stops or one-half mile of rail stations. The determination of disparate impact associated with service changes is defined separately for impacts of changes on an individual line, and for system-level impacts of changes on more than one line, as well as for both service reductions and service improvements. 1. In the event of potential adverse effects resulting from service reductions: a) A Major Service Change to a single line will be considered to have a potential Disparate Impact if the percentage of impacted minority population in the service area of the line exceeds the percentage of minority population of the TriMet District as a whole by at least 3 percentage points (e.g., 31 percent compared to 28 percent). b) To determine the system-wide impacts of Major Service Change reductions on more than one line, the percentage of the TriMet district s minority population that is impacted is compared to the percentage of the TriMet district s non-minority population that is impacted. If the percentage of the minority population impacted is at least 20 percent greater than the percentage of the non-minority population impacted (e.g., 12 percent compared to 10 percent), the overall impact of changes will be considered disparate. FY2019 Annual Service Plan Equity Analysis Page 3
7 2. In the event of service improvements: a) A major service change to a single line will be considered to have a potential Disparate Impact if: i. The improvement is linked to other service changes that have disproportionate and adverse effects on minority populations, or; ii. The percentage of impacted minority population in the service area of the line is less than the percentage of minority population of the TriMet District as a whole by at least 3 percentage points (e.g., 25 percent compared to 28 percent). b) To determine the system-wide impacts of major service change improvements on more than one line, the percentage of the TriMet district s minority population that is impacted is compared to the percentage of the TriMet district s non-minority population that is impacted. If the percentage of the minority population impacted is at least 20 percent less than the percentage of the non-minority population impacted (e.g., 8 percent compared to 10 percent), the overall impact of changes will be considered disparate. 3. Additional considerations to complement the quantitative Disparate Impact analysis above may include evaluating impacts to accessing employment, education, food, or health care for minority populations. Upon determination of Disparate Impact, TriMet will either: a) Alter the service proposal to avoid, minimize, or mitigate potential Disparate Impacts, or; b) Provide a substantial legitimate justification for keeping the proposal as-is, and show that there are no alternatives that would have a less Disparate Impact on minority riders but would still accomplish the project or program goals. C. Disproportionate Burden Policy Testing for Disproportionate Burden evaluates potential effects on low-income riders or populations, defined as at or below 150% of the federal poverty level. The line and system level evaluations are identical to those used to determine potential Disparate Impacts, but compare low-income and higher income populations rather than minority and non-minority populations. III. Proposed Service Changes A. Description of Changes Table 1 lists the proposed service changes by the quarter in which they would take effect. Most changes proposed for the next year are service increases. However, one of the proposed changes (Line 79) include the removal of service to some stops as part of their proposed routing changes. FY2019 Annual Service Plan Equity Analysis Page 4
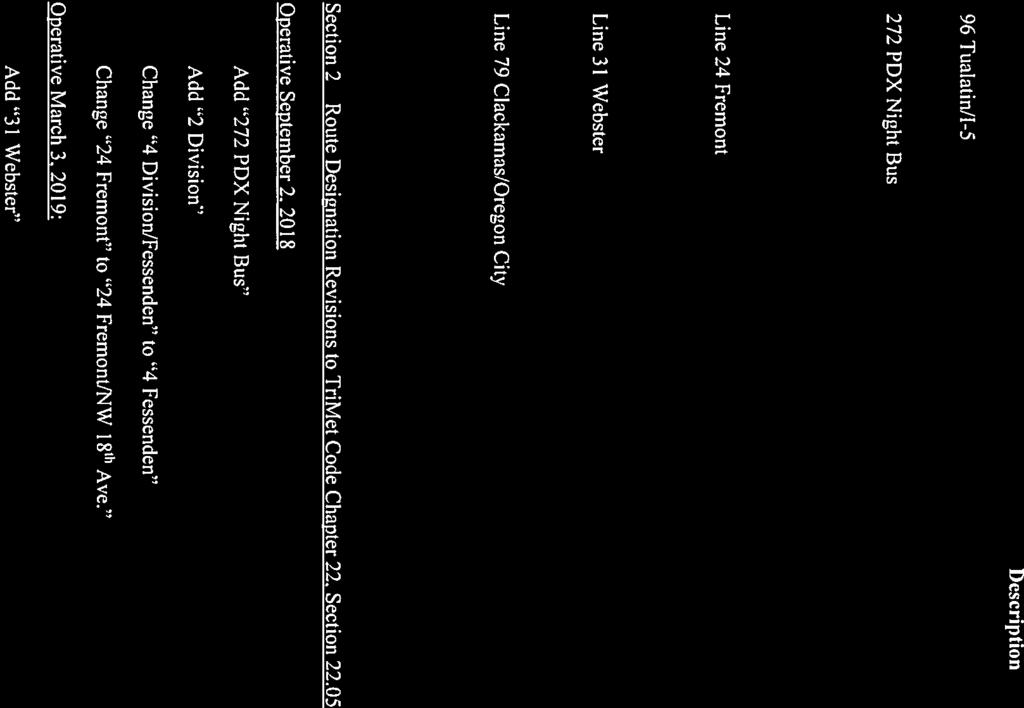
8 Table 1: Proposed Service Changes in FY19 Annual Service Plan Quarter Line Service Change Description 4 - Division/Fessenden 61 - Marquam Hill/Beaverton One route between Gresham Transit Center and Downtown Portland One route between Downtown Portland and St. Johns Add earlier and later trips during the weekday Fall 2018 Spring Marquam Hill/Tigard 66 - Marquam Hill/ Hollywood 68 - Marquam Hill/Collins Circle nd Avenue 81 - Kane/257th 96 - Tualatin/I Airport Bus Line (New) 24 - Fremont 31 - Webster Line (New) Add earlier and later trips during the weekday Add earlier and later trips during the weekday Add earlier and later trips during the weekday Increase weekday midday frequency. Increase weekday peak frequency Add earlier and later trips during the weekday Add midday service between Tualatin and Downtown Portland New line connecting Burnside Street via 82 nd Avenue to Portland International Airport Extend route over the Fremont Bridge to NW Portland and Goose Hollow in SW Portland Increase weekday frequency Add weekend service New line connecting Clackamas Town Center and Oregon City Transit Center Change route to 82 nd Avenue, I-205, and 79 - Clackamas/Oregon City Washington Street Eliminate service on Strawberry Lane Note: The FY19 Annual Service Plan also includes some minor changes to several bus lines (17, 20, 35, 56, 57, and 94) for the purpose of addressing reliability and capacity issues. These changes are not included in this analysis because they are too small to reach the Major Service Change threshold. FY2019 Annual Service Plan Equity Analysis Page 5
9 B. Major Service Change Test To determine whether individual service changes meet the definition of Major Service Change, current and proposed service are compared in terms of route length, frequency, and span (hours) of service. Changes of 15% or more qualify as Major Service Changes, including changes meeting this threshold cumulatively over the course of three years. Results of the comparison are shown in Table 2. To summarize, these changes meet TriMet s adopted Title VI Major Service Change definition: Line 4 Division/Fessenden: Split line Line 24 Fremont: Route length change of over 15%; Frequency increase of over 15% on weekdays; New weekend service Line 31 Webster: New bus line Line 61 Marquam Hill/Beaverton: Change in span of over 15% on weekdays Line 64 Marquam Hill/Tigard: Change in span of over 15% on weekdays Line 66 Marquam Hill/Hollywood: Change in span of over 15% on weekdays Line 68 Marquam Hill/Collins Circle: Change in span of over 15% on weekdays Line nd Avenue: Frequency increase of over 15% on weekdays Line 79 - Clackamas/Oregon City: Route length change of over 15% Line 81 Kane/257 th : Frequency increase of over 15% on weekdays; Change in span of over 15% on weekdays Line 96 Tualatin/I-5: Frequency increase of over 15% on weekdays Line 272 Airport Bus: New bus line FY2019 Annual Service Plan Equity Analysis Page 6
10 Table 2: Results of Major Service Change Test by Line Line Change in Route Length Change in Span Change in Frequency Line Split New Line or New Service Line Airport Bus Line 31 - Webster Line 4 - Division/Fessenden Line 24 - Fremont +61% Line 24 - Fremont (Weekday) +114% Line 24 - Fremont (Saturday) Line 24 - Fremont (Sunday) Line 61 - Marquam Hill/Beaverton Line 64 - Marquam Hill/Tigard Line 66 - Marquam Hill/Hollywood Line 68 - Marquam Hill/Collins Circle Line nd Avenue (Weekday) +38% +37% +33% +27% +27% *Line 79 - Clackamas/Oregon City +36% -59% Line 81 - Kane/257th (Weekday) +160% +49% Line 96 - Tualatin/I-5 +33% *Proposed routing changes include both removing and adding portions to Line 79. FY2019 Annual Service Plan Equity Analysis Page 7
11 C. Line-level Analyses Having identified the service changes which meet the definition of Major Service Change, the next step in the analysis is to look at each line individually to determine potential Disparate Impacts (minority populations) and/or Disproportionate Burdens (low-income populations). Both service reductions and service increases are analyzed. For service reductions, the analysis examines whether adverse effects are disproportionately borne by minority and/or low-income populations. On the other hand, for service increases the analysis examines the extent to which the benefits of the improvements are inclusive of minority and low-income populations. The line-level analysis compares minority and low-income populations for the service area of each line proposed for a Major Service Change to the minority and low-income populations of the TriMet District as a whole. The analysis is separated by type of service change being proposed: 1. Major Service Reduction 2. Major Service Increases 3. Other Major Service Changes 1. Major Service Reduction For service reductions the analysis examines whether adverse effects (defined on pg. 3) are disproportionately borne by minority or low-income populations. If adverse effects are identified and a line s minority and/or low-income populations are at least 3 percentage points greater than the minority or low-income populations for the TriMet District as a whole, the proposed change is flagged as a potential Disparate Impact or Disproportionate Burden. The proposal for the Line 79 includes the only Major Service Reduction in this service plan. Line 79 (Route streamlining, including stop removals) 3 The Line 79 route change would improve connections between Oregon City Transit Center and Clackamas Town Center. Doing so would remove Line 79 service from a total of 9 stops, including both directions of service. Seven of these stops (which serve 40 out of the 44 daily ons/offs) have comparable service within ¼ mile, and the population in the surrounding area is 17% minority and 20% low-income, as shown in Figures 2 and 3. Thirty-six of the current stops served by Line 79, along Webster, Oatfield, E. Dartmouth, W. Arlington, and McLoughlin Blvd, will be served by the new Webster Line. Two stops, where the remaining 4 daily ons/offs occur, do not have comparable service within ¼ mile, thereby meeting the definition of adverse effect (see Table 3). The population in the area surrounding these stops is 15% minority and 16% low-income, which are below the Disparate Impact threshold (31%) and Disproportionate Burden threshold (27%) for Major Service Reductions. Thus, there is no Disparate Impact and no Disproportionate Burden. 3 This section only analyzes the service reduction component of the Line 79 service change proposal. The analysis of the service increase component is provided in the next section. FY2019 Annual Service Plan Equity Analysis Page 8
12 Table 3: Stops and populations impacted by routing changes to Line 79 No. of Stop s Total daily ons/offs (weekdays) Pct. Population Minority Pct. Population Low- Income Service Removed % 20% Nearest comparable service Less than ¼ mile % 20% Over ¼ mile* % 16% *Adverse effect applies Figure 2: Minority Population Comparison Proposed Line 79 (Coverage Removed) Major Service Reduction Pct. Population Minority 35% 30% 25% 20% 15% 10% 5% Minority population below threshold = No line-level Disparate Impact 31% 17% 15% 0% Line 79 (entire impacted area) Line 79 (adverse effect area) Disp Impact Threshold Source: American Community Survey, block group level FY2019 Annual Service Plan Equity Analysis Page 9
13 Figure 3: Low-income Population Comparison Proposed Line 79 Major Service Reduction Pct. Population Low-income 35% 30% 25% 20% 15% 10% 5% 0% Low-income population below threshold = No line-level Disproportionate Burden 20% Line 79 (entire impacted area) 16% Line 79 (adverse effect area) 27% Disp Burden Threshold Source: American Community Survey, block group level. Low-income defined as at or below 150% federal poverty level. In terms of access 4, this change would remove service from: About 7,626 jobs o 62% are low-to-medium wage jobs, which is higher than the TriMet district average o 9% are jobs held by people of color, which is lower than the TriMet district average o 8% are jobs held by Hisp/Latino workers, which is similar to the TriMet district average 2. Major Service Increases For service increases, the analysis examines the extent to which the benefits of the improvements are inclusive of minority and low-income populations. Figure 4 displays the minority population along each line 5 proposed for a major increase as compared to the 25% Disparate Impact threshold. Figure 5 displays the low-income population along each line as compared to the 21% Disproportionate Burden threshold. Because these are proposed service increases, protected populations falling below these thresholds are flagged for potential concerns. The narrative analysis of each individual line follows, which includes further considerations of access to jobs, education, health care, and food for minority and low-income populations. 4 Access defined as within ¼ mile of a stop on the line. For full details of access to services by line, see Attachment B. 5 Line 79 shown separately for clarity. FY2019 Annual Service Plan Equity Analysis Page 10
14 Figure 4: Minority Population Comparison Lines with proposed Major Service Increases & Disparate Impact Threshold Pct. Population Minority 45% 40% 35% 30% 25% 20% 15% 10% 5% 26% 34% Line below threshold = Flag for potential line-level Disparate Impact 25% 27% 16% 17% 26% 19% 40% 25% 25% 0% Line 81 New Bus Airport Line 24 (new route) Line 61 Line 64 Line 66 Line 68 Webster Line Line 73 Line 96 Disp Impact Threshold Source: American Community Survey, block group level Pct. Population Low-income 45% 40% 35% 30% 25% 20% 15% 10% 5% 0% Figure 5: Low-income Population Comparison Lines with proposed Major Service Increases & Disproportionate Burden Threshold Line below threshold = Flag for potential line-level Disproportionate Burden 31% Line 81 28% New Bus Airport 25% Line 24 (new route) 27% 20% 19% 41% 22% Line 61 Line 64 Line 66 Line 68 Webster Line Source: American Community Survey, block group level. Low-income defined as at or below 150% federal poverty level. 38% 25% 21% Line 73 Line 96 Disp Burden Threshold FY2019 Annual Service Plan Equity Analysis Page 11
15 Line 272 Airport Bus (New bus line) The proposed routing for this line would potentially benefit a service area population that is 33% minority and 32% low-income which are both well above the Disparate Impact (25%) and Disproportionate Burden (21%) thresholds for Major Service Increases. Thus, there is no Disparate Impact and no Disproportionate Burden at the line-level. In terms of access, this line would provide new service to: About 31,000 jobs o 64% are low-to-medium wage jobs, which is much greater than the TriMet district average o 12% are jobs held by people of color, which is equal to the TriMet district average o 9% are jobs held by Hispanic/Latino workers, which is slightly greater than the TriMet district average 4 employment and housing resource centers 3 high school 1 community health care service centers 4 grocery stores and supermarkets, two of which are Asian grocers Line 31 Webster (New bus line) The proposed routing for this line would potentially benefit a service area population that is 19% minority and 22% low-income, which are both well below the Disparate Impact (25%) and Disproportionate Burden (21%) thresholds for Major Service Increases. This indicates a potential Disparate Impact and Disproportionate Burden, calling for further examination, in particular the considerations below as well as the system-level analysis provided in the next section. In terms of access, this line would maintain service 6 to: Over 18,992 jobs o 64% are low-to-medium wage jobs, which is greater than the TriMet district average o 11% are jobs held by minorities, which is slightly less than the TriMet district average o 8% are jobs held by Hisp/Latino workers, which is similar to the TriMet district average 2 community college 2 middle school and 2 high schools, including 1 alternative high schools 4 community health care service centers 5 grocery stores/supermarkets In terms of access, this line would provide new service to: Over 1,297 jobs o 68% are low-to-medium wage jobs, which is greater than the TriMet district average o 8% are jobs held by minorities, which is less than the TriMet district average o 8% are jobs held by Hisp./Latino workers, which is similar to the TriMet district average 1 grocery store/supermarket 6 Stops removed from Line 79 will be maintained by the New Webster line FY2019 Annual Service Plan Equity Analysis Page 12
16 Line 79 Clackamas/Oregon City (Route change) The Line 79 proposal includes a route change that will serve a new area on the entire new line. As shown in Figure 6, the entire new line has a population that is 21% minority which is below the Disparate Impact threshold (25%) for Major Service Increases. This indicates a potential Disparate Impact, calling for further examination, in particular the considerations below as well as the system-level analysis provided in the next section. On the other hand, the newly served area population (see Figure 7) is 26% low-income, which is above the Disproportionate Burden threshold (21%) for Major Service Increases. Thus, there is no Disproportionate Burden at the line level. In terms of access, the route change would provide new service to: About 462 jobs o 66% are low-to-medium wage jobs, which is much greater than the TriMet district average o 4% are jobs held by minorities, which is less than the TriMet district average o 7% are jobs held by Hisp/Latino workers, which is lower than the TriMet district average 1 grocery stores/supermarkets 2 human and social services centers In terms of access, this line would improve service to: About 33,940 jobs o 62% are low-to-medium wage jobs, which is much greater than the TriMet district average o 8% are jobs held by minorities, which is less than the TriMet district average o 10% are jobs held by Hisp/Latino workers, which is above the TriMet district average 3 employment resource center 5 human and social services centers 4 grocery stores/supermarkets, including one Asian grocer Figure 6: Minority Population Comparison Proposed Line 79 (New Coverage) Major Service Increase Pct. Population Minority 35% 30% 25% 20% 15% 10% 5% 0% 21% Line 79 (entire new route) Line below threshold = flag for potential line-level Disparate Impact 17% Line 79 (newly served area) 19% Source: American Community Survey, block group level 25% Line 79 (current route) Disp Impact Threshold FY2019 Annual Service Plan Equity Analysis Page 13
17 Figure 7: Low-income Population Comparison Line 79 & Disproportionate Burden Threshold Pct. Population Low-Income 35% 30% 25% 20% 15% 10% 5% 0% Line above threshold = No line-level Disproportionate Burden 27% 26% Line 79 (entire new route) Line 79 (newly served area) Source: American Community Survey, block group level. Low-income defined as at or below 150% federal poverty level. 21% Disp Burden Threshold Line 96 Tualatin/I-5 (Weekday frequency increase) This service increase would potentially benefit a service area population that is 25% minority and 25% low-income, which are at or above the Disparate Impact and Disproportionate Burden thresholds for Major Service Increases. Thus, there is no Disparate Impact and Disproportionate Burden at the line level. The frequency increase would improve service to: Over 99,000 jobs o 48% are low-to-medium wage jobs, which is less than the TriMet district average o 11% are jobs held by minorities, which is slightly less than the TriMet district average o 7% are jobs held by Hisp./Latino workers, which is slightly less than the TriMet district average 6 high schools, 5 of which are private 11 grocery stores/supermarkets 12 human and social services centers 2 employment resource centers Line 81 Kane/257 th (Weekday frequency increase and span improvements) This service increase would potentially benefit a service area population that is 26% minority and 31% low-income, which are above the Disparate Impact and Disproportionate Burden thresholds for Major Service Increases. Thus, there is no Disparate Impact and Disproportionate Burden at the line level. FY2019 Annual Service Plan Equity Analysis Page 14
18 The frequency increase would improve service to: About 17,675 jobs o 66% are low-to-medium wage jobs, which is above the TriMet district average o 12% are jobs held by minorities, which is similar to the TriMet district average o 9% are jobs held by Hisp./Latino workers, which is above the TriMet district average 1 community college and 3 high schools 5 grocery stores/supermarkets 4 human and social services centers Line 24 (Route extended and frequency increase) The Line 24 proposal includes both a route change that will serve a new area and a frequency increase on the entire new line. As shown in Figure 6, the entire new line has a population that is 25% minority, which is equal to the Disparate Impact threshold for Major Service Increases (25%). On the other hand, the area that would be newly served by the route change to the Line 24 has a population that is 21% minority, which is below the Disparate Impact threshold for Major Service Increases (25%). This indicates a potential Disparate Impact, calling for further examination, in particular the considerations below as well as the system-level analysis provided in the next section. Figure 8: Minority Population Comparison Line 24 & Disparate Impact Threshold 35% Line below threshold = flag for potential line-level Disparate Impact Pct. Population Minority 30% 25% 20% 15% 10% 5% 21% 25% 25% 0% Line 24 (newly served area) Line 24 (entire new route) Disp Impact Threshold Source: American Community Survey, block group level FY2019 Annual Service Plan Equity Analysis Page 15
19 As shown in Figure 9, the entire new line has a population that is 27% low-income, while the area that would be newly served by the route change to the Line 24 has a population that is 27% minority. Both of these are above the Disproportionate Burden threshold for Major Service Increases (21%). Thus, there is no Disproportionate Burden at the line-level. Figure 9: Low-Income Population Comparison Line 24 & Disproportionate Burden Threshold Pct. Population Low-Income 35% 30% 25% 20% 15% 10% 5% 0% Line above threshold = No line-level Disproportionate Burden 27% 27% 21% Line 24 (newly served area) Line 24 (entire new route) Disp Burden Threshold Source: American Community Survey, block group level Thus, there is no potential Disproportionate Burden related to the route change or increase in frequency. However, there is a potential Disparate Impact related to the route change, calling for further examination, in particular the considerations below as well as the system-level analysis provided in the next section. In terms of access, the route change would provide new service to: About 26,396 jobs o 50% are low-to-medium wage jobs, which is less than the TriMet district average o 11% are jobs held by minorities, which is slightly less than the TriMet district average o 6% are jobs held by Hisp/Latino workers, which is lower than the TriMet district average 3 high schools, including 2 private high schools 8 grocery stores/supermarkets 6 human and social services centers The frequency increase would improve service to: About 39,378 jobs o 53% are low-to-medium wage jobs, which is less than the TriMet district average FY2019 Annual Service Plan Equity Analysis Page 16
20 o 12% are jobs held by minorities, which is equal to the TriMet district average o 6% are jobs held by Hisp/Latino workers, which is lower than the TriMet district average 4 employment resource centers 4 human and social services centers 7 grocery stores/supermarkets, including one Asian grocer Line nd Avenue (Weekday frequency increase) This service increase would potentially benefit a service area population that is 40% minority and 38% low-income, which are well above the Disparate Impact and Disproportionate Burden thresholds for Major Service Increases. Thus, there is no Disparate Impact and Disproportionate Burden at the line level. The frequency increase would improve service to: About 14,166 jobs o 74% are low-to-medium wage jobs, which is well above the TriMet district average o 14% are jobs held by minorities, which is above the TriMet district average o 9% are jobs held by Hisp./Latino workers, which is above the TriMet district average 1 community college campus 2 middle schools and 1 high school 4 grocery stores/supermarkets 3 human and social services centers Line 61 Marquam Hill/Beaverton (Weekday span improvements) This service increase would potentially benefit a service area population that is 27% minority and 27% low-income, both of which exceed the Disparate Impact (25%) and Disproportionate Burden (21%) thresholds for Major Service Increases. Thus, there is no Disparate Impact and no Disproportionate Burden at the line-level. In terms of access, this increase would improve service to: About 40,000 jobs o 47% are low-to-medium wage jobs, which is less than the TriMet district average o 15% are jobs held by minorities, which is greater than the TriMet district average o 6% are jobs held by Hisp./Latino workers, which is less than the TriMet district average 10 grocery stores/supermarkets, including one Asian grocer 7 community health care service centers 1 employment resource center 1 middle school and 2 high schools Line 64 Marquam Hill/Tigard (Weekday span improvements) This service increase would potentially benefit a service area population that is 16% minority and 20% low-income, both of which are below the Disparate Impact (25%) and Disproportionate Burden (21%) thresholds for Major Service Increases. This indicates a potential Disparate Impact and Disproportionate FY2019 Annual Service Plan Equity Analysis Page 17
21 Burden, calling for further examination, in particular the considerations below as well as the system-level analysis provided in the next section. In terms of access, this increase would improve service to: About 45,000 jobs o 47% are low- to-medium wage jobs, which is less than the TriMet district average o 15% are jobs held by people of color, which is greater than the TriMet district average o 7% are jobs held by Hisp/Latino workers, which is less than the TriMet district average 2 high schools 5 human and social services centers 7 grocery stores/supermarkets, including 1 Mediterranean grocer Line 66 Marquam Hill/Hollywood (Weekday span improvements) This service increase would potentially benefit a service area population that is 17% minority and 19% low-income, both of which are below the Disparate Impact (25%) and Disproportionate Burden (21%) thresholds for Major Service Increases. This indicates a potential Disparate Impact and Disproportionate Burden, calling for further examination, in particular the considerations below as well as the system-level analysis provided in the next section. In terms of access, this increase would improve service to: About 49,000 jobs o 45% are low- to-medium wage jobs, which is less than the TriMet district average o 14% are jobs held by people of color, which is greater than the TriMet district average o 6% are jobs held by Hisp/Latino workers, which is less than the TriMet district average 1 employment resource center 1 high school 8 community health care service centers 3 human and social services centers 10 grocery stores/supermarkets Line 68 Marquam Hill/Beaverton (Weekday span improvements) This service increase would potentially benefit a service area population that is 26% minority and 41% low-income, both of which exceed the Disparate Impact (25%) and Disproportionate Burden (21%) thresholds for Major Service Increases. Thus, there is no Disparate Impact and no Disproportionate Burden at the line-level. In terms of access, this increase would improve service to: About 42,000 jobs o 39% are low-to-medium wage jobs, which is less than the TriMet district average o 15% are jobs held by minorities, which is greater than the TriMet district average o 5% are jobs held by Hisp./Latino workers, which is less than the TriMet district average 3 high schools FY2019 Annual Service Plan Equity Analysis Page 18
22 2 alternative/trade schools 2 grocery store/supermarkets 8 human and social services centers 3. Other Major Service Changes One of the proposed changes, while qualifying as a Major Service Changes, does not necessarily increase or reduce service. Evaluating potential distribution of adverse effects or benefits of the changes is not applicable, and therefore there is no potential Disparate Impact and no potential Disproportionate Burden under TriMet s Title VI policies. Even so, TriMet still analyzed the details of the proposed changes for potential equity impacts. Line 4 Division/Fessenden (Line split) The Line 4 is proposed to be split into two lines and would share stops Downtown Portland. The first segment of the route would run between St. Johns and Downtown Portland and the second segment would run between Downtown Portland and the Gresham Transit Center. There would be no service increase or reduction after the split. As shown in Figures 10 and 11, the service area for each route segment have minority and low-income populations well above average for the TriMet district. Thus, there is no Disparate Impact and no Disproportionate Burden at the line-level. Figure 10: Minority Population Comparison Proposed Line 4 Line Split & TriMet District Pct. Population Minority 45% 40% 35% 30% 25% 20% 15% 10% 5% 0% No service increase or reduction after split. 36% 32% 28% Line 2 (Fessenden to Downtown) Line 4 (Division to Downtown) TriMet District Source: American Community Survey, block group level FY2019 Annual Service Plan Equity Analysis Page 19
23 Figure 11: Low-income Population Comparison Proposed Line 4 Line Split & TriMet District No service increase or reduction after split. Pct. Population Low-income 45% 40% 35% 30% 25% 20% 15% 10% 5% 0% 37% 36% Line 2 (Fessenden to Downtown) Line 4 (Division to Downtown) TriMet District 24% Source: American Community Survey, block group level. Low-income defined as at or below 150% federal poverty level. D. System-level Analysis Because more than one line is proposed for a Major Service Change, a system-level analysis is required in addition to the line-level analysis. The system-level analysis aims to measure impacts of all Major Service Changes combined to determine how equitable the impacts would be across racial/ethnic and economic lines. Service increases and service reductions are analyzed separately in order to examine both potential system-level adverse effects and distribution of benefits. System-level Disparate Impact Analysis: Major Service Increases The system-level Disparate Impact analysis of Major Service Increases is completed by determining what portion of the TriMet District s minority population stands to benefit from the Major Service Change improvements, and comparing that to the portion of the District s non-minority population that potentially benefits. A potential Disparate Impact would exist if minority populations benefitted substantially less than non-minority populations. The way we measure this is to test whether 20% less (or 4/5) of the District s minority than non-minority population stood to benefit from the improvements. FY2019 Annual Service Plan Equity Analysis Page 20
24 Table 4 and Figure 12 compare the positively impacted minority and non-minority populations. A slightly greater percentage of the District s non-minority population stands to benefit by the proposed Major Service Increase compared to the minority population (20% vs. 19.1%, respectively). However, the difference does not meet the Disparate Impact Threshold of 16%: given the 20% of the non-minority population will benefit from the increases, the percentage of the minority population impacted would have to be at least 16% to meet the definition of a system-level Disparate Impact. Therefore, no System-level Disparate Impact is found related to the proposed Major Service Increases. Table 4: System-level Disparate Impact Analysis of Major Service Increases Pct. of TriMet District Non-Minority Pop Positively Impacted Minority Pop Disparate Impact Threshold Pct. of TriMet District Minority Pop Positively Impacted Potential Disparate Impact? 20% Less than 16% 19.1% No Figure 12: System-level Impacts of Proposed FY19 Major Service Increases Minority and Non-minority Populations Minority Pop 19.1% 81.5% Impacted (Positively) Not Impacted Non-Minority Pop 20.0% 80.7% 0% 50% 100% System-level Disparate Impact Analysis: Major Service Reductions The system-level Disparate Impact analysis of Major Service Reductions is completed by determining what proportion of the TriMet District s minority population is potentially adversely impacted from the service reductions and comparing that to the District s non-minority population that may be adversely impacted. A potential Disparate Impact would exist if minority populations were impacted substantially more by service reductions than non-minority populations. The way we measure this is to test whether 20% more of the District s minority than non-minority population were impacted by the service reductions. Table 5 and Figure 13 compare the impacted minority and non-minority populations. A greater percentage of the District s non-minority population is potentially impacted by the proposed Major Service Reductions as compared to the minority population (0.9% vs. 0.4%, respectively). Therefore, no System-level Disparate Impact is found related to the proposed Major Service Reductions. FY2019 Annual Service Plan Equity Analysis Page 21
25 Table 5: System-level Disparate Impact Analysis of Major Service Reductions Pct. of TriMet District Non- Minority Pop Impacted Minority Pop Disparate Impact Threshold Pct. of TriMet District Minority Pop Impacted Potential Disparate Impact? 0.9% Greater than 1% 0.4% No Figure 13: System-level impacts of proposed FY19 Major Service Reductions Minority and Non-minority Populations Minority Pop 0.4% 99.6% Impacted by Reductions Not Impacted Non-Minority Pop 0.9% 99.1% 0% 50% 100% System-level Disproportionate Burden Analysis: Major Service Increases The System-level Disproportionate Burden analysis is completed by determining what proportion of the TriMet District s low-income population is positively impacted by the Major Service Increases, and comparing that to the District s higher income population that is positively impacted. Higher income includes all persons above the low-income threshold of 150% of the federal poverty level. A potential Disproportionate Burden would exist if low-income populations benefitted substantially less than higher income populations. The way we measure this is to test whether 20% less (or 4/5) of the District s lowincome than higher income population stands to benefit from the improvements. Table 6 and Figure 14 compare the impacted low-income and higher income populations. A greater percentage of the District s low-income population stands to benefit from the proposed Major Service Increases as compared to the higher income population (23% vs. 18.6%, respectively). Therefore, no System-level Disproportionate Burden is found related to the proposed Major Service Increases. FY2019 Annual Service Plan Equity Analysis Page 22
26 Table 6: System-level Disproportionate Burden Analysis of Major Service Increases Pct. of TriMet District Higher Income Pop Positively Impacted Low-Income Pop Disparate Impact Threshold Pct. of TriMet District Low Income Pop Positively Impacted Potential Disproportionate Burden? 18.6% Less than 15% 23% No Figure 14: System-level Impacts of Proposed FY19 Major Service Increases Low-income and Higher Income Populations Low-Income Pop 23.0% 78.0% Impacted (Positively) Not Impacted Higher Income Pop 18.6% 82.0% 0% 50% 100% System-level Disproportionate Burden Analysis: Major Service Reductions The system-level Disproportionate Burden analysis is completed by determining what proportion of the TriMet District s low-income population is potentially adversely impacted from the service reductions and comparing that to the District s higher income population that may be adversely impacted. Higher income includes all persons above the low-income threshold of 150% of the federal poverty level. A potential Disproportionate Burden would exist if low-income populations were impacted substantially more by service reductions than higher income populations. The way we measure this is to test whether 20% more of the District s low-income than higher income population were impacted by the service reductions. Table 7 and Figure 15 compare the impacted low-income and higher income populations. A greater percentage of the District s higher income population is potentially impacted by the proposed Major Service Reductions as compared to the low-income population (0.8% vs. 0.5%, respectively). Therefore, no system-level Disparate Impact is found related to the proposed Major Service Reductions. FY2019 Annual Service Plan Equity Analysis Page 23
27 Table 7: System-level Disproportionate Burden Analysis of Major Service Reductions Pct. of TriMet District Higher Income Pop Positively Impacted Low-Income Pop Disparate Impact Threshold Pct. of TriMet District Low Income Pop Positively Impacted Potential Disproportionate Burden? 0.8% Greater than 0.96% 0.5% No Figure 15: System-level impacts of proposed FY19 Major Service Reductions Low-income and Higher Income Populations Low-Income Pop 0.5% 99.5% Impacted by Reductions Not Impacted Higher Income Pop 0.8% 99.2% 0% 50% 100% IV. Community Engagement The service proposals analyzed in this report stem from a multi-year planning and outreach process to develop a vision for future transit service in the Portland metropolitan region. Divided by sub-region of the TriMet service district, these Service Enhancement Plans were undertaken to identify and prioritize opportunities to improve bus service as well as pedestrian and bike access to transit, given current and projected population and job growth. These are long-range plans which include dozens of bus service improvements beyond those proposed for implementation over the next year. 7 An initial FY19 service plan was developed in fall 2017, at which point TriMet posted the proposed changes on trimet.org to solicit feedback, placed advertisements in newspapers across the service district, conducted on-board outreach and sent postcards to nearby residents of lines with proposed routing changes, presented the proposal to the Transit Equity Advisory Committee, sent s to riders and other stakeholders, and staff held seven TriMet Open Houses. Based on feedback received, TriMet modified the plan by: 1. Selecting 82 nd Avenue as the preferred route option for the New Airport Bus line; and 7 For more information, go to FY2019 Annual Service Plan Equity Analysis Page 24
28 2. Extending Line 24-Fremont over the Fremont Bridge to Goose Hollow in SW Portland, where it would connect with MAX Blue and Red line service. The Line 24 will continue to serve the stops, including Legacy Emmanuel Hospital, on Vancouver and Williams all the way to Russell. For the second phase of outreach, the updated plan was posted to trimet.org and many elements of the initial outreach phase were repeated (postcards, newspaper advertisements, s). TriMet held an open house on February 15, 2018 in North Portland to solicit feedback about the updated proposal. Finally, TriMet held a public hearing at its March 28, 2018 board meeting to receive comments on the proposed service changes. Responses overall were positive about the proposal. The following is a summary of themes across the feedback received: Strong community support for the proposed new Airport Bus line on SE 82 nd Ave. Support for the service increases to OHSU with Lines 61, 64, 66, and 68 Strong community support for the proposed new Webster line. Support from the City of Troutdale for the proposed routing changes to the Lines 81 and 96. Strong community support for the proposed all night service with Lines 20 and 57. Advocacy to continue to serve Emanuel Hospital and N Vancouver/Williams; informing decision to continue service on Line 24. V. Summary of Findings Table 8 on the next page summarizes the results of the line-level and system-level Disparate Impact and Disproportionate Burden analyses. As shown, Title VI concerns are minimal with the proposed FY19 Annual Service Plan. The proposal promises to improve service significantly for minority and low-income populations, with only three improvements (to the Lines 64, 66 and 31 New Webster Line) serving areas with relatively low minority populations. Lines 64 and 66 improvements also serve a relatively low proportion of low-income households as compared to the TriMet district. However, improving service on these lines does not raise concerns of an inequitable distribution of benefits given: a) the results of the system-level analysis; b) that the other 9 lines proposed for improvements did not have any line-level Disparate Impacts; and c) that the other 10 lines proposed for improvements did not have any line-level Disproportionate Burdens. The one proposed service reduction (to the Line 79) also does not appear to create disproportionate and adverse effects given the low concentrations of minority and low-income populations potentially impacted. FY2019 Annual Service Plan Equity Analysis Page 25
29 Table 8: Summary of Disparate Impact and Disproportionate Burden analysis results Potential Disparate Impact? Potential Disproportionate Burden? Major Service Reduction 79 Clackamas/Oregon City No No 272 Airport Bus (New) No No 31 Webster (New) Yes No 24 Fremont No No 61 Marquam Hill/Beaverton No No Major Service Increases 64 Marquam Hill/Tigard Yes Yes 66 Marquam Hill/Hollywood Yes Yes 68 Marquam Hill/Collins Circle No No nd Avenue No No 79 Clackamas/Oregon City No No 81 Kane/257th No No 96 Tualatin/I-5 No No Combined Improvements (System-level) No No Other Major Service Changes Line 4 Division/Fessenden No No FY2019 Annual Service Plan Equity Analysis Page 26
30 Attachment A: Analysis of impact on access to employment, education, health care, and food for minority and low-income populations
31 Employment Line 272 Airport Night Bus New Line to serve Airport via NE 82 nd Avenue Creates new access Improves access Removes access Reduces access Creates new access to an estimated 31,000 jobs Low/Medium Wage Jobs* Jobs Held by Workers of Color* 14% 12% 56% 55% Employment Resource Centers IRCO Impact NW JOIN Transition Projects Education & Educational Madison High Helensview HS Hand in Hand Center for Jewish-Arab Education in Israel Community Health Care Grocery Stores & Supermarkets 211info Walgreens (2 locations) China Foods Wholesale La Bouffe International Gourmet Jobs Held by Hispanic/Latino Workers* New Bus Airport 8% 8% TriMet District *Low/Medium wage jobs defined as having earnings of under $3,333 per month, or about $40,000 per year. Jobs held by workers of color include jobs where the race indicated was not White Alone. Jobs held by Hispanic/Latino workers include jobs where the ethnicity indicated was Hispanic/Latino. Source: US Census Bureau. DRAFT FY2019 Annual Service Plan Equity Analysis Page A-2
32 IMPROVE ACCESS NEW ACCESS Line 31 Webster Rd New line connecting Clackamas TC and Oregon City TC Creates new access Improves access Removes access Reduces access Employment Employment Resource Centers Education & Educational Maintains access to an estimated 18,992 jobs N/A Clackamas Comm. Col Low/Medium Wage Jobs* Jobs Held by Workers of Color* Jobs Held by Hispanic/Latino Workers* New Webster Line 8% 12% 11% 8% 64% 55% Clackamas Middle College Kraxberger Middle NW Alternative School Sabin- Schellenberg Center South Creates access to an estimated 1,297 jobs N/A Sabin- Schellenberg Low/Medium Wage Jobs* Jobs Held by Workers of Color* Jobs Held by Hispanic/Latino Workers* 8% 12% 8% 8% TriMet District 68% 55% Center North Community Health Care Los Ninos Cuentan Central City Concern Roth Senior Care Recovery Association Project, Inc N/A Grocery Stores & Supermarkets Walgreens (2 locations) Safeway Natural Grocers by Vitamin Cottage Rite Aide Safeway Webster Line (new coverage area) TriMet District *Low/Medium wage jobs defined as having earnings of under $3,333 per month, or about $40,000 per year. Jobs held by workers of color include jobs where the race indicated was not White Alone. Jobs held by Hispanic/Latino workers include jobs where the ethnicity indicated was Hispanic/Latino. Source: US Census Bureau. DRAFT FY2019 Annual Service Plan Equity Analysis Page A-3
33 NEW ACCESS Line 79 Clackamas/Oregon City Route change to serve 82 nd Ave and I-205. Streamlining trip between Clackamas TC and Oregon City TC Creates new access Improves access Removes access Reduces access Employment Employment Resource Centers Education & Educational Creates new access to an estimated 462 jobs N/A Living Room Low/Medium Wage Jobs* Jobs Held by Workers of Color* Jobs Held by Hispanic/Latino Workers* 4% 12% 7% 8% 66% 55% Community Health Care Recovery Association Project, Inc. Anger Mgmt Agency Grocery Stores & Supermarkets Safeway Line 79-new TriMet District IMPROVED ACCESS Improves access to an estimated 33,940 jobs N/A Clackama s Comm. Col Low/Medium Wage Jobs* Jobs Held by Workers of Color* Jobs Held by Hispanic/Latino Workers* Line 79-improved 8% 12% 10% 8% TriMet District 62% 55% Clackama s Middle College Sabin- Schellenb erg Center South Central City Concern Clinic North Clackamas DHS Roth Senior Care Los Nino Cuentan Recovery Assoc. Proj. Safeway Cash & Carry Tombstone Grocery Natural Grocers by Vitamin Cottage DRAFT FY2019 Annual Service Plan Equity Analysis Page A-4
34 REMOVED ACCESS Removes access to an estimated 7,626 jobs N/A N/A N/A Safeway Low/Medium Wage Jobs* Jobs Held by Workers of Color* Jobs Held by Hispanic/Latino Workers* 9% 12% 8% 8% 62% 55% Line 79-removed TriMet District *Low/Medium wage jobs defined as having earnings of under $3,333 per month, or about $40,000 per year. Jobs held by workers of color include jobs where the race indicated was not White Alone. Jobs held by Hispanic/Latino workers include jobs where the ethnicity indicated was Hispanic/Latino. Source: US Census Bureau. DRAFT FY2019 Annual Service Plan Equity Analysis Page A-5
35 Employment Line 61 Marquam Hill/Beaverton Added frequency on Weekdays Creates new access Improves access Removes access Reduces access Improves access to an estimated 40,332 jobs Low/Medium Wage Jobs* Jobs Held by Workers of Color* Jobs Held by Hispanic/Latino Workers* Line 61 6% 8% 15% 12% TriMet District 47% 55% *Low/Medium wage jobs defined as having earnings of under $3,333 per month, or about $40,000 per year. Jobs held by workers of color include jobs where the race indicated was not White Alone. Jobs held by Hispanic/Latino workers include jobs where the ethnicity indicated was Hispanic/Latino. Source: US Census Bureau. Employment Resource Centers Mentors 360 Education & Educational Wilson HS Hilltop School of Music Sylvan Learning Center Gray Middle School Jesuit HS Community Health Care OHSU Child Foundation Neighborhood House Handy Hands American Veterans Aid Center for Behavioral Health G & J Home Care Grocery Stores & Supermarkets Food Front Cooperative Grocery Safeway Rite Aid Trader Joes Walgreen Uwajimaya Ross Island Grocery and Café New Seasons Natural Grocers Albertsons DRAFT FY2019 Annual Service Plan Equity Analysis Page A-6
36 Employment Line 64 Marquam Hill/Tigard Added frequency on Weekdays Creates new access Improves access Removes access Reduces access Improves access to an estimated 45,327 jobs Low/Medium Wage Jobs* Jobs Held by Workers of Color* Jobs Held by Hispanic/Latino Workers* Line 64 9% 8% 13% 12% TriMet District 47% 55% *Low/Medium wage jobs defined as having earnings of under $3,333 per month, or about $40,000 per year. Jobs held by workers of color include jobs where the race indicated was not White Alone. Jobs held by Hispanic/Latino workers include jobs where the ethnicity indicated was Hispanic/Latino. Source: US Census Bureau. Employment Resource Centers Mentors 360 Education & Educational Wilson HS Westside Christian HS Community Health Care OHSU Luke-Dorf Behavioral Health Service Neighborhood House Oregon Coalition Against Domestic Violence Regency Home Care Infinite Care Giving Zero to Three Grocery Stores & Supermarkets Food Front Cooperative Grocery Rite Aid Walgreen Ross Island Grocery and Café Cash & Carry Natural Grocers Halal Meat & Mediterranean Food DRAFT FY2019 Annual Service Plan Equity Analysis Page A-7
37 Employment Line 66 Marquam Hill/Hollywood Added frequency on Weekdays Creates new access Improves access Removes access Reduces access Improves access to an estimated 49,827 jobs Low/Medium Wage Jobs* Jobs Held by Workers of Color* Jobs Held by Hispanic/Latino Workers* Line 66 6% 8% 13% 12% TriMet District 45% 55% *Low/Medium wage jobs defined as having earnings of under $3,333 per month, or about $40,000 per year. Jobs held by workers of color include jobs where the race indicated was not White Alone. Jobs held by Hispanic/Latino workers include jobs where the ethnicity indicated was Hispanic/Latino. Source: US Census Bureau. Employment Resource Centers Dress for Success of Oregon Education & Educational Cleveland HS Mother and Child Education Center Resolutions NW Big Brothers Big Sisters Community Health Care OHSU Hollywood Senior Center DHS-CAF Cascadia Behavioral Healthcare Homewatch Care Givers of Portland Impact NW On the Move Community Integration Catholic Community Grocery Stores & Supermarkets People s Food Cooperative Grocery Rite Aid (2 locations) Safeway Walgreens (2 locations) Ross Island Grocery and Café Trader Joes Hollywood Grocery Outlet New Seasons DRAFT FY2019 Annual Service Plan Equity Analysis Page A-8
38 Employment Line 68 Marquam Hill/Collins Circle Added frequency on Weekdays Creates new access Improves access Removes access Reduces access Improves access to an estimated 43,840 jobs Low/Medium Wage Jobs* Jobs Held by Workers of Color* Jobs Held by Hispanic/Latino Workers* Line 68 5% 8% 14% 12% TriMet District 39% 55% *Low/Medium wage jobs defined as having earnings of under $3,333 per month, or about $40,000 per year. Jobs held by workers of color include jobs where the race indicated was not White Alone. Jobs held by Hispanic/Latino workers include jobs where the ethnicity indicated was Hispanic/Latino. Source: US Census Bureau. Employment Resource Centers Rural Community Assistance Corporation NeighborWorks America Education & Educational Lincoln HS St. Mary s Academy School Outside In- Urban Ed Portland Chinese School The Northwest Academy Community Health Care OHSU Central City Concern NARA Outpatient Oregon Hospice Association Senior Service America Portland Homeless Family Solutions Impact NW Northwest Pilot Project Grocery Stores & Supermarkets Safeway Ross Island Grocery and Cafe DRAFT FY2019 Annual Service Plan Equity Analysis Page A-9
39 Employment Line nd Avenue Added frequency on Weekdays Creates new access Improves access Removes access Reduces access Improves access to an estimated 14,166 jobs Low/Medium Wage Jobs* Jobs Held by Workers of Color* Jobs Held by Hispanic/Latino Workers* Line 73 9% 12% 14% 8% TriMet District 55% 74% *Low/Medium wage jobs defined as having earnings of under $3,333 per month, or about $40,000 per year. Jobs held by workers of color include jobs where the race indicated was not White Alone. Jobs held by Hispanic/Latino workers include jobs where the ethnicity indicated was Hispanic/Latino. Source: US Census Bureau. Employment Resource Centers N/A Education & Educational Alice Ott Middle School Parkrose HS Mt Hood Community College Sylvan Learning Center Community Health Care NARA Wellness and Youth Center Multiple Sclerosis Society of Portland Human Solutions Grocery Stores & Supermarkets Walgreens (2 locations) Safeway (2 locations) Rite Aid Hong Phat Market New Day Market 5C Quick Mart Tawakal Gorcery Halal Division Grocery Outlet DRAFT FY2019 Annual Service Plan Equity Analysis Page A-10
40 Employment Line 81 Kane/257th Added frequency on Weekdays Creates new access Improves access Removes access Reduces access Improves access to an estimated 17,675 jobs Low/Medium Wage Jobs* Jobs Held by Workers of Color* Jobs Held by Hispanic/Latino Workers* 9% 12% 12% 8% 66% 55% Employment Resource Centers N/A Education & Educational Mt. Hood Community College Burlingame Creek HS Reynolds HS Gresham HS Community Health Care YWCA of Greater Portland Gresham Senior Center Impact NW Morrison Child and Family Grocery Stores & Supermarkets Walgreens Safeway Rite Aid Albertsons Tienda San Miguel Line 81 TriMet District *Low/Medium wage jobs defined as having earnings of under $3,333 per month, or about $40,000 per year. Jobs held by workers of color include jobs where the race indicated was not White Alone. Jobs held by Hispanic/Latino workers include jobs where the ethnicity indicated was Hispanic/Latino. Source: US Census Bureau. DRAFT FY2019 Annual Service Plan Equity Analysis Page A-11
41 Employment Line 96 Tualatin/I-5 Added frequency on Weekdays Creates new access Improves access Removes access Reduces access Improves access to an estimated 99,524 jobs Low/Medium Wage Jobs* Jobs Held by Workers of Color* Jobs Held by Hispanic/Latino Workers* Line 96 7% 12% 11% 8% TriMet District 48% 55% *Low/Medium wage jobs defined as having earnings of under $3,333 per month, or about $40,000 per year. Jobs held by workers of color include jobs where the race indicated was not White Alone. Jobs held by Hispanic/Latino workers include jobs where the ethnicity indicated was Hispanic/Latino. Source: US Census Bureau. Employment Resource Centers Rural Community Assistance Corporation Pathfinders of Oregon Education & Educational Tualatin HS Sylvan Learning Center Lincoln HS St. Mary s Academy School Outside In- Urban Ed Horizon HS The Northwest Academy Community Health Care Progress Health OnePoint Patient Care NARA Outpatient Payless Long Term Care Pharmacy Central City Concern Morrison Center Senior Service America Oregon Hospice Association National Indian Child Welfare Association Make-A-Wish Foundation Holt International Children s Service Oregon Coalition Against DV Grocery Stores & Supermarkets Safeway (3 locations) Trader Joes Zupan s Market Walgreens (2 locations) Walmart Ross Island Grocery and Cafe Barbur World Foods Whole Foods Market DRAFT FY2019 Annual Service Plan Equity Analysis Page A-12
42 NEW ACCESS IMPROVED ACCESS Line 24 Fremont Route length change over the Fremont Bridge to Goose Hollow. Frequency increased. Creates new access Improves access Removes access Reduces access Employment Creates new access to an estimated 26,396 jobs N/A Low/Medium Wage Jobs* Jobs Held by Workers of Color* Jobs Held by Hispanic/Latino Workers* Line 24 new 11% 12% 6% 8% 50% 55% Improves access to an estimated 39,378 jobs Low/Medium Wage Jobs* Jobs Held by Workers of Color* Jobs Held by Hispanic/Latino Workers* Line 24 improved TriMet District 6% 8% 12% 12% TriMet District 53% 55% Employment Resource Centers The Mentoring Project Kairos PDX Young Minds of Awareness Friends of the Children Education & Educational Lincoln HS Outside In- Urban Ed The Northwest Academy The Children s Institute Maximus K-12 Education Beaumont Access Alternative Program IRCO Africa House Sylvan Learning Center Community Health Care Raphael House Changing Perceptions Outside In NARA Outpatient Portland Homeless Family Solutions DVSD Ronald McDonald House Charities Grocery Stores & Supermarkets Food Front Cooperative Grocery Safeway Walgreens (3 locations) New Seasons Cash & Carry (2 locations) WinCo Safeway Walgreens (2 locations) Whole Foods New Seasons Thanh Thao Market *Low/Medium wage jobs defined as having earnings of under $3,333 per month, or about $40,000 per year. Jobs held by workers of color include jobs where the race indicated was not White Alone. Jobs held by Hispanic/Latino workers include jobs where the ethnicity indicated was Hispanic/Latino. Source: US Census Bureau. DRAFT FY2019 Annual Service Plan Equity Analysis Page A-13
43


44
45
46


47

48

49
CHERRIOTS 2018 SERVICE PLAN APPENDIX A EQUITY ANALYSIS
 CHERRIOTS 2018 SERVICE PLAN APPENDIX A EQUITY ANALYSIS 1. Background... 1 2. Title VI requirements... 1 3. SAMTD Title VI compliance... 2 3.1 Major service changes policy... 2 3.2 Definition of adverse
Equity Analysis: Honored Citizen Fare Increase DRAFT. Department of Diversity & Transit Equity
 Equity Analysis: Honored Citizen Increase DRAFT Department of Diversity & Transit Equity March 23, 2015 Executive Summary: Honored Citizen Increase Equity Analysis In accordance with Title VI of the Civil
Proposed Service Change Title VI Compliance Review
 Proposed Service Change Title VI Compliance Review May 2014 Submitted by: Table of Contents 1. Purpose... 3 2. Background... 3 3. Definition of Title VI and Environmental Justice Impact Policies... 3 3.1
Title VI Service Equity Analysis
 Pierce Transit Title VI Service Equity Analysis Pursuant to FTA Circular 4702.1B March 2017 Restructure December 2016 Pierce Transit -- Transit Development Dept. PIERCE TRANSIT TITLE VI SERVICE EQUITY
Title VI Service Equity Analysis Service Changes. Jake Warr, Diversity & Transit Equity
 Title VI Service Equity Analysis 2016-2017 Service Changes Jake Warr, Diversity & Transit Equity Title VI of the Civil Rights Acts of 1964 No person in the United States shall, on the ground of race, color
Service and Fare Change Policies. Revised Draft
 Revised Draft June 19, 2013 1. INTRODUCTION It is the policy of the Sacramento Regional Transit District (RT) to provide quality service to all customers regardless of race, color, national origin, or
REGIONAL TRANSIT ISSUE PAPER Page 1 of 3 Agenda Item No.
 REGIONAL TRANSIT ISSUE PAPER Page 1 of 3 Agenda Item No. Board Meeting Date Open/Closed Session Information/Action Item Issue Date 13 07/27/15 Open Action 07/08/15 Subject: Setting a Public Hearing on
FTA Title VI Requirements and SamTrans Service Plan Approval Schedule
 FTA Title VI Requirements and SamTrans Service Plan Approval Schedule Board of Directors January 9, 2013 Presentation Overview Title VI Overview Revised FTA Title VI requirements Impact of FTA Title VI
Title VI Approval of Major Service Change, Disparate Impact and Disproportionate Burden
 Customer Service and Operations Committee Board Action Item III-A October 10, 2013 Title VI Approval of Major Service Change, Disparate Impact and Disproportionate Burden Page 3 of 42 Washington Metropolitan
BOARD OF SUPERVISORS BUSINESS MEETING ACTION ITEM
 Date of Meeting: June 7, 2016 # 7 BOARD OF SUPERVISORS BUSINESS MEETING ACTION ITEM SUBJECT: ELECTION DISTRICT: Title VI Policies for Transit Service Countywide CRITICAL ACTION DATE: June 7, 2016 STAFF
Chapter 10 Equity and Environmental Justice
 Chapter 10 Equity and Environmental Justice Introduction An important consideration for the 2040 Transportation Policy Plan is its impact on all populations in the Minneapolis-Saint Paul region, particularly
TSCC Budget Review TriMet
 TSCC Budget Review 2017-18 TriMet 1. Introduction to the District: The Tri-County Metropolitan Transportation District (TriMet) boundary covers about 575 square miles of the urban portions of Multnomah,
Pass Programs, Fare Programs and Fare Policy Analysis. Marla Lien, General Counsel Regional Transportation District, Denver, CO
 Pass Programs, Fare Programs and Fare Policy Analysis Marla Lien, General Counsel Regional Transportation District, Denver, CO Types of Discount Fare Programs: Frequency Discounts (multi-ride, monthly
INTERGOVERNMENTAL AGREEMENT BETWEEN METRO AND WASHINGTON COUNTY FOR THE SOUTHWEST CORRIDOR PLAN
 INTERGOVERNMENTAL AGREEMENT BETWEEN METRO AND WASHINGTON COUNTY FOR THE SOUTHWEST CORRIDOR PLAN This Intergovernmental Agreement ( Agreement ) is made and entered into by and between Washington County
~ NOTICE OF MEETING ~ CAPITAL METROPOLITAN TRANSPORTATION AUTHORITY BOARD OF DIRECTORS MEETING
 ~ NOTICE OF MEETING ~ CAPITAL METROPOLITAN TRANSPORTATION AUTHORITY BOARD OF DIRECTORS MEETING 2910 East Fifth Street Austin, TX 78702 ~ AGENDA ~ Executive Assistant/Board Liaison Gina Estrada 512-389-7458
Marion County Transit Plan
 Marion County Transit Plan Final Summary for BOD Adoption 3/24/16 BACKGROUND: Since 2009, various studies and sustained public involvement under the banner Indy Connect have helped sculpt a detailed plan
2018 Fare Change Proposal
 2018 Change Proposal Metra Board of Directors October 6, 2017 Presented by Lynnette H. Ciavarella Senior Division Director, Strategic Capital Planning Metra Principles (April 19, 2017) Consider regular
University Link LRT Extension
 (November 2007) The Central Puget Sound Regional Transit Authority, commonly known as Sound Transit, is proposing to implement an extension of the Central Link light rail transit (LRT) Initial Segment
Overview of Final Circular B Title VI Requirements and Guidelines for Recipients. February 2013
 Overview of Final Circular 4702.1B Title VI Requirements and Guidelines for Recipients February 2013 Title VI Prohibits discrimination on the basis of race, color, or national origin in Federally funded
Columbia River Crossing Project Vancouver, Washington Engineering (Rating Assigned November 2012)
") Columbia River Crossing Project Vancouver, Washington Engineering (Rating Assigned November 2012) Summary Description Proposed Project: Light Rail Transit 2.9 Miles, 5 Stations Total Capital Cost ($YOE):
Columbia River Crossing Project Vancouver, Washington Engineering (Rating Assigned November 2012) Summary Description Proposed Project: Light Rail Transit 2.9 Miles, 5 Stations Total Capital Cost ($YOE):
2040 Transit System Plan
 2040 Transit System Plan City of Dallas Transportation and Trinity River Project Committee Briefing April 11, 2016 Agenda Background Plan Development Process Phase 1 - Comprehensive Operations Analysis
ACTION REQUESTED: Recommend Board approval of the Youth GoPass supplies and materials amendment. (5 minutes Steven Schlossberg)
") Page 1 of 50 GoTriangle Operations & Finance Committee Wed, May 23, 2018 10:30 am-11:45 am I. Call to Order and Adoption of Agenda ACTION REQUESTED: Adopt agenda. (1 minute Ellen Reckhow) II. Draft Minutes
Page 1 of 50 GoTriangle Operations & Finance Committee Wed, May 23, 2018 10:30 am-11:45 am I. Call to Order and Adoption of Agenda ACTION REQUESTED: Adopt agenda. (1 minute Ellen Reckhow) II. Draft Minutes
Appendix C-5 Environmental Justice and Title VI Analysis Methodology
 Appendix C-5 Environmental Justice and Title VI Analysis Methodology Environmental Justice Analysis SACOG is required by law to conduct an Environmental Justice (EJ) analysis as part of the MTP/SCS, to
ANNUAL REPORT AN UPDATE FOR OUR RIDERS AND THE COMMUNITY
 ANNUAL REPORT 2 0 1 8 AN UPDATE FOR OUR RIDERS AND THE COMMUNITY FROM THE GM FROM THE GM Dear Riders and Stakeholders, At the end of each year we have the opportunity to look back at everything we have
Transit Development Plan (FY ) Executive Summary
 Executive Summary") Transit Development Plan (FY 2019-2028) Executive Summary December 2018 TABLE OF CONTENTS Introduction... 1 System Profile... 2 Public Outreach... 4 Key Findings/Direction... 5 Implementation Plan... 6
Transit Development Plan (FY 2019-2028) Executive Summary December 2018 TABLE OF CONTENTS Introduction... 1 System Profile... 2 Public Outreach... 4 Key Findings/Direction... 5 Implementation Plan... 6
TABLE OF CONTENTS. Page. Page
 TABLE OF CONTENTS Page Overview Board of Directors... Overview-1 TriMet Officials... Overview-1 Budget Message... Overview-2 2017-2018 TriMet Organization Chart... Overview-10 Financial Summary General
Final Plan. August Presented to. Submitted by
 Final Plan August 2018 Presented to Submitted by Executive Summary The Metropolitan Tulsa Transit Authority 1 will soon begin construction of its first AERO Bus Rapid Transit (BRT) service along Peoria
Title VI Fare Equity Analysis
 Pioneer Valley Transit Authority Title VI Fare Equity Analysis Prepared by the Pioneer Valley Planning Commission April 12, 2012 PVTA TITLE VI FARE EQUITY ANALYSIS APRIL 12, 2012 1. CONFORMANCE WITH REGULATORY
RTD Pass Program Portfolio: The Current State. An Overview of RTD Pass Programs June 6, 2017
 RTD Pass Program Portfolio: The Current State An Overview of RTD Pass Programs June 6, 2017 Outline 1. The Budget 2. Pass Programs By The Numbers 3. Equity The Budget How fare revenue and pass programs
ONBOARD ORIGIN-DESTINATION STUDY
 REPORT ONBOARD ORIGIN-DESTINATION STUDY 12.23.2014 PREPARED FOR: ANCHORAGE METROPOLITAN AREA TRANSPORTATION SYSTEM (AMATS) 55 Railroad Row White River Junction, VT 05001 802.295.4999 www.rsginc.com SUBMITTED
RTD Pass Program Portfolio: The Current State. An Overview of RTD Pass Programs June 6, 2017
 RTD Pass Program Portfolio: The Current State An Overview of RTD Pass Programs June 6, 2017 Outline 1. The Budget 2. Pass Programs By The Numbers 3. Equity The Budget How fare revenue and pass programs
REGIONAL TRANSIT MEMO
 REGIONAL TRANSIT MEMO DATE: February 10, 2014 TO: FROM: SUBJ: File James Drake, Service Planner Title VI Analysis of Granite Park Shuttle Pursuant to RT s major service change policy and in accordance
SAN FRANCISCO MUNICIPAL TRANSPORTATION AGENCY
 THIS PRINT COVERS CALENDAR ITEM NO.: 10. SAN FRANCISCO MUNICIPAL TRANSPORTATION AGENCY DIVISION: Finance and Information Technology BRIEF DESCRIPTION: Approving revisions to the Title VI analysis for the
FY 2018 Adopted Wake Transit Work Plan
 FY 2018 Adopted Wake Transit Work Plan Fiscal Year (FY 2018) Wake Transit Work Plan Table of Contents FY 2018 Wake Transit Work Plan Introduction 3 FY 2018 Operating Budget & Multi-Year Operating Program
Transportation Committee Meeting date: July 24 th, 2017 For the Metropolitan Council meeting of July 26 th, 2017
 Business Item No. 2017-154SW Transportation Committee Meeting date: July 24 th, 2017 For the Metropolitan Council meeting of July 26 th, 2017 Subject: Regional Fare Adjustment Recommendations District(s),
MINUTES MEETING OF THE BOARD OF DIRECTORS PLANNING & EXTERNAL RELATIONS COMMITTEE METROPOLITAN ATLANTA RAPID TRANSIT AUTHORITY.
 MINUTES MEETING OF THE BOARD OF DIRECTORS PLANNING & EXTERNAL RELATIONS COMMITTEE METROPOLITAN ATLANTA RAPID TRANSIT AUTHORITY December 10, 2015 The Board of Directors Planning & External Relations Committee
Vancouver Columbia River Crossing. (November 2009)
") EXHIBIT A Vancouver Columbia River Crossing Vancouver, Washington (November 2009) The Washington State Department of Transportation (WSDOT) proposes to construct the Columbia River Crossing, an approximately
EXHIBIT A Vancouver Columbia River Crossing Vancouver, Washington (November 2009) The Washington State Department of Transportation (WSDOT) proposes to construct the Columbia River Crossing, an approximately
FY2017 Budget Work Session
 Finance & Administration Committee Information Item IV-B January 14, 2016 FY2017 Budget Work Session Washington Metropolitan Area Transit Authority Board Action/Information Summary Action Information MEAD
Greyhound Lines, Inc. Title VI Program
 Greyhound Lines, Inc. Title VI Program 350 N St. Paul Street Dallas, TX 75201 214-849-8000 www.greyhound.com This document was prepared in accordance with the FTA Circular 4702.1B, dated October 1, 2012.
POLICY AND PROCEDURES MANUAL
 NUMBER EFF. DATE POLICY AND PROCEDURES MANUAL RESPONSIBLE DEPARTMENT Finance/Service Planning TITLE Fare Policy (DRAFT as of 11-13-13) APPLIES TO Development of Fare Structure, General Public SUPERSEDED
FY06 Operating Budget. FY2006 Proposed Operating Budget. Final Summary for Board Referral
 FY2006 Proposed Operating Budget Final Summary for Board Referral 1 Operating Statements Subsidy nearly $10M lower than December proposal Dec Base Other Subtot Mar Prop$ Adj Adj Changes Prop$ Revenues
CENTRAL CITY LINE PROJECT UPDATE AND SMALL STARTS EVALUATION & RATINGS APPLICATION UPDATED & REVISED 4/20/17
 CENTRAL CITY LINE PROJECT UPDATE AND SMALL STARTS EVALUATION & RATINGS APPLICATION UPDATED & REVISED 4/20/17 EXECUTIVE SUMMARY The Central City Line (CCL) is a proposed 6-mile long high performance Bus
Washington Metropolitan Area Transit Authority Metro Budget Overview
 Washington Metropolitan Area Transit Authority Metro Budget Overview February 2011 Metro 10,877 Employees (10,974 budgeted) 1,491 Buses 588 Escalators and 237 Elevators 106 Miles of Track 92 Traction Power
2013 STA Passenger Survey Results. Attachment E Title VI Attachment E
 2013 STA Passenger Survey Results Attachment E 1 2014 Title VI Attachment E 2013 STA Passenger Survey Results Overview Spokane Transit Authority (STA) conducted its most recent passenger survey in December
Wake County. People love to be connected. In our cyberspace. transit plan CONNECTING PEOPLE, CONNECTING THE COUNTY
 Wake County transit plan CONNECTING PEOPLE, CONNECTING THE COUNTY EXECUTIVE SUMMARY People love to be connected. In our cyberspace driven world, people can stay connected pretty much all of the time. Connecting
One Gateway Plaza Metropolitan Transportation Authority Los Angeles, CA goo REQUIRES 213 VOTE PER Administrative Code , Part D
 Metro Los Angeles County One Gateway Plaza Metropolitan Transportation Authority Los Angeles, CA goo12 2952 OPERATIONS COMMITTEE OCTOBER 15,2009 SUBJECT: LINE 910 FARE STRUCTURE ACTION: APPROVE PROPOSED
Financial Analysis Working Paper 1 Existing Funding Sources Draft: April 2007
 Financial Analysis Working Paper 1 Existing Funding Sources Draft: April 2007 Prepared for: By: TABLE OF CONTENTS INTRODUCTION... 1 REVIEW OF FRED AND VRE EXISTING FUNDING SOURCES... 1 Federal Funding...
Safety and Operations Committee. Information Item III-B. January 24, 2019
 Safety and Operations Committee Information Item III-B January 24, 2019 Overnight Maintenance Window and Work Hours Page 54 of 75 Washington Metropolitan Area Transit Authority Board Action/Information
Review FY09 Subsidy Allocation
 Finance, Administration and Oversight Committee Information Item IV-D March 13, 2008 Review FY09 Subsidy Allocation Washington Metropolitan Area Transportation Authority Board Action/Information Summary
Public Transportation Department Anchorage: Performance. Value. Results.
 Anchorage: Performance. Value. Results. Mission Serve Anchorage residents and visitors by providing public transportation that emphasizes quality, safety, cost effectiveness, and economic vitality. Core
Customer Service and Operations Committee. Board Action Item III-A. July 10, 2014
 Customer Service and Operations Committee Board Action Item III-A July 10, 2014 FY2015 Bus Service Adjustments Request For Public Hearings Page 3 of 52 Washington Metropolitan Area Transit Authority Board
1/31/2019. January 31, Item #1 CITIZENS PARTICIPATION
 January 31, 2019 Item #1 CITIZENS PARTICIPATION 1 Item #2 APPROVAL OF MINUTES Item #3 TRAC GOALS, FRAMEWORK & AGENDA REVIEW 2 COMMITTEE GOALS Learn about Southern Nevada s mobility challenges, new developments
Chapel Hill Transit Strategic and Financial Sustainability Plan Update
 Chapel Hill Transit Strategic and Financial Sustainability Plan Update ACT January 21, 2015 Today s Agenda Overview of Chapel Hill Transit Performance Overview Funding Overview Key Challenges Overview
INVESTING STRATEGICALLY
 11 INVESTING STRATEGICALLY Federal transportation legislation (Fixing America s Surface Transportation Act FAST Act) requires that the 2040 RTP be based on a financial plan that demonstrates how the program
Votran Transit Development Plan (TDP) River To Sea TPO Committees September 2016
 River To Sea TPO Committees September 2016") Votran Transit Development Plan (TDP) River To Sea TPO Committees September 2016 Agenda What is a TDP? Baseline Conditions Public Involvement Peer and Trend Review Situation Appraisal Goals Proposed Alternatives
Votran Transit Development Plan (TDP) River To Sea TPO Committees September 2016 Agenda What is a TDP? Baseline Conditions Public Involvement Peer and Trend Review Situation Appraisal Goals Proposed Alternatives
Total Operating Activities for FY17 are $56.9 million, an increase of $5.1M or 9.8% from FY16.
 FY17 ADOPTED ANNUAL OPERATING AND CAPITAL BUDGET Valley Metro Rail, Inc. (VMR) is a public non-profit corporation whose members are the cities of Chandler, Glendale, Mesa, Phoenix, and Tempe. VMR plans,
Report by Finance and Administration Committee (B) Washington Metropolitan Area Transit Authority Board Action/Information Summary
 Washington Metropolitan Area Transit Authority Board Action/Information Summary") Report by Finance and Administration Committee (B) 01-28-2016 Washington Metropolitan Area Transit Authority Board Action/Information Summary Action Information MEAD Number: 201701 Resolution: Yes No TITLE:
Report by Finance and Administration Committee (B) 01-28-2016 Washington Metropolitan Area Transit Authority Board Action/Information Summary Action Information MEAD Number: 201701 Resolution: Yes No TITLE:
TEX Rail Fort Worth, Texas Project Development (Rating Assigned November 2012)
") TEX Rail Fort Worth, Texas Project Development (Rating Assigned November 2012) Summary Description Proposed Project: Commuter Rail 37.6 Miles, 14 Stations (12 new, two existing) Total Capital Cost ($YOE):
TEX Rail Fort Worth, Texas Project Development (Rating Assigned November 2012) Summary Description Proposed Project: Commuter Rail 37.6 Miles, 14 Stations (12 new, two existing) Total Capital Cost ($YOE):
TABLE OF CONTENTS. Page. Page
 TABLE OF CONTENTS Page Overview Board of Directors... Overview-1 TriMet Officials... Overview-1 Budget Message... Overview-2 2016-2017 TriMet Organization Chart... Overview-9 Financial Summary General
Cincinnati Streetcar: Options & Recommendations for Funding Operations
 Cincinnati Streetcar: Options & Recommendations for Funding Operations Table of Contents Background & Context... 3 Cincinnati Streetcar at a Glance... 4 Operating Model... 5 Operating Expenses: Estimates
CHAPTER 9 FINANCIAL CONSIDERATIONS
 CHAPTER 9 FINANCIAL CONSIDERATIONS 9.1 INTRODUCTION This chapter presents anticipated costs, revenues, and funding for the Berryessa Extension Project (BEP) Alternative and the Silicon Valley Rapid Transit
Executive Summary - Fiscal Year 2016 Valley Metro Rail Preliminary Annual Operating and Capital Budget
 Executive Summary - Fiscal Year 2016 Valley Metro Rail Preliminary Annual Operating and Capital Budget Valley Metro Rail, Inc. (VMR) is a public non-profit corporation whose members are the cities of Chandler,
DART Fare Structure Programs
 DART Fare Structure Programs Budget & Finance Committee November 13, 2018 Joseph G. Costello Senior Vice President, Finance 0 Calendar Date Nov 13 Dec 11 Jan 22 Feb 26 Mar 26 Apr 23 May 28 Jun 18 Jul 18
The DRAFT Bus and Rail Investment Plan in Orange County
 The DRAFT Bus and Rail Investment Plan in Orange County 5/31/2012 The Bus and Rail Investment Plan in Orange County I. INTRODUCTION 3 II. TRANSIT STEPS LEADING UP TO THIS PLAN 4 III. PLAN ELEMENTS 5 A.
STAFF REPORT Regional Transportation Plan/Sustainable Communities Strategy (RTP/SCS) Scenario Performance Update for Board Direction
 Scenario Performance Update for Board Direction") November 2017 Board of Directors STAFF REPORT SUBJECT: RECOMMENDED ACTION: 2018 Regional Transportation Plan/Sustainable Communities Strategy (RTP/SCS) Scenario Performance Update for Board Direction Support
November 2017 Board of Directors STAFF REPORT SUBJECT: RECOMMENDED ACTION: 2018 Regional Transportation Plan/Sustainable Communities Strategy (RTP/SCS) Scenario Performance Update for Board Direction Support
CHICAGO TRANSIT AUTHORITY PRESIDENT S FY2016 BUDGET RECOMMENDATIONS. Analysis and Recommendations
 CHICAGO TRANSIT AUTHORITY PRESIDENT S FY2016 BUDGET RECOMMENDATIONS Analysis and Recommendations November 13, 2015 TABLE OF CONTENTS EXECUTIVE SUMMARY... 1 CIVIC FEDERATION POSITION... 4 ISSUES THE CIVIC
2015 REGIONAL AIRPORT GROUND ACCESS
 2015 REGIONAL AIRPORT GROUND ACCESS Travel Time Study C. Patrick Zilliacus Transportation Engineer Travel Forecasting Subcommittee Agenda Item # 3 About the project Has been done many times in the past
D R A F T APPENDIX A. Future Employment Forecast Methodology
 Transit Development Plan Memo #3: Planning Framework Appendix A APPENDIX A Future Employment Forecast Methodology Transit Development Plan Memo #3: Planning Framework Appendix A APPENDIX A FUTURE EMPLOYMENT
SOUND TRANSIT STAFF REPORT MOTION NO. M Select a draft Sounder fare structure change and fare increase for public review and comment
 SOUND TRANSIT STAFF REPORT MOTION NO. M2007-21 Select a draft Sounder fare structure change and fare increase for public review and comment Meeting: Date: Type of Action: Staff Contact: Phone: Finance
Wake Transit Plan. A Wake County Transit Investment Strategy Report. NOVEmber 2016
 A Report NOVEmber 2016 Table of Contents Contents Foreword...3 1 Background...4 About the Reports...5 Transit Planning in Wake County...5 Process Overview....5 2....6 Big Moves: Enhanced Transit in Wake
Columbia River Crossing Project Portland, Oregon New Starts Engineering (Rating Assigned January 2014)
") Columbia River Crossing Project Portland, Oregon ew Starts Engineering (Rating Assigned January 2014) Summary Description Proposed Project: Light Rail Transit 2.9 Miles, 5 Stations Total Capital Cost ($YOE):
Columbia River Crossing Project Portland, Oregon ew Starts Engineering (Rating Assigned January 2014) Summary Description Proposed Project: Light Rail Transit 2.9 Miles, 5 Stations Total Capital Cost ($YOE):
MoDOT Title VI Workshop Introduction. Prepared by Philips & Associates, Inc., Program Consultants
 MoDOT Title VI Workshop Introduction Prepared by Philips & Associates, Inc., Program Consultants November 20, 2013 Administration and Staff Lester Woods, Jr. Director MoDOT External Civil Rights Steve
The State of TriMet Contract Reform Needed to Fund Service
 The State of TriMet Contract Reform Needed to Fund Service Save Our Service February 13, 2013 Presented by: Neil McFarlane TriMet General Manager 1 Important to the Region* Record ridership: 102 million
CITY OF SANTA ROSA TRANSPORTATION AND PUBLIC WORKS DEPARTMENT, TRANSIT DIVISION DISADVANTAGED BUSINESS ENTERPRISE (DBE) GOAL FY 2017 FY 2019
 GOAL FY 2017 FY 2019") CITY OF SANTA ROSA TRANSPORTATION AND PUBLIC WORKS DEPARTMENT, TRANSIT DIVISION Summary DISADVANTAGED BUSINESS ENTERPRISE (DBE) GOAL FY 2017 FY 2019 In keeping with the requirements of 49 C.F.R. Part 26
CITY OF SANTA ROSA TRANSPORTATION AND PUBLIC WORKS DEPARTMENT, TRANSIT DIVISION Summary DISADVANTAGED BUSINESS ENTERPRISE (DBE) GOAL FY 2017 FY 2019 In keeping with the requirements of 49 C.F.R. Part 26
Gresham Regional Center
 Gresham Regional Center Financing A Livable Community: 1994-2006 Railvolution Chicago November 7, 2006 Andy Cotugno Planning Director Metro Regional Government Portland Metropolitan Region, Oregon, USA
Report of Independent Auditors and Financial Statements with Supplementary Information June 30, 2017 and 2016
 Report of Independent Auditors and Financial Statements with Supplementary Information June 30, 2017 and 2016 (including Audit Comments and Disclosures Required by State Regulations) Board of Directors
Travel Forecasting for Corridor Alternatives Analysis
 Travel Forecasting for Corridor Alternatives Analysis Purple Line Functional Master Plan Advisory Group January 22, 2008 1 Purpose of Travel Forecasting Problem Definition Market Analysis Current Future
TRANSIT ORIENTED DEVELOPMENT IN THE PORTLAND METRO REGION
 TRANSIT ORIENTED DEVELOPMENT IN THE PORTLAND METRO REGION Presented by: Megan Gibb What is Metro Directly elected regional government Serves more than 1.4 million residents in Clackamas, Multnomah and
THIS PRINT COVERS CALENDAR ITEM NO. : 14 SAN FRANCISCO MUNICIPAL TRANSPORTATION AGENCY DIVISION: Finance and Information Technology BRIEF
 THIS PRINT COVERS CALENDAR ITEM NO. : 14 SAN FRANCISCO MUNICIPAL TRANSPORTATION AGENCY DIVISION: Finance and Information Technology BRIEF DESCRIPTION: Considering possible options to change existing youth
Budget Discussion. July 2009 Citizens Advisory Committee
 Budget Discussion July 2009 Citizens Advisory Committee Budget presentation How did TriMet arrive at the LPA budget How are estimates developed How are we tracking changes How are we doing with the budget
Board Report Update on Broadway Corridor & USPS September 9, 2015 Page 1 of 5
 September 9, 2015 Page 1 of 5 DATE: September 9, 2015 TO: FROM: Board of Commissioners Patrick Quinton, Executive Director SUBJECT: Report Number 15-57 Update on the Broadway Corridor Framework Plan and
Performance-Based Planning and Programming Why Is It Important? Northwest TTAP and BIA Symposium Portland, OR March 17, 2015
 Performance-Based Planning and Programming Why Is It Important? Northwest TTAP and BIA Symposium Portland, OR March 17, 2015 Transportation has two purposes & Mobility Access Quileute Reservation La Push,
METRO. Metro Funding. Associated Master Plan: Comprehensive Master Transportation Plan (MTP) for Arlington. Neighborhood(s):
 for Arlington. Neighborhood(s):") METRO METRO METRO 2017 2026 CIP Metro Funding Project Description The Washington Metropolitan Area Transit Authority (WMATA/Metro) is a unique federal-state-local partnership formed to provide mass transit
METRO METRO METRO 2017 2026 CIP Metro Funding Project Description The Washington Metropolitan Area Transit Authority (WMATA/Metro) is a unique federal-state-local partnership formed to provide mass transit
Marketing to New Residents
 TRANSPORTATION RESEARCH RECORD 1402 43 Cost-Effectiveness of Direct Mail Marketing to New Residents CAROL PEDERSEN AMBRUSO In January 1989 the Tri-County Metropolitan Transportation District of Oregon
Tampa Bay Express Planning Level Traffic and Revenue (T&R) Study
 Study") Tampa Bay Express Planning Level Traffic and Revenue (T&R) Study Project Report FPN: 437289-1-22-01 Prepared for: FDOT District 7 February 2017 Table of Contents Executive Summary... E-1 E.1 Project Description...
Tampa Bay Express Planning Level Traffic and Revenue (T&R) Study Project Report FPN: 437289-1-22-01 Prepared for: FDOT District 7 February 2017 Table of Contents Executive Summary... E-1 E.1 Project Description...
TESTIMONY OF RICHARD SARLES
 TESTIMONY OF RICHARD SARLES Before the Council of the District of Columbia Committee on Economic Development on WMATA s FY2015 Budget Wednesday, April 30, 2014 Good Morning, Chairperson Bowser and other
QUALITY TRANSPORTATION SUMMARY
 QUALITY TRANSPORTATION SUMMARY Quality Transportation Overview... 126 Department of Transportation... 127 Traffic Field Operations... 129 Winston-Salem Transit Authority... 131 Quality Transportation Non-Departmental...
Strategic Plan Progress Report Goal 2 Focus. July 2015 San Francisco, California
 Strategic Plan Progress Report Goal 2 Focus July 2015 San Francisco, California 1 Goal 2 focus Make transit, walking, bicycling, taxi, ridesharing and carsharing the preferred means of travel Objective
Washington Metropolitan Area Transit Authority
 Washington Metropolitan Area Transit Authority Financial Report issued in Accordance with Government Auditing Standards For the Years Ended June 30, 2016 and 2015 Single Audit Reports issued in Accordance
CASCADE CAMPUS Transportation Demand Management Plan
 Portland Community College CASCADE CAMPUS Portland, Oregon Prepared For: Portland Community College PO Box 19000 Portland, OR 97280 (971) 722-6111 Prepared By: Rick Williams Consulting 610 SW Alder, Suite
Capital Metropolitan Transportation Authority
 Capital Metropolitan Transportation Authority Monthly Performance Report (Covering Performance Data Through March and April 2010) Capital Metropolitan Transportation Authority 1 Performance Report Contents
Minutes NASHVILLE METROPOLITAN TRANSIT AUTHORITY BOARD OF DIRECTORS MEETING. January 26, 2017
 Minutes NASHVILLE METROPOLITAN TRANSIT AUTHORITY BOARD OF DIRECTORS MEETING January 26, 2017 I. CALL TO ORDER: The regular meeting of the Nashville Metropolitan Transit Authority (MTA) Board of Directors
Mini-budget workshop. November 10, 2011
 Mini-budget workshop November 10, 2011 1 Votran recognized by Florida Public Transportation Association 2 nd Runner up Florida Bus Operator of the Year, John McDermott 2 nd Runner up Safety, Group II 2
RE: DOCKET NO. FR-5173-P-01, AFFIRMATIVELY FURTHERING FAIR HOUSING
 WASHINGTON BUREAU NATIONAL ASSOCIATION FOR THE ADVANCEMENT OF COLORED PEOPLE 1156 15 TH STREET, NW SUITE 915 WASHINGTON, DC 20005 P (202) 463-2940 F (202) 463-2953 E-MAIL: WASHINGTONBUREAU@NAACPNET.ORG
February 2016 Financial Report
 2016 February 2016 Financial Report Capital Metropolitan Transportation Authority 4/13/2016 Table of Contents SUMMARY REPORT Budgetary Performance - Revenue 2 - Sales Tax Revenue 5 - Operating Expenses
SURVEY OF POTENTIAL OVERNIGHT SERVICE PASSENGERS 1/30/17 OPMI
 SURVEY OF POTENTIAL OVERNIGHT SERVICE PASSENGERS 1/30/17 OPMI Survey Background & overview In March 2016, the FMCB ended Late Night service In Fall 2016, the FMCB directed staff to conduct a survey and
The Bus and Rail Investment Plan in Orange County
 The Bus and Rail Investment Plan in Orange County Revised: 9/27/2012 Adopted: 10/2/2012 The Bus and Rail Investment Plan in Orange County I. INTRODUCTION 3 II. TRANSIT STEPS LEADING UP TO THIS PLAN 4 III.
OTHER ALTERNATIVES CONSIDERED:
 Page AGENDA City Council Study Session 6:30 PM - Monday, March 5, 2018 City Hall Council Chambers, Sammamish, WA CALL TO ORDER Estimated Time 6:30 PM TOPICS 2-34 1. Discussion: Intersection-Based Traffic
System Performance Summary for FY 2016/17 Fixed Route
 System Performance Summary for FY 216/17 This report summarizes the unaudited oational formance of Marin Transit local transit services for FY 216/17, and compares these results to the District s route
RESOLUTION NO. R Baseline Budget and Schedule, and Approve Gates 5 and 6 for the East Link Extension
 RESOLUTION NO. R2015-04 Baseline and Schedule, and Approve Gates 5 and 6 for the East Link Extension MEETING: DATE: TYPE OF ACTION: STAFF CONTACT: Board 04/23/15 Final Action Ahmad Fazel, DECM Executive