TABLE OF CONTENTS. Page. Page
|
|
|
- Mildred Walker
- 6 years ago
- Views:
Transcription
1
2
3 TABLE OF CONTENTS Page Overview Board of Directors... Overview-1 TriMet Officials... Overview-1 Budget Message... Overview TriMet Organization Chart... Overview-10 Financial Summary General Fund Resource Summary... Financial Summary-1 General Fund Requirement Summary... Financial Summary-3 CIP Resource Summary... Financial Summary-6 CIP Requirement Summary... Financial Summary-7 Light Rail Program Resource Summary... Financial Summary-8 Light Rail Program Requirement Summary... Financial Summary-9 Summary of Fund History... Financial Summary-10 Pass through Revenues and Requirements... Financial Summary-12 Resources General Fund Resources... Resources-1 General Fund Resource Summary... Resources-2 General Fund Resource Summary by Source... Resources-4 Federal & State Grant/Local Contribution Summary... Resources-6 Requirements General Fund Requirements... Requirements-1 General Fund Requirement Summary... Requirements-2 General Fund Requirements by Object Class... Requirements-5 General Fund Personnel Services Schedule... Requirements-6 General Fund Materials & Services Schedule... Requirements-7 Summary of General Fund Employees... Requirements-8 Summary of Fixed Route Service... Requirements-11 Summary of Fixed Route and Accessible Transportation Vehicles... Requirements-12 Debt Service Summary of General Fund Debt Service... Debt Service-1 Summary of General Fund Debt Service Principal and Interest... Debt Service-2 TriMet Continuing Revenues and Calculation of Payroll Tax Debt Service Ratio... Debt Service-3 OPEB & Pension UAAL... OPEB-1 Page Office of the General Manager Division Division Summary... GM-1 Office of the General Manager... GM-2 Diversity and Transit Equity... GM-5 Internal Audit... GM-8 Public Affairs Division Division Summary... PA-1 Administration... PA-2 Planning & Policy... PA-5 GIS & Location Based Services... PA-8 Community Affairs... PA-11 Government Services & Community Affairs... PA-14 Communications & Marketing... PA-17 Customer Experience... PA-20 Grant Summary... PA-26 Safety & Security Division Division Summary...SS-1 Safety, Security, Environmental Services & Transportation Training...SS-2 Information Technology Division Division Summary... IT-1 Information Technology... IT-2 Finance & Administration Division Division Summary... FA-1 Administration... FA-2 Financial Services... FA-5 Budget & Grants Administration... FA-8 Insurance Programs... FA-11 Procurement & Contracts... FA-14 Fare Revenue... FA-17 Labor Relations & Human Resources Division Division Summary... HR-1 Administration... HR-2 Compensation, Benefits & HRIS... HR-5 Talent Management... HR-8 Labor Relations... HR-11
4 Page Legal Services Division Division Summary... LS-1 Legal Services... LS-2 Operations Division Division Summary... OP-1 Transportation Division Summary... OP-2 Administration & Support... OP-3 Bus Transportation... OP-6 Field Operations... OP-12 Service Delivery... OP-17 Accessible Transportation Programs-LIFT... OP-20 Accessible Transportation Programs-MTP... OP-24 Rail Transportation... OP-27 Commuter Rail... OP-30 Streetcar... OP-34 Maintenance Division Summary... OP-37 Bus Maintenance... OP-38 Facilities Management... OP-42 Rail Maintenance of Way... OP-48 Rail Equipment Maintenance... OP-52 Capital Projects Division Division Summary... CP-1 Administration... CP-2 Development & Operations Support... CP-5 Capital Program... CP-9 In-Street Transit Facilities Development... CP-12 Page General Information Exhibit 1 Ridership and Service (Fixed Route)... General-1 Exhibit 2 Fares and Passenger Revenue (Fixed Route)... General-2 Exhibit 3 Employer Taxes (Unadjusted CPI-W)... General-3 Exhibit 4 Expenses (Fixed Route)... General-4 Exhibit 5 Fixed Route Financial Indicators... General-5 Exhibit 6 LIFT Revenue, Ridership and Service... General-6 Exhibit 7 Local Economic Trends... General-7 Exhibit 8 Debt and Capital Investment... General-8 Local Economic Trends... General-9 Ridership... General-10 Service... General-11 Expense... General-12 Revenue... General-13 Appendix Notice of Budget Committee Hearing... Appendix-1 Resolution Approving FY Budget... Appendix-2 Affidavit of Publication, Tax Supervising & Conservation Commission Hearing... Appendix-3 Tax Supervising & Conservation Commission Letter... Appendix-4 Appropriation Schedule... Appendix-5 Resolution Adopting FY Budget... Appendix-6 CIP CIP Resource Summary... Capital Program-1 CIP Requirement Summary... Capital Program-2 CIP Detail... Capital Program-3 CIP Division Summary... Capital Program-8 Light Rail Program Light Rail Program Resource Summary... Light Rail Program-1 Light Rail Program Requirement Summary... Light Rail Program-2 Division Summary... Light Rail Program-3 Portland-Milwaukie Light Rail Project... Light Rail Program-4
5 BOARD OF DIRECTORS Bruce Warner, President (District #1) TRIMET OFFICIALS Neil McFarlane, General Manager Dee Brookshire, Budget Officer Joe Esmonde (District #2) Dr. Linda Simmons (District #3) Lori Irish Bauman (District #4) Dr. T. Allen Bethel, Vice President (District #5) Travis Stovall, Secretary (District #6) Craig Prosser (District #7) Mailing Address: TriMet Board of Directors Office of the General Manager 1800 SW 1 st Avenue, Suite 300 Portland, Oregon Mailing Address: TriMet 1800 SW 1 st Avenue, Suite 300 Portland, Oregon Staff to the Board: Kelly Runnion Telephone Facsimile runnionk@trimet.org Overview-1
6 FY 2018 Adopted Budget Message Overview The TriMet Adopted Budget for FY2018 outlines a resource and expenditure plan for July 1, 2017 through June 30, The FY2018 Adopted Budget includes: Total day-to-day Operating Requirements of $534.7 million, which includes all activities required to operate the system. Federal contributions of $100.0 million for debt service payments specifically related to the MAX Orange Line Full Funding Grant Agreement. Capital Improvement Program (CIP) Requirements of $203.1 million. Pass Though Requirements totaling $6.6 million, under which TriMet receives funds required to be provided to other governmental agencies. Fund Balances and Contingency totaling $355.0 million. Unrestricted Fund Balance and Contingency are required to assure sufficient resources to cover expenses throughout the year until grant revenues are collected. The FY2018 Adopted Budget focuses on improving service; the cost of operating and maintaining the existing transit system; the costs of fixed route bus and rail service to maintain headways and capacity as the region grows (including vehicle replacements); costs of ADA complementary paratransit service; operating cost of other service changes; capital and operating project expenditures from the CIP; debt service expense; and continued commitment to strengthen pension reserves. Service - The demand for more bus and rail service continues. Customers, employers, and local governments in our region continue to desire more service than TriMet is able to pay for. To help TriMet pay for service and expansion, the Oregon legislature in 2003 and 2009 authorized TriMet to increase the payroll tax rate one-tenth of one percent over ten years. The first payroll tax increase authorized by the TriMet Board began January 1, 2005 and ended January 1, Between FY2005 and FY2014, the increase in the payroll tax rate generated an additional $34.4 million per year for new service and capital investment. The payroll tax continues to pay for the service put in operation since 2005 including many bus frequent service upgrades, the MAX Green Line, WES, MAX Orange Line, and the associated cost of those operations. The TriMet Board initiated the second payroll tax increase in September 2015 by increasing the employer and self-employed payroll tax rates.01% starting January 1, 2016 and will continue the increase through January 1, The revenues from this tax rate increase will help pay for additional service such as the Division Transit Project, extension of the MAX Red Line and other new service related projects identified in TriMet s Service Enhancement Plans and the CIP. FY2018 includes an increase of $3.9 million for services increases, primarily on bus service routes. In FY2017, TriMet proposed to increase bus service 4.33%. In FY2018, the proposed bus increase is 3.42% over FY2017 levels. The costs of these service increases are also partially Overview-2
7 paid for by the generated fares from the service and other passenger revenues. Compensation A critical element of TriMet s multi-year effort to achieve long-term fiscal stability has been to reduce the growth rate of active employee and retiree benefit costs, primarily by reforming healthcare with premium share, coinsurance, and deductibles paid by employees, and by reducing retirement benefits for new hires. TriMet began with non-union compensation in 2003, when the defined benefit pension plan was closed to new employees and replaced with a defined contribution plan. In 2009, retiree medical benefits were closed to new non-union employees. Since 2012 non-union employees and retirees in the PPO health plan have paid 20% co-insurance and 6% premium contributions. Non-union employees and retirees in the HMO plan have $10 co-pays and 6% premium contributions. In January 2014 non-union retirees age 65 and older in the PPO health plan were moved to a lower cost Medicare supplement plan. The FY2018 Adopted Budget includes resources for up to 3% non-union payroll to be allocated for merit increases related to performance as well as any pay adjustments needed for those individuals whose total compensation is below market. Union benefit costs have similarly been reformed over the last two contracts. Healthcare benefit changes have instituted premium share, co-insurance, and deductibles essentially parallel to the non-union plan. Simultaneously the defined benefit pension plan was closed and new hires participate in a defined contribution plan. The Working and Wage Agreement with the union expired on November 30, Future union wage increases must be negotiated with the union. Therefore, no increases are included in the FY2018 Adopted Budget or Forecast. To further trim costs, TriMet implemented a self-insured medical plan for both union and non-union employees effective January 1, Pension Funding - TriMet is continuing to strengthen its union defined benefit pension reserves and has set a long-term horizon to pay unfunded liabilities. In FY2014, the district adopted funding policies for both DB pension plans. As of June 30, 2016, the non-union plan is 86.2% funded with a net pension liability of $18.4 million (assumes long-term rate of return on the investments of 6.3%). The union plan is 72% funded, with a net pension liability of $183.6 million at June 30, 2016 (assumes long-term rate of return on investment of 6.75%, consistent with the 15-year average rate of return). The FY2018 Adopted Budget is consistent with the pension policies adopted by the Board on February 26, Capital Maintenance and Replacement - Additional buses, light rail maintenance of way, light rail vehicle maintenance, and station maintenance projects are included in the Adopted Budget. Revenues Approximately 95.7% of TriMet s revenues come from three sources; payroll tax revenues (61.5%), passenger revenues (20.2%) and federal formula funds (14.1%). In addition, the budget also includes CIP revenues which are dedicated for uses separate from operations. Overview-3
8 Payroll Tax Revenues - TriMet is projecting strong payroll tax revenue growth through FY2019. In FY2016, underlying employer payroll tax revenues 1 increased 6.6%. Underlying employer payroll tax revenues are forecast to increase 6.2% by the end of FY2017, 5.2% in FY2018 and 5.0% in FY2019. By comparison average annual growth of underlying employer payroll tax has been 5.2% over the last twenty years. Self-employment Tax Revenues - Underlying growth increased 10.6% in FY2016 and is projected to increase 10.2% by the end of FY2017, 8.1% in FY2018 and 7.2% in FY2019. Self-employment tax revenues make up 5% of payroll tax revenue. Passenger Revenue - is TriMet s second largest source of funding, providing 20% of total revenues. TriMet expects FY2017 ridership to remain flat with FY2016 but increase in the future with better on-time-performance and added bus service. Passenger revenues are estimated to increase $3.0 million over projected FY2017 and average $1.9 million per year over the next five years. The FY2018 Adopted Budget assumes no base fare increase. However, the budget includes additional resources for fare inspection and accommodates recent recommendations to improve our fare enforcement processes. Federal Formula Grants - Federal formula funds constitute 14% of TriMet s continuing resources for operations. In addition to approximately $39.4 million of Section 5307 Urbanized Area, $24.5 million Section 5337 State of Good Repair funds, $1.0 million Section 5310 Enhanced Mobility of Seniors & Individuals with Disabilities and $2.9 million 1 Underlying payroll tax revenues exclude revenues from the increase in the payroll tax rate. Overview-4 Section 5339 Buses and Bus Facilities Grants Program, TriMet receives $16.0 million dollars a year in federal highway program funds through the Surface Transportation Program (STP) and Congestion Mitigation & Air Quality (CMAQ) Program to pay for regional rail program debt service. Congress authorized additional funding through FY2020 by passing the Fixing America s Surface Transportation (FAST) Act. TriMet s financial forecast and the FY2018 Adopted Budget include increased projections as a result of the FAST Act authorization. Other Revenues - Include advertising revenue, interest revenue, state operating grants and operating project revenue. Accessible Transportation Contract Revenues - state and federal sources dedicated to LIFT paratransit services. Estimated revenues for FY2017 are $7.4 million and increase to $7.6 million in FY2018. Service Contract Revenues - this category contains only Streetcar Personnel Revenue from the City of Portland who contracts for operating personnel. In FY2018, these revenues are projected to be $8.4 million. Expenditures Service - TriMet is proposing to expand bus service hours 3.42% in FY2018. TriMet will make a series of changes to bus service including adding midday and weekend frequency, extending trips downtown and specific route changes to Lines 81, 87 and 6. We will also add three new service lines. These investments are paid for by revenues generated by the increase in the payroll tax rate. The service improvements will occur
9 throughout FY2018. The cost of the service improvements is approximately $4.9 million, annualized. Pension Funding - The implementation of accounting standard, GASB No. 68, and industry best practices led TriMet to adopt pension funding plans that lay out how TriMet will bring its two closed defined benefit plans to fully funded status over a reasonable long-term horizon. As of June 30, 2016 TriMet s union pension is 72% funded with $183.6 million in unfunded liabilities; the non-union pension is 86% funded with $18.4 million in unfunded liabilities. According to the 2015 National Association of State Retirement Administrators (NASRA), Summary of Findings, the national average pension funding level for governmental plans is 73.7%. The FY2018 Adopted Budget includes the third year of resources to amortize the non-union pension unfunded liability over a closed 10 year period assuming a 6.5% return on investments and to amortize the union pension unfunded liability over a closed 15 year period, slowing to an open 5 year amortization, assuming 7% return on investments. Capital Investments - The FY2018 CIP Adopted Budget includes the following: Buses. TriMet replaced 64 buses in FY2015, 60 buses in FY2016, 33 buses in FY2017 and is planning to replace 42 buses in FY2018. The entire fleet will be low-floor low emission, air conditioned, and at our desired standard average age of 8 years. In FY2018, 15 expansion buses will be purchased to provide expanded service. LIFT Vehicles. Replaced at the scheduled interval of 8 years, approximately 125,000 to 150,000 miles. The FY2018 Adopted Budget assumes these replacements will be 28% funded with ODOT 5310 Formula, ODOT Discretionary 5310 and STF Discretionary funds. In FY2018, a total of 45 LIFT vehicles will be purchased, made up of 25 replacement, 5 expansion buses and 15 passenger vans. Positive Train Control. The Rail Safety Act of 2008 mandates Positive Train Control (PTC) on all railroads which operate passenger rail service like WES. PTC regulations require a train control system that prevents accidents caused by human error, including train-to-train collisions, over speed derailments, incursions into established work zone limits, and the movement of a train through a switch that is in the improper position. Many of these features are present on the current WES system, but new federal regulations require upgrades. Total cost of this mandate is estimated to be $14.0 million, of which $3.0 million is budgeted in FY2018. Safety Improvements. FY2018 will see implementation of a Safety Management System (SMS) for TriMet, and will focus on workforce training necessary to support the SMS and improve our safety outcomes. FY2018 also continues the multi-year project (FY s ) to replace analog CCTV technology on TriMet s buses and Type 1, 2 and 3 light rail vehicles with digital technology. TriMet s new buses and Type 4 and 5 light rail vehicles already have this technology. Additionally, pedestrian safety improvements to prevent/reduce hazards at areas with increasingly intensive land use including 97 th /Burnside, Kelly Ave (Gresham), Main St (Gresham), 28 th Ave (Hillsboro) and 158 th Ave, are planned. Overview-5
10 Fare System Replacement. TriMet is replacing its flashpass old fare collection system with an account based electronic fare collection system that reduces reliance on mechanical equipment like transit vending machines and fare boxes. Customers will be offered stored value accounts and the ability to load transit fares onto cards by smart phone, at retail stores, and online. Fare will be charged when customers tap a validator (low cost equipment with no moving parts and commercial off the shelf technology) on buses and at light rail stations. The budget includes costs of integrating C-TRAN and Streetcar s systems. TriMet will share revenue with both agencies based on actual ridership once the project is up and running. An information campaign is funded to support customer transition. Operating Facilities. The FY2018 Adopted Budget funds a variety of operating facilities repairs, including a full facility for LIFT operations (previously at Powell), phase 1 of the Powell Maintenance Facility and costs associated with a new transit police headquarters. Customer Facilities. The FY2018 Adopted Budget continues to provide funds to refurbish platforms and station finishes along various locations on the MAX Blue Line. MAX Blue Line Station Elevators. Scheduled for refurbishment over the next fifteen years. Typical life expectancy of elevators is 25 to 30 years; actual useful life can vary widely, particularly if elevators are exposed to weather as are many at TriMet. Twelve elevators are due for major work in the next 2-5 years, 3 more are due in 6-9 years and 4 will come due in years. The FY2018 Adopted Budget includes funds to design and begin reconstruction/replacement of elevators. Non-Revenue Vehicles. The FY2018 Adopted Budget includes another year of the non-revenue vehicle fleet replacement program ($2.4 million). Southwest Corridor Project. The FY2018 Adopted budget includes funding for preliminary engineering and Federal environmental impact work. If approved, the project will move into project development in FY2019. The majority of the costs are born by MTIP revenue. Division Transit Project. The FY2018 Adopted budget includes funding for the design and construction of high capacity transit from downtown Portland, across the Tilikum Crossing Bridge and along SE Division to the Gresham Transit Center. TriMet will submit for a Small Starts rating in 2018 and revenue service is anticipated to begin in the fall of Future CIP Needs. TriMet is in process of meeting FTA requirements for a Transit Asset Management Plan. We are also advancing studies to ensure future capacity needs can be met in a reliable way, particularly in critical junctions such as Gateway, Rose Quarter and the Steel Bridge. Diesel Fuel - The cost of bus diesel fuel has decreased over the past four years. FY2015 was budgeted at $3.15 per gallon, FY2016 was budgeted at $2.60 per gallon, FY2017 was budgeted at $2.05 per gallon and FY2018 is budgeted at $1.95 per gallon. Diesel fuel costs for ATP and WES was budgeted Overview-6
11 at $3.30 per gallon in FY2015, $2.75 per gallon in FY2016, $2.22 per gallon in FY2017 and is budgeted at $2.00 per gallon in FY2018. Debt Service Total FY2018 debt service is $139.6 million, of which $100.0 million is to pay back interim financing on the MAX Orange Line project (funded by Federal dollars). Up to $16.0 million of TriMet s FY2018 debt service is funded by MTIP revenues, the regional federal flexible highway funds that TriMet receives from Metro each year to pay debt service on TriMet s 2011 Capital Grant Receipt Revenue Bonds. Existing senior lien payroll tax funded debt service is 4.3% of continuing revenues in FY2018, below the Board s maximum of 6.0%. This does not include any additional debt that may be issued in FY2018 or future years. Diversity and Transit Equity TriMet increased the fare reductions dedicated to diversity and transit equity in September 2016, from $1.3 million to $1.5 million. The increase resulted from the change in the honored citizen fare from $1.00 to $1.25. The increase is intended to provide relief to low income Honored Citizens. In FY2018, TriMet continues to provide fare reductions totaling $1.5 million. The reductions are realized through the fare relief grant program, low income youth mitigation program, social service agency outlet sales program and the fare assistance program. Rail Construction Program MAX Orange Line - FY2016 marked the opening year of the MAX Orange Line which started operating in September Funding for the project has been provided by a State grant of Lottery bond proceeds, MTIP bond proceeds, TriMet bond proceeds, City of Portland contributions, Clackamas County, City of Milwaukie and Federal Transit Administration New Starts grants. TriMet s share of construction and operating cost net of fares is paid for with a small portion of the ten year increase in the first payroll tax rate increase from.6237% to.7237%. TriMet s New Starts appropriation in FY2016 was $100.0 million as scheduled in the Full Funding Grant Agreement. The New Starts appropriation is expected to be $85.0 million in FY2017 and $100.0 million in FY2018, and the balance in FY2019. Staffing Increases In FY2018, TriMet will increase staffing by 86 union positions, of which 39 positions are allocated for transportation operations, 37 positions are allocated for maintenance, 6 positions are allocated for bus and rail operator training and the remaining 4 positions are allocated to the efare project. In addition, about 44 non-union positions will be added. Of which 9.5 positions are dedicated to the CIP where 85% of their costs will be covered by individual project funding, such as the Division Transit Project and the Rail Reliability Project. Another 3 positions are allocated for bus and rail operator training, 22 positions are dedicated to operations; 2 positions were restored to the general fund (Director, Procurement & Contracts and Payroll Manager); 2 positions are offset by reductions to Workers Compensation contracted costs; and the remaining 5 positions alleviate staffing shortages. Overview-7
12 In Summary The FY2018 Adopted Budget focuses on safety, adding bus service and improving schedule reliability. It continues to address essential capital maintenance and replacement. We also continue to advance important regional expansion projects such as the Division Transit Project and Southwest Corridor Project. It is consistent with Board policy to fund the non-union unfunded liability over a closed 10 year period using a 6.5% investment rate of return assumption and funding the union pension unfunded liability over a closed 15 years to an open 5 year amortization, assuming a 7.0% return on investments. It dedicates new payroll tax revenues to new service and meets Board strategic finance plan policies, including limiting debt service to less than 6.0% of ongoing revenue. TriMet is committed to staying on course to achieve long-term fiscal stability to keep our commitments to riders, employees, retirees and payroll taxpayers and to meet the transit needs of our growing region. Overview-8
13 Payroll Tax Rate Increase Allocation FY2016 FY2018 Community Connectors (federal passthrough) $1,218,684 7% Service Enhancements $12,348,395 69% Capacity $1,185,541 7% Reliability $3,098,327 17% Payroll tax rate increase allocation through FY2018 total $17,850,947. 1) FY2016 Payroll Tax Actual $1,075,572 2) FY2017 Payroll Tax Projected $5,782,140 3) FY2018 Payroll Tax Projected $10,993,235 Overview 9
14 Budget Organization Chart: Adopted Budget Office of the General Manager Diversity & Transit Equity Internal Audit Operations Capital Projects Division Public Affairs Division Finance & Administration Division Labor Relations & Human Resources Division Legal Services Division Safety & Security Division Information Technology Division Transportation Division Maintenance Division Administration Administration Administration Administration Safety Administration & Support Bus Maintenance Development & Operations Support Planning & Policy Financial Services Compensation, Benefits & HRIS Security Bus Transportation Facilities Management GIS & Location Based Services Budget & Grants Talent Management Environmental Services Field Operations Rail Maintenance of Way Government Services & Community Affairs Communications & Marketing Insurance Programs Procurement & Contracts Labor Relations Transportation Training Service Delivery ATP/LIFT Rail Equipment Maintenance Customer Experience Fare Revenue Rail Transportation Commuter Rail Streetcar Overview-10
15 GENERAL FUND RESOURCE SUMMARY Line Actual Actual Budget Estimate Budget % Change % Change % of Total No. Revenue Category 14/15 15/16 16/17 16/17 17/18 Budget Estimated Resources Beginning Fund Balance as of July 1* 1. Restricted Bond Proceeds & Other Restricted $ 20,093,524 $ 73,265,333 $ 166,490,638 $ 159,947,094 $ 244,839, % 53.08% 20.41% 2. Restricted Debt Service 38,560,141 22,386,368 19,444,267 33,287,682 39,587, % 18.93% 3.30% 3. Unrestricted 151,759, ,661, ,845, ,051, ,948, % % 12.59% 4. Total Beginning Fund Balance $ 210,413,586 $ 239,313,475 $ 336,780,565 $ 365,286,169 $ 435,376, % 19.19% 36.30% Operating Revenue 5. Passenger $ 116,734,062 $ 118,069,153 $ 120,700,000 $ 117,193,502 $ 120,150, % 2.52% 10.02% 6. Advertising 3,290,000 3,392,500 3,525,000 3,500,000 3,678, % 5.11% 0.31% 7. Accessible Transportation Contract 6,384,143 7,187,860 6,400,000 7,439,000 7,588, % 2.00% 0.63% 8. Service Contracts 17,662,695 8,011,333 8,219,614 8,207,598 8,405, % 2.41% 0.70% 9. Total Operating Revenue $ 144,070,900 $ 136,660,846 $ 138,844,614 $ 136,340,100 $ 139,822, % 2.55% 11.66% Tax Revenue 10. Employer Payroll** $ 273,308,312 $ 305,666,908 $ 318,701,301 $ 318,701,301 $ 345,813, % 8.51% 28.83% 11. Self-Employed** 14,783,448 16,357,820 16,249,828 17,291,676 18,770, % 8.55% 1.57% 12. State "In Lieu"** 3,202,411 1,974,632 1,795,408 1,777,288 1,507, % % 0.13% 13. Total Tax Revenue $ 291,294,171 $ 323,999,360 $ 336,746,537 $ 337,770,265 $ 366,091, % 8.38% 30.53% Other Revenue 14. Urbanized Area Formula Funds $ 25,844,059 $ 32,026,076 $ 39,045,813 $ 38,268,416 $ 39,377, % 2.90% 3.28% 15. Rail State of Good Repair Funds 89,501 17,619,547 21,069,068 20,866,482 24,492, % 17.38% 2.04% 16. MTIP Funds for Regional Rail Debt Service 15,000,000 16,000,000 16,000,000 16,000,000 16,000, % 0.00% 1.33% 17. Fund Exchange Revenue 2,975,000 3,021,148 3,063,139 3,063,139 5,500, % 79.55% 0.46% 18. Other Federal Operating Grants 1,585,213 3,629,943 2,814,538 2,209,986 2,072, % -6.23% 0.17% 19. State Operating Grants 1,481,432 1,328,536 1,354,292 1,200,500 1,249, % 4.09% 0.10% 20. Local Operating Grants 19,524 2,152,280 18,046 18,046 18, % 3.00% 0.00% 21. Local Operating Revenue 377,539 1,156,768 1,188,784 1,179, % -0.81% 0.10% 22. Interest 463, , , , , % 0.50% 0.05% 23. Miscellaneous 9,176,923 4,810,928 4,454,391 4,137,118 4,125, % -0.29% 0.34% 24. Total Other Revenue $ 57,012,798 $ 81,391,251 $ 89,551,055 $ 87,527,471 $ 94,592, % 8.07% 7.87% Total Operating Resources 25. (Excluding Beginning Fund Balance) $ 492,377,869 $ 542,051,457 $ 565,142,206 $ 561,637,836 $ 600,506, % 6.92% 50.06% * Budgetary Fund Balance. Restricted funds include funds held in trust to pay debt service, plus bond proceeds and other resources designated for specific projects. Unrestricted funds are resources maintained to cover cash flow until tax and grant revenues are collected. ** Budgeted payroll tax revenues are an estimate of fiscal year payroll tax cash receipts. Actuals are an estimate of payroll taxes from wages and salaries earned in the fiscal year. Financial Summary-1
16 GENERAL FUND RESOURCE SUMMARY Line Actual Actual Budget Estimate Budget % Change % Change % of Total No. Revenue Category 14/15 15/16 16/17 16/17 17/18 Budget Estimated Resources 26. CIP Resources $ 7,716,436 $ 8,430,634 $ 14,980,042 $ 10,720,927 $ 56,918, % % 4.75% 27. Bond Proceeds 72,865, ,000, % % 0.00% 28. Light Rail Funds Restricted for Debt Service*** 88,520,324 85,000, ,000, % 17.65% 8.34% 29. Light Rail Program Resources 220,656,991 32,724, ,000, % 0.00% 0.00% 30. Other Non-Operating Resources 5,275,775 6,131,234 6,465,101 6,224,101 6,595, % 5.97% 0.55% 31. Total Resources $ 936,440,657 $ 990,037,122 $ 1,048,367,914 $ 1,138,869,033 $ 1,199,397, % 5.31% % *** FY2017 Estimate based on Federal Transit Administration recent projection. FY2018 Budget based on Attachment 6 (Schedule of Federal Funds) in Full Funding Grant Agreement. Financial Summary-2
17 GENERAL FUND REQUIREMENT SUMMARY Line Actual Actual Budget Estimate Budget % Change % Change % of Total No. Division/Department 14/15 15/16 16/17 16/17 17/18 Budget Estimated Requirements Office of the General Manager Division 1. Office of the General Manager $ 964,143 $ 1,026,764 $ 1,080,618 $ 1,010,072 $ 954, % -5.50% 0.08% 2. Diversity and Transit Equity 266, , , , , % 15.79% 0.05% 3. Internal Audit 239, , , , , % -0.54% 0.02% 4. Total Office of the General Manager Division $ 1,470,385 $ 1,574,398 $ 1,894,317 $ 1,808,157 $ 1,834, % 1.47% 0.15% Public Affairs Division 5. Administration $ 308,347 $ 387,323 $ 794,569 $ 642,774 $ 776, % 20.87% 0.06% 6. Planning & Policy 5,027,094 4,551,885 6,205,087 5,452,074 5,885, % 7.95% 0.49% 7. GIS & Location Based Services 483, , , , % 8.66% 0.05% 8. Community Affairs 79, , , % % 0.00% 9. Government Services & Community Affairs 498, , , , , % 65.34% 0.05% 10. Communications & Marketing 1,116,668 3,909,263 3,717,754 3,686,635 4,447, % 20.64% 0.37% 11. Customer Experience 5,538,641 2,798,312 3,186,646 3,014,299 3,618, % 20.04% 0.30% 12. Total Public Affairs Division $ 12,489,511 $ 12,604,497 $ 15,050,888 $ 13,864,575 $ 15,932, % 14.92% 1.32% Safety & Security Division 13. Safety, Security, Environmental Services & Transportation Training $ 13,988,563 $ 15,293,523 $ 21,952,582 $ 21,047,430 $ 25,314, % 20.27% 2.11% 14. Total Safety & Security Division $ 13,988,563 $ 15,293,523 $ 21,952,582 $ 21,047,430 $ 25,314, % 20.27% 2.11% Information Technology Division 15. Information Technology $ 7,634,091 $ 8,249,692 $ 11,057,539 $ 10,194,452 $ 12,275, % 20.41% 1.02% 16. Total Information Technology Division $ 7,634,091 $ 8,249,692 $ 11,057,539 $ 10,194,452 $ 12,275, % 20.41% 1.02% Finance & Administration Division 17. Administration $ 1,507,291 $ 402,427 $ 711,072 $ 554,157 $ 741, % 33.81% 0.06% 18. Financial Services 1,883,335 2,077,178 2,275,892 2,066,160 2,407, % 16.51% 0.20% 19. Budget & Grants Administration 3,595, , , , , % 18.24% 0.08% 20. Insurance Programs 534,173 1,979,920 3,669,686 3,515,389 3,652, % 3.90% 0.30% 21. Procurement & Contracts 1,293,719 1,325,156 1,434,644 1,547,817 1,689, % 9.13% 0.14% 22. Fare Revenue 5,692,808 7,202,265 9,053,362 8,109,605 10,842, % 33.70% 0.90% 23. Total Finance & Administration Division $ 14,506,789 $ 13,735,252 $ 18,039,461 $ 16,572,090 $ 20,253, % 22.22% 1.68% Labor Relations & Human Resources Division 24. Administration $ 1,695,241 $ 1,882,951 $ 2,348,972 $ 2,264,250 $ 758, % % 0.06% 25. Compensation, Benefits & HRIS 1,092,202 1,058,087 1,321,757 1,274,267 1,363, % 6.98% 0.11% 26. Talent Management 1,578, % % 0.13% 27. Labor Relations 412, , , , , % 58.89% 0.07% 28. Total Labor Relations & Human Resources Division $ 3,199,734 $ 3,357,431 $ 4,093,165 $ 4,055,016 $ 4,521, % 11.50% 0.37% Financial Summary-3
18 GENERAL FUND REQUIREMENT SUMMARY Line Actual Actual Budget Estimate Budget % Change % Change % of Total No. Division/Department 14/15 15/16 16/17 16/17 17/18 Budget Estimated Requirements Legal Services Division 29. Legal Services $ 1,803,186 $ 1,864,666 $ 2,098,171 $ 1,895,185 $ 2,236, % 17.99% 0.19% 30. Total Legal Services Division $ 1,803,186 $ 1,864,666 $ 2,098,171 $ 1,895,185 $ 2,236, % 17.99% 0.19% Operations Division 31. Administration & Support $ 1,114,879 $ 1,956,945 $ 2,306,054 $ 2,259,032 $ 2,505, % 10.93% 0.21% 32. Bus Transportation 106,667, ,996, ,821, ,513, ,012, % 6.49% 10.26% 33. Field Operations 14,708,879 16,205,583 17,368,203 17,843,897 19,332, % 8.34% 1.61% 34. Service Delivery 1,503,580 1,605,472 1,565,305 1,620,025 1,577, % -2.61% 0.13% 35. Accessible Transportation Programs-LIFT 33,861,160 35,271,578 35,786,525 35,986,612 36,982, % 2.77% 3.08% 36. Accessible Transportation Programs-MTP 12,194, % 0.00% 0.00% 37. Rail Transportation 17,785,030 21,201,031 22,005,567 21,229,278 21,750, % 2.46% 1.81% 38. Commuter Rail 6,438,285 6,976,749 5,554,024 6,000,032 5,917, % -1.38% 0.49% 39. Streetcar 9,766,461 14,237,880 14,517,415 14,736,032 14,665, % -0.48% 1.22% 40. Bus Maintenance 50,277,358 48,146,066 56,262,750 55,596,222 58,072, % 4.45% 4.84% 41. Facilities Management 15,589,112 17,236,704 16,855,510 17,372,090 19,008, % 9.42% 1.58% 42. Rail Maintenance of Way 15,116,638 16,056,884 16,234,157 16,335,746 16,786, % 2.76% 1.40% 43. Rail Equipment Maintenance 23,957,667 29,906,443 30,495,696 33,716,472 34,862, % 3.40% 2.91% 44. Total Operations Division $ 308,981,325 $ 323,798,045 $ 336,772,896 $ 338,209,384 $ 354,473, % 4.81% 29.54% Capital Projects Division 45. Administration $ 401,348 $ 470,297 $ 907,647 $ 548,167 $ 767, % 39.96% 0.06% 46. Development & Operations Support 2,978,216 2,872,211 2,629,435 3,877,714 3,582, % -7.62% 0.30% 47. Capital Program 383, % 0.00% 0.00% 48. In-Street Transit Facilities Development 595, , % 0.00% 0.00% 49. Total Capital Projects Division $ 3,974,799 $ 4,377,024 $ 3,537,082 $ 4,425,881 $ 4,349, % -1.72% 0.36% 50. OPEB & Pension UAAL $ 47,828,738 $ 50,095,658 $ 49,637,303 $ 49,223,754 $ 48,385, % -1.70% 4.03% 51. Regional Fund Exchanges 3,021,148 3,063,139 3,063,139 5,500, % 79.55% 0.46% 52. Debt Service 21,242,456 35,575, ,482, ,286, ,587, % -1.90% 11.64% 53. Total Operating Requirements $ 437,119,576 $ 473,547,016 $ 732,679,046 $ 606,645,274 $ 634,665, % 4.62% 52.87% Financial Summary-4
19 GENERAL FUND REQUIREMENT SUMMARY Line Actual Actual Budget Estimate Budget % Change % Change % of Total No. Division/Department 14/15 15/16 16/17 16/17 17/18 Budget Estimated Requirements CIP Capital & Operating Projects: 54. Public Affairs Division $ 572,840 $ 2,446,312 $ 8,127,404 $ 2,505,067 $ 2,233, % % 0.19% 55. Safety & Security Division 2,140,636 2,592,344 8,797,560 3,547,826 20,902, % % 1.74% 56. Information Technology Division 4,406,141 7,629,762 13,978,046 4,216,503 12,493, % % 1.04% 57. Finance & Administration Division 6,263,553 16,963,036 19,927,172 2,752,752 15,456, % % 1.29% 58. Legal Services Division 5,000 41, , , , % % 0.04% 59. Operations Division 49,887,817 55,061,484 63,989,560 47,979,891 78,348, % 63.29% 6.53% 60. Capital Projects Division 9,824,577 15,417,277 41,952,574 29,490,311 73,226, % % 6.11% 61. Total CIP $ 73,100,564 $ 100,152,054 $ 157,072,316 $ 90,622,943 $ 203,085, % % 16.94% 62. Light Rail Program $ 181,631,270 $ 44,920, % 0.00% 0.00% 63. Pass Through Requirements 5,275,775 6,131,234 $ 6,465,101 $ 6,224,101 $ 6,595, % 5.97% 0.55% 64. Contingency 21,722,871 23,880, % % 1.99% Ending Fund Balance as of June 30* 65. Restricted Bond Proceeds & Other Restricted 73,265, ,947,094 3,095, ,839, ,786, % % 14.49% 66. Restricted Debt Service 22,386,368 33,287,682 24,434,260 39,587,854 24,969, % % 2.08% 67. Unrestricted 143,661, ,051, ,898, ,948, ,413, % % 11.04% 68. Total Ending Fund Balance $ 239,313,475 $ 365,286,169 $ 130,428,580 $ 435,376,715 $ 331,169, % % 27.65% 69. Total Requirements $ 936,440,657 $ 990,037,122 $ 1,048,367,914 $ 1,138,869,033 $ 1,199,397, % 5.31% % * Budgetary Fund Balance. Restricted funds include funds held in Trust to pay debt service, plus bond proceeds and other resources designated for specific projects. Unrestricted funds are resources maintained to cover cash flow until tax and grant revenues are collected. Financial Summary-5
20 CIP RESOURCES Line Actual Actual Budget Estimate Budget No. 14/15 15/16 16/17 16/17 17/18 1. State, local government & private contributions $ 1,044,467 $ 1,213,766 $ 7,179,881 $ 5,594,798 $ 5,268, Federal Transit Administration grants, programmed 6,671,969 7,216,868 7,800,161 5,126,129 51,650, Revenue Bond Proceeds 71,885,000 33,076,607 18,806,933 61,790, Operating resources dedicated for capital* 65,384,128 19,836, ,015,667 61,095,083 84,376, Total CIP Resources $ 73,100,564 $ 100,152,054 $ 157,072,316 $ 90,622,943 $ 203,085,564 * Line included for information only. Operating resources are drawn on General Fund Resources. Financial Summary-6
21 CIP REQUIREMENTS Line Actual Actual Budget Estimate Budget % of Total No. 14/15 15/16 16/17 16/17 17/18 Requirements 1. Public Affairs Division $ 572,840 $ 2,446,312 $ 8,127,404 $ 2,505,067 $ 2,233, % 2. Safety & Security Division 2,140,636 2,592,344 8,797,560 3,547,826 20,902, % 3. Information Technology Division 4,406,141 7,629,762 13,978,046 4,216,503 12,493, % 4. Finance & Administration Division 6,263,553 16,963,036 19,927,172 2,752,752 15,456, % 5. Legal Services Division 5,000 41, , , , % 6. Operations Division 49,887,817 55,061,484 63,989,560 47,979,891 78,348, % 7. Capital Projects Division 9,824,577 15,417,277 41,952,574 29,490,311 73,226, % 8. Total CIP Requirements $ 73,100,564 $ 100,152,054 $ 157,072,316 $ 90,622,943 $ 203,085, % Financial Summary-7
22 EXTERNAL LIGHT RAIL PROGRAM RESOURCES Line Actual Actual Budget Estimate Budget No. 14/15 15/16 16/17 16/17 17/18 1. State, local government & private contributions $ 120,656,991 $ 21,245, Federal Transit Administration Grants 100,000,000 11,479, Total Light Rail Program Resources $ 220,656,991 $ 32,724,998 * Starting FY2016/2017 Light Rail Program is now reflected in the CIP. Financial Summary-8
23 LIGHT RAIL PROGRAM REQUIREMENTS Line Actual Actual Budget Estimate Budget No. 14/15 15/16 16/17 16/17 17/18 1. Portland-Milwaukie Light Rail Project $ 181,631,270 $ 44,920, Total Light Rail Program Requirements $ 181,631,270 $ 44,920,649 Financial Summary-9
24 SUMMARY OF FUND HISTORY Actual Actual Budget General Fund Proposed Approved Adopted 14/15 15/16 16/17 17/18 17/18 17/18 I. Operating Program A. Resources $ 210,413,586 $ 239,313,475 $ 336,780,565 Beginning Fund Balance-Restricted and Unrestricted $ 413,325,554 $ 413,325,554 $ 435,376, ,734, ,069, ,700,000 Passenger Revenue 120,150, ,150, ,150,000 27,336,838 18,591,693 18,144,614 Other Operating Revenue 19,135,566 19,135,566 19,672, ,294, ,999, ,746,537 Tax Revenue 366,091, ,091, ,091,544 57,012,798 81,391,251 89,551,055 Other Revenue 94,781,636 94,781,636 94,592,666 5,275,775 6,131,234 6,465,101 Other Non-Operating Resources 6,660,271 6,660,271 6,595,892 72,865,000 Bond Proceeds 88,520,324 Light Rail Funds Restricted for Debt Service 125,000,000 Light Rail Program Resources 100,000, ,000, ,000,000 $ 708,067,230 $ 948,881,490 $ 1,033,387,872 Total Operating Program Resources $ 1,120,144,571 $ 1,120,144,571 $ 1,142,479,130 B. Requirements $ 283,199,323 $ 311,337,588 $ 326,257,390 Personnel Services $ 340,560,138 $ 340,499,524 $ 339,387, ,677, ,612, ,876,014 Materials & Services 135,040, ,810, ,190,180 21,242,456 35,575, ,482,503 Debt Service 137,621, ,621, ,587,854 5,275,775 6,131,234 6,465,101 Pass Through Requirements 6,660,271 6,660,271 6,595,892 3,021,148 3,063,139 Regional Fund Exchanges 5,500,000 5,500,000 5,500,000 21,722,871 Contingency 23,402,639 23,813,930 23,880, ,313, ,286, ,428,580 Ending Fund Balance-Restricted and Unrestricted 324,256, ,135, ,169,498 $ 681,708,825 $ 844,964,419 $ 891,295,598 Total Operating Program Requirements $ 973,041,200 $ 973,041,200 $ 996,312,223 II. CIP A. Resources $ 1,044,467 $ 1,213,766 $ 7,179,881 State, Local Government & Private Contributions $ 4,582,832 $ 4,582,832 $ 5,268,212 6,671,969 7,216,868 7,800,161 Federal Transit Administration Grants 25,728,683 25,728,683 51,650,445 $ 7,716,436 $ 8,430,634 $ 14,980,042 Total CIP Resources $ 30,311,515 $ 30,311,515 $ 56,918,657 B. Requirements $ 73,100,564 $ 100,152,054 $ 157,072,316 Projects $ 177,414,886 $ 177,414,886 $ 203,085,564 $ 73,100,564 $ 100,152,054 $ 157,072,316 Total CIP Requirements $ 177,414,886 $ 177,414,886 $ 203,085,564 Financial Summary-10
25 SUMMARY OF FUND HISTORY Actual Actual Budget General Fund Proposed Approved Adopted 14/15 15/16 16/17 17/18 17/18 17/18 III. Light Rail Program A. Resources $ 120,656,991 $ 21,245,322 State, Local Government & Private Contributions 100,000,000 11,479,676 Federal Transit Administration Grants $ 220,656,991 $ 32,724,998 Total Light Rail Program Resources B. Requirements $ 181,631,270 $ 44,920,649 Portland-Milwaukie Light Rail Project $ 181,631,270 $ 44,920,649 Total Light Rail Program Requirements $ 936,440,657 $ 990,037,122 $ 1,048,367,914 Total General Fund Resources $ 1,150,456,086 $ 1,150,456,086 $ 1,199,397,787 $ 936,440,657 $ 990,037,122 $ 1,048,367,914 Total General Fund Requirements $ 1,150,456,086 $ 1,150,456,086 $ 1,199,397,787 Financial Summary-11
26 PASS THROUGH REVENUES AND REQUIREMENTS Line Actual Actual Budget Estimate Budget % Change % of Total No. 14/15 15/16 16/17 16/17 17/18 Budget Resources 1. Special Transportation Fund Formula $ 2,979,287 $ 5,983,489 $ 3,196,379 $ 3,196,379 $ 3,214, % 48.73% 2. Special Transportation Fund Discretionary 2,178,341 2,178,341 2,178, % 33.03% 3. State 5310 Formula Funds 269, % 4.08% 4. Barbur-99W Safety & Access to Transit 241, % 0.00% 5. Title XIX Match Clackamas, Multnomah & Washington Counties 812, , , % 10.43% 6. Ride Connection State 5310 Match 12,984 10,052 9,125 9,125 6, % 0.09% 7. Ride Connection FTA Veteran's Grants 89,745 45, % 8. Ride Connection FTA Livability for Resource Center 641, % 9. Ride Connection FTA Elderly & Disabled Program (5310) Match 28,847 29,152 27,962 27, , % 3.64% 10. Portland Streetcar FTA 5312 Prototype Grant 551, % 11. Portland Streetcar FTA 5309 Small Starts Grant 763,996 54, % 12. Close the Loop Project 76,913 8, % 13. Clackamas County - 158th MAX Crossing Recovery 131, % 14. Total pass through revenues and requirements $ 5,275,775 $ 6,131,234 $ 6,465,101 $ 6,224,101 $ 6,595, % % REGIONAL FUND EXCHANGES Line Actual Actual Budget Estimate Budget % Change % of Total No. 14/15 15/16 16/17 16/17 17/18 Budget Resources 1. Metro Program Fund Exchanges* $ 3,021,148 $ 3,063,139 $ 3,063,139 $ 5,500, % % 2. Total regional fund exchanges $ 3,021,148 $ 3,063,139 $ 3,063,139 $ 5,500, % % * Metro Transit Oriented Development Program Fund Exchange included in the Public Affairs Division in FY2014/2015. Budget for FY2017/2018 also includes additional Metro Fund Exchanges. Financial Summary-12
 CIP $56,918,657 (7.45%) State Grants $1,249,657 (0.15%) Non-Operating $6,595,892 (0.")
 Passenger Revenue $120,150,000 (15.")
27 GENERAL FUND RESOURCES Budget 17/18 Payroll Taxes $366,091,544 (47.92%) Other Sources $24,995,164 (3.27%) CIP $56,918,657 (7.45%) State Grants $1,249,657 (0.15%) Non-Operating $6,595,892 (0.86%) Light Rail Program $100,000,000 (13.09%) Federal Grants $87,442,283 (11.45%) Interest $577,875 (0.08%) Passenger Revenue $120,150,000 (15.73%) Total Resources = $764,021,072* *Resources exclude Beginning Fund Balance of $435,376,715 Resources-1
28 GENERAL FUND RESOURCE SUMMARY Line Actual Actual Budget Estimate Budget % Change % Change % of Total No. Revenue Category 14/15 15/16 16/17 16/17 17/18 Budget Estimated Resources Beginning Fund Balance as of July 1* 1. Restricted Bond Proceeds & Other Restricted $ 20,093,524 $ 73,265,333 $ 166,490,638 $ 159,947,094 $ 244,839, % 53.08% 20.41% 2. Restricted Debt Service 38,560,141 22,386,368 19,444,267 33,287,682 39,587, % 18.93% 3.30% 3. Unrestricted 151,759, ,661, ,845, ,051, ,948, % % 12.59% 4. Total Beginning Fund Balance $ 210,413,586 $ 239,313,475 $ 336,780,565 $ 365,286,169 $ 435,376, % 19.19% 36.30% Operating Revenue 5. Passenger $ 116,734,062 $ 118,069,153 $ 120,700,000 $ 117,193,502 $ 120,150, % 2.52% 10.02% 6. Advertising 3,290,000 3,392,500 3,525,000 3,500,000 3,678, % 5.11% 0.31% 7. Accessible Transportation Contract 6,384,143 7,187,860 6,400,000 7,439,000 7,588, % 2.00% 0.63% 8. Service Contracts 17,662,695 8,011,333 8,219,614 8,207,598 8,405, % 2.41% 0.70% 9. Total Operating Revenue $ 144,070,900 $ 136,660,846 $ 138,844,614 $ 136,340,100 $ 139,822, % 2.55% 11.66% Tax Revenue 10. Employer Payroll** $ 273,308,312 $ 305,666,908 $ 318,701,301 $ 318,701,301 $ 345,813, % 8.51% 28.83% 11. Self-Employed** 14,783,448 16,357,820 16,249,828 17,291,676 18,770, % 8.55% 1.57% 12. State "In Lieu"** 3,202,411 1,974,632 1,795,408 1,777,288 1,507, % % 0.13% 13. Total Tax Revenue $ 291,294,171 $ 323,999,360 $ 336,746,537 $ 337,770,265 $ 366,091, % 8.38% 30.53% Other Revenue 14. Urbanized Area Formula Funds $ 25,844,059 $ 32,026,076 $ 39,045,813 $ 38,268,416 $ 39,377, % 2.90% 3.28% 15. Rail State of Good Repair Funds 89,501 17,619,547 21,069,068 20,866,482 24,492, % 17.38% 2.04% 16. MTIP Funds for Regional Rail Debt Service 15,000,000 16,000,000 16,000,000 16,000,000 16,000, % 0.00% 1.33% 17. Fund Exchange Revenue 2,975,000 3,021,148 3,063,139 3,063,139 5,500, % 79.55% 0.46% 18. Other Federal Operating Grants 1,585,213 3,629,943 2,814,538 2,209,986 2,072, % -6.23% 0.17% 19. State Operating Grants 1,481,432 1,328,536 1,354,292 1,200,500 1,249, % 4.09% 0.10% 20. Local Operating Grants 19,524 2,152,280 18,046 18,046 18, % 3.00% 0.00% 21. Local Operating Revenue 377,539 1,156,768 1,188,784 1,179, % -0.81% 0.10% 22. Interest 463, , , , , % 0.50% 0.05% 23. Miscellaneous 9,176,923 4,810,928 4,454,391 4,137,118 4,125, % -0.29% 0.34% 24. Total Other Revenue $ 57,012,798 $ 81,391,251 $ 89,551,055 $ 87,527,471 $ 94,592, % 8.07% 7.87% Total Operating Resources 25. (Excluding Beginning Fund Balance) $ 492,377,869 $ 542,051,457 $ 565,142,206 $ 561,637,836 $ 600,506, % 6.92% 50.06% * Budgetary Fund Balance. Restricted funds include funds held in trust to pay debt service, plus bond proceeds and other resources designated for specific projects. Unrestricted funds are resources maintained to cover cash flow until tax and grant revenues are collected. ** Budgeted payroll tax revenues are an estimate of fiscal year payroll tax cash receipts. Actuals are an estimate of payroll taxes from wages and salaries earned in the fiscal year. Resources-2
29 GENERAL FUND RESOURCE SUMMARY Line Actual Actual Budget Estimate Budget % Change % Change % of Total No. Revenue Category 14/15 15/16 16/17 16/17 17/18 Budget Estimated Resources 26. CIP Resources $ 7,716,436 $ 8,430,634 $ 14,980,042 $ 10,720,927 $ 56,918, % % 4.75% 27. Bond Proceeds 72,865, ,000, % % 0.00% 28. Light Rail Funds Restricted for Debt Service*** 88,520,324 85,000, ,000, % 17.65% 8.34% 29. Light Rail Program Resources 220,656,991 32,724, ,000, % 0.00% 0.00% 30. Other Non-Operating Resources 5,275,775 6,131,234 6,465,101 6,224,101 6,595, % 5.97% 0.55% 31. Total Resources $ 936,440,657 $ 990,037,122 $ 1,048,367,914 $ 1,138,869,033 $ 1,199,397, % 5.31% % *** FY2017 Estimate based on Federal Transit Administration recent projection. FY2018 Budget based on Attachment 6 (Schedule of Federal Funds) in Full Funding Grant Agreement. Resources-3
30 GENERAL FUND RESOURCE SUMMARY BY SOURCE Line Actual Actual Budget Estimate Budget % Change % Change % of Total No. Revenue Category 14/15 15/16 16/17 16/17 17/18 Budget Estimated Resources Beginning Fund Balance as of July 1* 1. Restricted Bond Proceeds & Other Restricted $ 20,093,524 $ 73,265,333 $ 166,490,638 $ 159,947,094 $ 244,839, % 53.08% 20.41% 2. Restricted Debt Service 38,560,141 22,386,368 19,444,267 33,287,682 39,587, % 18.93% 3.30% 3. Unrestricted 151,759, ,661, ,845, ,051, ,948, % % 12.59% 4. Total Beginning Fund Balance $ 210,413,586 $ 239,313,475 $ 336,780,565 $ 365,286,169 $ 435,376, % 19.19% 36.30% Operating Revenue 5. Passenger $ 116,734,062 $ 118,069,153 $ 120,700,000 $ 117,193,502 $ 120,150, % 2.52% 10.02% 6. Advertising 3,290,000 3,392,500 3,525,000 3,500,000 3,678, % 5.11% 0.31% 7. Accessible Transportation Contract 6,384,143 7,187,860 6,400,000 7,439,000 7,588, % 2.00% 0.63% 8. Service Contracts 17,662,695 8,011,333 8,219,614 8,207,598 8,405, % 2.41% 0.70% 9. Local Operating Revenue 377,539 1,156,768 1,188,784 1,179, % -0.81% 0.10% 10. Total Operating Revenue $ 144,448,439 $ 136,660,846 $ 140,001,382 $ 137,528,884 $ 141,001, % 2.52% 11.76% Non-Operating Resources 11. Interest $ 463,607 $ 802,793 $ 575,000 $ 575,000 $ 577, % 0.50% 0.05% 12. Miscellaneous 9,176,923 4,810,928 4,454,391 4,137,118 4,125, % -0.29% 0.35% 13. Total Non-Operating Resources $ 9,640,530 $ 5,613,721 $ 5,029,391 $ 4,712,118 $ 4,702, % -0.19% 0.40% Tax Revenue 14. Employer Payroll** $ 273,308,312 $ 305,666,908 $ 318,701,301 $ 318,701,301 $ 345,813, % 8.51% 28.83% 15. Self-Employed** 14,783,448 16,357,820 16,249,828 17,291,676 18,770, % 8.55% 1.57% 16. State "In-Lieu"** 3,202,411 1,974,632 1,795,408 1,777,288 1,507, % % 0.13% 17. Total Tax Revenue $ 291,294,171 $ 323,999,360 $ 336,746,537 $ 337,770,265 $ 366,091, % 8.38% 30.53% Grants 18. Federal Operating Grants $ 45,493,773 $ 72,296,714 $ 81,992,558 $ 80,408,022 $ 87,442, % 8.75% 7.29% 19. State Operating Grants 1,481,432 1,328,536 1,354,292 1,200,500 1,249, % 4.09% 0.10% 20. Local Operating Grants 19,524 2,152,280 18,046 18,046 18, % 3.00% 0.00% 21. Capital Grants 106,671, ,216,868 7,800,161 90,126, ,650, % 68.26% 12.66% 22. Total Grants $ 153,666,698 $ 182,994,398 $ 91,165,057 $ 171,752,697 $ 240,360, % 39.95% 20.05% * Budgetary Fund Balance. Restricted funds include funds held in trust to pay debt service, plus bond proceeds and other resources designated for specific projects. Unrestricted funds are resources maintained to cover cash flow until tax and grant revenues are collected. ** Budgeted payroll tax revenues are an estimate of fiscal year payroll tax cash receipts. Actuals are an estimate of payroll taxes from wages and salaries earned in the fiscal year. Resources-4
31 GENERAL FUND RESOURCE SUMMARY BY SOURCE Line Actual Actual Budget Estimate Budget % Change % Change % of Total No. Revenue Category 14/15 15/16 16/17 16/17 17/18 Budget Estimated Resources Other Capital 23. Capital Assistance $ 121,701,458 $ 22,459,088 $ 7,179,881 $ 5,594,798 $ 5,268, % -5.84% 0.44% 24. Total Other Capital $ 121,701,458 $ 22,459,088 $ 7,179,881 $ 5,594,798 $ 5,268, % -5.84% 0.44% Other Resources 25. Bond Proceeds $ 72,865,000 $ 110,000, % % 0.00% 26. Other Non-Operating Resources $ 5,275,775 6,131,234 $ 131,465,101 6,224,101 $ 6,595, % 5.97% 0.55% 27. Total Other Resources $ 5,275,775 $ 78,996,234 $ 131,465,101 $ 116,224,101 $ 6,595, % % 0.55% 28. Total Resources $ 936,440,657 $ 990,037,122 $ 1,048,367,914 $ 1,138,869,033 $ 1,199,397, % 5.31% % Resources-5
32 FEDERAL & STATE GRANT/LOCAL CONTRIBUTION SUMMARY % of Budget Type of Funding Purpose Contributions 17/18 Federal Operating Grants FTA Section 5307 Urbanized Area Formula Funds Preventive Maintenance 80.00% $ 38,757,589 FTA Section 5307 Urbanized Area Formula Funds Community Job Connectors 50.00% 620,000 FTA Section 5337 State of Good Repair Funds Preventive Maintenance 80.00% 24,492,476 Regional STP & CMAQ FHWA Flex Funds Regional Rail Debt Service 89.73% 16,000,000 Regional STP FHWA Flex Funds Metro Program Fund Exchanges 89.73% 5,500,000 Federal Transit Security Operating Grant Funds Various Transit Security Projects % 300,000 Regional STP FHWA Flex Funds Regional Transportation Options Program 89.73% 502,625 FTA Section 5310 Enhanced Mobility of Seniors & Individuals w/disabilities Funds Ride Connection Contracted Service 80.00% 960,000 Homeland Security Funds Safety & Security - Police/Canine % 309,593 Total Federal Operating Grants $ 87,442,283 Federal CIP Grants FTA Section 5339(a) Bus & Bus Facilities Formula Funds 42 Replacement 40' Buses (FY2018 order) 80.00% $ 2,877,416 FTA Section 5309 New Starts Funds Portland-Milwaukie Light Rail Project 55.88% 23,801,300 Regional STP & CMAQ FHWA Flex Funds East Portland Transportation to Transit: Bike parking 89.73% 338,467 FTA Section 5339(c) Bus & Bus Facilities (Low & No-Emission Vehicle Program) Funds Low-No Zero Emission Bus Project 46.88% 1,238,000 Regional STP FHWA Flex Funds Powell-Division Corridor Safety & Access to Transit 89.73% 976,262 Regional CMAQ Flex Funds Division Transit Project 89.73% 5,960,000 Regional CMAQ Flex Funds Southwest Corridor Project 89.73% 15,000,000 FTA Section 5312 Research, Technical Assistance and Training Programs Funds Open Trip Planner 80.00% 609,000 Transit Security Grant Funds CCTV Cameras (Networked) % 850,000 Total Federal CIP Grants $ 51,650,445 Total Federal Grants $ 139,092,728 State Operating Grants State Special Transportation Funds LIFT Operations % $ 248,258 State 5310 Formula Funds LIFT Operations 80.00% 736,062 State 5310 Contracted Accessibility Services Funds Shuttle Services 80.00% 265,337 Total State Operating Grants $ 1,249,657 State CIP Grants State 5310 Formula/Discretionary and STF Discretionary Funds ATP Fleet Expansion/Replacement 89.73% $ 1,051,915 State 5311 Transit Network Program Funds Downtown Layover Facility 89.73% 81,654 State STF Discretionary Funds LIFT Automated Customer Information 89.73% 89,730 Connect Oregon V Funds Westside Bike & Rides 90.00% 1,204,638 Total State CIP Grants $ 2,427,937 Total State Grants $ 3,677,594 Resources-6
33 FEDERAL & STATE GRANT/LOCAL CONTRIBUTION SUMMARY % of Budget Type of Funding Purpose Contributions 17/18 Local Operating Contributions Metro Open Street Map Data Maintenance $ 18,587 Total Local Operating Contributions $ 18,587 Local CIP Contributions Oregon Department of Transportation Barbur-99W Corridor Safety & Access to Transit $ 23,571 City of Portland Barbur-99W Corridor Safety & Access to Transit 105,781 City of Tigard Barbur-99W Corridor Safety & Access to Transit 134,024 Metro Division Transit Project 620,309 City of Gresham Division Transit Project 6,807 City of Portland Division Transit Project 372,700 Multnomah County Division Transit Project 41,500 Oregon Department of Transportation Division Transit Project 672,538 Metro Southwest Corridor Project 87,558 Portland General Electric Low-No Zero Emission Bus Project 462,000 City of Lake Oswego Willamette Shore Trolley 208,487 Metro Open Trip Planner 5,000 Moovel Open Trip Planner 100,000 Total Local CIP Contributions $ 2,840,275 Total Local Contributions $ 2,858,862 Resources-7
34 [This Page Left Intentionally Blank] Resources-8
 Regional Fund Exchanges $5,500,000 (0.63%) Contingency $23,880,963 (2.75%) Total Requirements = $868,228,289* OPEB & Pension UAAL $48,385,376 (5.57%) Debt Service $139,587,854 (16.")
35 Operations $354,473,652 (40.83%) GENERAL FUND REQUIREMENTS Budget 17/18 CIP $203,085,564 (23.39%) General & Administrative $86,718,988 (9.99%) Pass Through Requirements $6,595,892 (0.76%) Regional Fund Exchanges $5,500,000 (0.63%) Contingency $23,880,963 (2.75%) Total Requirements = $868,228,289* OPEB & Pension UAAL $48,385,376 (5.57%) Debt Service $139,587,854 (16.08%) *Requirements exclude Ending Fund Balance of $331,169,498. Requirements-1
36 GENERAL FUND REQUIREMENT SUMMARY Line Actual Actual Budget Estimate Budget % Change % Change % of Total No. Division/Department 14/15 15/16 16/17 16/17 17/18 Budget Estimated Requirements Office of the General Manager Division 1. Office of the General Manager $ 964,143 $ 1,026,764 $ 1,080,618 $ 1,010,072 $ 954, % -5.50% 0.08% 2. Diversity and Transit Equity 266, , , , , % 15.79% 0.05% 3. Internal Audit 239, , , , , % -0.54% 0.02% 4. Total Office of the General Manager Division $ 1,470,385 $ 1,574,398 $ 1,894,317 $ 1,808,157 $ 1,834, % 1.47% 0.15% Public Affairs Division 5. Administration $ 308,347 $ 387,323 $ 794,569 $ 642,774 $ 776, % 20.87% 0.06% 6. Planning & Policy 5,027,094 4,551,885 6,205,087 5,452,074 5,885, % 7.95% 0.49% 7. GIS & Location Based Services 483, , , , % 8.66% 0.05% 8. Community Affairs 79, , , % % 0.00% 9. Government Services & Community Affairs 498, , , , , % 65.34% 0.05% 10. Communications & Marketing 1,116,668 3,909,263 3,717,754 3,686,635 4,447, % 20.64% 0.37% 11. Customer Experience 5,538,641 2,798,312 3,186,646 3,014,299 3,618, % 20.04% 0.30% 12. Total Public Affairs Division $ 12,489,511 $ 12,604,497 $ 15,050,888 $ 13,864,575 $ 15,932, % 14.92% 1.32% Safety & Security Division 13. Safety, Security, Environmental Services & Transportation Training $ 13,988,563 $ 15,293,523 $ 21,952,582 $ 21,047,430 $ 25,314, % 20.27% 2.11% 14. Total Safety & Security Division $ 13,988,563 $ 15,293,523 $ 21,952,582 $ 21,047,430 $ 25,314, % 20.27% 2.11% Information Technology Division 15. Information Technology $ 7,634,091 $ 8,249,692 $ 11,057,539 $ 10,194,452 $ 12,275, % 20.41% 1.02% 16. Total Information Technology Division $ 7,634,091 $ 8,249,692 $ 11,057,539 $ 10,194,452 $ 12,275, % 20.41% 1.02% Finance & Administration Division 17. Administration $ 1,507,291 $ 402,427 $ 711,072 $ 554,157 $ 741, % 33.81% 0.06% 18. Financial Services 1,883,335 2,077,178 2,275,892 2,066,160 2,407, % 16.51% 0.20% 19. Budget & Grants Administration 3,595, , , , , % 18.24% 0.08% 20. Insurance Programs 534,173 1,979,920 3,669,686 3,515,389 3,652, % 3.90% 0.30% 21. Procurement & Contracts 1,293,719 1,325,156 1,434,644 1,547,817 1,689, % 9.13% 0.14% 22. Fare Revenue 5,692,808 7,202,265 9,053,362 8,109,605 10,842, % 33.70% 0.90% 23. Total Finance & Administration Division $ 14,506,789 $ 13,735,252 $ 18,039,461 $ 16,572,090 $ 20,253, % 22.22% 1.68% Labor Relations & Human Resources Division 24. Administration $ 1,695,241 $ 1,882,951 $ 2,348,972 $ 2,264,250 $ 758, % % 0.06% 25. Compensation, Benefits & HRIS 1,092,202 1,058,087 1,321,757 1,274,267 1,363, % 6.98% 0.11% 26. Talent Management 1,578, % % 0.13% 27. Labor Relations 412, , , , , % 58.89% 0.07% 28. Total Labor Relations & Human Resources Division $ 3,199,734 $ 3,357,431 $ 4,093,165 $ 4,055,016 $ 4,521, % 11.50% 0.37% Requirements-2
37 GENERAL FUND REQUIREMENT SUMMARY Line Actual Actual Budget Estimate Budget % Change % Change % of Total No. Division/Department 14/15 15/16 16/17 16/17 17/18 Budget Estimated Requirements Legal Services Division 29. Legal Services $ 1,803,186 $ 1,864,666 $ 2,098,171 $ 1,895,185 $ 2,236, % 17.99% 0.19% 30. Total Legal Services Division $ 1,803,186 $ 1,864,666 $ 2,098,171 $ 1,895,185 $ 2,236, % 17.99% 0.19% Operations Division 31. Administration & Support $ 1,114,879 $ 1,956,945 $ 2,306,054 $ 2,259,032 $ 2,505, % 10.93% 0.21% 32. Bus Transportation 106,667, ,996, ,821, ,513, ,012, % 6.49% 10.26% 33. Field Operations 14,708,879 16,205,583 17,368,203 17,843,897 19,332, % 8.34% 1.61% 34. Service Delivery 1,503,580 1,605,472 1,565,305 1,620,025 1,577, % -2.61% 0.13% 35. Accessible Transportation Programs-LIFT 33,861,160 35,271,578 35,786,525 35,986,612 36,982, % 2.77% 3.08% 36. Accessible Transportation Programs-MTP 12,194, % 0.00% 0.00% 37. Rail Transportation 17,785,030 21,201,031 22,005,567 21,229,278 21,750, % 2.46% 1.81% 38. Commuter Rail 6,438,285 6,976,749 5,554,024 6,000,032 5,917, % -1.38% 0.49% 39. Streetcar 9,766,461 14,237,880 14,517,415 14,736,032 14,665, % -0.48% 1.22% 40. Bus Maintenance 50,277,358 48,146,066 56,262,750 55,596,222 58,072, % 4.45% 4.84% 41. Facilities Management 15,589,112 17,236,704 16,855,510 17,372,090 19,008, % 9.42% 1.58% 42. Rail Maintenance of Way 15,116,638 16,056,884 16,234,157 16,335,746 16,786, % 2.76% 1.40% 43. Rail Equipment Maintenance 23,957,667 29,906,443 30,495,696 33,716,472 34,862, % 3.40% 2.91% 44. Total Operations Division $ 308,981,325 $ 323,798,045 $ 336,772,896 $ 338,209,384 $ 354,473, % 4.81% 29.54% Capital Projects Division 45. Administration $ 401,348 $ 470,297 $ 907,647 $ 548,167 $ 767, % 39.96% 0.06% 46. Development & Operations Support 2,978,216 2,872,211 2,629,435 3,877,714 3,582, % -7.62% 0.30% 47. Capital Program 383, % 0.00% 0.00% 48. In-Street Transit Facilities Development 595, , % 0.00% 0.00% 49. Total Capital Projects Division $ 3,974,799 $ 4,377,024 $ 3,537,082 $ 4,425,881 $ 4,349, % -1.72% 0.36% 50. OPEB & Pension UAAL $ 47,828,738 $ 50,095,658 $ 49,637,303 $ 49,223,754 $ 48,385, % -1.70% 4.03% 51. Regional Fund Exchanges 3,021,148 3,063,139 3,063,139 5,500, % 79.55% 0.46% 52. Debt Service 21,242,456 35,575, ,482, ,286, ,587, % -1.90% 11.64% 53. Total Operating Requirements $ 437,119,576 $ 473,547,016 $ 732,679,046 $ 606,645,274 $ 634,665, % 4.62% 52.87% Requirements-3
38 GENERAL FUND REQUIREMENT SUMMARY Line Actual Actual Budget Estimate Budget % Change % Change % of Total No. Division/Department 14/15 15/16 16/17 16/17 17/18 Budget Estimated Requirements CIP Capital & Operating Projects: 54. Public Affairs Division $ 572,840 $ 2,446,312 $ 8,127,404 $ 2,505,067 $ 2,233, % % 0.19% 55. Safety & Security Division 2,140,636 2,592,344 8,797,560 3,547,826 20,902, % % 1.74% 56. Information Technology Division 4,406,141 7,629,762 13,978,046 4,216,503 12,493, % % 1.04% 57. Finance & Administration Division 6,263,553 16,963,036 19,927,172 2,752,752 15,456, % % 1.29% 58. Legal Services Division 5,000 41, , , , % % 0.04% 59. Operations Division 49,887,817 55,061,484 63,989,560 47,979,891 78,348, % 63.29% 6.53% 60. Capital Projects Division 9,824,577 15,417,277 41,952,574 29,490,311 73,226, % % 6.11% 61. Total CIP $ 73,100,564 $ 100,152,054 $ 157,072,316 $ 90,622,943 $ 203,085, % % 16.94% 62. Light Rail Program $ 181,631,270 $ 44,920, % 0.00% 0.00% 63. Pass Through Requirements 5,275,775 6,131,234 $ 6,465,101 $ 6,224,101 $ 6,595, % 5.97% 0.55% 64. Contingency 21,722,871 23,880, % % 1.99% Ending Fund Balance as of June 30* 65. Restricted Bond Proceeds & Other Restricted 73,265, ,947,094 3,095, ,839, ,786, % % 14.49% 66. Restricted Debt Service 22,386,368 33,287,682 24,434,260 39,587,854 24,969, % % 2.08% 67. Unrestricted 143,661, ,051, ,898, ,948, ,413, % % 11.04% 68. Total Ending Fund Balance $ 239,313,475 $ 365,286,169 $ 130,428,580 $ 435,376,715 $ 331,169, % % 27.65% 69. Total Requirements $ 936,440,657 $ 990,037,122 $ 1,048,367,914 $ 1,138,869,033 $ 1,199,397, % 5.31% % * Budgetary Fund Balance. Restricted funds include funds held in Trust to pay debt service, plus bond proceeds and other resources designated for specific projects. Unrestricted funds are resources maintained to cover cash flow until tax and grant revenues are collected. Requirements-4
39 GENERAL FUND REQUIREMENTS BY OBJECT CLASS (Summary of Detail Estimate Sheets) Line Actual Actual Budget Estimate Budget % Change % of Total No. 14/15 15/16 16/17 16/17 17/18 FY17-FY18 Requirements Personnel Services 1. Office of the General Manager $ 981,854 $ 1,162,325 $ 1,298,701 $ 1,239,521 $ 1,233, % 0.10% 2. Public Affairs 6,342,098 6,494,223 7,478,199 7,213,119 8,078, % 0.67% 3. Safety & Security 1,434,265 1,518,566 6,169,799 6,179,436 7,232, % 0.60% 4. Information Technology 5,344,664 5,918,751 6,612,961 6,389,451 7,078, % 0.59% 5. Finance & Administration 7,585,746 9,500,604 10,193,170 10,183,198 10,987, % 0.92% 6. Labor Relations & Human Resources 2,145,562 2,432,909 2,587,449 2,714,772 2,871, % 0.24% 7. Legal Services 1,566,424 1,673,648 1,829,005 1,698,425 1,966, % 0.16% 8. Operations 207,740, ,535, ,609, ,371, ,867, % 20.85% 9. Capital Projects 2,229,377 2,203,628 1,249,470 2,383,294 2,036, % 0.17% 10. OPEB & Pension UAAL 47,496,498 49,897,457 49,229,263 48,974,365 48,035, % 4.00% 11. Total Personnel Services $ 282,867,084 $ 311,337,588 $ 326,257,390 $ 325,347,462 $ 339,387, % 28.30% Materials & Services 12. Office of the General Manager $ 488,531 $ 412,073 $ 595,616 $ 568,636 $ 601, % 0.05% 13. Public Affairs 6,147,413 6,110,274 7,572,689 6,651,456 7,854, % 0.65% 14. Safety & Security 12,554,298 13,774,957 15,782,783 14,867,994 18,082, % 1.51% 15. Information Technology 2,289,427 2,330,941 4,444,578 3,805,001 5,196, % 0.43% 16. Finance & Administration 6,921,043 4,234,648 7,846,291 6,388,892 9,266, % 0.77% 17. Labor Relations & Human Resources 1,054, ,522 1,505,716 1,340,244 1,649, % 0.14% 18. Legal Services 236, , , , , % 0.02% 19. Operations 101,240,729 93,262,568 97,163,523 99,837, ,606, % 8.73% 20. Capital Projects 1,745,421 2,173,396 2,287,612 2,042,587 2,313, % 0.19% 21. OPEB & Pension UAAL 332, , , , , % 0.03% 22. Total Materials & Services $ 133,010,036 $ 123,612,598 $ 137,876,014 $ 135,948,462 $ 150,190, % 12.52% 23. CIP $ 73,100,564 $ 100,152,054 $ 157,072,316 $ 90,622,943 $ 203,085, % 16.93% 24. Light Rail Program 181,631,270 44,920, % 0.00% 25. Pass Through Requirements 5,275,775 6,131,234 6,465,101 6,224,101 6,595, % 0.55% 26. Regional Fund Exchanges 3,021,148 3,063,139 3,063,139 5,500, % 0.46% 27. Debt Service 21,242,456 35,575, ,482, ,286, ,587, % 11.64% 28. Contingency 21,722,871 23,880, % 1.99% Ending Fund Balance as of June 30* 29. Restricted Bond Proceeds & Other Restricted 73,265, ,947,094 3,095, ,839, ,786, % 14.49% 30. Restricted Debt Service 22,386,368 33,287,682 24,434,260 39,587,854 24,969, % 2.08% 31. Unrestricted Funds 143,661, ,051, ,898, ,948, ,413, % 11.04% 32. Total Ending Fund Balance $ 239,313,475 $ 365,286,169 $ 130,428,580 $ 435,376,715 $ 331,169, % 27.61% 33. Total Requirements $ 936,440,657 $ 990,037,122 $ 1,048,367,914 $ 1,138,869,033 $ 1,199,397, % % * Budgetary Fund Balance. Restricted funds include funds withdrawn by the Trustee to pay debt service, plus bond proceeds and other resources designated for specific projects. Unrestricted funds are resources maintained to cover cash flow until tax and grant revenues are collected. Requirements-5
40 GENERAL FUND PERSONNEL SERVICES SCHEDULE Earnings Budget Budget % Change Expense Category Explanation 16/17 17/18 FY17-FY18 Salaries & Wages Base compensation for all non-temporary positions, including training pay, student training cost, and union $ 177,678,444 $ 186,743, % employee wage premiums based on years of service. Sick & Vacation/Holiday Payout $134,938 for union sick payout; $352,484 for union vacation/holiday payout; $369,975 for non-union vacation payout. 884, , % Other Wage Categories Road relief, night & shift differential, incentive pay, tool allowance, time slip differential, extra service pay, 2,190,079 2,948, % premium pay and split shift travel time pay for union employees. Scheduled Overtime Overtime that has been built into union operator shifts. 9,552,735 10,092, % Unscheduled Overtime All other overtime except scheduled overtime. 7,309,892 7,517, % Limited Term Employment Salaries of employees hired for 6 or more months, work 20 or more hours per week, and have a predetermined end date. 389,518 2,053, % Unemployment Expense TriMet reimburses the State of Oregon for actual claims paid. 113, , % Unpaid Absence All excused and unexcused time loss for which employees are not paid. (3,016,884) (3,068,694) 1.72% Fringe Benefits Health & Welfare Benefits $17,811 per full-time and part-time union employee; $15,403 per full-time non-union employee; 52,185,812 52,208, % $10,116 per part-time non-union employee. Disability & Life Insurance $356 per full-time union employee; $244 per part-time union employee; $708 per non-union employee. 1,199,866 1,215, % Social Security - Medicare 7.65% of first $127,200 of salaries and wages; 1.45% thereafter. 14,799,108 15,698, % TriMet Payroll Tax.7487% of gross income. 1,286,633 1,379, % Pension Expense-Normal Cost* $6,584 per union full-time employee; $4,938 per union part-time employee; 9.46% of gross income per non-union 16,692,839 17,753, % (cost of benefits earned this year) employee in Defined Benefit Plan; 8.0% of base pay per union and non-union employee in Defined Contribution Plans. Capitalized Labor and Fringe Capitalized labor and fringe reimbursement. (9,437,765) (9,834,688) 4.21% Workers' Compensation Medical and time loss payments to employees injured in work related accidents. Time loss is paid at 66.7% of 5,200,000 5,675, % average weekly wage not to exceed $1, per week. Total Personnel Services** $ 277,028,127 $ 291,352, % * Union defined benefit pension assumes 7% return on investments decreasing to a 6.5% long-term rate over 15 years; non-union defined benefit assumes 6.5% long-term return on investments. ** Total does not include OPEB & Pension UAAL costs. See OPEB & Pension UAAL department for DB pension plan assumptions. Requirements-6
41 GENERAL FUND MATERIALS & SERVICES SCHEDULE Budget Budget Percent Expense Category 16/17 17/18 Change Explanation Communications System Maintenance $ 540,000 $ 530, % Computer Maintenance Materials & Services 3,560,413 3,808, % Contracted Legal Services 583, , % Contracted Transportation Services 35,772,313 37,435, % LIFT inflation and ridership increases. Customer Information Materials 242, , % Dues (including APTA & OTA) & Subscriptions 325, , % Reflects increased staffing, Education & Training 306, , % Reflects increased staffing. Employee Attendance & Incentive Programs 444, , % Change in program structure. Facilities Maintenance - Materials & Services 5,617,549 7,462, % Health Benefit Administration 324, , % Insurance Premiums and Self-Insurance Funding 4,676,077 3,845, % Budget decreased to reflect actual expense. Interagency Transfers 7,554,245 7,720, % Lease Expenses 1,544,468 1,407, % Light Rail Propulsion Power 5,156,000 5,328, % Marketing & Advertising 906,000 1,610, % Additional marketing campaigns. Metro Unified Work Program 238, , % Money Collection & Transport 174, , % Office Administrative Materials & Services 2,067,581 2,343, % OPEB Service Contracts for Retirement Plans 408, , % Other Materials & Services 3,166,384 3,535, % Personal Injury & Property Damage Self-Insurance 2,430,620 2,145, % Budget decreased to reflect actual expense. Professional & Technical Services 5,402,918 8,586, % IT consulting and contracted services; fare enforcement. Revenue Vehicle - Maintenance Materials & Services 20,839,128 23,900, % Revenue Vehicles - Diesel Fuel 13,195,000 12,438, % $1.95/gallon for bus; $2.00/gallon for ATP and WES. Revenue Vehicles - Oil & Lubricants 583, , % Security Related Materials & Services 14,458,153 15,778, % Support Vehicles - Maintenance & Materials 790, , % Telephone Expense 581, , % Reflects increased staffing and wireless communications. Tickets, Passes, Transfers, Schedules & Guides 610, , % Uniforms and Laundry 1,869,526 2,114, % Reflects increase in staffing for service increase. Utilities (Natural Gas, Electricity, Water/Sewer) 3,154,827 4,030, % Budget increased to reflect actual expense. Waste Disposal Fees 350, , % Total Materials & Services $ 137,876,014 $ 150,190, % Requirements-7
42 SUMMARY OF GENERAL FUND EMPLOYEES Actual Actual Budget Budget Change 6/30/15 6/30/16 16/17 17/18 FY17-FY18 Office of the General Manager Division Non-Union Employees Full-Time Employees Part-Time Employees Total Office of the General Manager Division Public Affairs Division Non-Union Employees Full-Time Employees Limited Term Employees Grant Funded Employees Part-Time Employees Union Employees Full-Time Employees Total Public Affairs Division Safety & Security Division Non-Union Employees Full-Time Employees Union Employees Full-Time Employees Total Safety & Security Division Information Technology Division Non-Union Employees Full-Time Employees Limited Term Employees Total Information Technology Division Finance & Administration Division Non-Union Employees Full-Time Employees Part-Time Employees Union Employees Full-Time Employees Total Finance & Administration Division Labor Relations & Human Resources Division Non-Union Employees Full-Time Employees Part-Time Employees Total Labor Relations & Human Resources Division Requirements-8
43 SUMMARY OF GENERAL FUND EMPLOYEES Actual Actual Budget Budget Change 6/30/15 6/30/16 16/17 17/18 FY17-FY18 Legal Services Division Non-Union Employees Full-Time Employees Total Legal Services Division Operations Division Non-Union Employees Full-Time Employees Limited Term Employees Union Employees Full-Time Employees 1, , , , Part-Time Employees Total Operations Division 2, , , , Capital Projects Division Non-Union Employees Full-Time Employees Limited Term Employees Grant Funded Employees Part-Time Employees Total Capital Projects Division General Fund Operating Program Non-Union Employees Full-Time Employees Limited Term Employees Grant Funded Employees Part-Time Employees Total Union Employees Full-Time Employees 1, , , , Part-Time Employees Total 2, , , , Total General Fund Operating Program Employees (1) 2, , , , (1) Actual number of employees, at any given, time, may vary significantly from these totals due to the nature of some operations. Requirements-9
44 SUMMARY OF GENERAL FUND EMPLOYEES Light Rail Program Non-Union Employees Full-Time Employees Limited Term Project Employees Part-Time Employees Total Union Employees (Start Up) Full-Time Employees Total Total Light Rail Program Employees Actual Actual Budget Budget Change 6/30/15 6/30/16 16/17 17/18 FY17-FY18 Requirements-10
45 SUMMARY OF FIXED ROUTE SERVICE (Hours and Miles) Actual Actual Budget Estimate Budget % Change % Change % of Weekly Vehicle Hours June '15 June '16 June '17 June '17 June '18 Budget Estimate Total Fixed Route Bus Service 38,096 38,458 39,749 39,907 41, % 3.01% 84.34% Light Rail (Train Hours) 5,552 5,988 6,156 6,093 6, % 0.00% 12.50% Commuter Rail (Train Hours) % 0.00% 0.25% Portland Streetcar (Train Hours)* 1,146 1,419 1,419 1,419 1, % 0.00% 2.91% Fixed Route Total 44,916 45,987 47,446 47,541 48, % 2.53% % Actual Actual Budget Estimate Budget % Change % Change % of Weekly Vehicle Miles June '15 June '16 June '17 June '17 June '18 Budget Estimate Total Fixed Route Bus Service 468, , , , , % 3.88% 72.05% Light Rail (Car Miles) 163, , , , , % 0.00% 24.97% Commuter Rail (Train Miles) 2,307 2,307 2,307 2,307 2, % 0.00% 0.33% Portland Streetcar (Car Miles)* 15,262 18,687 18,687 18,687 18, % 0.00% 2.65% Fixed Route Total 649, , , , , % 2.77% % *Streetcar vehicles are owned by the City of Portland, which manages Portland Streetcar service. TriMet furnishes vehicle operators and mechanics to Portland Streetcar, with costs reimbursed to TriMet by the City of Portland. In addition, TriMet funds approximately 60% of the City of Portland's net cost (after fares) of Streetcar operation. Requirements-11
46 SUMMARY OF FIXED ROUTE AND ACCESSIBLE TRANSPORTATION VEHICLES Actual Actual Budget Estimate Budget % Change % Change Fixed Route Services June '15 June '16 June '17 June '17 June '18 Budget Estimate Bus Service Peak Vehicles % 3.64% Total Vehicles % 3.64% Light Rail Peak Vehicles % 0.00% Total Vehicles % 0.00% Commuter Rail Peak Vehicles % 0.00% Total Vehicles % 0.00% Portland Streetcar*. Peak Vehicles % 0.00% Total Vehicles % 0.00% Actual Actual Budget Estimate Budget % Change % Change Accessible Transportation June '15 June '16 June '17 June '17 June '18 Budget Estimate Peak Vehicles % 1.82% Total Vehicles % 1.87% *Streetcar vehicles are owned by the City of Portland, which manages Portland Streetcar service. TriMet furnishes vehicle operators and mechanics to Portland Streetcar, with costs reimbursed to TriMet by the City of Portland. In addition, TriMet funds approximately 60% of the City of Portland's net cost (after fares) of Streetcar operation. Requirements-12
47 SUMMARY OF GENERAL FUND DEBT SERVICE Line Operating Actual Actual Budget Estimate Budget Revenue Offset 4) % Change No. 14/15 15/16 16/17 16/17 17/18 17/18 Budget Refunding Bonds $ 4,826,454 $ 4,208, % Capital Grant Receipt Bonds 10,203,948 10,316,005 $ 1,379,484 $ 2,731, % Revenue Bonds 2,948,583 1,913,418 1,557,875 1,583, % Senior Lien Revenue Bonds Series A and B 3,376,108 2,658,473 2,423,843 2,423,841 $ 2,434, % Capital Grant Receipt Bonds 1) 5,639,543 5,652,183 14,668,759 14,668,759 14,617,990 $ 16,000, % Senior Lien Revenue Bonds 5,405,520 4,995,722 5,442,134 2,638,706 2,635, % Interim Bonds 2) 5,739,550 5,739, ,030, ,109, ,367, % Revenue Bonds 3,266,259 9,939,695 9,939,694 10,507, % Revenue Bonds 311,549 2,244,170 2,595, % Revenue Bonds 1,556,673 3,309, % 11. Bond Issuance Costs/Misc. 808, , % 12. Capitalized Leases 90,153 35,968 40,000 40, , % 13. Capital Interest 3) (16,987,403) (4,329,997) 0.00% 14. Total General Fund Debt Service $ 21,242,456 $ 35,575,682 $ 265,482,503 $ 142,286,211 $ 139,587,854 $ 16,000, % 1) Includes capitalized interest payment. Bond proceeds to pay capitalized interest are in Beginning Fund Balance. 2) 2013 Portland-Milwaukie Light Rail Project interim financing issuance costs. 3) Capital Interest is a required accounting estimate. It was offset in 14/15 by a like expense amount in the Light Rail Program and in 15/16 in the CIP. 4) Amount of debt service that is offset by MTIP IGA revenues or payroll tax rate increase revenues represents 18 months of grant resources. Debt Service-1
48 SUMMARY OF GENERAL FUND DEBT SERVICE PRINCIPAL AND INTEREST Principal Interest Total 2009 Senior Lien Bonds $ 1,600,000 $ 834,226 $ 2,434, Capital Grant Receipt Bonds 9,450,000 5,167,990 14,617, Senior Lien Bonds 2,380, ,664 2,635, Interim Bonds 100,000,000 3,367, ,367, Revenue Bonds 7,255,000 3,252,399 10,507, Revenue Bonds 355,000 2,240,429 2,595, Revenue Bonds 3,309,696 3,309,696 Capitalized Leases 100,000 20, ,000 FY17-18 Total General Fund Debt Service $ 121,140,000 $ 18,447,854 $ 139,587,854 Debt Service-2
49 TRIMET CONTINUING REVENUES AND CALCULATION OF PAYROLL TAX DEBT SERVICE RATIO Line Actual Actual Budget Estimate Budget No. Revenue Category 14/15 15/16 16/17 16/17 17/18 Operating Revenue 1. Passenger $ 116,734,062 $ 118,069,153 $ 120,700,000 $ 117,193,502 $ 120,150, Advertising 3,290,000 3,392,500 3,525,000 3,500,000 3,678, Accessible Transportation Contract (see note 1) 6,384,143 7,187,860 6,400,000 7,439,000 7,588, Service Contracts (see note 2) 17,662,695 8,011,333 8,219,614 8,207,598 8,405, Total Operating Revenue $ 144,070,900 $ 136,660,846 $ 138,844,614 $ 136,340,100 $ 139,822,313 Tax Revenue 6. Employer Payroll $ 273,308,312 $ 305,666,908 $ 318,701,301 $ 318,701,301 $ 345,813, Self-Employed 14,783,448 16,357,820 16,249,828 17,291,676 18,770, State "In Lieu" 3,202,411 1,974,632 1,795,408 1,777,288 1,507, Total Tax Revenue $ 291,294,171 $ 323,999,360 $ 336,746,537 $ 337,770,265 $ 366,091,544 Other Revenue 10. Federal Operating Grants (see note 3) $ 25,933,560 $ 49,645,623 $ 60,114,881 $ 59,134,898 $ 63,870, State Operating Grants (see note 4) 1,481,432 1,328,536 1,354,292 1,200,500 1,249, Interest 463, , , , , Miscellaneous 9,176,923 4,810,928 4,454,391 4,137,118 4,125, Total Other Revenue $ 37,055,522 $ 56,587,880 $ 66,498,564 $ 65,047,516 $ 69,822, Net Continuing Resources* $ 472,420,593 $ 517,248,086 $ 542,089,715 $ 539,157,881 $ 575,736, Debt Service on Senior Lien Bonds $ 22,386,368 $ 23,937,491 $ 24,434,260 $ 24,886,307 $ 24,969, Senior Lien Debt Service as a Percent of Net Continuing Revenues 4.7% 4.6% 4.5% 4.6% 4.3% * Net Continuing Revenues exclude : - Surface Transportation Program/Congestion, Mitigation & Air Quality grant funds pledged to TriMet by Metro to support grant receipt bonds - Other state and federal grant revenues legally required to be used for an intended purpose (New Freedom, Jobs Access, Homeland Security, RTO and Fund Exchanges) Notes: 1. Revenue offsets rides already provided by LIFT. 2. Streetcar personnel revenue and CTRAN revenues. 3. Federal Section 5307 Urbanized Area Formula Funds and Federal Section 5337 State of Good Repair Funds. 4. Contracted Accessibility Services - State 5310, State 5310 Formula Funds, STF Formula Funds. Debt Service-3
50 [This Page Left Intentionally Blank] Debt Service-4
51 OPEB & PENSION UAAL Actual Actual Budget Estimate Budget % Change Explanation 14/15 15/16 16/17 16/17 17/18 FY17-FY18 Union (note 1) Retiree/Disabled Medical Retiree Medical Post Employment Medical Benefit $ 7,424,910 $ 6,628,577 $ 7,204,397 $ 6,295,076 $ 6,201, % Retiree Medicare Post Employment Medicare Benefit 6,956,708 6,175,095 6,750,100 5,898,119 6,763, % Retiree Dental Post Employment Dental Benefit 1,380,678 1,193,724 1,339,673 1,133,665 1,299, % Disability Medical Post Employment Disability Medical Benefit 915,336 1,436, ,151 1,363, , % Disability Dental Post Employment Disability Dental Benefit 107, , , , , % Medicare Part B Post Employment Medicare Part B Benefit (note 4) 1,592,072 1,778,265 1,688,317 1,917,885 1,777, % Retiree Life Insurance Retiree Life Insurance Premiums 407, , , , , % Pension UAAL Expense (note 2)Current year portion of 15 year funding of Unfunded Accrued Actuarial Liability 25,004,626 26,499,537 25,000,000 25,742,070 25,000, % Total Union $ 43,789,388 $ 44,262,193 $ 43,396,819 $ 42,903,440 $ 42,331,880 Non-Union Retiree Medical Post Employment Medical Benefit $ 349,254 $ 544,601 $ 680,324 $ 594,369 $ 645, % Retiree Medicare Post Employment Medicare Benefit 425, , , , , % Retiree Dental Post Employment Dental Benefit 102, , , , , % Disability Medical Post Employment Disability Medical Benefit 17,393 51,776 33,881 56,508 43, % Disability Dental Post Employment Disability Dental Benefit 2,012 5,609 3,919 6,122 5, % Retiree Life Insurance Retiree Life Insurance Premiums 43,062 44,307 50,634 52,021 50, % Pension UAAL Expense (note 3)Current year portion of 10 year funding of Unfunded Accrued Actuarial Liability 5,500,000 5,747,771 5,500,000 5,548,694 5,500, % Total Non-Union $ 6,440,143 $ 7,272,336 $ 7,298,092 $ 7,254,987 $ 7,379,513 Professional & Technical Service contracts for retirement plans 332, , , , , % Capitalized Fringe Capital grant fringe reimbursement (2,733,033) (1,637,072) (1,465,648) (1,184,062) (1,676,017) 14.35% Total OPEB & Pension UAAL $ 47,828,738 $ 50,095,658 $ 49,637,303 $ 49,223,754 $ 48,385, % Pension Expense-Normal Cost (cost of benefits earned this year) is incorporated in departmental costs. Notes: 1. Union retiree/disabled medical assumes current Working & Wage Agreement costs through November 30, 2016 then a 6% inflation increase thereafter. 2. Pension assumptions: union defined benefit pension unfunded liability funded over 15 years beginning with FY2014; assumes 7% return on investments decreasing to 6.5% over 15 years. 3. Pension assumptions: non-union defined benefit pension unfunded liability funded over 10 years beginning with FY2014; assumes 6.5% return on investments. 4. Union non-active employees, retirees, spouses, surviving spouses and dependents having enrolled in Medicare and a TriMet sponsored Medicare Advantage plan will be reimbursed by the District the actual cost of the Medicare Part B monthly premium. OPEB-1
52 [This Page Left Intentionally Blank] OPEB-2
53 Division Summary OFFICE OF THE GENERAL MANAGER Actual Budget Estimate Budget % Change % of 14/15 15/16 16/17 16/17 17/18 FY17 - FY18 Division Total Personnel Services $ 981,854 $ 1,162,325 $ 1,298,701 $ 1,239,521 $ 1,233, % 67.21% Materials & Services 488, , , , , % 32.79% Total $ 1,470,385 $ 1,574,398 $ 1,894,317 $ 1,808,157 $ 1,834, % % Page Office of the General Manager Division Division Summary GM-1 Office of the General Manager GM-2 Diversity and Transit Equity GM-5 Internal Audit GM-8 GM-1
54 Department Summary OFFICE OF THE GENERAL MANAGER Actual Budget Estimate Budget % Change % of 14/15 15/16 16/17 16/17 17/18 FY17 - FY18 Dept. Total Personnel Services $ 646,847 $ 704,838 $ 683,917 $ 621,835 $ 543, % 56.93% Materials & Services 317, , , , , % 43.07% Total $ 964,143 $ 1,026,764 $ 1,080,618 $ 1,010,072 $ 954, % % Responsibility: TriMet is governed by a seven-member Board of Directors. The Board sets agency policy, enacts legislation and reviews certain contracts. Performance Measures: The Office of the General Manager s performance is measured in th successful execution of the agency s strategic goals. The Office of the General Manager is under the direct authority of the Board of Directors. The General Manager is appointed by the Board and is charged with managing the agency. Activities: Keep the Board fully informed on TriMet s major activities. Set and lead strategic direction. Build and establish external and internal partnerships. GM-2
55 BUD1 Personnel Services OFFICE OF THE GENERAL MANAGER 14/15 15/16 16/17 16/17 17/18 Actual Actual Budget Est Budget Position Title Total Total Base Pos Total Total Base Pos Total General Manager $ 241,970 $ 270,721 $ 229, $ 229,000 $ 236,000 $ 236, $ 236,000 Director, Business Initiatives 110, , , ,158 28,467 Sr Executive Assistant, GM & Board 79,462 82,456 79, ,499 80,978 81, ,274 Executive Administrative Assistant 55,644 60,920 58, ,926 62,347 63, ,461 Fringe Benefits 158, , , , ,675 Non-Union Baseline Adjustment 33,585 29,721 Sick & Vacation/Holiday Payout 3,489 47,784 2,296 Total $ 646,847 $ 704, $ 683,917 $ 621, $ 543,427 GM-3
56 BUD2 Materials & Services OFFICE OF THE GENERAL MANAGER Actual Actual Budget Estimate Budget % Change % of Expense Category 14/15 15/16 16/17 16/17 17/18 FY17-FY18 M & S Total Auditing $ 255,450 $ 241,701 $ 285,000 $ 285,000 $ 300, % 72.98% Other Services 368 1,797 5,837 3,000 4, % 1.01% Office Supplies 2,344 4,459 4,824 5,000 4, % 1.19% Other Materials 844 2,327 4,922 4,000 4, % 1.21% Telephone 709 1,240 2,117 1,000 2, % 0.52% Dues & Subscriptions 95 2, , % 0.65% Local Travel & Meetings 4,606 6,818 8,092 8,000 8, % 1.99% Education & Training 220 1,126 1,100 1, % 0.28% Out-of-Town Travel 22,472 29,805 25,716 26,000 25, % 6.32% Official Meeting Expenses 17,462 20,972 32,597 30,000 32, % 8.01% Board and GM Outreach 5,900 1,001 10,067 10,000 10, % 2.47% Employee Development 5,542 5,726 6,969 6,500 7, % 1.71% Employee Recognition 6,789 6,700 6, % 1.66% Awards & Banquets 1,284 6,080 1, % Total $ 317,296 $ 321,926 $ 396,701 $ 388,237 $ 411, % % GM-4
57 Department Summary OFFICE OF THE GENERAL MANAGER - DIVERSITY AND TRANSIT EQUITY Actual Budget Estimate Budget % Change % of 14/15 15/16 16/17 16/17 17/18 FY17 - FY18 Dept. Total Personnel Services $ 104,382 $ 204,831 $ 366,892 $ 361,378 $ 435, % 71.07% Materials & Services 162,494 83, , , , % 28.93% Total $ 266,876 $ 288,125 $ 552,618 $ 529,127 $ 612, % % Responsibility: The Diversity and Transit Equity Department is responsible for assisting all divisions in reaching the agency s goals related to diversity, outreach to minority communities, transit equity and Disadvantaged Business Enterprise (DBE) efforts. Activities: Disadvantaged Business Enterprise - Direct the development, implementation and monitoring of TriMet s Federal and state DBE and MWESB program and goals. - Work with the Procurement & Contracts Department to increase DBE and MWESB participation in TriMet s General Fund procurement processes. - Liaison to community, business and key-stakeholders on DBE, Transit Equity, Diversity, Equity and Inclusion issues. Title VI/Transit Equity - Coordinate TriMet s Title VI compliance, monitoring and reporting. - Provide Title VI and transit equity training and support to TriMet staff. - Provide opportunities for transit dependent persons to engage in decision-making through forums and informational public outreach sessions. - Coordinate and conduct pertinent equity analysis and forecasting. Diversity and Inclusion - Coordinate the agency s diversity, equity and strategic planning process. - Support development of diversity and cultural competency training. Activities - continued: - In tandem with the Labor Relations & Human Resources Division, support the recruiting and retention of a diverse workforce. Community Engagement - Increase TriMet s community presence to diverse stakeholders. - Support the agency in the development of strategies and the implementation of best practices in community relations to strengthen the agency s partnerships with low income, transit-dependent and communities of color and opportunities to engage in decision-making through forums and informational public outreach sessions. - Support the coordination and staffing of a Transit Equity Advisory Group. Performance Measures: Meet TriMet s 10.72% aspirational DBE goal of identified budget. Work with TriMet staff to coordinate, monitor and direct Title VI reporting in a timely manner. Position TriMet as an environmental justice leader. Develop and foster partnerships/relationships with diverse communities and leaders to gain support for agency programs and initiatives. Work closely with TriMet customers, constituents and staff to help ensure TriMet meets its commitment to Equal Employment Opportunity and workforce diversity. GM-5
58 BUD1 Personnel Services OFFICE OF THE GENERAL MANAGER - DIVERSITY AND TRANSIT EQUITY 14/15 15/16 16/17 16/17 17/18 Actual Actual Budget Est Budget Position Title Total Total Base Pos Total Total Base Pos Total Director, Diversity & Transit Equity $ 98,877 $ 88,543 $ 113, $ 113,000 $ 115,735 $ 116, $ 116,282 Policy Advisor 53,192 59,675 58, ,841 66,194 84, ,601 Diversity & Transit Equity Rep 65,253 67, ,369 68,956 69, ,673 Assistant, Administrative 44, ,336 45, ,564 Fringe Benefits 63,587 92, , , ,282 Sick & Vacation/Holiday Payout 3,053 8,293 3,062 Capitalized Labor/Fringe (111,274) (100,661) (93) Total $ 104,382 $ 204, $ 366,892 $ 361, $ 435,464 GM-6
59 BUD2 Materials & Services OFFICE OF THE GENERAL MANAGER - DIVERSITY AND TRANSIT EQUITY Actual Actual Budget Estimate Budget % Change % of Expense Category 14/15 15/16 16/17 16/17 17/18 FY17-FY18 M & S Total Summer Youth Internship $ 61,500 $ 31,500 $ 98,000 $ 66,000 $ 68, % 38.37% Other Services 69,556 10,094 38,474 38,474 55, % 31.06% Unreconciled Mastercard Expense % Other Materials % Community Outreach 12,178 27,193 30,573 30,573 30, % 16.93% Outreach/Promotions 7, % Telephone 2,056 1,867 2,020 2,020 1, % 1.02% Dues & Subscriptions % 0.33% Local Travel 325 1,003 2,000 2,000 2, % 1.13% Education & Training 1,727 2,570 5,065 5,065 4, % 2.71% Out-of-Town Travel 14,746 8,335 9,023 16,046 15, % 8.45% Total $ 162,494 $ 83,294 $ 185,726 $ 167,749 $ 177, % % GM-7
60 Department Summary OFFICE OF THE GENERAL MANAGER - INTERNAL AUDIT Actual Budget Estimate Budget % Change % of 14/15 15/16 16/17 16/17 17/18 FY17 - FY18 Dept. Total Personnel Services $ 230,625 $ 252,656 $ 247,892 $ 256,308 $ 254, % 95.02% Materials & Services 8,741 6,853 13,189 12,650 13, % 4.98% Total $ 239,366 $ 259,509 $ 261,081 $ 268,958 $ 267, % % Responsibility: The Internal Audit Department performs audits and provides advisory services to give the District reasonable assurance that its control objectives are met. The key control objectives are: Performance Measures: Complete the projects identified in the Internal Audit s Annual Plan. Realize the improvement goals specified in the Annual Plan. Activities: Safeguarding and proper maintenance of assets. Compliance with laws, regulations, contracts, plans, policies and procedures. Reliability and integrity of financial and operating information. Economical and efficient use of resources. GM-8
61 BUD1 Personnel Services OFFICE OF THE GENERAL MANAGER - INTERNAL AUDIT 14/15 15/16 16/17 16/17 17/18 Actual Actual Budget Est Budget Position Title Total Total Base Pos Total Total Base Pos Total Manager, Internal Audit $ 105,271 $ 115,838 $ 108, $ 108,945 $ 112,143 $ 113, $ 113,451 Internal Auditor, Senior 70,633 75,534 73, ,365 75,168 75, ,936 Fringe Benefits 65,698 62,289 63,838 63,838 63,278 Sick & Vacation/Holiday Payout 1,744 5,159 1,531 Capitalized Labor/Fringe (10,977) (1,005) Total $ 230,625 $ 252, $ 247,892 $ 256, $ 254,196 GM-9
62 BUD2 Materials & Services OFFICE OF THE GENERAL MANAGER - INTERNAL AUDIT Actual Actual Budget Estimate Budget % Change % of Expense Category 14/15 15/16 16/17 16/17 17/18 FY17-FY18 M & S Total Other Services $ 109 $ 130 $ 1,695 $ 500 $ 1, % 12.85% Telephone % 2.47% Dues & Subscriptions 625 1,025 1,087 1,500 1, % 8.24% Local Travel % 2.88% Education & Training 5,658 5,426 8,693 7,500 8, % 65.91% Out-of-Town Travel 2, ,008 2,500 1, % 7.65% Total $ 8,741 $ 6,853 $ 13,189 $ 12,650 $ 13, % % GM-10
63 BUDGET PROGRESSION SCHEDULE - OFFICE OF THE GENERAL MANAGER Actual Actual Adopted Proposed Approved Adopted 14/15 15/16 16/17 17/18 17/18 17/18 Office of the General Manager $ 646,847 $ 704,838 $ 683,917 Personnel Services $ 539,202 $ 539,202 $ 543, , , ,701 Materials & Services 411, , ,083 $ 964,143 $ 1,026,764 $ 1,080,618 Department Total $ 950,285 $ 950,285 $ 954,510 Diversity and Transit Equity $ 104,382 $ 204,831 $ 366,892 Personnel Services $ 422,573 $ 422,573 $ 435, ,494 83, ,726 Materials & Services 177, , ,233 $ 266,876 $ 288,125 $ 552,618 Department Total $ 599,806 $ 599,806 $ 612,697 Internal Audit $ 230,625 $ 252,656 $ 247,892 Personnel Services $ 254,267 $ 254,267 $ 254,196 8,741 6,853 13,189 Materials & Services 13,320 13,320 13,320 $ 239,366 $ 259,509 $ 261,081 Department Total $ 267,587 $ 267,587 $ 267,516 Division Total $ 981,854 $ 1,162,325 $ 1,298,701 Personnel Services $ 1,216,042 $ 1,216,042 $ 1,233, , , ,616 Materials & Services 601, , ,636 $ 1,470,385 $ 1,574,398 $ 1,894,317 Total Office of the General Manager $ 1,817,678 $ 1,817,678 $ 1,834,723 GM-11
64 [This Page Left Intentionally Blank] GM-12
65 Division Summary PUBLIC AFFAIRS Actual Budget Estimate Budget % Change % of 14/15 15/16 16/17 16/17 17/18 FY17- FY18 Division Total Personnel Services $ 6,342,098 $ 6,494,223 $ 7,478,199 $ 7,213,119 $ 8,078, % 50.70% Materials & Services 6,147,413 6,110,274 7,572,689 6,651,456 7,854, % 49.30% Total $ 12,489,511 $ 12,604,497 $ 15,050,888 $ 13,864,575 $ 15,932, % % Page Public Affairs Division Division Summary PA-1 Administration PA-2 Planning & Policy PA-5 GIS & Location Based Services PA-8 Community Affairs PA-11 Government Services & Community Affairs PA-14 Communications & Marketing PA-17 Customer Experience PA-20 *In FY2017/2018 the Community Affairs Department was merged with the Government Affairs Department to form the Government Services & Community Affairs Department. PA-1
66 Department Summary PUBLIC AFFAIRS - ADMINISTRATION Actual Budget Estimate Budget % Change % of 14/15 15/16 16/17 16/17 17/18 FY17- FY18 Dept. Total Personnel Services $ 271,427 $ 300,098 $ 514,092 $ 351,743 $ 533, % 68.64% Materials & Services 36,920 87, , , , % 31.36% Total $ 308,347 $ 387,323 $ 794,569 $ 642,774 $ 776, % % Responsibility: The Public Affairs Administration Division is composed of the following departments: Administration, Communication & Marketing, Customer Experience, GIS & Location Based Services, Government Services & Community Affairs and Planning & Policy. Activities: The division supports implementation of TriMet s 5-Year Action Plan. Builds ridership and promotes safety through marketing and awareness campaigns, promotions and customer service. Strengthens community awareness through community outreach. Effectively communicates agency goals to the TriMet Board of Directors, elected officials and the general public. Communicates on capital projects, service planning and marketing activities. Manages intergovernmental relations around long-range funding, policy development and implementation with local, regional, state and federal legislative and administrative officials. Provides responsive and cost-effective transit planning in key regional corridors, improved access to transit and develops TriMet s Transit Investment plan. Provides up-to-date customer information. Communication & Marketing Build and retain ridership. Marketing and promotion. Respond to all media and public requests for information. Customer Experience Provide excellent customer service, outreach and information. Research analysis on regional needs. Manage TriMet s fare policies to support revenue generation, access, ridership development and equity. GIS & Location Based Services Provide training & Technical support for the GIS users within TriMet. Provide technical solutions to software and analysis problems. Provide the most current up-to-date data for GIS analysis and development. Government Services & Community Affairs Communicate with local, regional, state and federal jurisdictions and partners. Identify and participate in decisions impacting transit operations and stability. Planning & Policy Lead development of the Transit Investment Plan. Produce the regional Service Enhancement Plan. Promote safe access to transit through investment in the bike and pedestrian network. Performance Measures: Performance ratings from the general public. Implementation of the 5-Year Transit Investment Plan (TIP). Implementation of regional transportation goals that support a sustainable transportation network. Increase ridership on Frequent Service, Bus and MAX light rail lines. Ensure agency activities and efforts focus on agency principles and goals. PA-2
67 BUD1 Personnel Services PUBLIC AFFAIRS - ADMINISTRATION 14/15 15/16 16/17 16/17 17/18 Actual Actual Budget Est Budget Position Title Total Total Base Pos Total Total Base Pos Total Executive Director, Public Affairs $ 165,000 $ 175,052 $ 169, $ 169,943 $ 174,922 $ 175, $ 175,918 Executive Administrative Assistant 51,480 57,326 56, ,494 47,539 60, ,356 Specialist, Administrative 41, ,621 43,455 45, ,032 Fringe Benefits 54,947 67,720 85,444 85,444 85,654 Non-Union Baseline Adjustment 162, ,780 Sick & Vacation/Holiday Payout 2,442 2,143 Limited Term Employment 6, ,426 Total $ 271,427 $ 300, $ 514,092 $ 351, $ 533,309 PA-3
68 BUD2 Materials & Services PUBLIC AFFAIRS - ADMINISTRATION Actual Actual Budget Estimate Budget % Change % of Expense Category 14/15 15/16 16/17 16/17 17/18 FY17-FY18 M & S Total Legal $ 8,106 $ 10,373 $ 40,000 $ 10, % 4.30% Professional & Technical 26, , , , % 55.32% Temporary Help $ 5,224 7,395 6,454 5,000 7, % 2.90% Other Services 6,556 2,487 18,131 19,350 18, % 7.52% Office Supplies 4,847 3,300 6, % 2.61% Other Materials 1,595 5,654 4,687 3,870 4, % 1.94% Telephone 217 6,926 9,210 9,972 7, % 2.87% Dues & Subscriptions 12,973 11,869 20,465 19,295 20, % 8.61% Local Travel & Meetings 3,063 2,738 7,908 4,000 7, % 3.28% Education & Training 395 1,305 9,229 9,229 9, % 3.83% Out-of-Town Travel 6,897 13,416 13,781 25,000 16, % 6.66% Employee Recognition % 0.16% Total $ 36,920 $ 87,225 $ 280,477 $ 291,031 $ 243, % % PA-4
69 Department Summary PUBLIC AFFAIRS - PLANNING & POLICY Actual Budget Estimate Budget % Change % of 14/15 15/16 16/17 16/17 17/18 FY17- FY18 Dept. Total Personnel Services $ 1,161,464 $ 1,019,207 $ 1,118,375 $ 1,117,356 $ 1,162, % 19.75% Materials & Services 3,865,630 3,532,678 5,086,712 4,334,718 4,723, % 80.25% Total $ 5,027,094 $ 4,551,885 $ 6,205,087 $ 5,452,074 $ 5,885, % % Responsibility: The Planning & Policy Department provides proactive, informative, responsive and effective service planning, policy development and review, planning and conceptual design of transit corridor regional planning/projects and access to transit especially by pedestrians and bicyclists consistent with the Regional Transportation Plan, TriMet s Budget priorities, and Transit Improvement Process including fostering and improve partnerships for transit growth. Activities: Continue to lead and strengthen relationships with employers, jurisdictions, neighborhoods and other stakeholders regarding our strategic visions for future transit service in the Service Enhancement Plans. Plan and coordinate the Coordinated Transportation Service Plan and Special Transportation Fund in the region for mobility of elderly & disabled riders. Administer the Community Job Connector program. Foster and improve partnerships with all jurisdictions in the region on transportation planning, funding and related activities investments. Prepare corridor plans, capital elements and partnerships for future enhanced bus transit and High Capacity Transit. Identify and advance opportunities to enhance access to transit via walking and bicycling, including through partnerships and/or securing grants. Develop and manage TriMet's bicycle storage policy and infrastructure. Foster potential major investment in transit by other jurisdictions. Partner and provide policy guidance for regional and jurisdictional planning efforts, including Regional Transportation Plan. Activities - continued: Support TriMet Business Plan and related budget and priority processes. Understand and influence federal policies that impact TriMet and the region. Enhance technical relations with the Federal Transit Administration. Advance planning and conceptual design of the Southwest Corridor Project. Advance planning conceptual design of further system improvements, including capacity and reliability improvements on rail and bus system. Manage policy and technical relations with Portland Streetcar partners. Performance Measures: Develop annual service plans within budget, on-time and achieve ridership objectives: Develop and share with public Transit Investment Priorities and service decision-making information. Increase improvements in access to transit with partners. Substantial progress on Southwest Corridor refinement and Division Transit Projects: Successfully manage Intergovernmental Agreements with City of Portland re: Portland Streetcar. PA-5
70 BUD1 Personnel Services PUBLIC AFFAIRS - PLANNING & POLICY 14/15 15/16 16/17 16/17 17/18 Actual Actual Budget Est Budget Position Title Total Total Base Pos Total Total Base Pos Total Director, Planning & Policy $ 136,646 $ 139,735 $ 133, $ 133,284 $ 137,494 $ 139, $ 139,097 Manager, Service Planning 84,737 92,633 94, ,617 91,950 97, ,768 Manager, Capital Planning 94,190 84,495 82, ,718 87,170 88, ,061 Senior Transit Corridor Designer 86,450 92,551 86, ,437 89,002 89, ,515 Planner III 130, ,703 71, , ,846 73, ,540 Planner III 189, ,183 65, , ,767 74, ,762 Planner II 56,920 62,804 61, ,183 41,252 70, ,719 Planner I 48,720 52,506 50, ,981 52,021 52, ,229 Coordinator, Strategic Planning 67,591 73,991 72, ,020 76,034 78, ,857 Fringe Benefits 322, , , , ,773 Capitalized Labor/Fringe (57,232) (174,967) (178,596) (167,463) (189,815) Sick & Vacation/Holiday Payout 10,467 5,277 9,185 Total $ 1,161,464 $ 1,019, $ 1,118,375 $ 1,117, $ 1,162,691 PA-6
71 BUD2 Materials & Services PUBLIC AFFAIRS - PLANNING & POLICY Actual Actual Budget Estimate Budget % Change % of Expense Category 14/15 15/16 16/17 16/17 17/18 FY17-FY18 M & S Total Professional & Technical $ 35,430 $ 180,369 $ 144,164 $ 75,000 $ 345, % 7.32% Metro: Unified Work Program 231, , , , , % 5.09% Program Services - Job Access 514, , , , % 0.00% Intergovernmental Transfers 2,975, % Temporary Help % Ride Connection - Fare Relief Program 60,600 60,600 61, % 1.30% Community Job Connector-North Hillsboro 304, , , % 8.47% Community Job Connector-Tualatin/Grove Link 600, % Community Job Connector-Swan Island 240, % Ride Connection Program (5310 Match) 1,353,036 1,161,291 1,235,715 1,272, % 26.95% Contracted Services (State 5310) 166, % East County U-Ride (State 5310) 121, , , % 2.65% Ride Connection Network (State 5310) 82,330 82, % 0.00% Tualatin Shuttle (State 5310) 57,500 57,500 59, % 1.25% Mobility Management (State 5310) 50,000 50, , % 2.36% Federal 5310 Program 1,088,788 2,000,000 1,200,000 1,200, % 25.40% Other Services 33,561 23,101 9,348 14,000 14, % 0.31% Office Supplies 11, % 0.00% Other Materials 17,627 6,107 25,009 15,000 20, % 0.43% Computer Equipment < $5,000 1,834 1, % 0.01% Telephone 3,645 2,742 8,122 4,000 4, % 0.08% Dues & Subscriptions 1,015 1,800 1,827 1,890 1, % 0.04% Local Travel & Meetings % Education & Training 6,253 2,184 2,617 1,405 2, % 0.06% Travel & Meetings 19,209 45,000 23, % 0.50% Out-of-Town Travel 32,699 28, % $ 3,865,630 $ 3,532,678 $ 5,086,712 $ 4,334,718 $ 4,723, % % PA-7
72 Department Summary PUBLIC AFFAIRS - GIS & LOCATION BASED SERVICES Actual Budget Estimate Budget % Change % of 14/15 15/16 16/17 16/17 17/18 FY17- FY18 Dept. Total Personnel Services $ 481,976 $ 528,951 $ 506,254 $ 536, % 95.98% Materials & Services 1,879 1,566 8,400 22, % 4.02% Total $ 483,855 $ 530,517 $ 514,654 $ 559, % % Responsibility: The GIS & Location Based Services Department is responsible for managing all aspects of Geographic Information Systems (GIS) and all related activities within the agency and with external partners. This includes the collection, management and maintenance of all spatial data, location-based services, mapping and spatial data analysis, evaluation of systems and user requirements, preparation of data for internal systems, preparation of detailed specifications from which applications will be written, coordination with the IT department and its stakeholders/provision of technical support, consulting services and training for users. Activities: Provide training & technical support for the GIS users within TriMet. Provide technical solutions to software and analysis problems. Provide the most current up-to-date data for GIS analysis and development. Coordinate with external agency on data maintenance and sharing agreements. Provide services for mapping, data and GIS software requests. Coordinate and assist in GIS application development and implementation. Coordinate GIS User Group functions and activities. Provide a platform for communication, cooperation and data sharing. Performance Measures: Ensure that the GIS users are trained and equipped to function in their working environment. Quickly trouble-shoot any GIS problems that may occur at the hardware, software or technical level and solutions for advanced spatial query capabilities. Develop a dependable environment to ensure that mapping and data requests are met in a professional manner, with respect to deadlines. Provide applications which can aid in the general work flow of GIS users. Automation and reliability increase as the use of GIS expands. Provide data sets both regionally and internally. This data must meet all system and user requirements. Manage vendor contracts, budget and software license fees that are fair and equitable. PA-8
73 BUD1 Personnel Services PUBLIC AFFAIRS - GIS & LOCATION BASED SERVICES 14/15 15/16 16/17 16/17 17/18 Actual Actual Budget Est Budget Position Title Total Total Base Pos Total Total Base Pos Total Manager, IT GIS & Location Based Services $ 120,004 $ 116, $ 116,137 $ 118,886 $ 119, $ 119,436 Analyst, Bus Stops Planner 73,342 70, ,435 71,333 71, ,513 Electronic Survey Developer & Analyst 54,128 70, ,000 71,433 71, ,719 Analyst II, GIS Data 64,915 61, ,231 37,103 64, ,000 Analyst, GIS Data 55,173 59, ,496 60,208 60, ,449 Fringe Benefits 128, , , ,780 Capitalized Labor/Fringe (14,486) Sick & Vacation/Holiday Payout 4,361 3,827 Total $ 481, $ 528,951 $ 506, $ 536,724 PA-9
74 BUD2 Materials & Services PUBLIC AFFAIRS - GIS & LOCATION BASED SERVICES Actual Actual Budget Estimate Budget % Change % of Expense Category 14/15 15/16 16/17 16/17 17/18 FY17-FY18 M & S Total Other Services $ 713 $ 741 $ 240 $ 9, % 42.92% Other Materials , % 1.46% Telephone ,160 12, % 55.62% Total $ 1,879 $ 1,566 $ 8,400 $ 22, % % PA-10
75 Department Summary PUBLIC AFFAIRS - COMMUNITY AFFAIRS Actual Budget Estimate Budget % Change % of 14/15 15/16 16/17 16/17 17/18 FY17- FY18 Dept. Total Personnel Services $ 78,780 $ 158,721 $ 162, % 0.00% Materials & Services 433 1,010 1, % 0.00% Total $ 79,213 $ 159,731 $ 163, % 0.00% PA-11
76 BUD1 Personnel Services PUBLIC AFFAIRS - COMMUNITY AFFAIRS 14/15 15/16 16/17 16/17 17/18 Actual Actual Budget Est Budget Position Title Total Total Base Pos Total Total Base Pos Total Director, Public Affairs $ 132,622 $ 121, $ 121,176 $ 126,231 Fringe Benefits 34,162 36,673 36,673 Capitalized Labor/Fringe (88,004) Sick & Vacation/Holiday Payout 872 Total $ 78, $ 158,721 $ 162,904 PA-12
77 BUD2 Materials & Services PUBLIC AFFAIRS - COMMUNITY AFFAIRS Actual Actual Budget Estimate Budget % Change % of Expense Category 14/15 15/16 16/17 16/17 17/18 FY17-FY18 M & S Total Other Services $ 360 $ % 0.00% Other Materials $ % 0.00% Telephone % 0.00% Total $ 433 $ 1,010 $ 1, % 0.00% PA-13
78 Department Summary PUBLIC AFFAIRS - GOVERNMENT SERVICES & COMMUNITY AFFAIRS Actual Budget Estimate Budget % Change % of 14/15 15/16 16/17 16/17 17/18 FY17- FY18 Dept. Total Personnel Services $ 110,138 $ 112,928 $ 114,580 $ 116,394 $ 283, % 43.98% Materials & Services 388, , , , , % 56.02% Total $ 498,761 $ 394,646 $ 456,584 $ 390,235 $ 645, % % Responsibility: The Government Services and Community Affairs Department is responsible for managing on-going intergovernmental relations and for longrange funding, policy development and implementation with local, regional, state and federal legislative and administrative officials. Responsibility: Activities: Develop, manage and coordinate governmental relations programs. Establish effective communication with local, regional, state and federal jurisdictions and partners. Develop, manage and coordinate long-range funding and policy initiatives in support of TriMet s 5-Year Action Plan. Performance Measures: Ensure federal, state, regional and local understanding of TriMet policy and funding requirements; improve and expand revenue funding. Maintain a high level of support with administrative and legislative officials at all levels. Establish a viable political framework for implementation of TriMet funding goals. Provide the mechanisms and programs necessary to obtain financial, legislative and political support that will enable TriMet to fund and implement its capital and operating programs. PA-14
79 BUD1 Personnel Services PUBLIC AFFAIRS - GOVERNMENT SERVICES & COMMUNITY AFFAIRS 14/15 15/16 16/17 16/17 17/18 Actual Actual Budget Est Budget Position Title Total Total Base Pos Total Total Base Pos Total Director, Public Affairs $ 127, $ 127,943 Manager, Governmental Affairs $ 78,726 $ 83,996 $ 83, $ 83,107 $ 85,793 86, ,890 Fringe Benefits 31,412 28,932 30,601 30,601 67,406 Sick & Vacation/Holiday Payout 872 1,531 Total $ 110,138 $ 112, $ 114,580 $ 116, $ 283,770 PA-15
80 BUD2 Materials & Services PUBLIC AFFAIRS - GOVERNMENT SERVICES & COMMUNITY AFFAIRS Actual Actual Budget Estimate Budget % Change % of Expense Category 14/15 15/16 16/17 16/17 17/18 FY17-FY18 M & S Total Professional & Technical $ 316,613 $ 214,760 $ 268,075 $ 200,000 $ 285, % 79.06% Other Services 6,374 5,946 6,000 6,125 6, % 1.78% Other Materials 1, % 0.18% Telephone , % 0.33% Dues & Subscriptions 2, ,500 1,200 2, % 0.70% APTA & OTA Dues 55,739 55,700 56,700 60,000 57, % 15.84% Local Travel & Meetings 1,320 1,005 1,500 1,800 1, % 0.42% Education & Training % 0.15% Out-of-Town Travel 2,816 2,653 5,500 3,435 5, % 1.54% Total $ 388,623 $ 281,718 $ 342,004 $ 273,841 $ 361, % % PA-16
81 Department Summary PUBLIC AFFAIRS - COMMUNICATIONS & MARKETING Actual Budget Estimate Budget % Change % of 14/15 15/16 16/17 16/17 17/18 FY17- FY18 Dept. Total Personnel Services $ 1,001,786 $ 2,393,354 $ 2,598,004 $ 2,645,776 $ 2,633, % 59.22% Materials & Services 114,882 1,515,909 1,119,750 1,040,859 1,813, % 40.78% Total $ 1,116,668 $ 3,909,263 $ 3,717,754 $ 3,686,635 $ 4,447, % % Responsibility: The Communications & Marketing Department develops and executes a comprehensive communication and marketing plan to ensure agency communications are consistent and effective as we bolster TriMet s reputation and brand (overall customer experience). We build public understanding of, and support for, TriMet s initiatives and our vision, mission and values. We help shape public perception and continue to support the 5-Year Plan. Activities: Media Relations Provide the media with factual agency materials and assist in fulfilling timely public record requests. Employee Communications Keep TriMet employees informed on agency news, goals & initiatives. Marketing & Outreach Promote and encourage safety around transit, transit use, service improvements, fare programs and key agency themes. Creative Services Develop/maintain/deliver high quality brand identity to promote TriMet s key principles via our communication channels. Marketing & Rider Communications Deliver information to riders via content channels; promote and enhance the customer experience through easy-to-use tools. Performance Measures: Media Relations Engage the media to promote TriMet s benefit to the region through positive employee and agency stories. Educate media partners about new agency initiatives. Employee Communications Further develop and promote all existing communications channels to TriMet s workforce. Gather feedback while developing and promoting new ways to engage employees. Marketing & Outreach Increase visibility of safety-related outreach and events. Promote agency initiatives, safety campaigns and educate the public on Hop Fastpass fare program. Increase Employer pass program participation. Creative Services Maintain favorability ratings through brand management and develop timely and accurate agency information for the public. Marketing & Rider Communications Handle customer survey feedback and respond to customer needs. Grow Riders Club and Rider Panel to help engage customers around TriMet initiatives. Increase active use and usability of trip tools and rider services. PA-17
82 BUD1 Personnel Services PUBLIC AFFAIRS - COMMUNICATIONS & MARKETING 14/15 15/16 16/17 16/17 17/18 Actual Actual Budget Est Budget Position Title Total Total Base Pos Total Total Base Pos Total Director, Communications & Marketing $ 107,152 $ 122,066 $ 118, $ 118,774 $ 124,569 $ 126, $ 126,892 Chief Media Relations Officer 110, , , ,008 85, , ,265 Manager, Creative Services 96,672 95, ,304 97,662 98, ,134 Manager, Media Relat & Communications 74,051 79,632 76, ,730 86,997 92, ,822 Manager, Marketing & Outreach Services 88,860 87, ,500 90,228 91, ,200 Manager, Multicultural Programs 82,643 80, ,982 83,390 84, ,320 Manager, Employee Communications 78,189 82,498 80, ,973 83,139 84, ,204 Manager, Marketing & Rider Comm. 74,595 79,689 79, ,509 81,711 82, ,830 Manager, Corporate Outreach 80,933 Transportation Options Coordinator 67,380 65, ,519 66,556 66, ,764 Transportation Options Representative 62,803 61, ,976 62,713 62, ,861 Transportation Options Representative 54,213 52, ,594 80,532 53, ,000 Transportation Options Specialist 50,321 48, ,880 50,784 51, ,584 Transportation Options Associate 43,983 42, ,723 37,514 46, ,010 Coordinator, Outreach Programs & Events 85,534 81, ,962 81,962 81, ,962 Coordinator, Outreach Services 70,417 68, ,394 70,239 70, ,609 Coordinator, Sr. Employee Communications 69,649 64,766 62, ,525 65,212 66, ,223 Coordinator, Web & Social Media 31,308 58,781 55, ,292 56,204 56, ,387 Public Information Officer 62,077 64,428 62, ,000 79,446 66, ,600 Production Coordinator, Media Planner/Buyer 51,021 49, ,213 52,217 54, ,418 Web Designer/Developer 114,661 56, , ,190 57, ,253 Specialist, Web & Social Media 42,068 52, ,021 54,323 55, ,203 Graphics Designer 53,931 52, ,031 53,130 53, ,331 Graphics Designer 53,877 51, ,941 52,669 52, ,815 Graphics & Web Designer 59,289 Specialist, Video Production 23,775 34, ,008 34,008 35, ,069 Fringe Benefits 292, , , , ,410 Capitalized Labor/Fringe (39,022) (11,284) (8,586) Unscheduled Overtime 1,237 2,750 Limited Term Employment 186, , ,572 Sick & Vacation/Holiday Payout 21,805 8,120 19,136 Total $ 1,001,786 $ 2,393, $ 2,598,004 $ 2,645, $ 2,633,624 PA-18
83 BUD2 Materials & Services PUBLIC AFFAIRS - COMMUNICATIONS & MARKETING Actual Actual Budget Estimate Budget % Change % of Expense Category 14/15 15/16 16/17 16/17 17/18 FY17-FY18 M & S Total Advertising Production $ 268,179 $ 155,000 $ 115,000 $ 136, % 7.52% Professional & Technical 54,086 58,000 48,000 58, % 3.20% Temporary Help-Gen & Adm $ , % Web Software 20,846 31,558 16,000 35,000 35, % 1.93% Other Services 33,712 52,987 50,000 35,000 35, % 1.93% Graphic Materials 1,964 1,454 8,000 10,000 8, % 0.44% Unreconciled Mastercard Expense % Computer Equip < $5,000 6, % Promotions 2, , , , , % 32.88% Publications 748 1, % 0.03% Outreach 309, , , , % 11.01% Vanpool Shuttles 27,038 55,000 40,000 48, % 2.65% Sales Programs 23,416 18,000 20,000 18, % 0.99% Telephone 5,716 10,798 5,000 10,000 8, % 0.44% Dues & Subscriptions ,500 1, % 0.06% Chamber Dues/Fees 8,156 8,000 7,530 5, % 0.31% Local Travel & Meetings 759 1,835 1,500 1, % 0.04% Education & Training 4,385 12,267 11,500 20,000 14, % 0.77% Out-of-Town Travel 11,187 16,930 12,000 20,000 19, % 1.09% Ad Media Fees 18, , , , , % 34.46% Employee Communications 7,423 25,773 3,650 20,000 4, % 0.25% Special Event Expenses 1, % Total $ 114,882 $ 1,515,909 $ 1,119,750 $ 1,040,859 $ 1,813, % % PA-19
84 Department Summary PUBLIC AFFAIRS - CUSTOMER EXPERIENCE Actual Budget Estimate Budget % Change % of 14/15 15/16 16/17 16/17 17/18 FY17- FY18 Dept. Total Personnel Services $ 3,797,283 $ 2,107,880 $ 2,445,476 $ 2,312,692 $ 2,928, % 80.93% Materials & Services 1,741, , , , , % 19.07% Total $ 5,538,641 $ 2,798,312 $ 3,186,646 $ 3,014,299 $ 3,618, % % Responsibility: The Customer Experience Department supports the agency s 5-Year Action Plan to deliver more and better service by communicating, representing and achieving safety-driven service excellence via an integrated approach to create the best possible experience for our riders. The department builds and supports strategic rider-focused initiatives to enhance the customer experience, guide the agency s customer service performance and build community support in alignment with TriMet s brand position and shared values. Activities: Department-wide Promote, support and provide amenities, tools and service to our riders and prospective riders to enhance the rider experience. Customer Information Proactively deliver timely, accurate service information to riders via static and dynamic content channels, including quarterly service changes. Respond to rider requests for information, amenities and signage. Distribute schedules and service information internally and externally to regional partners and ticket outlets. Customer Service/Rider Support Provide excellent customer service and assist riders via phone, , social media and in-person Support and promote service outreach and information. Activities - continued: Support Field Operations with on-street staffing, and manage TriMet s Ride Guide & Ask Me volunteer programs. Provide customer service training to TriMet. Research & Analysis Research analysis on regional needs. Provide accurate and detailed analysis of TriMet rider preferences to support customer friendly initiatives. Fare Policy Manage TriMet s fare policies to support revenue generation, access, ridership development and equity, including overseeing partner agreements. Performance Measures: Provide accessible information regarding service improvements and fare programs. Provide timely and relevant service-focused rider information, and complete quarterly service change information across all channels accurately and on-time. Meet response targets for the Service Improvement Process (SIP), Trip Planning and Hop account support. Respond to rider surveys and feedback by recommending and/or implementing changes to improve the rider experience. Provide accessible information regarding service improvements and fare programs. PA-20
85 BUD1 Personnel Services PUBLIC AFFAIRS - CUSTOMER EXPERIENCE 14/15 15/16 16/17 16/17 17/18 Actual Actual Budget Est Budget Position Title Total Total Base Pos Total Total Base Pos Total Customer Information Services: Senior Manager, Customer Information $ 98,643 $ 29,423 $ 85, $ 85,000 $ 88,489 $ 90, $ 90,050 Manager, IT GIS & Location Based Services 113,359 Manager, Creative Services 95,159 Manager, Multicultural Programs 78,781 Manager, Marketing & Outreach Services 74,968 Manager, Customer Information 70,316 59,090 76, ,098 74,283 74, ,400 Coordinator, Safety Outreach 89,268 Coordinator, Outreach Services 70,618 Transportation Options Coordinator 66,234 Transportation Options Representative 116,631 Transportation Options Specialist 47,291 Transportation Options Associate 40,808 Analyst, Business Systems 70,031 82, ,942 84, ,601 Administrative Specialist 29,927 Graphics & Web Designer 51,052 Specialist, Information Development 281, ,034 70, , ,380 70, ,691 Specialist, Information Development 70, ,691 Supervisor, Document Services 49,139 Document Services Operator 16,049 Center Mail Services Clerk 54,739 Mail Services Clerk 16,049 Coordinator, Senior Fare Policy Program 77,236 79,861 78, ,898 80,960 81, ,372 Senior Analyst, Research 69,159 73,506 71, ,195 73,805 74, ,844 Analyst, Bus Stops Planner 68,206 Analyst II, GIS Data 58,782 PA-21
86 BUD1 Personnel Services PUBLIC AFFAIRS - CUSTOMER EXPERIENCE 14/15 15/16 16/17 16/17 17/18 Actual Actual Budget Est Budget Position Title Total Total Base Pos Total Total Base Pos Total Fringe Benefits $ 806,719 $ 205,803 $ 277,908 $ 277,908 $ 270,611 Workers' Compensation 1, Capitalized Labor/Fringe (185,506) (33,214) (22,568) Longevity Premium 1,357 1,357 1,352 Unscheduled Overtime 10,387 12,106 17,417 20,602 19,917 Limited Term Employment 76,742 4,560 Customer Service: Supervisor, Customer Service 72,177 75,178 $ 72, ,516 72,516 $ 72, ,516 Customer Service Representative 315, ,676 62, , ,312 62, ,312 Customer Experience Agent 123, ,229 45, ,355 90,355 46, ,435 Customer Experience Agent 45, , ,888 46, ,958 Manager, Customer Service 77,314 82,098 79, ,009 90,444 65, ,000 Coordinator, On-Street Customer Service 61,996 68,148 56, ,722 43,720 50, ,003 Assistant, On-Street Customer Service Program 36,888 38,340 37, ,149 34,447 41, ,496 Representative, Field Outreach & Comm. Rels. 96, ,293 31, , ,787 35, ,594 Fringe Benefits 492, , , , ,702 Workers' Compensation 11,284 10,000 4,000 18,000 Longevity Premium 1,253 1,253 1,993 Unscheduled Overtime 9,065 17,257 5,682 15,682 14,182 Extra Service Pay 16,218 16,218 16,218 Premium Pay 1,117 1,117 1,117 FY2017 efare (172,573) (172,573) Sick & Vacation/Holiday Payout 14,899 1,565 14,195 Total $ 3,797,283 $ 2,107, $ 2,445,476 $ 2,312, $ 2,928,250 PA-22
87 BUD2 Materials & Services PUBLIC AFFAIRS - CUSTOMER EXPERIENCE Actual Actual Budget Estimate Budget % Change % of Expense Category 14/15 15/16 16/17 16/17 17/18 FY17-FY18 M & S Total Customer Information Services: Advertising Production $ 206, % Legal 7, % Professional & Technical 203,329 $ 14, % Fare Program 34,647 2,718 $ 38,752 $ 30,835 $ 39, % 5.67% Consumer Research 113, , , , , % 14.61% Temporary Help 12,311 7, % Photocopier Maint - Doc Svcs 20, % Other Services 46,970 1, % Graphics Materials 7, % Schedule & Service Information 191, , , , , % 26.77% Office Supplies 3,892 3, % Furniture & Equipment <$5,000 4,711 2, % Other Materials 2,320 3, % Postage 75, % Microcomputer Software % Computer Equipment <$5,000 3, % Doc Services Supplies 11, % Promotions 200,024 1, % Schedule Books & Map 16,284 6,597 10,500 8,000 10, % 1.54% Outreach 98,073 (450) 0.00% Vanpool Shuttles 28, % Customer Information Materials 11,009 2,665 10,951 9,915 11, % 1.60% Sales Programs 22,883 1,357 2, % Customer Information & Signage 186, , , , , % 30.57% Telephone 55,862 49, % Dues & Subscriptions % Chamber Dues/Fees 6, % Local Travel & Meetings 1, % Education & Training 9, % Out-of-Town Travel 13, % Media Fees 133, % Subtotal Customer Information Services: $ 1,720,335 $ 664,951 $ 641,780 $ 609,173 $ 557,306 PA-23
88 BUD2 Materials & Services PUBLIC AFFAIRS - CUSTOMER EXPERIENCE Actual Actual Budget Estimate Budget % Change % of Expense Category 14/15 15/16 16/17 16/17 17/18 FY17-FY18 M & S Total Customer Service: Uniforms $ 423 $ 741 $ 1, % Professional & Technical $ 7,070 11,141 $ 7, % 1.03% Call Center Operations 14,490 2,000 48, % 7.07% Temporary Help % 0.00% Other Services 2,500 7,595 2, % 0.37% Office Supplies 538 1, % 0.00% Other Materials 2,378 2,207 2, % 0.35% Postage % 0.00% On Street Customer Service 18,792 23,142 22,925 15,710 23, % 3.36% Telephone 42,209 45,000 42, % 6.18% Dues & Subscriptions % 0.00% Education & Training 4,542 4,000 4, % 0.66% Customer Service Training 1,808 1,598 1,550 1,200 1, % 0.22% Subtotal Customer Service: $ 21,023 $ 25,481 $ 99,390 $ 92,434 $ 132,789 $ 1,741,358 $ 690,432 $ 741,170 $ 701,607 $ 690, % % PA-24
89 BUDGET PROGRESSION SCHEDULE - PUBLIC AFFAIRS Actual Actual Adopted Proposed Approved Adopted 14/15 15/16 16/17 17/18 17/18 17/18 Administration $ 271,427 $ 300,098 $ 514,092 Personnel Services $ 489,870 $ 489,870 $ 533,309 36,920 87, ,477 Materials & Services 243, , ,638 $ 308,347 $ 387,323 $ 794,569 Department Total $ 733,508 $ 733,508 $ 776,947 Planning & Policy $ 1,161,464 $ 1,019,207 $ 1,118,375 Personnel Services $ 1,145,968 $ 1,145,968 $ 1,162,691 3,865,630 3,532,678 5,086,712 Materials & Services 4,986,333 4,986,333 4,723,080 $ 5,027,094 $ 4,551,885 $ 6,205,087 Department Total $ 6,132,301 $ 6,132,301 $ 5,885,771 GIS & Location Based Services $ 481,976 $ 528,951 Personnel Services $ 537,347 $ 537,347 $ 536,724 1,879 1,566 Materials & Services 22,481 22,481 22,481 $ 483,855 $ 530,517 Department Total $ 559,828 $ 559,828 $ 559,205 Community Affairs $ 78,780 $ 158,721 Personnel Services 433 1,010 Materials & Services $ 79,213 $ 159,731 Department Total Government Services & Community Affairs $ 110,138 $ 112,928 $ 114,580 Personnel Services $ 283,840 $ 283,840 $ 283, , , ,004 Materials & Services 361, , ,445 $ 498,761 $ 394,646 $ 456,584 Department Total $ 645,285 $ 645,285 $ 645,215 Communications & Marketing $ 1,001,786 $ 2,393,354 $ 2,598,004 Personnel Services $ 2,658,211 $ 2,658,211 $ 2,633, ,882 1,515,909 1,119,750 Materials & Services 1,813,798 1,813,798 1,813,798 $ 1,116,668 $ 3,909,263 $ 3,717,754 Department Total $ 4,472,009 $ 4,472,009 $ 4,447,422 Customer Experience $ 3,797,283 $ 2,107,880 $ 2,445,476 Personnel Services $ 2,916,653 $ 2,916,653 $ 2,928,250 1,741, , ,170 Materials & Services 690, , ,095 $ 5,538,641 $ 2,798,312 $ 3,186,646 Department Total $ 3,606,748 $ 3,606,748 $ 3,618,345 Division Total $ 6,342,098 $ 6,494,223 $ 7,478,199 Personnel Services $ 8,031,889 $ 8,031,889 $ 8,078,368 6,147,413 6,110,274 7,572,689 Materials & Services 8,117,790 8,117,790 7,854,537 $ 12,489,511 $ 12,604,497 $ 15,050,888 Total Public Affairs $ 16,149,679 $ 16,149,679 $ 15,932,905 PA-25
90 GRANT FUNDED PROGRAMS - PUBLIC AFFAIRS PERSONNEL SERVICES Type of % of Budget Grant TriMet Funding Position Title Federal Funding Position 17/18 Share Share Surface Transportation Program Manager, Marketing & Outreach Services 89.73% 0.25 $ 30,567 $ 27,427 $ 3,139 Surface Transportation Program Transportation Operations Coordinator 89.73% ,823 84,187 9,636 Surface Transportation Program Transportation Options Representative 89.73% ,198 80,935 9,263 Surface Transportation Program Transportation Options Representative 89.73% ,802 69,812 7,989 Surface Transportation Program Transportation Options Specialist 89.73% ,907 69,008 7,898 Surface Transportation Program Transportation Options Associate 89.73% ,665 62,511 7,155 Metro Intergovernmental Agreement Analyst, GIS Data 21.49% ,472 18,587 67, $ 525,432 $ 412,466 $ 112,966 PA-26
91 GRANT FUNDED PROGRAMS - PUBLIC AFFAIRS MATERIALS & SERVICES Type of % of Budget Grant TriMet Funding Expense Category Federal Funding 17/18 Share Share Section 5307 Urbanized Area Formula Funds Community Job Connector-North Hillsboro 50.00% $ 400,000 $ 200,000 $ 200,000 Section 5307 Urbanized Area Formula Funds Community Job Connector-Tualatin/Grove Link 50.00% 600, , ,000 Section 5307 Urbanized Area Formula Funds Community Job Connector-Swan Island 50.00% 240, , ,000 Section 5310 Elderly & Disabled Funds Federal 5310 Program 80.00% 1,200, , ,000 State 5310 Funds for Elderly & Disabled Funds East County U-Ride (State 5310) 89.73% 125, ,195 12,841 State 5310 Funds for Elderly & Disabled Funds Tualatin Shuttle (State 5310) 89.73% 59,225 53,143 6,082 State 5310 Funds for Elderly & Disabled Funds Mobility Management (State 5310) 89.73% 111, ,000 11,445 $ 2,735,706 $ 1,845,338 $ 890,368 PA-27
92 [This Page Left Intentionally Blank] PA-28
93 Division Summary SAFETY & SECURITY Actual Budget Estimate Budget % Change % of 14/15 15/16 16/17 16/17 17/18 FY17- FY18 Division Total Personnel Services $ 1,434,265 $ 1,518,566 $ 6,169,799 $ 6,179,436 $ 7,232, % 28.57% Materials & Services 12,554,298 13,774,957 15,782,783 14,867,994 18,082, % 71.43% Total $ 13,988,563 $ 15,293,523 $ 21,952,582 $ 21,047,430 $ 25,314, % % Page Safety & Security Division Division Summary SS-1 Safety, Security, Environmental Services & Transportation Training SS-2 SS-1
94 Department Summary SAFETY & SECURITY - SAFETY, SECURITY, ENVIRONMENTAL SERVICES & TRANSPORTATION TRAINING Actual Budget Estimate Budget % Change % of 14/15 15/16 16/17 16/17 17/18 FY17- FY18 Dept. Total Personnel Services $ 1,434,265 $ 1,518,566 $ 6,169,799 $ 6,179,436 $ 7,232, % 28.57% Materials & Services 12,554,298 13,774,957 15,782,783 14,867,994 18,082, % 71.43% Total $ 13,988,563 $ 15,293,523 $ 21,952,582 $ 21,047,430 $ 25,314, % % Responsibility: The Safety, Security, Environmental & Transportation Training Department is responsible for leading the entire TriMet organization in creating a culture of safety and service excellence, in which safety is the fundamental value, which guides all agency decisions. Activities: Safety - Safety Management System Plan. - Data information, acquisition/analysis and reporting. - Construction and fire/life safety. - Training and committees. - Assurance, audits and inspections. - Certification. - Hazard identification, evaluation and analysis. - Occupational Safety and Health. - Substance abuse management. - Interface with regulatory agencies. Environmental Services - Chemical hazardous waste management, tracking and reporting - Industrial Wastewater/Stormwater management, sampling, maintenance and reporting. - Underground Injection Well program management. - Under- and above-ground storage tank testing, maintenance and reporting. - Air emissions management and reporting. - Environmental clean-up and spill response. Activities - continued: Security - TriMet transit police, transit security officers, and deputy district attorney. - Continually identify, assess and resolve transit security threats and vulnerabilities; collect, analyze security data and intelligence. - Security Program Plan. - Employee security awareness and training development. - Crime Prevention Through Environmental Design (CPTED) incorporated into TriMet projects. - Security certification and program audits. - Emergency preparedness, plans, organization equipment training and procedures, exercises/evaluations for readiness to perform the prevention, protection, response and recovery capabilities applicable to mass transit employees and operations during catastrophic natural disasters or terrorist attacks. - Coordinate and integrate TriMet emergency plans with emergency response management jurisdictions in TriMet s service area. - DHS transit security grants. Transportation Training - Initial and re-certification training programs for bus and light rail operators and field supervisors. Performance Measures: TriMet workplace safety incident rates at or below transit industry standards and rates of comparable mass transit agencies. Reported crimes per 100,000 riders. Sustain or improve TriMet customer perception of safety and security. Fulfill all FTA and DHS safety and security program and environmental regulation certification requirements. SS-2
95 BUD1 Personnel Services SAFETY & SECURITY - SAFETY, SECURITY, ENVIRONMENTAL SERVICES & TRANSPORTATION TRAINING 14/15 15/16 16/17 16/17 17/18 Actual Actual Budget Est Budget Position Title Total Total Base Pos Total Total Base Pos Total Administration: Executive Director, Safety & Security $ 157,999 $ 168,654 $ 162, $ 162,740 $ 166,782 $ 167, $ 167,590 Fringe Benefits 23,023 16,168 40,908 40,908 41,089 Safety: Director, Safety Mgmt & Environmental Services 119, , , , , ,417 Manager, Construction Safety & Risk 96,456 Manager, Safety Assurance & Training 124,363 Specialist, Senior Systems Safety 80,998 82,662 85, ,750 87,103 87, ,374 Specialist, System Safety 74, ,438 74, , ,221 72, ,886 Specialist, Safety Data Management 64,056 13,062 55, ,600 57,952 58, ,322 Administrator, Drug & Alcohol Testing Program 61,129 68,510 71, ,000 73,560 74, ,543 Specialist, Drug & Alcohol Program 53,399 52,728 52, ,062 54,290 54, ,309 Administrative Assistant 45, ,564 Fringe Benefits 225, , , , ,564 Workers' Compensation 1,728 3,000 Unscheduled Overtime 2,352 5,143 4,111 Capitalized Labor/Fringe (85,511) (90,835) (100,354) (82,841) (103,138) Security: Coordinator, Crime Prevention & Data Analysis 83,862 93,240 70, ,997 70,997 70, ,997 Manager, Security & Emergency Management 8,619 83, ,000 84,943 85, ,331 Coordinator, Safety & Security 54,949 62,271 62, ,000 49,122 71, ,500 Coordinator, Exclusions 50,755 54,783 55, ,994 58,210 59, ,072 Assistant Safety & Security-Environmental 29,042 41,852 40, ,602 41,572 41, ,766 Fringe Benefits 98, , , , ,588 Longevity Premium 3,758 3,758 3,744 Unscheduled Overtime 10,120 11,424 8,050 Non-Union Baseline Adjustment 48,596 62,782 Sick & Vacation/Holiday Payout 23,649 3,074 25,711 SS-3
96 BUD1 Personnel Services SAFETY & SECURITY - SAFETY, SECURITY, ENVIRONMENTAL SERVICES & TRANSPORTATION TRAINING 14/15 15/16 16/17 16/17 17/18 Actual Actual Budget Est Budget Position Title Total Total Base Pos Total Total Base Pos Total Environmental Services: Manager, Environmental Services $ 93,915 $ 97,117 $ 97, $ 97,081 $ 99,315 $ 99, $ 99,762 Coordinator, Environmental 61,385 71,382 71, ,260 73,733 74, ,228 Fringe Benefits 71,205 79,335 61,548 61,548 60,754 Capitalized Labor/Fringe (11,967) (7,326) Bus Operator Training: Director, Transportation Training 60, , ,027 Manager, Bus Transportation Training 94, ,781 58,173 87, ,260 Assistant Manager, Transportation Training 78, ,011 60,023 84, ,601 Operations Specialist 57, ,366 72,934 52, ,063 Training Supervisor 73, ,330,134 1,330,134 73, ,330,134 Training Supervisor 73, , ,067 73, ,171 Training Supervisor - Field Operations 77, ,076 Training Supervisor - Field Operations 77, ,538 Fringe Benefits 965, ,892 1,059,564 Workers' Compensation 100,000 54,828 51,000 Longevity Premium 38,611 38,611 30,576 Unscheduled Overtime - Non-Op. 187, , ,429 Rail Operator Training: Assistant Manager, Transportation Training 82, ,099 84,860 85, ,596 Operations Specialist 54, ,585 Training Supervisor 73, , ,585 73, ,274 Training Supervisor 73, , ,585 73, ,482 Fringe Benefits 285, , ,057 Workers' Compensation 31,000 50,000 Limited Term Employment 70,138 Longevity Premium 10,000 10,000 1,352 Unscheduled Overtime - Non-Op. 5,844 41,575 19,169 FY2017 Control Center (53,095) (53,095) Total $ 1,434,265 $ 1,518, $ 6,169,799 $ 6,179, $ 7,232,383 SS-4
97 BUD2 Materials & Services SAFETY & SECURITY - SAFETY, SECURITY, ENVIRONMENTAL SERVICES & TRANSPORTATION TRAINING Actual Actual Budget Estimate Budget % Change % of Expense Category 14/15 15/16 16/17 16/17 17/18 FY17-FY18 M & S Total Safety: Professional & Technical $ 40,115 $ 277,170 $ 470,000 $ 505,000 $ 581, % 3.21% Drug and Alcohol Testing 92,900 89, ,351 86,788 90, % 0.50% Safety Occupational Services 105, ,371 80, % Rail Safety Oversight 26, % Temporary Help-Trans Adm 2,215 3,986 30,710 15,588 5, % 0.03% Other Services 27,080 9,711 5,406 15, % Office Supplies 4,081 4,814 12,666 17,000 12, % 0.07% Other Materials 19,664 8,689 1,629 2, % Computer Equipment <$5,000 4, ,500 1,746 2, % 0.01% Safety Supplies - Gen & Adm % Telephone 11,863 8,375 7,000 6,000 8, % 0.04% Dues & Subscriptions 1,921 4, ,700 2, % 0.01% Education & Training 6,550 8,709 9,335 6,000 3, % 0.02% Local Travel 1, % Out-of-Town Travel 28,872 29,198 21,100 12,039 15, % 0.08% Employee Recognition % 0.00% Special Event Expenses % Subtotal Safety: $ 373,152 $ 581,956 $ 673,662 $ 740,268 $ 738,969 Security: Temporary Help 65,864 59,032 20,000 5, % 0.03% Security Services 8,247,088 9,380,887 11,622,804 10,800,000 12,754, % 70.50% Deputy DA Contract 208, , , , , % 1.24% Other Services - Security 1,773,308 1,659,960 1,511,471 1,300,000 1,615, % 8.93% Building Security Maintenance 116, , , , , % 1.11% Exclusion & Tow Hearings 98,384 81, ,000 75,000 60, % 0.33% Canine Program 536, , , , , % 2.79% Anti-Terrorism Team 609, , , , , % 2.03% Street Level Gang Outreach Program 42, , , , , % 0.62% Other Services 29,072 12,774 8,975 12, % SS-5
98 BUD2 Materials & Services SAFETY & SECURITY - SAFETY, SECURITY, ENVIRONMENTAL SERVICES & TRANSPORTATION TRAINING Actual Actual Budget Estimate Budget % Change % of Expense Category 14/15 15/16 16/17 16/17 17/18 FY17-FY18 M & S Total Office Supplies $ 16,687 $ 9,003 $ 8,666 $ 10,000 $ 10, % 0.06% Other Materials 3, ,500 47, % Unreconciled Mastercard Expense % Computer Equipment <$5,000 12,295 2,253 2,500 5,000 2, % 0.01% Telephone 3,458 4,137 4,000 6,795 8, % 0.04% Dues & Subscriptions ,150 2, % 0.01% Local Travel & Meetings ,000 6, % Education & Training 3, % Out-of-Town Travel 1,991 3,500 9,000 10, % 0.06% Assault Reward 200 1, % Subtotal Security: $ 11,764,184 $ 12,786,299 $ 14,597,569 $ 13,640,149 $ 15,944,933 Environmental Services: Environmental Consulting 62,420 8,375 26,702 10,000 10, % 0.06% Contracted Maintenance - Environmental 15,215 5,205 26, , % 5.38% Environmental Services 22,844 34,201 39,416 39, % 0.00% Waste Disposal Services 302, , , , , % 1.86% Office Supplies 535 4,666 1,000 2, % 0.01% Equip/Furn < $5,000-Gen & Adm % Computer Equipment <$5, , % 0.00% Environmental Materials 10,332 8,408 2,000 1, % 0.01% "Green Team" Materials 1, % Telephone 1,160 1,008 2,500 1,000 1, % 0.01% Local Travel & Meetings 229 1, % Education & Training 1, % Out-of-Town Travel 3,061 1,200 2, % 0.01% Subtotal Environmental Services: $ 416,962 $ 406,702 $ 461,052 $ 401,946 $ 1,328,700 SS-6
99 BUD2 Materials & Services SAFETY & SECURITY - SAFETY, SECURITY, ENVIRONMENTAL SERVICES & TRANSPORTATION TRAINING Actual Actual Budget Estimate Budget % Change % of Expense Category 14/15 15/16 16/17 16/17 17/18 FY17-FY18 M & S Total Bus Transportation Training: Operator Uniforms $ 1, % Accident Review/Investigations $ 6,000 $ 7,000 7, % 0.04% Temporary Help-Trans Adm 10,000 14,000 5, % 0.03% Other Services 1,000 1,100 2, % 0.01% Office Supplies 6,000 4,500 7, % 0.04% Other Materials 10,000 13,440 10, % 0.06% Computer Equipment <$5,000 8,987 2, % Operator Training Materials 4,800 8,000 8, % 0.04% Local Travel & Meetings 1, % Operator Roadeo 1,184 2, % Out-of-Town Travel 1, % Education & Training 8, % Telephone 8,000 18,559 3, % 0.02% Subtotal Bus Transportation Training: $ 45,800 $ 76,770 $ 58,260 Rail Transportation Training: Operator Uniforms 1, % Other Services % 0.00% Office Supplies 2,000 1,103 1, % 0.01% Other Materials 1, , % 0.01% Computer Equipment <$5,000 3,708 1, % Operator Training Materials 1,200 1,000 1, % 0.01% Telephone 2,000 2, % Education & Training 3, % Subtotal Rail Transportation Training: $ 4,700 $ 8,861 $ 11,275 $ 12,554,298 $ 13,774,957 $ 15,782,783 $ 14,867,994 $ 18,082, % % SS-7
100 BUDGET PROGRESSION SCHEDULE - SAFETY & SECURITY Actual Actual Adopted Proposed Approved Adopted 14/15 15/16 16/17 17/18 17/18 17/18 Safety, Security, Environmental Services & Transportation Training $ 1,434,265 $ 1,518,566 $ 6,169,799 Personnel Services $ 7,199,515 $ 7,199,515 $ 7,232,383 12,554,298 13,774,957 15,782,783 Materials & Services 17,108,437 17,108,437 18,082,137 $ 13,988,563 $ 15,293,523 $ 21,952,582 Department Total $ 24,307,952 $ 24,307,952 $ 25,314,520 Division Total $ 1,434,265 $ 1,518,566 $ 6,169,799 Personnel Services $ 7,199,515 $ 7,199,515 $ 7,232,383 12,554,298 13,774,957 15,782,783 Materials & Services 17,108,437 17,108,437 18,082,137 $ 13,988,563 $ 15,293,523 $ 21,952,582 Total Safety & Security $ 24,307,952 $ 24,307,952 $ 25,314,520 SS-8
101 Division Summary INFORMATION TECHNOLOGY Actual Budget Estimate Budget % Change % of 14/15 15/16 16/17 16/17 17/18 FY17- FY18 Division Total Personnel Services $ 5,344,664 $ 5,918,751 $ 6,612,961 $ 6,389,451 $ 7,078, % 57.67% Materials & Services 2,289,427 2,330,941 4,444,578 3,805,001 5,196, % 42.33% Total $ 7,634,091 $ 8,249,692 $ 11,057,539 $ 10,194,452 $ 12,275, % % Page Information Technology Division Division Summary IT-1 Information Technology IT-2 IT-1
102 Department Summary INFORMATION TECHNOLOGY - INFORMATION TECHNOLOGY Actual Budget Estimate Budget % Change % of 14/15 15/16 16/17 16/17 17/18 FY17- FY18 Dept. Total Personnel Services $ 5,344,664 $ 5,918,751 $ 6,612,961 $ 6,389,451 $ 7,078, % 57.67% Materials & Services 2,289,427 2,330,941 4,444,578 3,805,001 5,196, % 42.33% Total $ 7,634,091 $ 8,249,692 $ 11,057,539 $ 10,194,452 $ 12,275, % % Responsibility: The Information Technology Department is responsible for managing information resources including corporate data, computing tools and networks used to carry out agency-wide business processes and management goals. Activities: Technical support. Consulting services. Business process analysis. Data modeling and design. Shared data repository. System development standards. Project development and maintenance. Hardware and software acquisition. Metropolitan-wide networks. Desktop connectivity, and Internet. Telephones and voic . System and network security. Application training and support. Performance Measures: Network and server availability exceeding 99% uptime, measured on a 24-hour basis using industry criteria. Maintain a technical service request resolution rate of 95% per week with an average completion time not exceeding four (4) hours. IT project selection and execution is closely aligned with the agency s strategic goals and priorities. IT-2
103 BUD1 Personnel Services INFORMATION TECHNOLOGY - INFORMATION TECHNOLOGY 14/15 15/16 16/17 16/17 17/18 Actual Actual Budget Est Budget Position Title Total Total Base Pos Total Total Base Pos Total Chief Information Officer $ 163,726 $ 169,542 $ 166, $ 166,416 $ 172,639 $ 173, $ 173,883 Administration: Manager, Information Security 116, ,070 32, , ,000 Senior Administrative Assistant 40,694 50,518 53, ,373 54,794 55, ,078 Enterprise Systems Development: Manager, Enterprise Systems 112, , , , , , ,201 Senior Software Engineer/Architect 416, , , , , , ,497 Senior Development-Ops Engineer 109, , , , , ,200 Software Engineer 191, ,925 97, , , , ,121 Software Engineer - Web Applications 94,487 99,278 95, ,681 96,886 97, ,127 Software Engineer - Web Applications 310, ,668 92, , ,025 87, ,502 Analyst, IT Systems 210, ,448 82, , ,986 84, ,808 Oracle Application Technology: Manager, Oracle Technology 136, , , , , , ,898 Oracle Applications DBA 223, , , , , , ,282 Oracle Database Architect 126, , , , , , ,676 Oracle Applications Developer V 116, , , , , , ,493 Oracle Applications Developer IV 115, , , , , , ,649 Operations Systems: Manager, Intelligent Transportation Systems 123, , , , , , ,772 Engineer IV, Rail Systems 116, ,140 26, , ,000 Sr. ITS Softw Syst Eng Arch IV-CAD/AVL 109,204 90, , ,211 99, , ,801 Sr. ITS Softw Syst Eng Arch IV-Rail 93, , , , , , ,978 Sr. ITS Software Systems Engineer-eFare 12, , , , , , ,827 Sr. ITS Engineer/Arch IV-Vehicle Tech 100, ,825 96, ,045 99, , ,036 Sr. ITS Softw Syst Eng Arch IV-Fare Coll 88,650 88,414 85, ,320 86,387 86, ,600 Systems Engineer III-CCTV 85,217 89, ,525 65,417 72, ,500 ITS Software Systems Engineer III-CAD/AVL 97,799 99,938 92, ,107 93,268 93, ,500 ITS Software Systems Engineer III-Rail 69,231 60,720 87, ,391 50, , ,265 ITS Software Systems Engineer III-ATP 85,851 88,239 86, ,973 88,087 88, ,310 IT-3
104 BUD1 Personnel Services INFORMATION TECHNOLOGY - INFORMATION TECHNOLOGY 14/15 15/16 16/17 16/17 17/18 Actual Actual Budget Est Budget Position Title Total Total Base Pos Total Total Base Pos Total Networks & Communications: Manager, Network Communications $ 117,946 $ 123,554 $ 119, $ 119,860 $ 120,867 $ 121, $ 121,068 Network Communications Engineer III 104, , , , , , ,877 Network Communications Engineer III 80, ,527 97, , ,938 98, ,079 Telecommunications Engineer III 92,316 82, ,942 72,100 72, ,100 Telecommunications Eng III-Voice Systems 76,624 83,903 79, ,203 80,501 80, ,760 PC Support Services: Manager, Technical Services 117, , , , , , ,144 Systems Engineer III-Linux Server 97,297 92,220 90, ,344 92,263 93, ,211 Systems Engineer III-VMware Server 85,187 92,210 89, ,505 91,512 92, ,326 Systems Engineer III-Exchange Server 70,248 87,956 85, ,406 88,972 90, ,287 Systems Engineer III, Server 54,363 81, ,120 84,276 85, ,540 Engineer, Desktop Systems 68,530 72,890 70, ,810 72,597 73, ,444 Supervisor, Technical Support 70,646 75,671 73, ,783 76,867 77, ,484 Specialist II, Technical Support 63,574 66,859 64, ,480 65,538 65, ,749 Specialist II, Technical Support 102, ,506 54, , ,496 56, ,942 Fringe Benefits 1,510,220 1,543,514 1,705,066 1,705,066 1,742,106 Capitalized Labor/Fringe (429,013) (269,145) (379,163) (248,718) (285,632) Non-Union Baseline Adjustment 171, ,605 Sick & Vacation/Holiday Payout 44,919 74,079 40,568 Limited Term Employment 61,687 Workers' Compensation (10,086) 1,842 1, ,000 Unscheduled Overtime 550 1,143 9,570 1,000 9,570 Total $ 5,344,664 $ 5,918, $ 6,612,961 $ 6,389, $ 7,078,921 IT-4
105 BUD2 Materials & Services INFORMATION TECHNOLOGY - INFORMATION TECHNOLOGY Actual Actual Budget Estimate Budget % Change % of Expense Category 14/15 15/16 16/17 16/17 17/18 FY17-FY18 M & S Total PCI Compliance Audit $ 12,500 $ 26, % Professional & Technical 121,159 $ 366,339 $ 531,626 $ 601,920 1,011, % 19.47% Temporary Help 358, ,020 85, , , % 5.06% Microcomputer Maintenance Service 3, ,535 2,972 2, % 0.04% Communications Systems Maintenance 390, , , , , % 10.72% Hardware Maintenance 165, , , , , % 3.40% Software Maintenance-CCTV Systems 49,589 48,400 38,092 39,298 41, % 0.80% Warranty Costs 890, , , % 17.14% Contracted Maintenance - Fare Equipment 174, , % 0.00% Other Services 14,532 5,640 14,800 11,461 10, % 0.21% Office Supplies 950 1,165 1,150 1,571 1, % 0.02% Other Materials 7,811 15,026 17,000 6,913 15, % 0.29% Unreconciled Mastercard Expense 3, % Microcomputer Software 10,786 20,547 7,575 8,675 57, % 1.11% PCI Compliance Equipment 23,555 47,026 29,984 91, % 0.00% Microcomputer Maintenance Material 18,231 20,577 16,777 18,160 18, % 0.35% Telephone 7,108 19,056 10,585 12,570 10, % 0.21% Network Access Services 63,800 47,845 51,420 56,345 58, % 1.13% Dues & Subscriptions 6,642 7,844 8,025 8,010 8, % 0.16% Local Travel & Meetings % 0.01% Education & Training 14,889 32,907 22,150 21,470 22, % 0.43% Out-of-Town Travel 16,130 15,803 19,150 21,015 19, % 0.37% Employee Recognition % 0.00% Software License Fees 1,003,416 1,036,080 1,828,222 1,392,368 2,003, % 38.57% Total $ 2,289,427 $ 2,330,941 $ 4,444,578 $ 3,805,001 $ 5,196, % % IT-5
106 BUDGET PROGRESSION SCHEDULE - INFORMATION TECHNOLOGY Actual Actual Adopted Proposed Approved Adopted 14/15 15/16 16/17 17/18 17/18 17/18 Information Technology $ 5,344,664 $ 5,918,751 $ 6,612,961 Personnel Services $ 7,049,971 $ 7,049,971 $ 7,078,921 2,289,427 2,330,941 4,444,578 Materials & Services 5,196,725 5,196,725 5,196,725 $ 7,634,091 $ 8,249,692 $ 11,057,539 Department Total $ 12,246,696 $ 12,246,696 $ 12,275,646 Division Total $ 5,344,664 $ 5,918,751 $ 6,612,961 Personnel Services $ 7,049,971 $ 7,049,971 $ 7,078,921 2,289,427 2,330,941 4,444,578 Materials & Services 5,196,725 5,196,725 5,196,725 $ 7,634,091 $ 8,249,692 $ 11,057,539 Total Information Technology $ 12,246,696 $ 12,246,696 $ 12,275,646 IT-6
107 Division Summary FINANCE & ADMINISTRATION Actual Budget Estimate Budget % Change % of 14/15 15/16 16/17 16/17 17/18 FY17-FY18 Division Total Personnel Services $ 7,585,746 $ 9,500,604 $ 10,193,170 $ 10,183,198 $ 10,987, % 54.25% Materials & Services 6,921,043 4,234,648 7,846,291 6,388,892 9,266, % 45.75% Total $ 14,506,789 $ 13,735,252 $ 18,039,461 $ 16,572,090 $ 20,253, % % Page Finance & Administration Division Division Summary FA-1 Administration FA-2 Financial Services FA-5 Budget & Grants Administration FA-8 Insurance Programs FA-11 Procurement & Contracts FA-14 Fare Revenue FA-17 FA-1
108 Department Summary FINANCE & ADMINISTRATION - ADMINISTRATION Actual Budget Estimate Budget % Change % of 14/15 15/16 16/17 16/17 17/18 FY17-FY18 Dept. Total Personnel Services $ 365,131 $ 323,375 $ 437,421 $ 336,167 $ 472, % 63.69% Materials & Services 1,142,160 79, , , , % 36.31% Total $ 1,507,291 $ 402,427 $ 711,072 $ 554,157 $ 741, % % Responsibility: The Finance & Administration Department is responsible for managing agency financial activities, assuring effective financial controls and planning for future financial requirements. Activities in support of these responsibilities include: Strategic financial planning. Financial analysis and forecasting. Budget preparation and monitoring. Capital planning and project financing. Accounting for agency assets and activities. Payroll and related functions. Cash management and investments. Debt management and compliance. Contracts and procurement. Grants administration and reporting. Workers Compensation program. Public Liability claims and agency risk management. Defined benefit pension plan accounting and oversight. Deferred compensation (457) plan and defined contribution (401a) plan management and oversight. Fare system and revenue collection controls and oversight. Performance Measures: Accurate and timely communication of financial issues with General Manager and Board. Publication of accurate and timely agency financial reports with no material audit findings. Enforcement of appropriate financial controls to assure safety of District assets, including implementation of cash and fare revenue policies. Publication of annual District budget consistent with state law, and assurance of ongoing compliance. Implementation of debt and lease programs to meet agency capital needs. Enforcement of procurement and contracting process consistent with Board policy and FTA requirements. Establishment of appropriate risk management programs, including commercial and self-insurance. Accurate reporting of District defined benefit pension plan assets and liabilities and oversight of plans. Management of agency s deferred compensation plan and defined contribution plan to ensure compliance with fiduciary duties. FA-2
109 BUD1 Personnel Services FINANCE & ADMINISTRATION - ADMINISTRATION 14/15 15/16 16/17 16/17 17/18 Actual Actual Budget Est Budget Position Title Total Total Base Pos Total Total Base Pos Total Executive Director, Finance & Admin (CFO) $ 213,029 $ 193,683 $ 190, $ 190,543 $ 196,004 $ 197, $ 197,096 Executive Administrative Assistant 60,915 65,394 63, ,419 64,979 65, ,291 Fringe Benefits 89,636 64,298 72,924 72,924 73,335 Workers' Compensation 1,551 1,000 Non-Union Baseline Adjustment 107, ,973 Sick & Vacation/Holiday Payout 1,744 2,260 1,531 Total $ 365,131 $ 323, $ 437,421 $ 336, $ 472,226 FA-3
110 BUD2 Materials & Services FINANCE & ADMINISTRATION - ADMINISTRATION Actual Actual Budget Estimate Budget % Change % of Expense Category 14/15 15/16 16/17 16/17 17/18 FY17-FY18 M & S Total Legal $ 6,539 $ 6,984 $ 35,350 $ 20,000 $ 30, % 11.14% Professional & Technical 31, , , , % 62.40% Office Equipment Service % 0.10% Other Services 12,106 10,100 15,150 13,000 16, % 6.22% Office Supplies 2,553 1, % 0.17% Other Materials 101 2,020 2,200 2, % 0.74% Telephone % 0.26% Phys. Damage/Property/Casualty Insur. 714, % Railroad Liability Insur: Steel Bridge 84, % Excess Liability Insurance 277, % Self-Insurance WC/Excess WC 17, % Dues & Subscriptions 1,095 1,069 2,020 3,500 3, % 1.11% Local Travel % Education & Training ,525 2,025 2, % 0.95% Out-of-Town Travel 24,531 25,834 40,761 44,000 45, % 16.71% Employee Recognition , % 0.20% Recruitment Expense % 0.00% Total $ 1,142,160 $ 79,052 $ 273,651 $ 217,990 $ 269, % % FA-4
111 Department Summary FINANCE & ADMINISTRATION - FINANCIAL SERVICES Actual Budget Estimate Budget % Change % of 14/15 15/16 16/17 16/17 17/18 FY17-FY18 Dept. Total Personnel Services $ 1,743,751 $ 1,885,328 $ 2,075,883 $ 1,924,970 $ 2,205, % 91.61% Materials & Services 139, , , , , % 8.39% Total $ 1,883,335 $ 2,077,178 $ 2,275,892 $ 2,066,160 $ 2,407, % % Responsibility: The Financial Services Department is responsible for the day-to-day financial activities of TriMet. The department combines the following major functions: Accounting. Payroll and pension. Activities: Financial reporting. Grant accounting. Development and evaluation of self insurance reserves. Capital asset accounting. Cash management, investing and cash flow analysis. Accounts Receivable and revenue accounting. Accounts Payable and disbursements. Payroll and pension processing. Pension accounting. Employee benefits accounting. Federal and State tax reporting. Wage assignments and attachments. Performance Measures: There should be no material audit findings generated by TriMet s annual external audit. Monthly financial reports should be prepared in a timely manner. Payroll and pension payments should be processed accurately and in a timely manner. Cash and asset management controls in place and operating effectively. Controls over pension payments implemented and operating effectively. Lease compliance procedures performed in a timely manner, including periodic terminations according to schedule. FA-5
112 BUD1 Personnel Services FINANCE & ADMINISTRATION - FINANCIAL SERVICES 14/15 15/16 16/17 16/17 17/18 Actual Actual Budget Est Budget Position Title Total Total Base Pos Total Total Base Pos Total Director, Financial Services $ 124,739 $ 140,310 $ 140, $ 140,145 $ 115,196 $ 136, $ 136,000 Manager, Accounting 94, ,997 98, ,550 43, , ,000 Manager, Payroll 92, ,151 Sr Financial Systems Business Analyst 114, , , , , , ,169 Analyst, Grant Compliance 81,701 Sr Financial Analyst III-Grants 63,293 71,632 72, ,098 76,157 78, ,805 Administrator, Pension and Retirement 57,565 64,984 73, ,000 74,454 74, ,745 Financial Accountant-Cash/Invest/Pension 66,800 72,795 68, ,751 57,566 69, ,000 Financial Accountant 58,778 62,000 59, ,791 44,985 65, ,000 Revenue Accountant 59,517 65,117 59, ,988 52,098 65, ,000 Revenue Accountant - efare , ,515 49,932 49, ,239 Finance Assistant 42,375 47,141 43, ,805 45,796 46, ,613 Senior Accounts Payable Clerk 70,133 73,882 69, ,067 69,067 69, ,067 Finance Clerk (Accounting) 122, ,586 61, ,721 61,721 61, ,721 Finance Clerk (Accounting) 61, ,721 61,721 61, ,721 Timekeeper 79,208 79,766 76, , ,180 76, ,179 Senior Payroll Clerk 143, ,689 69, ,067 69,067 Senior Payroll Clerk 15,678 69, ,067 69,067 69, ,134 Finance Clerk (Payroll) 121, ,190 61, , ,163 61, ,163 Fringe Benefits 504, , , , ,447 Workers' Compensation 2,000 5,000 Longevity Premium 6,803 6,803 4,680 Unscheduled Overtime 35,988 60,465 48,285 48,285 48,285 Sick & Vacation/Holiday Payout 10,590 6,529 10,253 Capitalized Labor/Fringe (96,722) (28,317) (33,134) Total $ 1,743,751 $ 1,885, $ 2,075,883 $ 1,924, $ 2,205,372 FA-6
113 BUD2 Materials & Services FINANCE & ADMINISTRATION - FINANCIAL SERVICES Actual Actual Budget Estimate Budget % Change % of Expense Category 14/15 15/16 16/17 16/17 17/18 FY17-FY18 M & S Total Legal $ 299 $ 99,420 $ 20,000 $ 5,000 $ 20, % 9.90% Professional & Technical 17,716 14,166 26,042 15,000 26, % 12.87% Banking Charges 50,011 34,189 80,000 40,000 66, % 32.67% Temporary Help 34,091 9,000 10, % Other Services 9,617 13,422 21,774 26,000 26, % 12.87% Office Supplies 7,818 10,451 8,000 15,000 9, % 4.46% Furniture & Equipment <$5,000 2,855 5,631 5,000 3,580 5, % 2.48% Other Materials 5,399 3,390 2,500 4,000 2, % 1.24% Telephone ,000 1,500 1, % 0.50% Dues & Subscriptions 3,213 6,371 7,500 6,000 8, % 4.21% Education & Training 6,700 2,769 26,193 15,000 26, % 12.85% Out-of-Town Travel , , % 0.50% Fines & Penalties - Payroll , , % 0.50% Employee Recognition % Equipment Repair & Mtc - Gen & Adm % Total $ 139,584 $ 191,850 $ 200,009 $ 141,190 $ 202, % % FA-7
114 Department Summary FINANCE & ADMINISTRATION - BUDGET & GRANTS ADMINISTRATION Actual Budget Estimate Budget % Change % of 14/15 15/16 16/17 16/17 17/18 FY17-FY18 Dept. Total Personnel Services $ 401,398 $ 664,590 $ 723,737 $ 737,562 $ 748, % 81.24% Materials & Services 3,194,065 83, ,068 41, , % 18.76% Total $ 3,595,463 $ 748,306 $ 894,805 $ 778,962 $ 921, % % Responsibility: The Budget & Grants Administration Department is responsible for major functions: Agency financial planning, forecasting and budgeting, performance reporting and analysis, fare revenue analysis and grants administration. Activities: Financial planning, forecasting and analysis. Budget preparation. Federal, state, local grant and financial reporting. Grant applications/compliance and grants management. Passenger revenue analysis and forecasting. Capital Improvement Program preparation. Monthly Performance Report and Dashboard. Monthly National Transit Database (NTD) reporting. Annual National Transit Database (NTD) reporting and submission. Performance Measures: Financial forecast document and budget manual prepared by mid- December each year to begin the budget process. Includes revenue and ridership forecasts based on best available information. Communication with senior management regarding financial forecast and budgetary implications throughout the year. Budget document completed annually on schedule to meet Oregon budget law requirements. Accurate and topical analysis of monthly performance statistics delivered monthly to the Board. Initiate grant development process timely for formula grants. Seek grant opportunities weekly and forward notices of funding opportunities to appropriate staff. Follow-up and assist staff with grant production if needed. Respond to such information/analysis requests from colleagues within 24 hours with an estimate of when the analysis can be completed. New Starts Financial Forecast and Operating and Maintenance reports completed as required by deadlines. FA-8
115 BUD1 Personnel Services FINANCE & ADMINISTRATION - BUDGET & GRANTS ADMINISTRATION 14/15 15/16 16/17 16/17 17/18 Actual Actual Budget Est Budget Position Title Total Total Base Pos Total Total Base Pos Total Director, Budget & Grants $ 105,154 $ 151,846 $ 148, $ 148,302 $ 153,365 $ 154, $ 154,378 Analyst, Sr Financial IV - IT Specialist 83,441 88,082 85, ,527 87,015 87, ,312 Analyst, Sr Financial III - Budget & Forecasting 80,301 86,613 84, ,235 87,948 89, ,650 Analyst, Sr Financial III - Budget & Forecasting 79,449 82,180 85, ,862 81,413 87, ,172 Administrator, Grants 56,054 76, ,000 77,759 78, ,111 Analyst, Financial 41,280 56, ,823 58,225 58, ,505 Fringe Benefits 109, , , , ,560 Sick & Vacation/Holiday Payout 5,181 4,030 4,593 Capitalized Labor/Fringe (56,459) (8,832) Total $ 401,398 $ 664, $ 723,737 $ 737, $ 748,281 FA-9
116 BUD2 Materials & Services FINANCE & ADMINISTRATION - BUDGET & GRANTS ADMINISTRATION Actual Actual Budget Estimate Budget % Change % of Expense Category 14/15 15/16 16/17 16/17 17/18 FY17-FY18 M & S Total Professional & Technical $ 8,258 $ 50,000 $ 50, % 29.23% Economic Forecasts 19,226 $ 22,025 27,000 $ 26,000 27, % 15.78% Ridership Counts & Surveys 11,878 46,655 50, , % 29.23% Other Services 21,340 10,563 27,000 2,500 27, % 15.72% Office Supplies 204 1, , % 0.58% Other Materials 311 1,149 1,028 1,000 1, % 0.58% Telephone , , % 0.61% Dues & Subscriptions 260 1,609 4,000 2,600 3, % 2.03% Local Travel & Meetings % Education & Training 1,943 1,303 10,000 8,000 10, % 6.24% Ride Connection Program 1,021, % Contracted Services-State STF 649, % Accessibility Services ,460, % Total $ 3,194,065 $ 83,716 $ 171,068 $ 41,400 $ 172, % % FA-10
117 Department Summary FINANCE & ADMINISTRATION - INSURANCE PROGRAMS Actual Budget Estimate Budget % Change % of 14/15 15/16 16/17 16/17 17/18 FY17-FY18 Dept. Total Personnel Services $ 499,745 $ 517,629 $ 505,849 $ 513,739 $ 588, % 16.12% Materials & Services 34,428 1,462,291 3,163,837 3,001,650 3,063, % 83.88% Total $ 534,173 $ 1,979,920 $ 3,669,686 $ 3,515,389 $ 3,652, % % Responsibility: The Insurance Programs Department is responsible for managing the following: Activities: Workers Compensation Program Light Duty Program Liability Claims - Claim management. - Claim investigation. - Claim determination. - Claim subrogation. - Claim reporting. - Litigation management. Insurance Programs - Insurance broker relationship. - Agency property and liability policies. - Evaluation of contractual risk. Performance Measures: Workers Compensation Program Immediately address all situations of safety concern. Ensure the prudent allocation of agency resources in a manner that optimally addresses risks and exposures. Light Duty Program Provide work for as many employees as possible. Meet all reporting requirements to qualify for reimbursement from the State of Oregon for wage and job site modifications. Liability Claims The number of new liability claims, each month on average, should be equal to or less than the number of liability claims closed each month. Ensure the prudent allocation of agency resources in a manner that optimally addresses risk and exposure. Insurance Programs Manage agency s insurance broker relationship. Assist with marketing and timely renewal of agency property and liability policies. Support staff and agency project managers with evaluation and management of contractual risk. FA-11
118 BUD1 Personnel Services FINANCE & ADMINISTRATION - INSURANCE PROGRAMS 14/15 15/16 16/17 16/17 17/18 Actual Actual Budget Est Budget Position Title Total Total Base Pos Total Total Base Pos Total Director, Insurance Programs $ 27,730 $ 110, $ 110,000 $ 112,295 $ 112, $ 112,755 Mgr, Workers' Comp & Liability Claims $ 92, ,144 Claims Adjuster 155, ,391 68, , ,284 70, ,005 Coordinator, Claims 69,256 73,584 68, ,437 71,252 72, ,215 Claims Assistant 3,583 49, ,894 Assistant, Administrative 40,640 43,473 41, ,954 42,907 43, ,098 Fringe Benefits 141, , , , ,369 Sick & Vacation/Holiday Payout 4,361 4,593 Workers' Compensation 224 1,000 Total $ 499,745 $ 517, $ 505,849 $ 513, $ 588,929 FA-12
119 BUD2 Materials & Services FINANCE & ADMINISTRATION - INSURANCE PROGRAMS Actual Actual Budget Estimate Budget % Change % of Expense Category 14/15 15/16 16/17 16/17 17/18 FY17-FY18 M & S Total Claims Services $ 2,158 $ 3,763 $ 2,500 $ 3,000 $ 2, % 0.08% Temporary Help 1,347 1,500 13, % 0.00% Other Services 26,489 36,672 7,876 38,000 7, % 0.26% Office Supplies 4,205 10,260 5,000 4,900 5, % 0.16% Other Materials % 0.01% Telephone , , % 0.05% Property Insurance 656, , , , % 21.25% Insurance Broker Costs 108, % 0.00% Railroad Protect Insur-Steel Bridge 168, , , , % 6.22% Railroad Liability Insurance 317,753 1,800,000 1,800,000 1,800, % 58.76% Cyber Security Insurance 27, % Excess Liability Insurance 266, , , , % 12.21% Dues & Subscriptions , % 0.01% Education & Training ,200 1,250 2, % 0.09% Total $ 34,428 $ 1,462,291 $ 3,163,837 $ 3,001,650 $ 3,063, % % FA-13
120 Department Summary FINANCE & ADMINISTRATION - PROCUREMENT & CONTRACTS Actual Budget Estimate Budget % Change % of 14/15 15/16 16/17 16/17 17/18 FY17-FY18 Dept. Total Personnel Services $ 1,093,829 $ 1,175,950 $ 1,275,259 $ 1,388,432 $ 1,421, % 84.13% Materials & Services 199, , , , , % 15.87% Total $ 1,293,719 $ 1,325,156 $ 1,434,644 $ 1,547,817 $ 1,689, % % Responsibility: The Procurement & Contracts Department is responsible for two major sections. Contracts Activities: Procurement of non-inventory goods and services by various sourcing approaches, including Request for Proposals, Invitations to Bid, Request for Quotes and Cooperative Purchasing Agreements. Draft and negotiate contracts resulting from solicitations. Provide support for project managers on contract administration issues. Performance Measures: Effectively support the agency in the acquisition of all non-inventory goods and services to ensure high quality and best value for TriMet. Draft contracts to comply with all federal, state and local rules and regulations, manage risk and negotiate terms and conditions. Ensure all solicitations are open, fair and competitive. Purchasing Activities: Procurement of District operational inventory (bus/rail parts) and related collateral supplies. Purchase of all fuel products, office supply products, copiers and other agency operating supplies. Management of agency purchasing card program. Disposal of District surplus property. Performance Measures: Effective sourcing of goods and materials to ensure lowest total cost of ownership, utilizing factors such as quality, price, availability, lead-time (impact on inventory value), operating costs and disposal. Implement Material Requirements Planning (MRP) process for rail reliability program to improve parts forecasting. Participate in Stores Continuous Improvement process with a goal of just-in-time arrival of needed repair parts and components. Timely disposal of District s surplus property while obtaining maximum value. FA-14
121 BUD1 Personnel Services FINANCE & ADMINISTRATION - PROCUREMENT & CONTRACTS 14/15 15/16 16/17 16/17 17/18 Actual Actual Budget Est Budget Position Title Total Total Base Pos Total Total Base Pos Total Director, Procurement & Contracts $ 91,556 $ 111, $ 111,112 Manager, Purchasing $ 95,444 $ 98,537 $ 98, $ 98,528 92,132 90, ,000 Senior Buyer 154, ,570 72, , ,329 72, ,887 Buyer 70,237 71,192 70, ,085 70,085 70, ,170 Manager, Contracts 132,751 70,420 93, ,975 73, , ,000 Administrator III, Contracts 135, ,073 70, , ,068 74, ,089 Administrator II, Contracts 172, ,222 60, ,697 61,531 61, ,698 Coordinator, Procurement 67,850 68,563 66, ,144 67,427 67, ,683 Fringe Benefits 346, , , , ,429 Capitalized Labor/Fringe (87,990) (69,056) (1,829) Longevity Premium 15,451 15,451 15,392 Sick & Vacation/Holiday Payout 7,764 7,661 Unscheduled Overtime 6,824 3,406 20,185 Total $ 1,093,829 $ 1,175, $ 1,275,259 $ 1,388, $ 1,421,121 FA-15
122 BUD2 Materials & Services FINANCE & ADMINISTRATION - PROCUREMENT & CONTRACTS Actual Actual Budget Estimate Budget % Change % of Expense Category 14/15 15/16 16/17 16/17 17/18 FY17-FY18 M & S Total Temporary Help $ 3, % Photocopier Maintenance 44,856 $ 20,809 $ 25,000 $ 15,000 $ 20, % 7.46% Other Services 4,142 28,446 15,000 24,000 13, % 4.85% Procurement Advertising 23,000 7, , % 48.51% Office Supplies 115,954 94,194 85,000 94,000 85, % 31.72% Other Materials 86 1,219 1,037 2,500 2, % 0.93% Telephone , % 0.27% Dues & Subscriptions 27,470 1,357 1,587 5,000 1, % 0.59% Local Travel & Meetings % 0.19% Education & Training 2,048 2,324 7,551 5,000 14, % 5.48% Out-of-Town Travel 242 4, % 0.00% Total $ 199,890 $ 149,206 $ 159,385 $ 159,385 $ 267, % % FA-16
123 Department Summary FINANCE & ADMINISTRATION - FARE REVENUE Actual Budget Estimate Budget % Change % of 14/15 15/16 16/17 16/17 17/18 FY17-FY18 Dept. Total Personnel Services $ 3,481,892 $ 4,933,732 $ 5,175,021 $ 5,282,328 $ 5,551, % 51.20% Materials & Services 2,210,916 2,268,533 3,878,341 2,827,277 5,290, % 48.80% Total $ 5,692,808 $ 7,202,265 $ 9,053,362 $ 8,109,605 $ 10,842, % % Responsibility: The Fare Revenue Department consists of fare revenue collection, processing, cash controls, sales and distribution of TriMet fares. Fare Revenue also manages the maintenance of Ticket Vending Machines (TVM), platform communications and bus radio electronics. Fare Revenue is leading the agency towards an electronic fare program. It is also responsible for the day-to-day management and delivery of the following major functions: Activities: Collection and restocking of cash and coins from light rail TVMs. Sort, count and package currency and coin for depositing TVM and farebox revenues. Create and maintain revenue processing controls such as reconciliations and audits. Operate TriMet s Ticket Office (transit store) selling fares and merchandise. Administer the Honored Citizen ID and GED ID programs. Manage 130 retail sales outlets, including contracts and fare distribution. Operate the following consumer fare sales programs: Mobile Ticketing, Pass By Mail, Legacy, Field Trips, Online Sales, including Bike Locker rentals. Manage artwork, specs, the ordering of all fare revenue ticket/pass stock. Manage design and implementation of electronic fare collection system. Oversee TriMet s payment card processing. Maintain TriMet s TVMs, including ticket stock replacement, preventative maintenance, warranty and critical component inventories. Activities - continued: Maintain TriMet s communication infrastructure on rail platforms and buses, such as CCTV, flat panels, PLCs, fiber and radio contracts. Performance Measures: Cash control variances less than 1% of expected revenue (TVM, Farebox, Money Room and TTO). Sales Program processing costs less than 7.5% of revenue. Maintain maximum 5-minute in-line wait time at the TriMet Ticket Office during peak times. Respond to 99% of sales orders within one (1) business day. Achieve 95% Ticket Vending Machine system reliability. Respond to 99% of Mobile Ticketing helpdesk inquiries within two (2) business days. Respond to 99% communication outages within one (1) business day. FA-17
124 BUD1 Personnel Services FINANCE & ADMINISTRATION - FARE REVENUE 14/15 15/16 16/17 16/17 17/18 Actual Actual Budget Est Budget Position Title Total Total Base Pos Total Total Base Pos Total Administration: Director, Revenue Operations $ 100,756 $ 114,212 $ 106, $ 106,810 $ 111,236 $ 112, $ 112,121 Manager, Fare Revenue 83,232 91,114 88, ,516 93,397 95, ,333 Manager, Fare Revenue Systems 90, ,798 Analyst, Fare Systems 80, ,058 82, , ,395 83, ,508 Cash Control Accountant 52,845 56,629 54, ,611 56,664 57, ,475 Fringe Benefits 152, , ,582 Revenue Processing: Supervisor, Money Room 88,616 85,035 76, ,344 91,344 76, ,343 Money Room Clerk 351, ,124 73, , ,701 73, ,702 Fringe Benefits 192, , ,388 Longevity Premium 3,802 3,802 5,018 Fare Revenue-TTO: Supervisor, TriMet Ticket Office 77,666 79,218 72, ,516 72,516 72, ,516 Assist Supervisor, TriMet Ticket Office 67,648 70,690 67, ,229 67,229 67, ,229 Specialist, Fare Revenue 490, ,634 61, , ,232 61, ,826 Specialist, Fare Revenue 61, ,404 Fringe Benefits 311, , ,757 Workers' Compensation 4,000 Longevity Premium 10,214 10,214 11,041 Fare Maintenance: Manager, Field Equipment Maintenance 83,564 93,210 89, ,149 58,418 86, ,000 Supervisor, Engineering Training 63,768 83, ,000 84,330 84, ,596 Assistant Supervisor, Field Technician 176, ,653 79, ,032 79,032 79, ,032 Field Technician 875,369 1,052,000 68, ,031,040 1,031,040 68, ,031,047 Fringe Benefits 573, , ,471 Workers' Compensation 51, ,000 Longevity Premium 42,386 42,386 28,045 Night & Shift Differential 13,142 13,142 13,142 Unscheduled Overtime 92,460 66,124 Tool Allowance 18,696 18,696 18,696 Sick & Vacation/Holiday Payout 15,038 14,802 FA-18
125 BUD1 Personnel Services FINANCE & ADMINISTRATION - FARE REVENUE 14/15 15/16 16/17 16/17 17/18 Actual Actual Budget Est Budget Position Title Total Total Base Pos Total Total Base Pos Total Communications Maintenance: Supervisor, MOW Communications $ 83,757 $ 80, $ 80,751 $ 82,719 $ 83, $ 83,112 Supervisor, Electronic Maint & Repair 56,667 85, ,000 Assistant Supervisor, Field Technician 34,721 79, ,032 79,032 79, ,032 Field Technician 415,207 68, , ,416 68, ,892 Field Technician 135,000 68, , ,472 Fringe Benefits $ 1,043,557 1,455, , , ,376 Workers' Compensation 41,363 1,000 Longevity Premium 9,500 9,500 36,764 Night & Shift Differential 6,982 6,982 6,982 Unscheduled Overtime 90, , , ,413 Tool Allowance 9,898 9,898 9,898 Unemployment 1,506 1,506 1,506 Capitalized Labor/Fringe (182,964) (241,801) (131,361) (106,923) Total $ 3,481,892 $ 4,933, $ 5,175,021 $ 5,282, $ 5,551,847 FA-19
126 BUD2 Materials & Services FINANCE & ADMINISTRATION - FARE REVENUE Actual Actual Budget Estimate Budget % Change % of Expense Category 14/15 15/16 16/17 16/17 17/18 FY17-FY18 M & S Total Administration: Legal $ 6,341 $ % Auditing 16,007 41,177 $ 85,000 $ 65,000 $ 85, % 1.62% Temporary Help 9,043 5, % Other Services 25, , % 0.13% Payment Card Processing Fees 151,500 75, , % 2.89% Retail Network Commission 227,296 1,191, % 22.51% efare Equipment 1, , % 0.02% Call Center Operations 252,500 74, % 1.41% Telephone 11,428 23,578 3,847 6,000 2, % 0.05% Local Travel & Meetings % Education & Training 2,116 2,110 2, % 0.04% Out-of-Town Travel % Employee Recognition 305 Subtotal Administration: $ 42,819 $ 72,117 $ 748,519 $ 149,615 $ 1,517,498 Revenue Processing: Professional & Technical 500 5, % Banking Charges 930, , , , , % 18.43% Money Transport 21,595 21,703 22,603 25,000 24, % 0.46% Ticket Vending & Servicing 121, , , , , % 2.81% Laundry 1,035 1,119 1,045 1,200 1, % 0.02% Other Services 10,514 25, , % 0.04% Office Supplies 3,356 6,000 3, % 0.06% Furniture & Equipment <$5,000 2,186 3,548 2,000 2,500 2, % 0.04% Other Materials 49,592 65,623 15,318 20,000 20, % 0.38% Telephone 3,847 9,000 4, % 0.08% Subtotal Revenue Processing: $ 1,137,132 $ 1,187,988 $ 1,164,167 $ 1,159,201 $ 1,180,390 FA-20
127 BUD2 Materials & Services FINANCE & ADMINISTRATION - FARE REVENUE Actual Actual Budget Estimate Budget % Change % of Expense Category 14/15 15/16 16/17 16/17 17/18 FY17-FY18 M & S Total Fare Revenue-TTO: Uniforms $ 2,045 $ 2,626 $ 2,065 $ 2,425 $ 2, % 0.05% Equipment Maintenance 400 2,101 1,600 2, % 0.04% TTO Office Maintenance 58,456 57,170 59,041 59,000 63, % 1.20% Other Services 49,350 68,129 8,800 70,000 10, % 0.19% Tickets & Passes 408, , , , , % 8.40% Office Supplies 16,154 16,750 11,120 18,000 10, % 0.20% Freight % Other Materials 28 16,833 19,500 19, % 0.37% Unreconciled Mastercard Expense 1, % Postage 5,459 6,323 6,060 10,200 10, % 0.19% Telephone 3,847 9,000 4, % 0.08% Dues & Subscriptions 1,750 3,225 1,768 3,600 2, % 0.04% Education & Training 661 1,209 12,738 7,000 5, % 0.10% Fare Media 1,044, ,000 1,263, % 23.88% Subtotal Fare Revenue: $ 542,706 $ 556,382 $ 1,577,318 $ 1,101,986 $ 1,837,766 Fare Maintenance: Contracted Maintenance - Fare Equipment 157, , , % Small Hand Tools 1,077 3,037 2,041 2,000 2, % 0.04% Other Materials 10,257 5,691 16,833 1,500 9, % 0.18% Safety Supplies 3,192 3,523 4,543 3,300 3, % 0.06% Obsolete Inventory 68,234 17,005 60, % Maintenance Materials - Fare Equipment 241, , , , , % 4.77% Education & Training 8,103 9,000 8, % 0.15% CDL Renewals % 0.00% Maintenance - efare Equipment 180, % Rentals 4,807 7,213 16,000 7, % 0.13% Subtotal Fare Maintenance: $ 481,130 $ 386,784 $ 288,904 $ 322,670 $ 662,195 FA-21
128 BUD2 Materials & Services FINANCE & ADMINISTRATION - FARE REVENUE Actual Actual Budget Estimate Budget % Change % of Expense Category 14/15 15/16 16/17 16/17 17/18 FY17-FY18 M & S Total Communications Maintenance: Contracted Maintenance - Communications $ 11,151 $ 32,406 $ 30,965 $ 29, % 0.56% Small Hand Tools % 0.02% Safety Supplies 2,080 1,000 1, % 0.02% Maintenance Materials - Communications $ 7,129 54,111 58,576 58,580 59, % 1.12% Education & Training 2,177 1,200 1, % 0.02% CDL Renewals % 0.00% Rentals 3,136 1,000 1, % 0.02% Subtotal Communications Maintenance: $ 7,129 $ 65,262 $ 99,433 $ 93,805 $ 92,825 Total $ 2,210,916 $ 2,268,533 $ 3,878,341 $ 2,827,277 $ 5,290, % % FA-22
129 BUDGET PROGRESSION SCHEDULE - FINANCE & ADMINISTRATION Actual Actual Adopted Proposed Approved Adopted 14/15 15/16 16/17 17/18 17/18 17/18 Administration $ 365,131 $ 323,375 $ 437,421 Personnel Services $ 438,703 $ 438,703 $ 472,226 1,142,160 79, ,651 Materials & Services 269, , ,275 $ 1,507,291 $ 402,427 $ 711,072 Department Total $ 707,978 $ 707,978 $ 741,501 Financial Services $ 1,743,751 $ 1,885,328 $ 2,075,883 Personnel Services $ 2,193,294 $ 2,193,294 $ 2,205, , , ,009 Materials & Services 202, , ,010 $ 1,883,335 $ 2,077,178 $ 2,275,892 Department Total $ 2,395,304 $ 2,395,304 $ 2,407,382 Budget & Grants Administration $ 401,398 $ 664,590 $ 723,737 Personnel Services $ 748,492 $ 748,492 $ 748,281 3,194,065 83, ,068 Materials & Services 172, , ,780 $ 3,595,463 $ 748,306 $ 894,805 Department Total $ 921,272 $ 921,272 $ 921,061 Insurance Programs $ 499,745 $ 517,629 $ 505,849 Personnel Services $ 589,140 $ 589,140 $ 588,929 34,428 1,462,291 3,163,837 Materials & Services 3,063,458 3,063,458 3,063,458 $ 534,173 $ 1,979,920 $ 3,669,686 Department Total $ 3,652,598 $ 3,652,598 $ 3,652,387 Procurement & Contracts $ 1,093,829 $ 1,175,950 $ 1,275,259 Personnel Services $ 1,424,569 $ 1,424,569 $ 1,421, , , ,385 Materials & Services 267, , ,980 $ 1,293,719 $ 1,325,156 $ 1,434,644 Department Total $ 1,692,549 $ 1,692,549 $ 1,689,101 Fare Revenue $ 3,481,892 $ 4,933,732 $ 5,175,021 Personnel Services $ 5,554,016 $ 5,554,016 $ 5,551,847 2,210,916 2,268,533 3,878,341 Materials & Services 5,090,674 5,090,674 5,290,674 $ 5,692,808 $ 7,202,265 $ 9,053,362 Department Total $ 10,644,690 $ 10,644,690 $ 10,842,521 Division Total $ 7,585,746 $ 9,500,604 $ 10,193,170 Personnel Services $ 10,948,214 $ 10,948,214 $ 10,987,776 6,921,043 4,234,648 7,846,291 Materials & Services 9,066,177 9,066,177 9,266,177 $ 14,506,789 $ 13,735,252 $ 18,039,461 Total Finance & Administration $ 20,014,391 $ 20,014,391 $ 20,253,953 FA-23
130 [This Page Left Intentionally Blank] FA-24
131 Division Summary LABOR RELATIONS & HUMAN RESOURCES Actual Budget Estimate Budget % Change % of 14/15 15/16 16/17 16/17 17/18 FY17 - FY18 Division Total Personnel Services $ 2,145,562 $ 2,432,909 $ 2,587,449 $ 2,714,772 $ 2,871, % 63.51% Materials & Services 1,054, ,522 1,505,716 1,340,244 1,649, % 36.49% Total $ 3,199,734 $ 3,357,431 $ 4,093,165 $ 4,055,016 $ 4,521, % % Page Labor Relations & Human Resources Division Division Summary HR-1 Administration HR-2 Compensation, Benefits & HRIS HR-5 Talent Management HR-8 Labor Relations HR-11 HR-1
132 Department Summary LABOR RELATIONS & HUMAN RESOURCES - ADMINISTRATION Actual Budget Estimate Budget % Change % of 14/15 15/16 16/17 16/17 17/18 FY17 - FY18 Dept. Total Personnel Services $ 1,096,593 $ 1,287,643 $ 1,457,231 $ 1,456,769 $ 516, % 68.13% Materials & Services 598, , , , , % 31.87% Total $ 1,695,241 $ 1,882,951 $ 2,348,972 $ 2,264,250 $ 758, % % Responsibilities: The Administration Department of the LR/HR division is responsible for aligning the Division on strategy, objectives and project ownership to establish TriMet as a place where diverse and talented people want to come, stay, and thrive. The department also is responsible for developing the LR/HR staff s professional competencies, ensuring alignment with TriMet s values, ensuring Division employees work safely, and providing administrative support to the Division as a whole. Performance Measures: The LR/HR division is progressing in its strategic plan, which is aligned with that of the District. Budget targets are met for the division. The division has capable talent. Activities: Develop and oversee the LR/HR strategic planning efforts and monitoring implementation progress. Represent the LR/HR perspective on TriMet s executive team. Coordinate budget preparation and monitoring budget performance for the division. Provide administrative support and records management for the division. Provide support for manager and employee self-service use of the HRIS system. Respond to reference check and employee information requests, such as unemployment compensation and BOLI inquiries. HR-2
133 BUD1 Personnel Services LABOR RELATIONS & HUMAN RESOURCES - ADMINISTRATION 14/15 15/16 16/17 16/17 17/18 Actual Actual Budget Est Budget Position Title Total Total Base Pos Total Total Base Pos Total Executive Director, Labor Relations & Human Res. $ 209,807 $ 225,339 $ 203, $ 203,000 $ 208,947 $ 210, $ 210,136 Human Resources Business Partner 345, , , , ,399 Supervisor, Recruiting 76, ,098 64,065 Recruiter 69,659 70,712 71, ,334 72,358 Operations Recruiter 57,627 63,957 54, ,945 58,258 Candidate Sourcer 54,154 69,430 56,401 Administrator, HR Services 64,534 68,897 66, ,480 67,712 67, ,958 Specialist, Human Resources 38,242 45,017 46, ,488 47,788 Receptionist 25,692 33,490 31, ,616 32,327 32, ,469 Administrative Services Clerk 23,038 19,151 28, ,102 14,336 28, ,383 Fringe Benefits 357, , , , ,760 Non-Union Baseline Adjustment 69,428 79,581 Sick & Vacation/Holiday Payout 30,023 24,046 2,679 Capitalized Labor/Fringe (149,024) (110,182) (432) Total $ 1,096,593 $ 1,287, $ 1,457,231 $ 1,456, $ 516,966 HR-3
134 BUD2 Materials & Services LABOR RELATIONS & HUMAN RESOURCES - ADMINISTRATION Actual Actual Budget Estimate Budget % Change % of Expense Category 14/15 15/16 16/17 16/17 17/18 FY17-FY18 M & S Total Legal $ 133,725 $ 145,298 $ 332,000 $ 312,443 $ 149, % 61.96% Professional & Technical 100, , , , % 0.00% Recruitment Expense 11,989 23,100 25,709 21, % 0.00% Pre-Employment Screening Services % 0.00% Temporary Help 2, % Other Services 41,170 39, , ,000 2, % 0.83% Office Supplies 4,752 4,386 2,953 3,842 2, % 1.23% Other Materials 1,843 3,276 3,030 2,500 3, % 1.27% Unreconciled Mastercard Expense 13, % Postage 2,342 1, % 0.09% Telephone 3,055 4,233 2,597 3,116 1, % 0.71% Dues & Subscriptions 1,097 1,112 1,010 1, % 0.38% Local Travel & Meetings % 0.21% Education & Training 4,875 15,602 11,150 6,000 3, % 1.32% Out-of-Town Travel 7,335 3,958 7,245 4,000 4, % 1.76% Union Contractual Services 285, , , ,000 73, % 30.19% Employee Recognition % 0.05% Total $ 598,648 $ 595,308 $ 891,741 $ 807,481 $ 241, % % HR-4
135 Department Summary LABOR RELATIONS & HUMAN RESOURCES - COMPENSATION, BENEFITS & HRIS Actual Budget Estimate Budget % Change % of 14/15 15/16 16/17 16/17 17/18 FY17 - FY18 Dept. Total Personnel Services $ 660,183 $ 739,835 $ 729,617 $ 764,118 $ 777, % 57.00% Materials & Services 432, , , , , % 43.00% Total $ 1,092,202 $ 1,058,087 $ 1,321,757 $ 1,274,267 $ 1,363, % % Responsibility: The Compensation, Benefits & HRIS Department of the LR/HR Division is responsible for managing compensation to the market, ensuring a competitive benefits package, enhancing HR technology solutions, and designing flexibility in the HR policies and procedures. Activities: Pricing of jobs and monitoring compensation trends in the marketplace. Conduct job evaluations and keep job descriptions current. Administer the salary administration program. Administer the annual merit program. Enhance the HR technology platform to increase manager and employee productivity and access to information. Administer the healthcare program. Manage outside healthcare vendors. Administer the annual benefits open enrollment process. Conduct benefits eligibility audits. Negotiate healthcare benefits contracts with carriers. Performance Measures: TriMet s salary and benefits costs meet budget. Salary administration controls and procedures are implemented. Management has tools and information sufficient to assess and manage total compensation to market competitiveness. The HRIS system is deployed effectively, including manager and employee self-service. HR transactions are handled efficiently. Healthcare vendors meet their commitments to TriMet and its employees. HR-5
136 BUD1 Personnel Services LABOR RELATIONS & HUMAN RESOURCES - COMPENSATION, BENEFITS & HRIS 14/15 15/16 16/17 16/17 17/18 Actual Actual Budget Est Budget Position Title Total Total Base Pos Total Total Base Pos Total Manager, Compensation $ 107,840 $ 114,119 $ 112, $ 112,535 $ 115,907 $ 116, $ 116,581 Manager, Benefits & HRIS 95,000 99, , , , , ,322 Senior Analyst, HRIS 80,376 84,812 84, , , , ,000 Analyst, Compensation 59,688 58,554 68, ,000 69,936 70, ,323 Administrator, Benefits 60,581 64,000 64, ,203 66,796 67, ,812 Specialist, Benefits 43,150 47,688 57, ,076 47,560 59, ,857 Specialist, Benefits 45,893 48,425 45, ,594 46,634 46, ,842 Fringe Benefits 199, , , , ,081 Overtime ,250 Sick & Vacation/Holiday Payout 5,976 5,205 Capitalized Labor/Fringe (32,465) (5,079) Total $ 660,183 $ 739, $ 729,617 $ 764, $ 777,023 HR-6
137 BUD2 Materials & Services LABOR RELATIONS & HUMAN RESOURCES - COMPENSATION, BENEFITS & HRIS Actual Actual Budget Estimate Budget % Change % of Expense Category 14/15 15/16 16/17 16/17 17/18 FY17-FY18 M & S Total Professional & Technical $ 50,048 $ 5,337 $ 12,000 $ 6,000 $ 11, % 2.02% DOTS Renewal Medical Services 87, % Disability Medical Review Services 260 1,197 15,186 6,500 15, % 2.62% Health Benefit Consultant 36,562 71, , , , % 23.41% BHS FSA Third Party Administrator 32,827 32,195 23,861 37,144 33, % 5.76% FMLA/OFLA Third Party Administrator 126, , , , , % 26.78% Temporary Help 238 1,774 5,431 1,000 2, % 0.46% Compensation Survey Services 19,508 18,056 25,050 22,000 25, % 4.32% Other Services 36, ,980 20,580 10, % 1.74% Office Supplies 1, % 0.14% Other Materials 13,201 1,971 36,465 62,500 36, % 6.28% Unreconciled Mastercard Expense % Postage 6,694 23,541 33,151 18,760 35, % 6.14% Telephone ,037 1,000 1, % 0.18% Dues & Subscriptions % 0.11% Local Travel & Meetings % 0.05% Education & Training 1,700 3,658 11,490 10,500 11, % 1.98% Out-of-Town Travel 818 2,500 2,000 2, % 0.43% Non-Union EAP 12,365 12,900 92,048 55,000 92, % 15.70% Employee Awards 6,624 11,868 10,292 10,300 11, % 1.88% Total $ 432,019 $ 318,252 $ 592,140 $ 510,149 $ 586, % % HR-7
138 Department Summary LABOR RELATIONS & HUMAN RESOURCES - TALENT MANAGEMENT Actual Budget Estimate Budget % Change % of 14/15 15/16 16/17 16/17 17/18 FY17 - FY18 Dept. Total Personnel Services $ 779, % 49.34% Materials & Services 799, % 50.66% Total $ 1,578, % % Responsibilities: The Talent Management Department is responsible for talent acquisition, succession planning, training and development, performance management, employee engagement and affirmative action. Activities: Investing wisely in people to ensure TriMet attracts and retains a talented and diverse workforce through its recruitment, diversity and affirmative action efforts. Administer the non-union performance management program. Conduct periodic employees surveys to gauge engagement and coach managers on efforts to improve engagement. Develop and oversee training and development program activities and manage the tuition reimbursement program. Coordinate the development of succession plans. Performance Measures: Offer/interview, acceptance/offer and time-to-fill targets are met. Manage turnover to acceptable levels. Employment practices risk is mitigated. Affirmative action goals and sufficient diversity in the applicant pool and application process is achieved. Employees are trained and developed for succession opportunities. Employee engagement trends are favorable. HR-8
139 BUD1 Personnel Services LABOR RELATIONS & HUMAN RESOURCES - TALENT MANAGEMENT 14/15 15/16 16/17 16/17 17/18 Actual Actual Budget Est Budget Position Title Total Total Base Pos Total Total Base Pos Total Director, Talent Management $ 127, $ 127,425 Human Resources Business Partner 108, ,651 Training & Development Program Manager 84, ,600 Recruiter 72, ,563 Candidate Sourcer 65, ,643 Operations Recruiter 60, ,001 Specialist, Human Resources 48, ,048 Fringe Benefits 206,789 Sick & Vacation/Holiday Payout 5,358 Total 7.00 $ 779,078 HR-9
140 BUD2 Materials & Services LABOR RELATIONS & HUMAN RESOURCES - TALENT MANAGEMENT Actual Actual Budget Estimate Budget % Change % of Expense Category 14/15 15/16 16/17 16/17 17/18 FY17-FY18 M & S Total Professional & Technical $ 231, % Recruitment Expense 214, % Pre-Employment Screening Services % Other Services 75, % Telephone % Dues & Subscriptions % Education & Training 7, % Out-of-Town Travel 3, % Agency Training 161, % Tuition Reimbursement 104, % Total $ 799, % HR-10
141 Department Summary LABOR RELATIONS & HUMAN RESOURCES - LABOR RELATIONS Actual Budget Estimate Budget % Change % of 14/15 15/16 16/17 16/17 17/18 FY17 - FY18 Dept. Total Personnel Services $ 388,786 $ 405,431 $ 400,601 $ 493,885 $ 798, % 97.31% Materials & Services 23,505 10,962 21,835 22,614 22, % 2.69% Total $ 412,291 $ 416,393 $ 422,436 $ 516,499 $ 820, % % Responsibility: The Labor Relations Department of the LR/HR division is responsible for administering the collective bargaining agreement fairly, bargaining labor agreements, managing grievance processing, managing HR policies and counseling and training operating managers on the effective handling of labor and employee relations issues. Activities: Coach managers in handling labor matters with the represented workforce. Facilitate labor management meetings between labor and operating managers. Manage the collective bargaining process, including successor contract and mid-term bargaining. Process hearing and arbitrating grievances. Process and represent the District in advancing or defending unfair labor practice charges. Train managers on changes in the law and the labor contract that affect management of the workforce. Monitor and update HR Policy Manual quarterly, as appropriate. Performance Measures: Labor contract provisions in support of TriMet s strategic financial plan are bargained. Effective and respectful labor and employee relations with the ATU leadership are pursued. Discipline imposed upon represented employees meet the seven test of just cause. ATU is notified timely of employment relations matters and changes to TriMet s HR policies. Managers with represented employees are trained to consistently apply the labor agreement and District policy and to comply with applicable labor and employment laws. TriMet achieves regulatory and statutory compliance on labor and employment matters. HR-11
142 BUD1 Personnel Services LABOR RELATIONS & HUMAN RESOURCES - LABOR RELATIONS 14/15 15/16 16/17 16/17 17/18 Actual Actual Budget Est Budget Position Title Total Total Base Pos Total Total Base Pos Total Director, Labor & Employee Relations $ 116,214 $ 113,420 $ 136, $ 136,839 Senior Manager, Labor Relations $ 103, $ 103,142 51,571 Manager, Labor Relations 91,218 $ 96,849 Human Resources Business Partner 110, ,720 Senior Representative, Labor Relations 63,286 81, ,120 83,937 84, ,500 Senior Representative, Labor Relations 74,870 78, ,663 82,185 84, ,516 Analyst, Labor 68,816 41,417 72, ,000 Administrative Services Clerk 20,006 28, ,630 9,587 Fringe Benefits 112, , , , ,459 Sick & Vacation/Holiday Payout 3,277 4,593 Total $ 388,786 $ 405, $ 400,601 $ 493, $ 798,627 HR-12
143 BUD2 Materials & Services LABOR RELATIONS & HUMAN RESOURCES - LABOR RELATIONS Actual Actual Budget Estimate Budget % Change % of Expense Category 14/15 15/16 16/17 16/17 17/18 FY17-FY18 M & S Total Other Services $ 20,749 $ 4,915 $ 10,000 $ 7,500 $ 10, % 45.80% Office Supplies ,308 2,150 1, % 8.69% Other Materials % 3.08% Unreconciled Mastercard Expense 3, % Postage % 4.40% Telephone % 4.08% Dues & Subscriptions 341 1, , % 4.69% Local Travel & Meetings % 1.78% Education & Training 110 1,419 3,000 6,000 3, % 13.74% Out-of-Town Travel 1,708 2,922 3,000 1,000 3, % 13.74% Total $ 23,505 $ 10,962 $ 21,835 $ 22,614 $ 22, % % HR-13
144 BUDGET PROGRESSION SCHEDULE - LABOR RELATIONS & HUMAN RESOURCES Actual Actual Adopted Proposed Approved Adopted 14/15 15/16 16/17 17/18 17/18 17/18 Administration $ 1,096,593 $ 1,287,643 $ 1,457,231 Personnel Services $ 498,653 $ 498,653 $ 516, , , ,741 Materials & Services 241, , ,791 $ 1,695,241 $ 1,882,951 $ 2,348,972 Department Total $ 740,444 $ 740,444 $ 758,757 Compensation, Benefits & HRIS $ 660,183 $ 739,835 $ 729,617 Personnel Services $ 777,269 $ 777,269 $ 777, , , ,140 Materials & Services 586, , ,152 $ 1,092,202 $ 1,058,087 $ 1,321,757 Department Total $ 1,363,421 $ 1,363,421 $ 1,363,175 Talent Management Personnel Services $ 779,324 $ 779,324 $ 779,078 Materials & Services 799, , ,762 Department Total $ 1,579,086 $ 1,579,086 $ 1,578,840 Labor Relations $ 388,786 $ 405,431 $ 400,601 Personnel Services $ 797,070 $ 797,070 $ 798,627 23,505 10,962 21,835 Materials & Services 22,054 22,054 22,054 $ 412,291 $ 416,393 $ 422,436 Department Total $ 819,124 $ 819,124 $ 820,681 Division Total $ 2,145,562 $ 2,432,909 $ 2,587,449 Personnel Services $ 2,852,316 $ 2,852,316 $ 2,871,694 1,054, ,522 1,505,716 Materials & Services 1,649,759 1,649,759 1,649,759 $ 3,199,734 $ 3,357,431 $ 4,093,165 Total Labor Relations & Human Resources $ 4,502,075 $ 4,502,075 $ 4,521,453. HR-14
145 Division Summary LEGAL SERVICES Actual Budget Estimate Budget % Change % of 14/15 15/16 16/17 16/17 17/18 FY17- FY18 Division Total Personnel Services $ 1,566,424 $ 1,673,648 $ 1,829,005 $ 1,698,425 $ 1,966, % 87.95% Materials & Services 236, , , , , % 12.05% Total $ 1,803,186 $ 1,864,666 $ 2,098,171 $ 1,895,185 $ 2,236, % % Legal Services Division Division Summary Legal Services Page LS-1 LS-2 LS-1
146 Department Summary LEGAL SERVICES - LEGAL SERVICES Actual Budget Estimate Budget % Change % of 14/15 15/16 16/17 16/17 17/18 FY17- FY18 Dept. Total Personnel Services $ 1,566,424 $ 1,673,648 $ 1,829,005 $ 1,698,425 $ 1,966, % 87.95% Materials & Services 236, , , , , % 12.05% Total $ 1,803,186 $ 1,864,666 $ 2,098,171 $ 1,895,185 $ 2,236, % % Responsibility: The Legal Services Department provides professional, competent, highly responsive and cost-effective legal assistance to the TriMet Board and staff. It works with all TriMet divisions to accomplish TriMet s mission and goals within legal, financial, business and ethical parameters. Activities: Contract and Construction Law. Municipal/Public Law. Employment/Labor Law. Board Governance. Real Estate/Land Use/Environmental. Complex Business Litigation and Tort Defense. Risk Assessment. Performance Measures: Provide highly effective counsel on State and Federal Legislative and policy issues. Ensure highest quality legal support through effective deployment of internal and external legal counsel. Enhance productivity by effectively managing incoming work, balancing workloads and strengthening TriMet s preventative law program to help minimize potential project development and implementation problems. Provide the highest level of customer service by responding quickly and professionally to the requirements of the Legal Department s customers and clients, both inside and outside TriMet. LS-2
147 BUD1 Personnel Services LEGAL SERVICES - LEGAL SERVICES 14/15 15/16 16/17 16/17 17/18 Actual Actual Budget Est Budget Position Title Total Total Base Pos Total Total Base Pos Total Executive Director, Legal Services (General Counsel) $ 179,951 $ 198,866 $ 201, $ 201,000 $ 207,961 $ 209, $ 209,353 Director, Legal Services 151, , , , , , ,137 Director, Real Property 135, , , , , ,000 Senior Deputy General Counsel 295, , , , , , ,600 Deputy General Counsel 121, , ,099 90, ,035 Deputy General Counsel I 109,940 Manager, Records Governance 71,422 77,204 77, ,084 80,249 82, ,000 Specialist, Litigation 70,282 72,463 68, ,494 71,989 73, ,008 Analyst, Records 62,359 58,561 56, ,503 62,098 62, ,499 Paralegal Investigator 59,372 64,354 62, ,858 70,914 72, ,010 Legal Assistant 56,080 60,291 58, ,198 68,677 58, ,594 Paralegal I 52,629 57,536 54, ,059 55,862 56, ,222 Fringe Benefits 382, , , , ,729 Non-Union Baseline Adjustment 47,262 50,884 Sick & Vacation/Holiday Payout 11,339 9,151 10,716 Capitalized Labor/Fringe (45,974) (176,481) (46,791) (76,133) (48,073) Total $ 1,566,424 $ 1,673, $ 1,829,005 $ 1,698, $ 1,966,714 LS-3
148 BUD2 Materials & Services LEGAL SERVICES - LEGAL SERVICES Actual Actual Budget Estimate Budget % Change % of Expense Category 14/15 15/16 16/17 16/17 17/18 FY17-FY18 M & S Total Legal $ 74,937 $ 60,703 $ 45,450 $ 40,000 $ 45, % 17.03% Professional & Technical 60,388 39,547 52,463 10,000 50, % 18.78% Temporary Help 1, , % 0.40% Other Services 24,700 10,494 45,000 20,000 45, % 16.87% Office Supplies 1,346 1,182 1,515 1,500 1, % 0.57% Other Materials 8,458 20,631 3,200 7,866 5, % 1.86% Unreconciled Mastercard Expense % Telephone ,500 1,000 1, % 0.56% Dues & Subscriptions 49,147 36,471 80,000 80,000 80, % 29.98% Local Travel & Meetings , , % 4.12% Education & Training 11,004 11,829 15,788 15,000 14, % 5.26% Out-of-Town Travel 5,721 9,107 12,000 20,000 12, % 4.50% Employee Recognition % 0.07% Total $ 236,762 $ 191,018 $ 269,166 $ 196,760 $ 269, % % LS-4
149 BUDGET PROGRESSION SCHEDULE - LEGAL SERVICES Actual Actual Adopted Proposed Approved Adopted 14/15 15/16 16/17 17/18 17/18 17/18 Legal Services $ 1,566,424 $ 1,673,648 $ 1,829,005 Personnel Services $ 1,958,010 $ 1,958,010 $ 1,966, , , ,166 Materials & Services 269, , ,482 $ 1,803,186 $ 1,864,666 $ 2,098,171 Department Total $ 2,227,492 $ 2,227,492 $ 2,236,196 Division Total $ 1,566,424 $ 1,673,648 $ 1,829,005 Personnel Services $ 1,958,010 $ 1,958,010 $ 1,966, , , ,166 Materials & Services 269, , ,482 $ 1,803,186 $ 1,864,666 $ 2,098,171 Total Legal Services $ 2,227,492 $ 2,227,492 $ 2,236,196 LS-5
150 [This Page Left Intentionally Blank] LS-6
151 Division Summary OPERATIONS-TRANSPORTATION & MAINTENANCE Actual Budget Estimate Budget % Change % of 14/15 15/16 16/17 16/17 17/18 FY17- FY18 Division Total Personnel Services $ 207,740,596 $ 230,535,477 $ 239,609,373 $ 238,371,881 $ 249,867, % 70.49% Materials & Services 101,240,729 93,262,568 97,163,523 99,837, ,606, % 29.51% Total $ 308,981,325 $ 323,798,045 $ 336,772,896 $ 338,209,384 $ 354,473, % % Operations Division Transportation Division Summary Maintenance Division Summary Page OP-2 OP-37 OP-1
152 Sub-Division Summary TRANSPORTATION Actual Budget Estimate Budget % Change % of 14/15 15/16 16/17 16/17 17/18 FY17- FY18 Division Total Personnel Services $ 146,752,841 $ 162,339,225 $ 166,612,760 $ 164,351,120 $ 172,466, % 76.40% Materials & Services 57,287,707 50,112,723 50,312,023 50,837,734 53,276, % 23.60% Total $ 204,040,548 $ 212,451,948 $ 216,924,783 $ 215,188,854 $ 225,743, % % Page Transportation Division Summary OP-2 Administration & Support OP-3 Bus Transportation OP-6 Field Operations OP-12 Service Delivery OP-17 Accessible Transportation Programs-LIFT OP-20 Accessible Transportation Programs-MTP OP-24 Rail Transportation OP-27 Commuter Rail OP-30 Streetcar OP-34 OP-2
153 Department Summary TRANSPORTATION - ADMINISTRATION & SUPPORT Actual Budget Estimate Budget % Change % of 14/15 15/16 16/17 16/17 17/18 FY17- FY18 Dept. Total Personnel Services $ 862,145 $ 1,207,527 $ 2,017,174 $ 1,585,027 $ 2,130, % 85.01% Materials & Services 252, , , , , % 14.99% Total $ 1,114,879 $ 1,956,945 $ 2,306,054 $ 2,259,032 $ 2,505, % % Responsibility: The Transportation Administration Division is responsible for delivering TriMet transportation services in a culture of safety and service excellence, which includes the following functions: Chief Operating Officer Operations planning and development Operations analysis Activities: Chief Operating Officer - Communicate/instill TriMet s mission, strategic direction and business plan throughout the Transportation and Maintenance divisions, focused on safety, on-time performance, support to employees and state of good repair. - Performance improvement programs for the Transportation and Maintenance divisions. Operations Planning and Development - Transportation and Maintenance division annual budgets and multiyear operations and maintenance programs to fulfill TriMet s business plan, including Service Enhancement and Financial Forecast plans. - Transportation and Maintenance division productivity objectives, quality standards and FTA compliance. - Manage/coordinate planning for operations startup of new transit services such as light rail extensions and new bus service or lines. - Operations planning for future fixed-route bus and LIFT operations. Activities - continued: Operations Analysis - Service performance and ridership data collection, analysis and reporting. - Maintenance planning and analysis. - Fixed-route bus, LIFT bus, light rail vehicle, commuter rail fleet management plans and Facilities and Rail Maintenance of Way maintenance plans. Performance Measures: Boarding rides per revenue hour. On-time performance. Operating cost per boarding ride and per vehicle mile. Customer commendations and complaints. Successful operations startup of light rail extensions and new bus services lines. Timely reporting of service performance and ridership information. OP-3
154 BUD1 Personnel Services TRANSPORTATION - ADMINISTRATION & SUPPORT 14/15 15/16 16/17 16/17 17/18 Actual Actual Budget Est Budget Position Title Total Total Base Pos Total Total Base Pos Total Administration: Chief Operating Officer $ 196,080 $ 271,902 $ 219, $ 219,000 $ 225,695 $ 227, $ 227,034 Chief of Staff, Operations Management 186, , , , ,839 Director, Operations Planning & Development 146, , , , , , ,021 Manager, Rail Operations Planning 106, , , , , , ,908 Coordinator, Quality Assurance 79,170 Fringe Benefits 143, , , , ,496 Operations Analysis: Manager, Service Performance & Analysis 91,900 98,862 95, ,916 98,364 99, ,301 Analyst, Business Process 127, , , ,514 Senior Analyst, Operations 60,577 91,560 89, ,088 91,093 91, ,494 Analyst, Operations 168, ,165 66, , ,579 70, ,751 Fringe Benefits 137, , , , ,695 Capitalized Labor/Fringe (267,519) (180,302) (50,521) Non-Union Baseline Adjustment 395, ,086 Limited Term Employment 166,378 FY2018 Personnel Increase Phase-In (49,115) Sick & Vacation/Holiday Payout 9,594 10,557 8,420 Total $ 862,145 $ 1,207, $ 2,017,174 $ 1,585, $ 2,130,308 OP-4
155 BUD2 Materials & Services TRANSPORTATION - ADMINISTRATION & SUPPORT Actual Actual Budget Estimate Budget % Change % of Expense Category 14/15 15/16 16/17 16/17 17/18 FY17-FY18 M & S Total Labor/Employment Process Expense $ 7,183 $ 27,206 $ 40,000 $ 45,000 $ 50, % 13.31% Professional & Technical 93, ,951 25, ,000 23, % 6.26% DOTS Renewal Medical Services 113,769 73, ,000 90, % 23.97% Temporary Help 1,210 31,156 14,000 8, % Building Security Maintenance % Other Services 7, ,071 22,000 88,000 22, % 5.86% Office Supplies 1,849 1,773 2,400 1,200 2, % 0.64% Other Materials 8,450 10,650 2,800 10,000 3, % 0.85% Unreconciled Mastercard Expense 11, % Telephone 3,343 4,710 3,200 5,000 3, % 0.85% Dues & Subscriptions 3,415 1,028 1,800 2,000 2, % 0.53% APTA Dues 79,248 90,486 86, ,000 98, % 26.10% Local Travel & Meetings % 0.06% Education & Training 10,241 14,331 4,800 36,000 40, % 10.65% Out-of-Town Travel 26,739 17,907 9,400 32,000 16, % 4.26% Assault Reward % Employee Recognition 8,460 13,209 17,000 14,000 17, % 4.53% $ 252,734 $ 749,418 $ 288,880 $ 674,005 $ 375, % % OP-5
156 Department Summary TRANSPORTATION - BUS TRANSPORTATION Actual Budget Estimate Budget % Change % of 14/15 15/16 16/17 16/17 17/18 FY17- FY18 Dept. Total Personnel Services $ 104,407,260 $ 113,605,741 $ 115,241,498 $ 113,897,026 $ 120,537, % 97.99% Materials & Services 2,260,535 1,390,969 2,580,192 1,616,920 2,474, % 2.01% Total $ 106,667,795 $ 114,996,710 $ 117,821,690 $ 115,513,946 $ 123,012, % % Responsibility: The Bus Transportation Department is responsible for providing safe, courteous, reliable and efficient public transportation for the region. The Transportation Division Executive Director is budgeted in the Bus Transportation department, while providing executive leadership to all Transportation departments. Activities: Transportation Executive Director - Communicate/instill TriMet s mission, strategic direction, and business plan throughout the Transportation division, focused on safety, on-time performance and support to employees. - Executive action for Transportation division budgets, programs, projects and personnel. - Employee communication and recognition programs. Bus Transportation - Partner with all agency departments in continuous development and implementation of TriMet s culture of safety and service excellence. - Run bus service 84% on-time or better for efficient use of vehicles, operators and better cost per mile. - Comprehensive communication and support to operators. - Enhance the SIP process, to benefit both customers and operators. - Bus operator standard operating procedures. - Regularly produce informational Operators' Notices and Bulletins. Activities - continued: Productivity Improvement - Encourage/implement improvements identified by RSAs and operating condition reports. - Attendance/overtime/extraboard. - On-time performance. - Minimize bus idling and drive to achieve best miles per gallon. - Minimize unscheduled overtime consistent with service requirements. Attendance/Extraboard - Communicate/educate the importance of attendance/absence. - Manage extraboards efficiently. Performance Measures: 84% or better on-time performance. Maintain 99.5% pullout ratio. Sustain 90.7% bus operator attendance. Less than 1.3 bus safety major incidents per 100,000 miles. 4.7 miles per gallon. OP-6
157 BUD1 Personnel Services TRANSPORTATION - BUS TRANSPORTATION 14/15 15/16 16/17 16/17 17/18 Actual Actual Budget Est Budget Position Title Total Total Base Pos Total Total Base Pos Total Administration: Executive Director, Transportation $ 183,052 $ 190,564 $ 173, $ 173,861 $ 91,250 $ 182, $ 182,500 Director, Transportation 116, ,140 65, , ,463 Director, Operations Support 109, , ,964 59,250 Administrator, ADA Compliance 88, ,739 90,957 91, ,401 Sr. Specialist, Wrkfrce Procs. & Systems 65,781 65, ,030 67,989 69, ,431 Administrative Assistant, Executive 70,915 75,142 72, ,467 73,975 74, ,277 Coordinator, Employee Programs 52,376 56,784 55, ,162 56,305 56, ,534 Fringe Benefits 101, , , , ,966 Center Garage: Manager, Transportation 88,039 95,384 92, ,743 96,412 94, ,123 Assistant Manager, Transportation 81, ,289 Assistant Manager, Transportation 266, ,867 78, , ,177 80, ,459 Operations Assistant 48,534 47,162 45, ,469 46,613 46, ,842 Active Regular Operator 14,174,790 9,797,537 55, ,906,545 11,906,545 55, ,068,056 Active Regular Operator 2,501,433 7,953,007 55, ,341,365 10,341,365 55, ,353,739 Part-Time Operator 923,991 1,375,003 37, ,711,208 1,711,208 37, ,599,608 Part-Time Operator 4,209,291 4,125,009 37, ,389,621 4,389,621 37, ,757,218 Fringe Benefits 12,442,012 13,215,249 15,689,434 15,689,434 15,622,326 Workers' Compensation 658, , , , ,000 Longevity Premium 174, , ,175 Powell Garage: Manager, Transportation 87,380 93,917 91, ,302 95,061 95, ,525 Assistant Manager, Transportation 70,384 79,613 77, ,729 79,527 Assistant Manager, Transportation 111, ,802 75, , ,675 83, ,513 Operations Assistant 45,477 48,264 46, ,550 39,721 45, ,564 Active Regular Operator 14,926,341 15,272,643 55, ,807,120 13,807,120 55, ,080,430 Active Regular Operator 1,696,619 2,532,874 55, ,794,964 2,794,964 55, ,478,129 Part-Time Operator 837,237 1,094,397 37, ,525,207 1,525,207 37, ,450,807 Part-Time Operator 2,511,710 2,403,880 37, ,604,013 2,604,013 37, ,971,609 OP-7
158 BUD1 Personnel Services TRANSPORTATION - BUS TRANSPORTATION 14/15 15/16 16/17 16/17 17/18 Actual Actual Budget Est Budget Position Title Total Total Base Pos Total Total Base Pos Total Fringe Benefits $ 11,391,213 $ 12,193,334 $ 11,658,275 $ 11,658,275 $ 12,030,813 Workers' Compensation 386, , ,000 65, ,000 Longevity Premium 234, , ,388 Merlo Garage: Manager, Transportation 86,334 93,844 $ 91, ,382 93,585 $ 94, ,041 Assistant Manager, Transportation 45,365 78,651 75, ,905 59,956 Assistant Manager, Transportation 97,984 81,404 78, ,465 81,662 81, ,970 Operations Assistant 38,937 45,655 44, ,013 45,851 46, ,218 Active Regular Operator 8,752,855 10,038,662 55, ,999,783 8,999,783 55, ,496,689 Active Regular Operator 2,134,346 1,402,837 55, ,229,784 1,229,784 55, ,857,050 Part-Time Operator 489,367 1,346,918 37, ,376,407 1,376,407 37, ,302,006 Part-Time Operator 1,957,469 1,627,526 37, ,450,807 1,450,807 37, ,404 Fringe Benefits 7,399,709 8,114,037 7,419,144 7,419,144 7,933,236 Workers' Compensation 229, , ,000 50, ,000 Longevity Premium 159, , ,721 Station Operations: Chief Station Agent 332, ,952 77, , ,150 77, ,150 Station Agent 1,647,599 1,714,097 73, ,847,408 1,847,408 73, ,847,408 Fringe Benefits 836, , , , ,159 Workers' Compensation 40, , , , ,000 Longevity Premium 24,847 24,847 25,948 Operator Training-Bus: Manager, Transportation Operations Training 92,672 94,277 Assistant Manager, Transportation Training 77,896 70,354 Administrative Specialist 63,151 59,879 Training Supervisor 1,909,220 2,009,234 OP-8
159 BUD1 Personnel Services TRANSPORTATION - BUS TRANSPORTATION 14/15 15/16 16/17 16/17 17/18 Actual Actual Budget Est Budget Position Title Total Total Base Pos Total Total Base Pos Total Fringe Benefits $ 875,713 $ 913,558 Workers' Compensation 5,096 36,812 Unscheduled Overtime - Non-Op. 136, ,086 Document Services & Mail Room: Supervisor, Document Services 49,499 $ 49, $ 49,338 $ 50,152 $ 50, $ 50,315 Doc Services Oper/Mail Services Clerk 31,832 32, ,614 33,152 33, ,259 Center Mail Services Clerk 49,708 49, ,684 49,684 49, ,684 Fringe Benefits 83,941 77,789 77,789 76,184 Longevity Premium 1,357 1,357 1,352 Fringe Benefits 790, , ,506 Timeslip Differential 597, , ,234 Split Shift Travel Time Pay 664,486 Road Relief Pay 621, , ,835 Scheduled Overtime 10,552,674 11,178,635 7,891,055 7,891,055 8,430,424 Unscheduled & Report OT - Ops. 2,609,722 2,609,722 2,628,976 Unscheduled Overtime - Non-Op. 242, , ,784 Student Training Cost-Center 177, , ,305 Unpaid Absence (2,721,904) (2,721,904) (2,770,634) Unemployment Expense 82,960 82,960 82,960 Sick & Vacation/Holiday Payout 268,440 4, ,540 FY2017 Annual Service Plan (524,705) (524,705) FY2018 Annual Service Plan (771,525) Capitalized Labor/Fringe (1,180,405) (393,205) (141,951) Total $ 104,407,260 $ 113,605,741 1, $ 115,241,498 $ 113,897,026 1, $ 120,537,870 OP-9
160 BUD2 Materials & Services TRANSPORTATION - BUS TRANSPORTATION Actual Actual Budget Estimate Budget % Change % of Expense Category 14/15 15/16 16/17 16/17 17/18 FY17-FY18 M & S Total Administration: Operator Uniforms $ 342,942 $ 349,994 $ 425,952 $ 400,000 $ 441, % 17.83% Quality Assurance/ADA 5,759 3,558 16,000 2,000 18, % 0.73% Temporary Help 13,119 17,400 18,000 12, % Laundry 3,587 4,346 5,000 4,000 5, % 0.20% Fixed Route Back-up - Cabs 1,828 3,065 3,000 4,000 3, % 0.12% Other Services 65,075 58,255 24, ,000 60, % 2.42% Winter Supplies-Snow & Ice 31, % Other Materials-Gen & Adm 5, % Other Materials 10,872 37,634 5,000 10,000 10, % 0.40% Unreconciled Mastercard Expense 2, % Telephone 6,044 6,537 8,000 6,000 8, % 0.32% Self-Insurance PI/PD 1,047, ,202 1,830, ,000 1,605, % 64.85% Claims Expense 491,436 (12,000) 0.00% Vehicle Registration % 0.01% Dues & Subscriptions % Local Travel & Meetings % 0.01% Education & Training 16,219 3,300 1,400 2, % Out-of-Town Travel ,600 3, % Operator CDL Renewals 8,729 10,081 8,800 8,000 10, % 0.40% Rewards & Recognition 50,019 47,161 34,000 34,000 36, % 1.45% Special Events 12,142 10,944 13,000 12,000 13, % 0.53% Subtotal Administration: $ 2,114,353 $ 1,071,326 $ 2,373,752 $ 1,373,780 $ 2,228,532 Center Garage: Other Services 2, ,100 2,800 3, % 0.13% Office Supplies 3,626 3,200 3,100 3,000 3, % 0.15% Other Materials 2, ,800 9,000 4, % 0.19% Telephone 3,171 3,592 3,080 3,200 3, % 0.13% Safety Awards % 0.01% Subtotal Center Garage: $ 11,449 $ 7,803 $ 12,440 $ 18,240 $ 15,160 Powell Garage: Other Services 1,626 3,141 3,000 6,000 3, % 0.13% Office Supplies 3,452 3,898 3,000 5,000 3, % 0.15% Other Materials 4 1,616 1,200 5,000 4, % 0.19% Telephone 2,679 3,323 3,680 2,400 3, % 0.13% Safety Awards % 0.01% Subtotal Powell Garage: $ 7,761 $ 11,978 $ 11,240 $ 18,640 $ 15,160 OP-10
161 BUD2 Materials & Services TRANSPORTATION - BUS TRANSPORTATION Actual Actual Budget Estimate Budget % Change % of Expense Category 14/15 15/16 16/17 16/17 17/18 FY17-FY18 M & S Total Merlo Garage: Other Services $ 1,412 $ 1,623 $ 3,000 $ 4,000 $ 3, % 0.13% Office Supplies 4,954 4,238 3,000 4,000 3, % 0.15% Other Materials 1,000 16,085 1,000 4,800 4, % 0.19% Telephone 4,301 4,969 4,000 4,000 4, % 0.17% Safety Awards % 0.01% Subtotal Merlo Garage: $ 11,767 $ 26,915 $ 11,360 $ 17,040 $ 15,960 Station Operations: Other Services , , % 0.10% Office Supplies 22,449 15,286 12,000 12,000 12, % 0.48% Other Materials 996 2,896 1, , % 0.04% Telephone %.. Subtotal Station Operations: $ 23,971 $ 18,733 $ 15,400 $ 13,960 $ 15,760 Operator Training-Bus: Accident Review/Investigations 3,368 3, % Temporary Help-Trans Adm 23,647 37, % Other Services 4, % Office Supplies 6,586 5, % Other Materials 28,382 14, % Operator Training Materials 11,728 18, % Telephone 12,318 13, % Operator Roadeo 1,126 1, % Subtotal Operator Training-Bus: $ 91,235 $ 95,350 Document Services & Mail Room: Photocopier Maint - Doc Svcs 18,938 37,000 31,000 37, % 1.50% Other Services 44,280 44,000 44,000 44, % 1.78% Postage 79,704 58,000 84,000 86, % 3.47% Doc Services Supplies 15,666 17,000 16,000 17, % 0.70% Telephone % Subtotal Document Services & Mail Room $ 158,864 $ 156,000 $ 175,260 $ 184,260 $ 2,260,535 $ 1,390,969 $ 2,580,192 $ 1,616,920 $ 2,474, % % OP-11
162 Department Summary TRANSPORTATION - FIELD OPERATIONS Actual Budget Estimate Budget % Change % of 14/15 15/16 16/17 16/17 17/18 FY17- FY18 Dept. Total Personnel Services $ 13,880,743 $ 15,095,923 $ 16,494,841 $ 16,251,517 $ 17,121, % 88.57% Materials & Services 828,136 1,109, ,362 1,592,380 2,210, % 11.43% Total $ 14,708,879 $ 16,205,583 $ 17,368,203 $ 17,843,897 $ 19,332, % % Responsibility: The Field Operations Department consists of Bus Dispatch, Rail Control, Road and Rail Supervisor functions and personnel in one department for efficient use of field personnel and equipment and effective coordination of transportation operations during regular and special event service and in response to incidents. Performance Measures: Safe, on-time bus and MAX service delivery. Improve fare enforcement. High customer satisfaction for special event service operations. Activities: Operation of rail control & bus dispatch. Control & supervision of all light rail and bus movements according to standard operating procedures and principles of safety and on-time performance. Enforcement of TriMet Codes relating to fare policy and other regulations. Maintain safe, secure and on-time service to TriMet customers. Prepare and manage operating plans for special events service. Initial and recurrent training for field supervisors, bus dispatchers and rail controllers. Standard operating procedures for field supervisors, bus dispatchers and rail controllers. OP-12
163 BUD1 Personnel Services TRANSPORTATION - FIELD OPERATIONS 14/15 15/16 16/17 16/17 17/18 Actual Actual Budget Est Budget Position Title Total Total Base Pos Total Total Base Pos Total Administration: Director, Ops Command Center & Field Ops $ 101,047 $ 105,790 $ 110, $ 110,000 $ 95,833 $ 115, $ 115,000 Manager, Operations Command Center 100, , ,357 Manager, Rail Transportation 100, ,265 Assistant Manager, Ops. Command Center 245, ,535 84, , ,515 80, ,835 Assistant Manager, Ops. Command Center 77, ,200 Assistant Manager, Field Operations 89,435 89,457 84, ,561 85,971 86, ,253 Assistant Manager, Field Operations 87,230 36,690 82, ,942 91,500 91, ,500 Operations Specialist 54, ,585 Coordinator, Operations Services 52,570 56,044 55, ,786 56,947 57, ,179 Fringe Benefits 312, , , , ,259 Workers' Compensation 19,000 Road Operations: Field Operations Coordinator 213, ,069 77, , ,613 77, ,613 Lead Dispatcher/Controller 85,017 93,203 77, ,538 77,538 77, ,538 Lead Field Supervisor 323, ,871 77, , ,150 77, ,150 Dispatcher 1,253,090 1,285,017 73, ,330,134 1,330,134 73, ,330,134 Dispatcher 73, ,793 Road Supervisor 2,597,256 2,781,385 73, ,734,164 2,734,164 73, ,734,164 Fringe Benefits 1,862,184 1,957,435 2,058,389 2,058,389 2,058,994 Workers' Compensation 7, , , , ,000 Longevity Premium 76,490 76,490 82,281 Unscheduled Overtime 502, , , , ,160 Night Differential 6,432 6,432 6,432 Rail Operations: Rail Controller 1,482,293 1,794,260 73, ,142,993 2,142,993 73, ,142,993 Rail Supervisor 2,414,217 2,575,416 73, ,586,371 2,586,371 73, ,586,371 Rail Supervisor 73, ,793 Fringe Benefits 1,561,686 1,799,499 2,085,805 2,085,805 2,085,503 Workers' Compensation (62,627) 46,124 60,000 60,000 64,000 Longevity Premium 51,426 51,426 58,093 Unscheduled Overtime 424, , , , ,064 Night Differential 6,893 6,893 6,893 OP-13
164 BUD1 Personnel Services TRANSPORTATION - FIELD OPERATIONS 14/15 15/16 16/17 16/17 17/18 Actual Actual Budget Est Budget Position Title Total Total Base Pos Total Total Base Pos Total Fare Inspection: Fare Inspector $ 374,252 $ 401,968 $ 73, $ 369,482 $ 369,482 $ 73, $ 369,482 Fringe Benefits 153, , , , ,921 Workers' Compensation 122,097 25,043 75,000 38,000 Longevity Premium 12,946 12,946 13,520 Unscheduled Overtime 55,201 25,792 27,140 Sick & Vacation/Holiday Payout 33,800 9,952 35,433 Capitalized Labor/Fringe (376,835) (140,496) (173,401) Total $ 13,880,743 $ 15,095, $ 16,494,841 $ 16,251, $ 17,121,758 OP-14
165 BUD2 Materials & Services TRANSPORTATION - FIELD OPERATIONS Actual Actual Budget Estimate Budget % Change % of Expense Category 14/15 15/16 16/17 16/17 17/18 FY17-FY18 M & S Total Administration: Professional & Technical $ 1,343, % Temporary Help $ 2,727 $ 2,400 $ 1,200 2, % 0.11% Other Services 13,093 $ 70,511 12,000 80,000 12, % 0.54% Office Supplies 2,844 3,450 4,000 3,200 3, % 0.17% Equip/Furn < $5,000-Gen & Adm 1,472 4, % OCC Equipment & Supplies 35,767 1, ,600 36,500 3, % 0.16% Other Materials 6,193 14,925 7,892 9,000 5, % 0.26% Telephone 3,717 4,982 3,000 15,200 5, % 0.24% Education & Training 3, % 0.01% Out-of-Town Travel 23 2,400 1, % Employee Recognition % 0.03% Subtotal Administration: $ 66,311 $ 98,452 $ 133,812 $ 152,800 $ 1,378,573 Road Operations: Uniforms 18,084 15,659 21,000 20,000 20, % 0.93% Vehicle Control System Maintenance 611, , , , , % 23.99% Other Services 955 1,337 3,000 10,000 3, % 0.14% Office Supplies 386 1, % Other Materials 11,393 9,368 7,200 9,200 50, % 2.29% Telephone 26,827 27,980 27,000 27,000 27, % 1.22% Data Communication Services - Buses 62,298 36, ,000 87, % 3.96% Local Travel & Meetings % Driver Accommodations 31,636 33,866 37,000 34,000 36, % 1.63% CDL Renewals 1, % 0.02% Subtotal Road Operations: $ 701,518 $ 952,529 $ 671,620 $ 1,300,980 $ 755,732 Rail Operations: Uniforms 17,476 12,687 21,000 18,000 20, % 0.93% Other Services 1,415 1,627 3,450 2,000 3, % 0.16% Office Supplies 121 1, % Other Materials 18,850 10,954 14,200 16,000 14, % 0.64% Telephone 22,136 25,984 24,000 22,000 24, % 1.09% OP-15
166 BUD2 Materials & Services TRANSPORTATION - FIELD OPERATIONS Actual Actual Budget Estimate Budget % Change % of Expense Category 14/15 15/16 16/17 16/17 17/18 FY17-FY18 M & S Total Data Communication Services - LRVs $ 5,660 $ 4,800 $ 80,000 $ 13, % 0.61% CDL Renewals $ % 0.04% Subtotal Rail Operations: $ 60,307 $ 58,679 $ 67,930 $ 138,600 $ 76,332 $ 828,136 $ 1,109,660 $ 873,362 $ 1,592,380 $ 2,210, % % OP-16
167 Department Summary TRANSPORTATION - SERVICE DELIVERY Actual Budget Estimate Budget % Change % of 14/15 15/16 16/17 16/17 17/18 FY17- FY18 Dept. Total Personnel Services $ 1,438,691 $ 1,556,386 $ 1,535,005 $ 1,557,625 $ 1,547, % 98.06% Materials & Services 64,889 49,086 30,300 62,400 30, % 1.94% Total $ 1,503,580 $ 1,605,472 $ 1,565,305 $ 1,620,025 $ 1,577, % % Responsibility: The Service Delivery Department is responsible for Scheduling, Systems Scheduling, Special Events Planning and Operator Workforce Utilization. Activities: Scheduling - Schedule writing, runcutting, and vehicle assignment. - Organize and manage operator assignment signups. - Maintain and improve schedule reliability and on-time performance. Scheduling Systems - Scheduling systems maintenance. - Application development. - Website support. Performance Measures: Continuous improvement in on-time performance, service capacity, and creating safe and efficient work assignments for bus and rail operators. Produce and distribute accurate schedule information to operators and supervisory personnel. Make efficient use of scheduling software, hardware tools and provide ongoing system administration. Disseminate scheduling materials and information to agency users and for web production. Plan, design and implement service for special events. Provide plans for emergency response to service disruptions. Prepare operational service plans for construction-related projects. Extraboard efficiency in balance with operator availability for all scheduled service. Special Events Planning - Support to events service design. - Special events service schedules. Operator Workforce Utilization - Operator hiring plans for replacing attrition, and increasing service. - Extraboard sizing and efficiency. OP-17
168 BUD1 Personnel Services TRANSPORTATION - SERVICE DELIVERY 14/15 15/16 16/17 16/17 17/18 Actual Actual Budget Est Budget Position Title Total Total Base Pos Total Total Base Pos Total Director, Service Delivery $ 130,720 $ 124,262 $ 119, $ 119,845 $ 122,346 $ 122, $ 122,846 Manager, Scheduling 98, ,868 98, , , , ,819 Manager, Workforce Utilization 86,447 91,659 88, ,998 91,880 92, ,981 Manager, Scheduling Systems & Production 48,882 83,920 82, ,358 85,678 87, ,074 Planner III 70,960 75,602 73, ,310 74,837 75, ,142 Computer Technology Specialist 111, , , , , , ,739 Schedule Data Technician 227, ,741 73, , ,688 73, ,689 Schedule Writer II 298, ,903 73, , ,584 73, ,585 Fringe Benefits 371, , , , ,793 Sick & Vacation/Holiday Payout 5,934 14,033 5,371 Longevity Premium 20,323 20,323 23,088 Unscheduled Overtime 2,221 3,202 2,950 5,193 2,950 Capitalized Labor/Fringe (8,420) (904) Total $ 1,438,691 $ 1,556, $ 1,535,005 $ 1,557, $ 1,547,077 OP-18
169 BUD2 Materials & Services TRANSPORTATION - SERVICE DELIVERY Actual Actual Budget Estimate Budget % Change % of Expense Category 14/15 15/16 16/17 16/17 17/18 FY17-FY18 M & S Total Professional & Technical $ 45,098 $ 16,420 $ 16,160 $ 40,000 $ 16, % 53.60% Other Services 5,396 4,802 5,000 4,800 5, % 16.34% Office Supplies , , % 6.54% Other Materials 1,824 2,649 1,800 2,200 2, % 6.54% Microcomputer Materials 3, , , % 3.92% Telephone 1,316 1,770 2,200 1,400 1, % 5.88% Local Travel & Meetings % 1.31% Education & Training 4, % Out-of-Town Travel 6,547 21,667 1,240 8,000 1, % 5.87% $ 64,889 $ 49,086 $ 30,300 $ 62,400 $ 30, % % OP-19
170 Department Summary TRANSPORTATION - ACCESSIBLE TRANSPORTATION PROGRAMS-LIFT Actual Budget Estimate Budget % Change % of 14/15 15/16 16/17 16/17 17/18 FY17- FY18 Dept. Total Personnel Services $ 1,203,758 $ 1,354,525 $ 1,299,908 $ 1,288,528 $ 1,296, % 3.51% Materials & Services 32,657,402 33,917,053 34,486,617 34,698,084 35,685, % 96.49% Total $ 33,861,160 $ 35,271,578 $ 35,786,525 $ 35,986,612 $ 36,982, % % Responsibility: The Accessible Transportation Programs - LIFT Department is responsible for providing safe, reliable and efficient demand-response transportation in support of the LIFT Program, designed to meet the American with Disabilities Act (ADA) requirement for complementary paratransit service for persons unable to use fixed route service. Activities: Performance Measures: Exceed 93% of pickups within 30 minutes of scheduled pickup window. Achieve 100,000 miles or more per preventable collision. Maintain or exceed rides per vehicle hour at Eligibility assessment for new and re-certification of existing LIFT clients. Answer 95% of customer calls within 5 minutes. 25,000 miles between mechanical failures for LIFT buses. Deliver safe, high-quality and cost-effective paratransit service that meets or exceeds ADA requirements. Maximize resources through the LIFT eligibility process. Effectively evaluate LIFT applicants functional abilities to determine most appropriate mode of travel and conditions under which trips can be taken. Review quality of customer service through analysis of customer feedback of all aspects of experiences with LIFT service and using that process to improve service. Improve relationships with the community through outreach, including staff support to TriMet s Committee on Accessible Transportation (CAT). OP-20
171 BUD1 Personnel Services TRANSPORTATION - ACCESSIBLE TRANSPORTATION PROGRAMS-LIFT 14/15 15/16 16/17 16/17 17/18 Actual Actual Budget Est Budget Position Title Total Total Base Pos Total Total Base Pos Total Director, ATP $ 114,164 $ 80,321 $ 116, $ 116,140 $ 93,958 $ 102, $ 102,500 Manager, LIFT Service Delivery 92, ,873 94, , ,132 89, ,450 Manager, LIFT Eligibility & Comm. Relations 81,438 92,347 84, ,357 87,651 88, ,976 Assistant Manager, LIFT Service Delivery 75,873 76,776 74, ,465 63,888 77, ,736 Administrator ADA Compliance 53,668 Administrator, LIFT Service Quality 55,919 46,081 57, ,043 60,097 61, ,250 Coordinator, LIFT Administration 50,085 54,470 53, ,082 55,360 56, ,222 Specialist, Senior Eligibility 68,638 73,447 67, ,519 68,928 69, ,210 Coordinator, LIFT Eligibility 210, ,412 56, , ,244 58, ,005 ATP Assistant, LIFT Eligibility 78,429 86,059 41, ,844 85,768 43, ,154 ATP Assistant 20,515 47,139 45, ,469 46,613 45, ,564 Fringe Benefits 356, , , , ,934 Sick & Vacation/Holiday Payout 12,211 10,716 Total $ 1,203,758 $ 1,354, $ 1,299,908 $ 1,288, $ 1,296,717 OP-21
172 BUD2 Materials & Services TRANSPORTATION - ACCESSIBLE TRANSPORTATION PROGRAMS-LIFT Actual Actual Budget Estimate Budget % Change % of Expense Category 14/15 15/16 16/17 16/17 17/18 FY17-FY18 M & S Total LIFT Operations: LIFT Central Dispatch $ 2,035,590 $ 2,039,078 $ 2,256,273 $ 1,925,240 $ 2,301, % 6.45% Professional & Technical 9,050 9,283 8,000 8,000 8, % 0.02% Temporary Help 10,053 12,000 8, % Office Equipment Service/Repair 130 1,000 1,130 1, % 0.00% ATP Central Maintenance Contract 2,367,693 2,368,774 2,547,427 2,345,530 2,598, % 7.28% Background Check Services 11,025 16,007 13,600 14,505 18, % 0.05% Printing Services 12,048 20,675 18,000 17,353 20, % 0.06% Other Services 4,741 5,691 11,770 10,085 12, % 0.03% Other Services-Revenue Vehicle Maintenance 58,332 49,731 87,000 52,000 40, % 0.11% Diesel Fuel - Revenue Vehicles 1,871,664 1,198,036 1,657,000 1,343,610 1,511, % 4.24% Oil & Lubricants 52,065 40,842 75,000 63,320 75, % 0.21% Gasoline - Revenue Vehicles 101,617 68,505 80,000 77,745 80, % 0.23% Tires, Lease/Purchase Revenue 101, , , , , % 0.39% Office Supplies 7,490 12,356 9,200 12,000 15, % 0.04% Furniture & Equipment <$5, ,261 7,600 8,350 9, % 0.03% Other Materials 2,663 6,682 9,000 11,000 9, % 0.03% Postage 4,603 2,951 7,000 8,450 10, % 0.03% ATP Maintenance Materials 3,969 15,904 12,000 13,000 16, % 0.04% Telephone 35,251 49,671 36,000 39,500 49, % 0.14% Data Communication Services - LIFT 29,126 30,735 32,000 36,650 32, % 0.09% Insurance Premium 1,458,706 1,500,384 1,530, , , % 2.24% PI/PD (2,000) 0.00% LIFT Transportation 20,353,830 21,633,168 21,907,121 23,518,310 23,806, % 66.71% LIFT Supplemental Cab Service 3,314,609 3,971,723 3,200,000 3,467,155 3,232, % 9.06% Local Travel & Meetings % 0.00% Education & Training % 0.00% Out-of-Town Travel 1,978 5,820 3,600 2,400 5, % 0.01% CAT Committee 19,496 15,959 18,300 16,200 18, % 0.05% Subtotal LIFT Operations: $ 31,857,929 $ 33,188,593 $ 33,627,471 $ 33,892,921 $ 34,818,472 OP-22
173 BUD2 Materials & Services TRANSPORTATION - ACCESSIBLE TRANSPORTATION PROGRAMS-LIFT Actual Actual Budget Estimate Budget % Change % of Expense Category 14/15 15/16 16/17 16/17 17/18 FY17-FY18 M & S Total LIFT Eligibility: Contracted Dispatch $ 41,270 $ 33,056 $ 68,041 $ 42,995 $ 68, % 0.19% Contracted Eligibility Assessment 341, , , , , % 0.95% Professional & Technical 1, , % 0.00% Office Equipment Service/Repair 251 1, , % 0.00% ATP Central Maintenance Contract 10,947 10,272 17,505 15,055 17, % 0.05% Printing Services 3,346 1,302 9,500 6,542 9, % 0.03% Other Services 10,572 6,682 13,000 10,240 13, % 0.04% Diesel Fuel - Revenue Vehicles 31,532 10,778 13,000 11,480 13, % 0.04% Office Supplies 16,951 7,950 9,000 6,900 9, % 0.03% Furniture & Equipment <$5,000 2,952 3,000 2,000 3, % 0.01% Other Materials ,400 1,940 2, % 0.01% Postage 22,708 19,492 24,000 22,680 24, % 0.07% Telephone , % 0.01% Eligibility Transportation 173, , , , , % 0.55% Education & Training % 0.00% Out-of-Town Travel 1,500 1,000 2, % 0.01% Leases 145, , , , , % 0.45% Subtotal LIFT Eligibility: $ 799,473 $ 728,460 $ 859,146 $ 805,163 $ 866,882 $ 32,657,402 $ 33,917,053 $ 34,486,617 $ 34,698,084 $ 35,685, % % OP-23
174 Department Summary TRANSPORTATION - ACCESSIBLE TRANSPORTATION PROGRAMS-MTP Actual Budget Estimate Budget % Change % of 14/15 15/16 16/17 16/17 17/18 FY17- FY18 Dept. Total Personnel Services $ 321,699 Materials & Services 11,872,782 Total $ 12,194,481 OP-24
175 BUD1 Personnel Services TRANSPORTATION - ACCESSIBLE TRANSPORTATION PROGRAMS-MTP 14/15 15/16 16/17 16/17 17/18 Actual Actual Budget Est Budget Position Title Total Total Base Pos Total Total Base Pos Total Manager, Transportation Brokerage $ 93,489 Software Engineer 101,012 Administrator, MTP Contract 34,552 Administrative Specialist, ATP 23,779 Fringe Benefits 68,866 Total $ 321,699 OP-25
176 BUD2 Materials & Services TRANSPORTATION - ACCESSIBLE TRANSPORTATION PROGRAMS-MTP Actual Actual Budget Estimate Budget % Change % of Expense Category 14/15 15/16 16/17 16/17 17/18 FY17-FY18 M & S Total DMAP - MTP: MTP Central Dispatch $ 802,502 Legal 14,897 Temporary Help 11,605 Background Checks 17,689 Printing Services 1,013 Other Services 890 Tickets 54,310 Passes 269,868 Office Supplies 2,976 Postage 8,181 Telephone 20,180 Insurance Premium 178,576 MTP Transportation 9,445,278 Local Travel & Meetings 88 Education & Training 638 Out-of-Town Travel 1,962 Building Expense Transfer - ATP 28,387 Subtotal DMAP-MTP: $ 10,859,040 Waivered Non-Medical: Contracted Dispatch 42,237 Background Checks 910 Other Services 225 Postage 436 Telephone 1,062 MTP Cab Transportation 740,220 Waivered Non-Medical Match-Wash./Clack. 227,157 Building Expense Transfer - ATP 1,495 Subtotal Waivered Non-Medical: $ 1,013,742 $ 11,872,782 OP-26
177 Department Summary TRANSPORTATION - RAIL TRANSPORTATION Actual Budget Estimate Budget % Change % of 14/15 15/16 16/17 16/17 17/18 FY17- FY18 Dept. Total Personnel Services $ 17,464,385 $ 21,034,143 $ 21,419,367 $ 20,884,478 $ 21,258, % 97.74% Materials & Services 320, , , , , % 2.26% Total $ 17,785,030 $ 21,201,031 $ 22,005,567 $ 21,229,278 $ 21,750, % % Responsibilities: The Rail Transportation Department includes management and administrative support functions for rail operators. Activities: Operation of regularly scheduled light rail service. Operation of Rose Festival and other special light rail service. 85% or better MAX on-time performance. Rail operator attendance/overtime/extraboard. Rail operator compliance with operating rules and standard operating procedures. Provision of rail operators to Portland Streetcar. Performance Measures: Strive for: - Safe, on-time MAX service delivery. - 85% or better MAX on-time performance. - Less than 1.0 MAX safety incidents per 100,000 miles. - Sustain 91.0% rail operator attendance. OP-27
178 BUD1 Personnel Services TRANSPORTATION - RAIL TRANSPORTATION 14/15 15/16 16/17 16/17 17/18 Actual Actual Budget Est Budget Position Title Total Total Base Pos Total Total Base Pos Total Manager, Rail Transportation $ 106,149 $ 103,526 $ 99, $ 99,855 $ 59,083 $ 100, $ 200,530 Manager, Rail Transportation & Streetcar 100, ,133 Assistant Manager, Rail Transportation 75,341 84,441 82, ,164 83,877 84, ,220 Assistant Manager, Rail Transportation 80,864 88,561 82, ,126 84,176 84, ,587 Operations Specialist 55,256 58,614 54, ,829 56,198 56, ,472 Assistant Manager, Transportation Training 44,494 37,163 Training Supervisor 351, ,105 LRV Operator 10,173,956 8,691,915 60, ,913,339 8,913,339 60, ,003,844 LRV Operator 2,703,972 60, ,789,215 2,789,215 60, ,638,111 Fringe Benefits 5,339,651 6,133,216 6,200,873 6,200,873 6,002,709 Workers' Compensation 341, , , , ,000 Limited Term Employment 79,647 Longevity Premium 102, ,030 99,615 Split Shift Travel Time Pay 43,200 Road Relief Pay 145, , ,186 Night Differential 14,206 14,206 14,206 Scheduled Overtime 2,207,896 2,720,443 1,519,067 1,519,067 1,519,067 Unscheduled & Report Overtime 868, , ,181 Unpaid Absence (212,135) (212,135) (212,135) Sick & Vacation/Holiday Payout 41,431 11,182 41,266 Capitalized Labor/Fringe (1,312,253) (433,010) Total $ 17,464,385 $ 21,034, $ 21,419,367 $ 20,884, $ 21,258,839 OP-28
179 BUD2 Materials & Services TRANSPORTATION - RAIL TRANSPORTATION Actual Actual Budget Estimate Budget % Change % of Expense Category 14/15 15/16 16/17 16/17 17/18 FY17-FY18 M & S Total Uniforms $ 44,900 $ 56,814 $ 65,000 $ 58,000 $ 61, % 12.45% Other Services 1,770 2,520 1,100 1,400 1, % 0.24% Office Supplies 21,805 18,183 5,800 8,000 8, % 1.63% Other Materials 9,398 14,206 6,000 18,000 8, % 1.63% Other Materials-Transp Adm 16,198 1, % Operator Training Materials 4,569 4, % Telephone 2,312 2,916 2,500 2,500 2, % 0.53% Self-Insurance PI/PD 212,343 62, , , , % 82.30% Out-of-Town Travel 2, % CDL Renewals 2,319 2,745 3,000 2,500 3, % 0.61% Employee Recognition 2,367 2,840 2,800 2,800 3, % 0.61% $ 320,645 $ 166,888 $ 586,200 $ 344,800 $ 492, % % OP-29
180 Department Summary TRANSPORTATION - COMMUTER RAIL Actual Budget Estimate Budget % Change % of 14/15 15/16 16/17 16/17 17/18 FY17- FY18 Dept. Total Personnel Services $ 1,639,645 $ 1,519,130 $ 1,611,797 $ 1,675,132 $ 1,584, % 26.78% Materials & Services 4,798,640 5,457,619 3,942,227 4,324,900 4,332, % 73.22% Total $ 6,438,285 $ 6,976,749 $ 5,554,024 $ 6,000,032 $ 5,917, % % Responsibility: The Commuter Rail Department is responsible for safe, reliable, on-time operation of the Westside Express Service (WES) Commuter Rail service, with clean and well-maintained rail vehicles, stations and park and ride facilities. WES operates as part of the general railroad system of transportation, and as such, is governed by regulations of the Federal Railroad Administration (FRA). The Portland and Western Railroad (P&W) is the owner/operator of common carrier railroad rights along the WES line. Under a Shared-Use Agreement between TriMet and P&W, WES trains operate as part of P&W railroad operations. WES functions performed by P&W are: training of engineers and conductors, train dispatching and maintenance of way (track, signals and grade crossings). WES functions performed by TriMet are: overall operations management, maintenance and cleaning of vehicles, stations and park/rides, fare system and customer service information. Performance Measures: 98% or better on-time performance. Train miles between train collisions - exceeding commuter rail industry standards. Train miles between passenger safety incidents - exceeding Commuter Rail industry standards. 100% compliance with FRA-required inspections and maintenance for commuter rail vehicles, signals and grade crossing systems. OP-30
181 BUD1 Personnel Services TRANSPORTATION - COMMUTER RAIL 14/15 15/16 16/17 16/17 17/18 Actual Actual Budget Est Budget Position Title Total Total Base Pos Total Total Base Pos Total Commuter Rail: Director, Commuter Rail - RR Compliance $ 125,919 $ 125,579 $ 119, $ 119,573 $ 122,069 $ 122, $ 122,568 Assistant Manager, Commuter Rail Operations 79,353 84,024 84, ,934 87,057 87, ,482 Commuter Rail Maint Assistant Supervisor 264, ,279 72, , ,096 72, ,096 Commuter Rail Maint Technician 437, ,089 62, , ,750 62, ,749 Service Worker 47, ,698 94,698 47, ,697 Facilities Management-Rail: Facilities Platform Cleaner 122, ,679 55, , ,688 55, ,687 Fringe Benefits 513, , , , ,005 Workers' Compensation 24,845 4,000 16,104 Longevity Premium 40,717 40,717 27,456 Unscheduled Overtime 91, ,163 68, ,294 66,770 Tool Allowance 9,926 9,926 9,926 Night & Shift Differential 7,055 7,055 7,055 Sick & Vacation/Holiday Payout 4,300 4,040 Capitalized Labor/Fringe (19,808) (46,083) (18,024) Total $ 1,639,645 $ 1,519, $ 1,611,797 $ 1,675, $ 1,584,531 OP-31
182 BUD2 Materials & Services TRANSPORTATION - COMMUTER RAIL Actual Actual Budget Estimate Budget % Change % of Expense Category 14/15 15/16 16/17 16/17 17/18 FY17-FY18 M & S Total Administration: Train Crew Uniforms $ 1,163 $ 1,570 $ 1,000 $ 2,700 $ 1, % 0.04% Professional & Technical 3, , % Office Supplies 1,392 1,515 1,400 4,400 1, % 0.04% Inventory Adjustments 2, % Telephone & Comm. Services 105, ,191 24,780 84,000 84, % 1.94% Data Communication Services - WES 6,000 54,000 57,000 57, % 1.32% Network Access Services 40, % Railroad Protective Insurance 1,317,660 1,542, % Self-Insurance PI/PD 100, , % 3.12% Train Operations 1,875,735 1,916,162 2,131,985 2,125,000 2,195, % 50.67% On-Time Performance Incentive 265, , , , , % 6.69% Maintenance of Way 476, , , , , % 19.79% Local Travel & Meetings % 0.01% Out-of-Town Travel ,400 1, % Subtotal Administration: $ 4,047,400 $ 4,551,583 $ 3,266,200 $ 3,374,400 $ 3,624,621 Vehicle Maintenance: Calibration & Tool Repair 4,664 4,077 4,200 5,000 4, % 0.10% Contracted Maintenance 58, ,162 40,000 40,000 49, % 1.14% Laundry 3,811 4,788 4,800 5,200 6, % 0.14% Other Services 5,368 1,735 4,800 4,750 4, % 0.11% Diesel Fuel - Commuter Trains 264, , , , , % 5.00% Maintenance Materials 216, , , , , % 4.85% Freight 25,130 35,577 15,000 60,000 27, % 0.62% Shop Equipment < $5,000 11,645 19,689 8,000 18,000 9, % 0.21% Cleaning Supplies 8,418 9,477 5,200 16,000 13, % 0.30% Small Hand Tools 6,812 6,468 2,400 3,600 4, % 0.09% Unreconciled Mastercard Expense % Other Materials 10,547 19,006 8,400 14,000 11, % 0.25% Maintenance Materials - Landscape 703 1, % Safety Supplies 4,405 9,378 2,400 6,200 4, % 0.09% Invoice Price Variance 1,111 (117) 0.00% Subtotal Vehicle Maintenance: $ 622,602 $ 781,215 $ 529,200 $ 815,500 $ 559,116 OP-32
183 BUD2 Materials & Services TRANSPORTATION - COMMUTER RAIL Actual Actual Budget Estimate Budget % Change % of Expense Category 14/15 15/16 16/17 16/17 17/18 FY17-FY18 M & S Total Facilities Maintenance: Landscape Services $ 4,695 $ 5,687 $ 4,200 $ 4,200 $ 4, % 0.10% Contracted Maint - Facilities 6,925 6,045 4,400 10,000 6, % 0.14% Facilities Maint. Agreements - WES 38,755 27,181 44,000 32,000 44, % 1.02% Waste Disposal Services 87 3,600 1,200 3, % 0.08% Maintenance Materials - Snow & Ice 1, , % 0.04% Maintenance Materials 5,418 10,082 12,000 10,000 12, % 0.28% Cleaning Supplies-Platforms 1,766 1,089 3,600 1,200 3, % 0.08% Landscape Materials 3, ,000 2,800 4, % 0.09% Utilities - Electricity 43,385 43,737 44,427 44,000 37, % 0.87% Utilities - Gas 8,965 9,659 10,000 14,000 15, % 0.36% Utilities - Water/Sewer 11,037 12,114 11,000 13,000 15, % 0.35% Utilities - Other 3,895 8,983 4,000 2,000 1, % 0.03% Subtotal Facilities Maintenance: $ 128,638 $ 124,821 $ 146,827 $ 135,000 $ 148,807 $ 4,798,640 $ 5,457,619 $ 3,942,227 $ 4,324,900 $ 4,332, % % OP-33
184 Department Summary TRANSPORTATION - STREETCAR Actual Budget Estimate Budget % Change % of 14/15 15/16 16/17 16/17 17/18 FY17- FY18 Dept. Total Personnel Services $ 5,534,515 $ 6,965,850 $ 6,993,170 $ 7,211,787 $ 6,989, % 47.66% Materials & Services 4,231,946 7,272,030 7,524,245 7,524,245 7,675, % 52.34% Total $ 9,766,461 $ 14,237,880 $ 14,517,415 $ 14,736,032 $ 14,665, % % Responsibility: The Streetcar Department is a City of Portland and TriMet partnership activity. It consists of job classifications defined by Portland Streetcar, filled by TriMet rail transportation and rail maintenance personnel who perform these jobs in operating the Portland Streetcar under supervision of Portland Streetcar management. These personnel remain TriMet employees, are paid and receive benefits from TriMet in the same manner as if their work was regular TriMet operations. Separately, TriMet funds approximately 60% of the annual operating cost (net fares) for Portland Streetcar. This expense is budgeted as a materials and services item. The TriMet funding and personnel support described above are per agreements between TriMet and the City of Portland, and between TriMet and the Amalgamated Transit Union (ATU). Performance Measures: Operation and supervision of Streetcar vehicles in revenue service (under City management). Maintenance of Streetcar vehicles, track, overhead electrification and rail signals (under City management). OP-34
185 BUD1 Personnel Services TRANSPORTATION - STREETCAR 14/15 15/16 16/17 16/17 17/18 Actual Actual Budget Est Budget Position Title Total Total Base Pos Total Total Base Pos Total Manager, Rail Transportation & Streetcar $ 100, $ 50,133 Superintendent, Rail Transportation $ 175,759 $ 178,278 $ 88, $ 176,226 $ 176,226 88, ,226 Streetcar Signals Maintainer 64, ,987 65, ,623 65,623 65, ,623 Streetcar Track Maintainer 64,223 69,582 65, ,623 65,623 65, ,623 Streetcar Vehicle Operator 2,578,287 3,342,364 60, ,848,434 2,848,434 60, ,727,227 Streetcar Vehicle Operator 60, , ,445 60, ,656 Streetcar Journeyman Mechanic 467,364 Streetcar Training Maintenance Technician 65, ,907 65,907 65, ,907 Streetcar Maintenance Technician 62, ,250 Streetcar Maintenance Technician 70, ,516 62, , ,625 62, ,373 Fringe Benefits 1,522,271 2,056,838 2,184,500 2,184,500 2,127,983 Workers' Compensation 60,377 39,642 53,000 56,000 Sick & Vacation/Holiday Payout 13,761 13,761 13,893 Longevity Premium 35,025 35,025 34,831 Scheduled Overtime 142, , ,613 Unscheduled OT - Operators 562, , , , ,263 Unscheduled OT - Non-Operator 110, , ,830 Night Differential 9,648 9,648 9,648 Tool Allowance 9,647 9,647 9,647 Capitalized Labor/Fringe (30,587) 813 Total* $ 5,534,515 $ 6,965, $ 6,993,170 $ 7,211, $ 6,989,726 *These Streetcar operations costs, plus an amount for overhead, are reimbursed by the City of Portland. The reimbursement is included in Operating Revenue - Service Contracts. OP-35
186 BUD2 Materials & Services TRANSPORTATION - STREETCAR Actual Actual Budget Estimate Budget % Change % of Expense Category 14/15 15/16 16/17 16/17 17/18 FY17-FY18 M & S Total Streetcar Partnership Funding $ 4,231,721 $ 7,271,090 $ 6,524,245 $ 6,524,245 $ 7,175, % 93.49% Streetcar Partnership Funding - OTO 1,000,000 1,000, , % 6.51% Safety Supplies - Fac/Eq Maint % Total* $ 4,231,946 $ 7,272,030 $ 7,524,245 $ 7,524,245 $ 7,675, % % *Amount of money TriMet provides to the City of Portland to support Streetcar operations. OP-36
187 Sub-Division Summary MAINTENANCE Actual Budget Estimate Budget % Change % of 14/15 15/16 16/17 16/17 17/18 FY17- FY18 Division Total Personnel Services $ 60,987,754 $ 68,196,252 $ 72,996,613 $ 74,020,761 $ 77,400, % 60.13% Materials & Services 43,953,021 43,149,845 46,851,500 48,999,769 51,329, % 39.87% Total $ 104,940,775 $ 111,346,097 $ 119,848,113 $ 123,020,530 $ 128,729, % % Page Maintenance Division Summary OP-37 Bus Maintenance OP-38 Facilities Management OP-42 Rail Maintenance of Way OP-48 Rail Equipment Maintenance OP-52 OP-37
188 Department Summary MAINTENANCE - BUS MAINTENANCE Actual Budget Estimate Budget % Change % of 14/15 15/16 16/17 16/17 17/18 FY17- FY18 Dept. Total Personnel Services $ 27,492,105 $ 29,043,596 $ 32,829,662 $ 32,715,022 $ 34,587, % 59.56% Materials & Services 22,785,253 19,102,470 23,433,088 22,881,200 23,485, % 40.44% Total $ 50,277,358 $ 48,146,066 $ 56,262,750 $ 55,596,222 $ 58,072, % % Responsibility: The Bus Maintenance Department is responsible for effectively and efficiently providing safe, clean and reliable vehicles and other services for use by its customers, passengers, operators and staff. The Maintenance Division Executive Director is budgeted in the Bus Maintenance department, while providing executive leadership to all Maintenance departments. Activities: Maintenance Executive Director - Communicate/instill TriMet s mission, strategic direction, and service plans throughout the Maintenance division, focused on safety, on-time performance and support to employees. - Executive action for Maintenance division budgets, programs, projects and personnel. - Employee communication and recognition programs. Bus Maintenance - Employee communication and recognition programs. - Develop and manage replacement projects for all fixed-route buses and non-revenue vehicles. - Meet or exceed preventive maintenance program guidelines and FTA Asset Management standards for all fixed-route buses and nonrevenue vehicles. - Train employees to necessary safety and skill levels, administer apprentice program for diesel bus mechanics. Provide recurrent update and vendor training for the entire workforce. Responsibility - continued: - Maintain fleet appearance through daily cleaning, exterior washing, fueling. - Repair all defects and failures in mechanical and body systems. - Provide modern, safe, well-maintained shops, tools and equipment. - Develop, administer, train and utilize the Maintenance Management Information System (MMIS) for scheduling, analysis and reporting of Bus and Rail Maintenance activities. - Manage contracts for procurement of bus maintenance materials, services and capital projects. - Administer warranty programs for bus and rail fleets and equipment. - Oversee inventory receiving, control and distribution in storerooms for Bus and Rail Maintenance. Performance Measures: 10,000 miles between mechanical failures resulting in lost service. 94.0% attendance for Bus Maintenance employees. Maintain 15 or fewer instances of workplace accidents per 200,000 labor hours. On-time completion of preventive maintenance procedures. Scheduled maintenance activities to account for 70% of bus repair hours. OP-38
189 BUD1 Personnel Services MAINTENANCE - BUS MAINTENANCE 14/15 15/16 16/17 16/17 17/18 Actual Actual Budget Est Budget Position Title Total Total Base Pos Total Total Base Pos Total Executive Director, Maintenance Operations $ 160,657 $ 170,849 $ 169, $ 169,683 $ 173,033 $ 173, $ 173,703 Executive Administrative Assistant 20,424 64,681 62, ,525 65,350 65, ,915 Director, Bus Maintenance 113, , , , , ,057 Senior Manager, Maintenance 99,525 Manager, Bus Maintenance 209, ,378 98, , , , ,629 Manager, Bus Maintenance 99, ,000 Manager, Stores & Warranty Programs 1,750 94,202 92, ,019 95,684 97, ,012 Asst Mgr, Training & NRV Operations 77,413 88,528 85, ,893 74,250 Supervisor, Maintenance 348, ,515 81, , ,509 82, ,103 Supervisor, Maintenance 537, ,701 78, , ,915 81, ,463,020 Coordinator II 58, ,514 56,516 58, ,011 Coordinator I 37,527 45, ,032 Assistant Supervisor 947, ,857 72, , ,384 72, ,352 Maintenance Trainer 72, ,032 Journeyman Mechanic 9,273,157 7,518,514 62, ,331,125 9,331,125 62, ,331,093 Journeyman Mechanic 807,422 62, , ,000 62, ,001,997 Apprentice Mechanic 880,598 51, , ,610 51, ,618 Apprentice Mechanic 920,942 51, , ,580 51, ,582 Maintenance Mechanic 376, ,153 59, , ,802 59, ,116 Maintenance Mechanic 59, ,058 Tire Servicer 310, ,218 61, , ,350 61, ,349 MMIS/Clerk of Maintenance 383, ,021 57, , ,549 57, ,546 Service Worker 1,066,309 1,563,461 44, , ,121 44, ,115 Service Worker 2,326,596 2,021,982 44, ,435,650 2,435,650 44, ,568,483 Cleaner 144, ,500 49, , ,072 49, ,071 Maintenance Trainer 433, ,430 72, , ,192 72, ,192 Supervisor, Stores 75,300 84,227 76, ,925 78,658 79, ,004 Assistant Storekeeper 224, ,921 65, , ,400 65, ,401 Partsman 469, ,862 62, , ,124 62, ,124 Partsman 62, ,196 Junior Partsman 122, ,634 60, , ,874 60, ,873 NRV Mechanic 251, ,589 62, , ,500 62, ,499 OP-39
190 BUD1 Personnel Services MAINTENANCE - BUS MAINTENANCE 14/15 15/16 16/17 16/17 17/18 Actual Actual Budget Est Budget Position Title Total Total Base Pos Total Total Base Pos Total Fringe $ 8,631,191 $ 8,897,693 $ 10,232,637 $ 10,232,637 $ 10,561,073 Workers' Compensation 420, , , , ,000 Limited Term Employment 85,233 Longevity Premium 613, , ,670 Night Differential 227, , ,706 Training Pay 5,873 5,873 5,873 Tool Allowance 184, , ,123 Unscheduled Overtime 579, , , , ,492 Unpaid Absence (82,845) (82,845) (85,925) Sick & Vacation/Holiday Payout 81,397 34,156 86,267 FY2017 Annual Service Plan (163,074) (163,074) FY2018 Annual Service Plan (475,542) Total $ 27,492,105 $ 29,043, $ 32,829,662 $ 32,715, $ 34,587,153 OP-40
191 BUD2 Materials & Services MAINTENANCE - BUS MAINTENANCE Actual Actual Budget Estimate Budget % Change % of Expense Category 14/15 15/16 16/17 16/17 17/18 FY17-FY18 M & S Total Professional & Technical $ % Contracted Bus Maintenance - MAF $ 198, ,480 $ 248,254 $ 140,000 $ 248, % 1.06% CRT Filter Cleaning 31,384 52,574 45,000 40,000 45, % 0.19% Body Work - Non Revenue Vehicles 11,213 20,780 14,000 34,000 15, % 0.06% Laundry 67,663 90,826 95,630 95,000 99, % 0.42% Other Services 229, , , , , % 0.84% Diesel Fuel - Revenue Vehicles 12,898,987 8,149,924 11,281,000 10,000,000 10,697, % 45.55% Diesel Fuel - Non Revenue Vehicles 57,200 46,068 48,000 42,000 46, % 0.20% Oil & Lubricants 401, , , , , % 2.02% Gasoline - Non Revenue Vehicles 441, , , , , % 1.79% Tires, Lease/Purchase Revenue 653, , , , , % 2.99% Tires - Non Revenue Vehicles 31,159 30,038 30,000 40,000 30, % 0.13% Office Supplies 41,681 33,919 30,000 62,000 32, % 0.14% Repair Materials - Revenue Equipment 78,170 50, ,000 72, , % 0.77% Maint. Materials - NRVs 300, , , , , % 1.16% Maint. Materials - Revenue Equipment 6,492,850 7,119,474 8,987,461 9,100,000 9,523, % 40.53% Freight - Priority 29,247 35,383 36,000 38,000 36, % 0.15% Shop Equipment Replacement 18,458 20,166 16,000 19,000 18, % 0.08% Cleaning Supplies 222, , , , , % 0.97% Small Hand Tools 29,624 43,603 24,000 24,000 26, % 0.11% Inventory Adjustments 131, , , % Other Materials 22,747 17,136 18,000 22,000 20, % 0.09% Unreconciled Mastercard Expense 1, % Safety Supplies 139, ,919 97, , , % 0.44% Winter Supplies 132,212 42,454 26, ,000 30, % 0.13% Obsolete Inventory 93, , , % Invoice Price Variance (9,646) (24,584) 0.00% Average Cost Variance (978) % Telephone 21,317 23,415 21,000 21,000 22, % 0.09% Education & Training 11,566 3,224 6,000 4,800 6, % 0.03% Out-of-Town Travel 1,802 10,769 4,000 10,000 6, % 0.03% CDL Renewals 6,402 2,551 2,400 4,400 3, % 0.01% Employee Recognition 3,062 6,113 5,000 6,400 5, % 0.02% Operating Expense Transfer (3,664) 1, % $ 22,785,253 $ 19,102,470 $ 23,433,088 $ 22,881,200 $ 23,485, % % OP-41
192 Department Summary MAINTENANCE - FACILITIES MANAGEMENT Actual Budget Estimate Budget % Change % of 14/15 15/16 16/17 16/17 17/18 FY17- FY18 Dept. Total Personnel Services $ 7,826,126 $ 8,966,080 $ 8,665,833 $ 8,803,490 $ 8,902, % 46.84% Materials & Services 7,762,986 8,270,624 8,189,677 8,568,600 10,105, % 53.16% Total $ 15,589,112 $ 17,236,704 $ 16,855,510 $ 17,372,090 $ 19,008, % % Responsibility: The Facilities Management Department is responsible for managing facility assets, planning, acquiring and allocating resources, maintaining assets and providing a safe, healthy and productive work environment. Activities: Maintenance of transit centers, MAX station platforms, park and rides, layover facilities and Portland Mall maintenance. Maintenance of operations and administration facilities. Sustainable landscaping practices oversight and management. Custodial services management. Maintenance and repair of bus stops and shelters. Plant maintenance mechanic apprenticeship program. Meet or exceed FTA State of Good Repair and Asset Management standards for TriMet facilities. Manage contracts for procurement of facilities maintenance materials, services and capital projects. Performance Measures: Maximize existing resources to increase services and efficiencies at district facilities, platforms, transit centers, park and rides and neighborhood bus shelters, focusing on service quality. Monitor Key Performance Indicators (KPIs) for effectiveness. Value the contributions of and invest in each employee, engage staff in decision-making. Implement improvements to expand services and demonstrate strong commitment to safety and quality, recognizing all contributions. Reduce operating costs through sustainable programs and campaigns in support of the agency goal of being an environmental leader. Timely completion of preventive and repair maintenance tasks. OP-42
193 BUD1 Personnel Services MAINTENANCE - FACILITIES MANAGEMENT 14/15 15/16 16/17 16/17 17/18 Actual Actual Budget Est Budget Position Title Total Total Base Pos Total Total Base Pos Total Facilities Management: Director, Facilities Management $ 118,148 $ 120,183 $ 119, $ 119,465 $ 100,994 $ 139, $ 139,000 Manager, Facilities Systems 96, , , , , , ,363 Manager, Facilities Services 72,847 95,385 94, ,548 56, , ,265 Supervisor, Facilities Management 73,080 79,465 78, ,620 80,483 80, ,856 Supervisor, Maint Facilities Management 148, ,282 80, , ,850 82, ,724 Coordinator, Facilities Project 54,238 47,487 62, ,678 66,049 67, ,387 Technician, Engineer 66,797 65,896 62, ,105 63,460 63, ,731 Coordinator II 60,035 58, ,011 60,140 60, ,986 Coordinator I 53,266 55,771 51, ,813 53,858 54, ,267 Specialist, Facilities 49,063 31,416 Assistant Supervisor 179, ,702 72, , ,064 72, ,064 Plant Maintenance Mechanic 632, ,106 62, , ,250 62, ,248 Plant Maintenance Mechanic Apprentices 150, ,087 62, , ,250 62, ,250 Maintenance Technician 308, ,059 59, , ,430 59, ,430 Landscaper 101, ,177 59, , ,372 59, ,372 Landscape Maintenance Technician 101, ,177 59, , ,372 59, ,372 Fringe Benefits 914,284 1,057,748 1,017,036 1,017, ,404 Capitalized Labor/Fringe (9,298) (672) Workers' Compensation 53,451 17,687 10,000 31,015 46,000 Longevity Premium 63,884 63,884 63,232 OP-43
194 BUD1 Personnel Services MAINTENANCE - FACILITIES MANAGEMENT 14/15 15/16 16/17 16/17 17/18 Actual Actual Budget Est Budget Position Title Total Total Base Pos Total Total Base Pos Total Facilities Management-Rail: Supervisor, Maint Facilities Management $ 152,761 $ 168,793 $ 81, $ 162,782 $ 165,652 $ 83, $ 166,226 Supervisor, Landscape 63, ,911 63,911 63, ,911 Assistant Supervisor - MOW 84,185 87,699 72, , ,064 72, ,064 Facilities Maintenance Trainer 74,699 81,638 72, ,032 72,032 72, ,032 Plant Maintenance Mechanic 81, ,198 62, , ,250 62, ,248 Plant Maintenance Mechanic 62, ,625 Plant Maintenance Mechanic Apprentices 481, ,939 58, , ,665 58, ,664 Plant Maintenance Mechanic Apprentices 58, ,598 Facilities Landscaper 463, ,947 59, , ,430 59, ,744 Facilities Platform Cleaner 486, ,884 55, , ,663 55, ,666 Facilities Platform Cleaner 1,239,850 1,248,365 55, ,227,798 1,227,798 55, ,283,616 Fringe Benefits 1,578,716 1,726,608 1,659,491 1,659,491 1,712,988 Workers' Compensation (23,971) 35, ,000 10,000 50,000 Longevity Premium 96,266 96,266 77,142 Unemployment 6,385 6,385 6,385 Unscheduled Overtime 135, , , , ,687 Sick & Vacation Payout 26,083 8,343 25,198 Capitalized Labor/Fringe (92,636) (32,506) Total $ 7,826,126 $ 8,966, $ 8,665,833 $ 8,803, $ 8,902,745 OP-44
195 BUD2 Materials & Services MAINTENANCE - FACILITIES MANAGEMENT Actual Actual Budget Estimate Budget % Change % of Expense Category 14/15 15/16 16/17 16/17 17/18 FY17-FY18 M & S Total Facilities Management: Professional and Technical $ 15,684 $ 3,202 $ 8,000 $ 40,000 $ 210, % 2.08% Architectural Services 33,349 15,563 12,000 8,000 12, % 0.12% Temporary Help 6, % Landscape Services 74,982 53,107 48,000 54,000 48, % 0.48% Portland Mall Management Services 1,704,051 1,694,691 1,675,968 1,700,000 1,707, % 16.85% Contracted Maintenance 273, , , , , % 2.96% Office Sup., Maintenance - Custodial 433, , , , , % 4.82% Shelter Cleaning 609, , , , , % 8.51% Shelter Cleaning-Vandalism 4,700 8,888 38,000 16,000 38, % 0.38% Transit Center Cleaning 282, , , , , % 2.97% Office Maintenance - Other 0.00% Laundry 7,105 7,780 24,000 9,000 18, % 0.18% Other Services 14,981 13,007 10,000 12,000 11, % 0.11% Office Supplies 4,410 7,914 4,800 4,800 4, % 0.05% Maint Materials Snow & Ice - Bus 2,325 4,052 4,800 38,000 4, % 0.05% Maintenance Materials 222, , , , , % 1.79% Maint Materials Outside Plant 7, % Maint Material Shop 1, % Equip/Furn < $5,000-Fac/Eq Maint % Bus Stop Signs/Poles ,400 3,400 3, % 0.04% Park & Ride Materials 108 1, % Cleaning Supplies 1,693 3,874 88,000 24,000 80, % 0.79% Small Hand Tools 36,569 24,556 21,000 24,000 22, % 0.22% Computer Equip. < $5,000 1, % Other Materials 6,927 8,194 10,000 9,000 10, % 0.10% Landscape Maintenance Materials 14,582 11,294 20,000 14,000 20, % 0.20% Mall Shelters Maintenance/Replacement 8, % Transit Mall Materials 7,048 18,995 20,000 12,000 20, % 0.20% Moving Services 17,911 10,942 4,800 4,800 4, % 0.05% Safety Supplies - Fac/Eq Maint 2,675 4,820 7,200 6,000 7, % 0.07% Utilities - Electricity 815, , , , , % 8.54% Utilities - Natural Gas 123, , , , , % 2.13% Utilities - Water/Sewer 353, , , , , % 3.96% Shelter Electrification 19,385 16,411 22,000 21,000 19, % 0.19% OP-45
196 BUD2 Materials & Services MAINTENANCE - FACILITIES MANAGEMENT Actual Actual Budget Estimate Budget % Change % of Expense Category 14/15 15/16 16/17 16/17 17/18 FY17-FY18 M & S Total Facilities Management (continued): Telephone $ 32,583 $ 34,912 $ 30,000 $ 30,000 $ 30, % 0.30% Utilities - Other 120, , , , , % 1.08% Dues & Subscriptions 1, ,000 1,000 1, % 0.01% Local Travel & Meetings 1, , % 0.00% Education & Training 2,238 1, % Education & Training - Bus 5,600 4,200 5, % 0.06% Apprenticeship Training 34,581 27,303 34,000 18,000 34, % 0.34% Out-of-Town Travel 3,062 2,747 6,000 4,200 4, % 0.04% CDL Renewals % Indirect Expense Allocation (29,880) 0.00% Employee Recognition % Rentals 3,643 1,043 7,200 3,200 7, % 0.07% Subtotal Facilities Management: $ 5,268,222 $ 5,352,884 $ 5,597,362 $ 5,476,800 $ 6,048,347 Facilities Management-Rail: Professional & Technical 2, ,000 2,400 10, % 0.10% Mechanical/Structural Consulting 5, % Architectural Services 2, % Contracted Maintenance - Landscaping 47,616 23,652 74,000 60, , % 7.06% Contracted Maintenance - ROW Art 31, % Contracted Maintenance - Stations 2,702 15,000 8,000 15, % 0.15% Contracted Maintenance - Fac. & Equipment 147, , , , , % 3.04% Contracted Maintenance - Elevators 164, , , , , % 2.35% Hillsboro Garage IGA 30,000 30,000 30,000 30,000 30, % 0.30% Office Maintenance Custodial 7,315 17,387 24,519 36,000 39, % 0.39% Transit Center Cleaning 2,591 3,253 3, % Other Services 3,221 2,337 6,800 6,000 6, % 0.07% Office Supplies 1,495 2,810 3,200 3,800 3, % 0.03% Maint Materials Snow & Ice - Rail 184 6,149 6,000 44,000 6, % 0.06% Maint Materials - Other , % Maintenance Materials - Outside Plant 107,163 90, , , , % 1.07% Maintenance Materials - Shop 58,215 70,443 66,000 66,000 67, % 0.66% Shop Equipment < $5,000 1,214 2,347 5,200 2,800 5, % 0.05% Cleaning Supplies - Platforms 74,017 87,857 76,000 78,000 77, % 0.76% Small Hand Tools 10,042 16,961 7,200 14,000 8, % 0.08% OP-46
197 BUD2 Materials & Services MAINTENANCE - FACILITIES MANAGEMENT Actual Actual Budget Estimate Budget % Change % of Expense Category 14/15 15/16 16/17 16/17 17/18 FY17-FY18 M & S Total Facilities Management-Rail (continued): Inventory Adjustments $ 2,000 Other Materials $ 6,578 $ 5,872 $ 5,200 8,000 $ 6, % 0.06% Maintenance Materials - Landscaping 20,464 17,054 24,000 24,000 24, % 0.24% Safety Supplies 14,621 23,810 8,200 9,600 8, % 0.09% Obsolete Inventory 0.00% Utilities - Natural Gas 125, , , , , % 1.40% Utilities - Other Water 332, , , , , % 5.60% Utilities - Building Electricity 1,043,830 1,209,616 1,040,000 1,200,000 1,415, % 14.01% VT Utilities - Electricity 9,905 9,488 10,000 10,000 10, % 0.11% Utilities - Other Building 93, ,326 90,000 92, , % 1.04% Utilities - Parking Garages 33,306 33,255 40,000 32,000 29, % 0.29% Tunnel Sewer/Storm Water Runoff 148,049 94,957 80,000 90,000 96, % 0.96% Education & Training % Education & Training - Rail 4,600 8,000 5, % 0.05% CDL Renewals % 0.00% Employee Recognition 356 1,800 1,200 1, % 0.02% Rentals 7,867 10,284 12,000 14,000 13, % 0.13%... Subtotal Facilities Management-Rail: $ 2,494,764 $ 2,917,740 $ 2,592,315 $ 3,091,800 $ 4,057,206 $ 7,762,986 $ 8,270,624 $ 8,189,677 $ 8,568,600 $ 10,105, % % OP-47
198 Department Summary MAINTENANCE - RAIL MAINTENANCE OF WAY Actual Budget Estimate Budget % Change % of 14/15 15/16 16/17 16/17 17/18 FY17- FY18 Dept. Total Personnel Services $ 8,813,845 $ 9,129,083 $ 9,679,419 $ 9,443,577 $ 10,045, % 59.84% Materials & Services 6,302,793 6,927,801 6,554,738 6,892,169 6,741, % 40.16% Total $ 15,116,638 $ 16,056,884 $ 16,234,157 $ 16,335,746 $ 16,786, % % Responsibilities: The Rail Maintenance of Way Department is responsible for maintenance of all railroad elements of TriMet s light rail system, including track, traction electrification, rail signals, trackway structures, including bridges and tunnels. The department also is responsible for employee training for all of its maintenance operations. Other responsibilities include maintaining Portland Streetcar track, electrification, and rail signals, under a services reimbursement agreement with the City of Portland. Performance Measures: Maintain light rail system railway elements in as new condition. 80% On-time completion of preventive maintenance. Perform MOW capital projects on-time and within budget. Activities: Preventive maintenance. Corrective maintenance. Overhaul and capital replacement programs for light rail track infrastructure and electrification and rail signals equipment systems. Meet or exceed FTA State of Good Repair and Asset Management standards for light rail maintenance of way elements. Manage contracts for procurement of maintenance of way materials, services and capital projects. Initial and recurrent training for track maintainers, substation and overhead electrification and signals maintainers and field technicians. Maintenance operations support of Capital Projects Division construction projects on light rail system. On-going productivity improvement through front-line employee involvement.. OP-48
199 BUD1 Personnel Services MAINTENANCE - RAIL MAINTENANCE OF WAY 14/15 15/16 16/17 16/17 17/18 Actual Actual Budget Est Budget Position Title Total Total Base Pos Total Total Base Pos Total Manager, MOW Operations $ 96,840 $ 103,618 $ 100, $ 100,000 $ 103,142 $ 104, $ 104,770 Assistant Manager, Rail MOW 89,778 93,402 90, ,211 93,068 93, ,639 Assistant Manager, Rail MOW 92, ,151 Supervisor, Rail Maintenance of Way 207, ,780 81, , ,424 82, ,085 Supervisor, Rail Maintenance of Way 172, ,180 77, , ,650 80, ,731 Supervisor, Engineering Training 142, ,866 77, , ,975 79, ,746 Coordinator, MOW Projects 79,637 82,587 77, ,559 79,858 69, ,541 Engineer, MOW Projects 71,931 78,776 75, ,519 79,950 81, ,334 Coordinator I 5,618 53, ,515 51,169 52, ,021 Assistant Supervisor - MOW 646, ,851 79, , ,224 79, ,225 Track Maintainer 479, ,803 61, , ,198 61, ,201 Substation Maintainer/Apprentice 403, ,069 68, , ,173 68, ,171 Power Maintainer/Apprentice 821,744 1,080,551 68, ,099,824 1,099,824 68, ,099,819 Signal Maintainer/Apprentice 1,064,465 1,014,126 67, ,084,976 1,084,976 67, ,084,974 Signal Maintainer/Apprentice 67, , ,866 67, ,865 Maintenance of Way Laborer 781, ,336 61, , ,604 61, ,606 Maintenance of Way Laborer 246,931 61, , ,302 61, ,303 Field Technician/Apprentice 1,118, ,188 MMIS/Clerk 114, ,432 57, ,507 57,507 57, ,507 Fringe Benefits 2,835,071 2,615,020 2,797,297 2,797,297 2,812,699 Workers' Compensation 13, , , , ,000 Longevity Premium 118, , ,593 Night & Shift Differential 61,394 61,394 61,394 Unscheduled Overtime 396, , , , ,616 Unemployment 12,183 12,183 12,183 Sick & Vacation/Holiday Payout 27,827 16,752 28,253 Capitalized Labor/Fringe (722,393) (109,446) (8,643) Total $ 8,813,845 $ 9,129, $ 9,679,419 $ 9,443, $ 10,045,427 OP-49
200 BUD2 Materials & Services MAINTENANCE - RAIL MAINTENANCE OF WAY Actual Actual Budget Estimate Budget % Change % of Expense Category 14/15 15/16 16/17 16/17 17/18 FY17-FY18 M & S Total Professional and Technical $ 6,000 $ 4, % Contracted Maintenance - Landscaping $ 13,000 5,000 11, % 0.16% Contracted Maintenance - Power Facility 4,400 2,000 4, % 0.06% Contracted Maintenance - Signals $ 1,507 $ ,000 20,000 78, % 1.16% Contracted Maintenance - Track 211, , , , , % 2.76% Contracted Maintenance - OCS 5,371 35,491 28,000 28,000 28, % 0.42% Contracted Maintenance - Bridges 12,409 10,296 54,800 44,000 54, % 0.80% Contracted Maintenance - Communications 22, % Contracted Maintenance - Substation 46,576 66,250 50,000 62, % 0.92% Hillsboro Maintenance Agreement 10, ,444 10,000 10,000 10, % 0.15% Calibration & Tool Repair 15,563 9,818 18,000 10,000 18, % 0.27% Other Services 15,278 3,096 10,800 10,000 10, % 0.15% Office Supplies 9,447 10,870 4,800 6,000 5, % 0.07% Computer Supplies 1, ,000 2, % Freight 576 3,422 2,400 6,000 3, % 0.05% Maintenance Materials - Outside Plant 83 2, % Cleaning Supplies - Fac/Eq Maint % Small Hand Tools 33,290 61,303 16,000 36,000 18, % 0.27% Other Materials-Gen & Adm 12,130 4, % Inventory Adjustments 11, % Other Materials-Rev Eq Maint 41,918 22,879 23,000 24,000 24, % 0.36% Unreconciled Mastercard Expense 58 3, % Safety Supplies 39,165 49,277 22,000 33,000 24, % 0.36% Obsolete Inventory 2,333 7, % Maintenance Materials - Fare Equipment 8,103 8, % Maintenance Materials - Track 106, , , , , % 2.45% Maintenance Materials - Signals 203, , , , , % 2.33% Maintenance Materials - Communications 55,023 7,320 3, % Maintenance Materials - OCS 69,024 40,836 46, ,000 46, % 0.69% Maintenance Materials - Substations 26,242 97,081 30,000 55,000 30, % 0.45% Electrical Power (Propulsion) 4,663,387 5,103,173 5,156,000 5,400,000 5,328, % 79.04% Telephone 93, ,540 84, ,000 84, % 1.26% OP-50
201 BUD2 Materials & Services MAINTENANCE - RAIL MAINTENANCE OF WAY Actual Actual Budget Estimate Budget % Change % of Expense Category 14/15 15/16 16/17 16/17 17/18 FY17-FY18 M & S Total PI/PD Expense $ 301,490 $ 65,928 $ (32,831) 0.00% Dues & Subscriptions $ $ % 0.00% Local Travel & Meetings , % 0.01% Education & Training 27,125 29,658 20,000 32,000 20, % 0.30% Out-of-Town Travel 33,887 12,508 10,000 8,000 10, % 0.15% Steel Bridge Maintenance Agreement 289, , , , , % 4.90% CDL Renewals 1,457 3,270 1,600 1,200 1, % 0.02% Employee Recognition 1,393 1, ,800 1, % 0.01% Rentals 218 2,408 24,000 20,000 24, % 0.33% $ 6,302,793 $ 6,927,801 $ 6,554,738 $ 6,892,169 $ 6,741, % % OP-51
202 Department Summary MAINTENANCE - RAIL EQUIPMENT MAINTENANCE Actual Budget Estimate Budget % Change % of 14/15 15/16 16/17 16/17 17/18 FY17- FY18 Dept. Total Personnel Services $ 16,855,678 $ 21,057,493 $ 21,821,699 $ 23,058,672 $ 23,865, % 68.46% Materials & Services 7,101,989 8,848,950 8,673,997 10,657,800 10,997, % 31.54% Total $ 23,957,667 $ 29,906,443 $ 30,495,696 $ 33,716,472 $ 34,862, % % Responsibilities: The Rail Equipment Maintenance Department is responsible for maintenance of TriMet s light rail vehicles (LRVs), including employee training, and provides vehicle maintenance technicians to Portland Streetcar. Performance Measures: Maintain light rail vehicles in effectively as new condition, through progressive overhaul. On-time completion of preventive maintenance. Activities: Preventive maintenance. Corrective maintenance. LRV fleet progressive overhaul program. LRV modifications for improvements in reliability/maintainability. Cleaning of MAX vehicles and shop facilities. Initial and recurrent training for classifications of LRV maintenance technicians and rail-specific training for LRV cleaners. Meet or exceed FTA State of Good Repair and Asset Management standards for light rail vehicles. Manage contracts for procurement of LRV maintenance materials, services and capital projects. Receive and commission additional LRVs to be delivered for future MAX extensions and service increases. On-going productivity improvement through front-line employee involvement. OP-52
203 BUD1 Personnel Services MAINTENANCE - RAIL EQUIPMENT MAINTENANCE 14/15 15/16 16/17 16/17 17/18 Actual Actual Budget Est Budget Position Title Total Total Base Pos Total Total Base Pos Total Director, Rail Equipment Maintenance $ 103,539 $ 107, $ 107,500 $ 111,128 $ 112, $ 112,629 Manager, Rail Equipment Maintenance $ 94,995 98,859 96, ,026 98,649 97, ,257 Manager, Rail Equipment Maintenance 90, ,344 71,597 Manager, Maintenance Training & QA 97, , , ,000 96,768 95, ,923 Manager, Warranty Programs 85,454 91,315 88, ,504 89,976 90, ,270 Coordinator, Warranty Programs 8,077 62,607 60, ,630 64,248 65, ,371 Coordinator I 71,772 60,306 53, ,515 53,518 53, ,518 Supervisor, Engineering Training 153, ,068 81, , ,949 84, ,525 Supervisor, Engineering Training 186, ,701 75, , ,201 78, ,304 Supervisor, Rail Maintenance 445, ,047 81, , ,174 82, ,368 Supervisor, Rail Maintenance 131, ,708 79, , ,270 81, ,213 CAD Technician 57,490 65,057 63, ,378 64,348 64, ,542 Assistant Supervisor 576, ,279 72, , ,192 72, ,192 Vehicle Maintainer 5,386,687 6,419,135 62, ,513,000 6,513,000 62, ,512,977 Vehicle Maintainer 62, , ,500 62, ,998 LRV Body & Paint Technician 62, ,500 MMIS/Clerk 75,945 73,532 57, , ,014 57, ,013 Vehicle Cleaner/Helper 428, ,990 58, , ,096 58, ,096 Vehicle Cleaner/Helper 886,570 1,085,263 47, ,325,772 1,325,772 47, ,609,854 Janitor 99, ,552 49, , ,036 49, ,036 Supervisor, Stores 68,122 75,936 70, ,399 72,854 73, ,345 Assistant Storekeeper 131, ,320 65, , ,700 65, ,700 Partsman 220, ,695 62, , ,464 62, ,464 Partsman 62, ,196 Vehicle Apprentice Mechanic 1,937,884 1,856,594 51, ,755,930 1,755,930 51, ,755,945 Vehicle Cleaner/Helper 349,266 58, , ,144 58, ,144 Fringe Benefits 5,216,642 6,129,246 6,780,171 6,780,171 7,207,739 Workers' Compensation 138, , , , ,000 Longevity Premium 295, , ,945 Unscheduled Overtime 1,834,385 2,154, ,845 2,026, ,618 Tool Allowance 88,360 88,360 90,232 Night & Shift Differential 134, , ,557 Unemployment 10,075 10,075 10,075 Sick & Vacation/Holiday Payout 61,013 6,531 64,645 Capitalized Labor/Fringe (1,478,550) (132,847) Total $ 16,855,678 $ 21,057, $ 21,821,699 $ 23,058, $ 23,865,191 OP-53
204 BUD2 Materials & Services MAINTENANCE - RAIL EQUIPMENT MAINTENANCE Actual Actual Budget Estimate Budget % Change % of Expense Category 14/15 15/16 16/17 16/17 17/18 FY17-FY18 M & S Total Professional & Technical $ 14,680 $ 160 $ 169,000 $ 130,000 $ 104, % 0.95% Temporary Help-Trans Adm 46,422 42,297 4,824 1,200 1, % 0.01% Calibration & Tool Repair 10,114 18,996 14,000 16,000 14, % 0.13% Contracted Maintenance 450 2,497 22,000 6,000 22, % 0.20% Laundry 58,530 81, , , , % 1.00% Other Services 25,008 2,266 3,000 6,000 3, % 0.03% Other Services-Revenue Veh. Maint 46,727 6,248 18,000 12,000 18, % 0.16% Graphics Supplies % 0.01% Office Supplies 23,151 21,866 10,000 26,000 14, % 0.13% Computer Supplies 32,590 26,079 6,000 11,000 7, % 0.07% Maint. Materials - LRV Overhaul 3,592,577 5,163,268 5,449,785 6,000,000 7,825, % 71.12% VT Maintenance Materials - Trolley 1, % Repair Materials - LRV Accident 24,868 12,431 31,000 39,000 26, % 0.24% Repair Materials - LRV Vandalism 27,541 17,510 64,000 20,000 60, % 0.55% Maint. Materials - Service Equip. 21,900 14,167 9, % Maint. Materials - LRVs 2,300,327 2,426,940 2,265,388 2,900,000 2,268, % 20.62% Freight 102, ,081 90, ,000 90, % 0.83% Equip/Furniture <$5,000-Rev Eq Maint % Equip/Furniture <$5,000-Gen & Adm ,731 8, % Shop Equipment 134, ,725 90, ,000 90, % 0.83% Cleaning Supplies 101, , , , , % 1.00% Small Hand Tools 48,228 76,659 53,000 88,000 53, % 0.49% Inventory Adjustments 58,652 (14,547) 190, % Other Materials - Transp Ad 1,492 2, % Other Materials - Rev Eq Maint 157, ,545 92, ,000 92, % 0.84% Unreconciled Mastercard Expense (58) 5, % Safety Supplies 68,795 93,192 64, ,000 64, % 0.59% Obsolete Inventory 103,667 1,178 70, % Invoice Price Variance (1,065) (1,424) 0.00% Average Cost Variance (144) (43,071) 0.00% Maintenance Materials - Fare Equipment % Telephone 7,435 10,170 6,400 10,000 6, % 0.06% Education & Training 4,596 3,417 4,800 20,000 4, % 0.04% Out-of-Town Travel 2,362 3,423 2,000 4,000 2, % 0.02% OP-54
205 BUD2 Materials & Services MAINTENANCE - RAIL EQUIPMENT MAINTENANCE Actual Actual Budget Estimate Budget % Change % of Expense Category 14/15 15/16 16/17 16/17 17/18 FY17-FY18 M & S Total Fines and Penalties $ 1,250 Freight $ % Inventory Adjustments 71, ,953 $ 250, % CDL Renewals 5,393 1,947 $ 4,200 2,400 $ 4, % 0.04% Employee Recognition 4,141 5,327 4,000 4,000 4, % 0.04% Rental 2,052 1, % $ 7,101,989 $ 8,848,950 $ 8,673,997 $ 10,657,800 $ 10,997, % % OP-55
206 BUDGET PROGRESSION SCHEDULE - OPERATIONS - TRANSPORTATION & MAINTENANCE Actual Actual Adopted Proposed Approved Adopted 14/15 15/16 16/17 17/18 17/18 17/18 Administration & Support $ 862,145 $ 1,207,527 $ 2,017,174 Personnel Services $ 2,122,776 $ 2,122,776 $ 2,130, , , ,880 Materials & Services 375, , ,547 $ 1,114,879 $ 1,956,945 $ 2,306,054 Department Total $ 2,498,323 $ 2,498,323 $ 2,505,855 Bus Transportation $ 104,407,260 $ 113,605,741 $ 115,241,498 Personnel Services $ 121,366,256 $ 121,366,256 $ 120,537,870 2,260,535 1,390,969 2,580,192 Materials & Services 2,481,447 2,481,447 2,474,832 $ 106,667,795 $ 114,996,710 $ 117,821,690 Department Total $ 123,847,703 $ 123,847,703 $ 123,012,702 Field Operations $ 13,880,743 $ 15,095,923 $ 16,494,841 Personnel Services $ 17,122,777 $ 17,122,777 $ 17,121, ,136 1,109, ,362 Materials & Services 2,476,616 2,476,616 2,210,637 $ 14,708,879 $ 16,205,583 $ 17,368,203 Department Total $ 19,599,393 $ 19,599,393 $ 19,332,395 Service Delivery $ 1,438,691 $ 1,556,386 $ 1,535,005 Personnel Services $ 1,547,288 $ 1,547,288 $ 1,547,077 64,889 49,086 30,300 Materials & Services 30,603 30,603 30,603 $ 1,503,580 $ 1,605,472 $ 1,565,305 Department Total $ 1,577,891 $ 1,577,891 $ 1,577,680 Accessible Transportation Programs-LIFT $ 1,203,758 $ 1,354,525 $ 1,299,908 Personnel Services $ 1,299,834 $ 1,299,834 $ 1,296,717 32,657,402 33,917,053 34,486,617 Materials & Services 35,685,354 35,685,354 35,685,354 $ 33,861,160 $ 35,271,578 $ 35,786,525 Department Total $ 36,985,188 $ 36,985,188 $ 36,982,071 Accessible Transportation Programs-MTP $ 321,699 Personnel Services 11,872,782 Materials & Services $ 12,194,481 Department Total Rail Transportation $ 17,464,385 $ 21,034,143 $ 21,419,367 Personnel Services $ 21,259,910 $ 21,259,910 $ 21,258, , , ,200 Materials & Services 492, , ,062 $ 17,785,030 $ 21,201,031 $ 22,005,567 Department Total $ 21,751,972 $ 21,751,972 $ 21,750,901 OP-56
207 BUDGET PROGRESSION SCHEDULE - OPERATIONS - TRANSPORTATION & MAINTENANCE Actual Actual Adopted Proposed Approved Adopted 14/15 15/16 16/17 17/18 17/18 17/18 Commuter Rail $ 1,639,645 $ 1,519,130 $ 1,611,797 Personnel Services $ 1,584,658 $ 1,584,658 $ 1,584,531 4,798,640 5,457,619 3,942,227 Materials & Services 4,338,543 4,338,543 4,332,544 $ 6,438,285 $ 6,976,749 $ 5,554,024 Department Total $ 5,923,201 $ 5,923,201 $ 5,917,075 Streetcar $ 5,534,515 $ 6,965,850 $ 6,993,170 Personnel Services $ 6,990,051 $ 6,990,051 $ 6,989,726 4,231,946 7,272,030 7,524,245 Materials & Services 7,675,379 7,675,379 7,675,379 $ 9,766,461 $ 14,237,880 $ 14,517,415 Department Total $ 14,665,430 $ 14,665,430 $ 14,665,105 Bus Maintenance $ 27,492,105 $ 29,043,596 $ 32,829,662 Personnel Services $ 34,998,666 $ 34,998,666 $ 34,587,153 22,785,253 19,102,470 23,433,088 Materials & Services 23,548,732 23,548,732 23,485,301 $ 50,277,358 $ 48,146,066 $ 56,262,750 Department Total $ 58,547,398 $ 58,547,398 $ 58,072,454 Facilities Management $ 7,826,126 $ 8,966,080 $ 8,665,833 Personnel Services $ 8,903,041 $ 8,903,041 $ 8,902,745 7,762,986 8,270,624 8,189,677 Materials & Services 9,414,202 9,414,202 10,105,553 $ 15,589,112 $ 17,236,704 $ 16,855,510 Department Total $ 18,317,243 $ 18,317,243 $ 19,008,298 Rail Maintenance of Way $ 8,813,845 $ 9,129,083 $ 9,679,419 Personnel Services $ 10,068,775 $ 10,068,775 $ 10,045,427 6,302,793 6,927,801 6,554,738 Materials & Services 6,741,225 6,741,225 6,741,225 $ 15,116,638 $ 16,056,884 $ 16,234,157 Department Total $ 16,810,000 $ 16,810,000 $ 16,786,652 Rail Equipment Maintenance $ 16,855,678 $ 21,057,493 $ 21,821,699 Personnel Services $ 23,863,645 $ 23,863,645 $ 23,865,191 7,101,989 8,848,950 8,673,997 Materials & Services 10,897,273 10,897,273 10,997,273 $ 23,957,667 $ 29,906,443 $ 30,495,696 Department Total $ 34,760,918 $ 34,760,918 $ 34,862,464 Division Total $ 207,740,596 $ 230,535,477 $ 239,609,373 Personnel Services $ 251,127,677 $ 251,127,677 $ 249,867, ,240,729 93,262,568 97,163,523 Materials & Services 104,156, ,156, ,606,310 $ 308,981,325 $ 323,798,045 $ 336,772,896 Total Operations- Transportation & Maintenance $ 355,284,660 $ 355,284,660 $ 354,473,652 OP-57
208 [This Page Left Intentionally Blank] OP-58
209 Division Summary CAPITAL PROJECTS Actual Budget Estimate Budget % Change % of 14/15 15/16 16/17 16/17 17/18 FY17 - FY18 Division Total Personnel Services $ 2,229,377 $ 2,203,628 $ 1,249,470 $ 2,383,294 $ 2,036, % 46.81% Materials & Services 1,745,421 2,173,396 2,287,612 2,042,587 2,313, % 53.19% Total $ 3,974,799 $ 4,377,024 $ 3,537,082 $ 4,425,881 $ 4,349, % % Page Capital Projects Division Division Summary CP-1 Administration CP-2 Development & Operations Support CP-5 Capital Program CP-9 In-Street Transit Facilities Development CP-12 CP-1
210 Department Summary CAPITAL PROJECTS - ADMINISTRATION Actual Budget Estimate Budget % Change % of 14/15 15/16 16/17 16/17 17/18 FY17 - FY18 Dept. Total Personnel Services $ 324,265 $ 375,469 $ 580,523 $ 314,414 $ 571, % 74.54% Materials & Services 77,083 94, , , , % 25.46% Total $ 401,348 $ 470,297 $ 907,647 $ 548,167 $ 767, % % Responsibility: The Capital Projects Division plans, designs, remodels and constructs high value transit projects. Work includes in-street (bus) facilities, operations and administrative facilities, bus garages, light rail operations bases and extensions to the light rail system. The division also manages improvements to existing TriMet facilities, implements opportunities for transit-supportive developments, and serves as the district s landlord in managing its real property. Activities: Performance Measures: Perform scheduled deployments and maintenance of bus stops and transit stations. Deliver assigned capital program projects per agency budget, schedule minority business and safety objectives. Assist other divisions by providing requested engineering, project management and technical support. Perform scoping, direct preliminary and final design of capital projects performed by staff and consultants, manage construction and safety certifications. Deliver selected renovation of existing TriMet facilities as part of TriMet s State of Good Repair efforts. Assist other TriMet divisions in project development and implementation of approved elements in the Capital Improvement Program. CP-2
211 BUD1 Personnel Services CAPITAL PROJECTS - ADMINISTRATION 14/15 15/16 16/17 16/17 17/18 Actual Actual Budget Est Budget Position Title Total Total Base Pos Total Total Base Pos Total Executive Director, Capital Projects & Construction $ 184,895 $ 232,004 $ 188, $ 188,028 $ 177,677 $ 178, $ 178,212 Executive Administrative Assistant 55,686 64,229 62, ,712 64,772 65, ,603 Fringe Benefits 83,684 80,065 72,247 72,247 70,508 Non-Union Baseline Adjustment 255, ,024 Sick & Vacation/Holiday Payout 1,744 1,531 Capitalized Labor/Fringe (829) (282) Total $ 324,265 $ 375, $ 580,523 $ 314, $ 571,878 CP-3
212 BUD2 Materials & Services CAPITAL PROJECTS - ADMINISTRATION Actual Actual Budget Estimate Budget % Change % of Expense Category 14/15 15/16 16/17 16/17 17/18 FY17-FY18 M & S Total Rail-Volution Conference $ 15,000 $ 15,635 $ 16,000 $ 15,000 $ 16, % 8.19% Printing Services 982 3,500 2,000 1, % 0.77% Other Services, Genl & Admin ,000 4, % 0.00% Office, Other Supplies ,224 35,000 40,000 31, % 15.87% Other Materials 304 3,551 28,400 4, % 0.00% Unreconciled Mastercard Expense % Telephone ,580 12, % 0.00% Dues & Subscriptions 2,231 11,599 15,854 35,000 20, % 10.24% Local Travel & Meetings 336 2,253 17,000 1, % 0.00% Education & Training 12,496 17,461 32,340 47,500 47, % 24.33% Out-of-Town Travel 40,165 23,495 77,350 70,000 77, % 39.53% Fines and Penalties 4, % Employee Recognition 879 6,605 2,100 2,000 2, % 1.07% $ 77,083 $ 94,828 $ 327,124 $ 233,753 $ 195, % % CP-4
213 Department Summary CAPITAL PROJECTS - DEVELOPMENT & OPERATIONS SUPPORT Actual Budget Estimate Budget % Change % of 14/15 15/16 16/17 16/17 17/18 FY17 - FY18 Dept. Total Personnel Services $ 1,456,761 $ 955,633 $ 668,947 $ 2,068,880 $ 1,464, % 40.87% Materials & Services 1,521,455 1,916,578 1,960,488 1,808,834 2,118, % 59.13% Total $ 2,978,216 $ 2,872,211 $ 2,629,435 $ 3,877,714 $ 3,582, % % Responsibility: The Development and Operations Support Department provides responsive, cost-effective and comprehensive planning, design, construction and management of projects to maintain District facilities in a State of Good Repair and to improve customer and employee safety. It provides safe, visible and accessible bus stops along all bus lines, supports Rail Maintenance of Way, light rail vehicle maintenance and manages District leases. Activities: Manage renovation of existing transit facilities, plan, prioritize, design, permit, construct and turn over improvements. Assist TriMet s Operations and Maintenance divisions with service improvements. Provide engineering, scheduling and general technical support for Capital Improvement Program projects. Manage in-street facilities. Continue project development activities for the Division Transit Project. Continue outreach for Southwest Corridor Project, refine estimates for selected mode and communicate options. Manage consultant the design team. Complete and submit required elements to the Federal Transit Administration to enter the project development phase. Advance remaining elements of the Portland-Milwaukie Light Rail Project. Prepare for grant close-out in FY2019. Performance Measures: Complete scheduled project development, engineering and construction activities per agency program. Meet district requirements for emergency civil and systems projects. Install new bus stop shelters/bus stop signs in accordance with criteria. Advance Division Transit Project development. Develop detailed design and complete environmental review, apply for and receive rating from the Federal Transit Administration. Complete Draft Environmental Impact Statement for Southwest Corridor Project, receive permission to enter into Project Development Phase, adopt Locally Preferred Alternative. CP-5
214 BUD1 Personnel Services DEVELOPMENT & OPERATIONS SUPPORT 14/15 15/16 16/17 16/17 17/18 Actual Actual Budget Est Budget Position Title Total Total Base Pos Total Total Base Pos Total Managing Director, Design & Construction $ 167, $ 208,367 $ 170,178 $ 170, $ 170,809 Director, Southwest Corridor 150, , , , ,489 Director, Project Development & Permitting 143, , , , ,342 Director, Civil Construction 140, , , , ,282 Director, Program Management 136, , , , ,646 Director, Building Projects $ 112, , , , , ,032 Director, Station Projects $ 109, , , , , , ,783 Sr Manager, Community Affairs & Communications 95, ,561 98,615 99, ,773 Manager, Design-Southwest Corridor 110, , , , ,188 Manager, CP Vehicle Engineering 96,439 54, , , , , ,480 Manager, CP Rail Systems 112, , , , , ,521 Manager, In-Street Projects 104, , , , ,605 Manager, Quality Assurance 98, , , , ,061 Manager, Guideway 98, ,389 96,909 99, ,202 Manager, FTA & CP Programs 116, ,616 41,604 99, ,849 Manager, Stations 96, ,760 98,338 98, ,626 Manager, Real Property 95,543 90, ,559 94,375 95, ,870 Manager, Cost Estimating 87, ,135 90,920 92, ,015 Manager, Powell-Division 96,120 96, ,539 56,530 92, ,260 Manager, Community Affairs 81, ,419 83,325 83, ,762 Manager, CAD 98, ,389 81,264 81, ,517 Agency Architect 108, , , , ,362 Engineer, Structural - Agency 105, , , , ,290 Senior Program Scheduler 102, , , , ,244 Cost Estimator II 72, ,913 74,024 74, ,234 Cost Estimator 62, ,139 34,125 58, ,500 Senior Project Manager, CP Vehicles 93, ,199 95,010 95, ,321 Senior Project Manager, CP Construction 88, ,222 91,416 92, ,850 Project Manager, CP Systems 279,959 92, , ,013 96, ,428 Project Manager, CP Construction 267, ,497 78, ,303, ,474 82, ,932 Assistant Project Manager, CP Rail Signals 71, ,878 74,605 76, ,094 Assistant Project Manager, CP Vehicles 69, , ,831 72, ,353 Assistant Project Manager, CP Construction 68, , ,558 74, ,404 Assistant Project Manager, CP Construction 66, ,526 51,160 84, ,601 Building/Arch Project Delivery Lead 75, ,271 78,210 78, ,852 Engineer I 108,918 17,620 Administrator, Public Arts 78,269 83, ,647 85,330 85, ,613 CP-6
215 BUD1 Personnel Services DEVELOPMENT & OPERATIONS SUPPORT 14/15 15/16 16/17 16/17 17/18 Actual Actual Budget Est Budget Position Title Total Total Base Pos Total Total Base Pos Total Analyst, Business Systems $ 83, $ 114,085 $ 49,143 Supervisor, Cost 69, ,255 72,658 $ 73, $ 73,780 Specialist, Project Control 60, ,912 63,257 64, ,300 Specialist, Administrative $ 44,957 $ 47,256 48, , ,076 49, ,806 Specialist, Administrative 47,198 50, ,003 Assistant, Administrative 42, ,838 30,883 45, ,565 Assistant, Administrative 39, ,165 20,396 40, ,478 Specialist, Property Acquisition & Relocation 55,597 79,802 76, , ,033 79, ,302 Specialist, Safety Delivery 50,000 76, ,549 Technician, CAD 69, ,159 11,333 68, ,000 Coordinator, Quality Assurance 112,034 83, ,732 85,140 85, ,370 Coordinator, Environmental Permits 79, ,992 81,818 82, ,629 Coordinator, Operating Projects 69, ,142 70,614 70, ,862 Coordinator, Operations Administration 67, ,320 69,770 Coordinator, Project 56,641 67, ,124 70,340 Project Coordinator, CP Construction 58, ,336 59,580 59, ,750 Coordinator, Community Affairs 68, ,873 73,924 74, ,980 Specialist, Community Affairs 54, ,776 46,949 49, ,239 Graphics Designer 16,461 56, ,157 57,068 57, ,283 Specialist Communications, Senior 52, ,252 55,321 56, ,930 Planner II 38,300 69, ,720 56,031 59, ,000 Fringe Benefits 549, ,882 2,420,676 2,373,402 Workers' Compensation 18,520 8,836 10,000 14,000 Uncapitalized Labor & Fringe 443, ,192 (10,930) Limited Term Employment 196, ,845 1,484,477 Sick & Vacation/Holiday Payout 69,341 49,977 69,655 Capitalized Labor/Fringe (386,961) (1,946,404) (8,589,534) (6,768,300) (9,200,703) Total $ 1,456,761 $ 955, $ 668,947 $ 2,068, $ 1,464,298 CP-7
216 BUD2 Materials & Services CAPITAL PROJECTS - DEVELOPMENT & OPERATIONS SUPPORT Actual Actual Budget Estimate Budget % Change % of Expense Category 14/15 15/16 16/17 16/17 17/18 FY17-FY18 M & S Total Legal $ 3,368 $ 1,148 $ % Professional & Technical 390, ,001 $ 137, ,000 $ 201, % 9.53% State of Good Repair Program Consultant 45,538 24, % Willamette Trolley 20,000 20,000 30,000 30,000 45, % 2.12% Intergovernmental Transfers 164, % Contracted Maintenance - ROW Art 112,500 75, , % 5.31% Shelter Services 191, , , % 8.73% Printing Services 3, ,500 4,500 5, % 0.24% Other Services 16,877 11,994 8,000 20, % Office Supplies 3,697 4,508 7, % Equip/Furn < $5,000-Gen & Adm 3, % Shelter Materials 50,000 25, , % 5.43% Trash Containers 7,500 5, % 0.00% Bus Stop Signs/Poles , % Unreconciled Mastercard Expense 1, % Other Materials 11,418 5,029 24, % Drafting Supplies 1, ,040 1, % 0.00% Telephone 12,280 16,633 10,800 36, % Property Taxes 13,551 2,067 3,500 8,000 54, % 2.55% Dues & Subscriptions 5,186 20,585 5, % Local Travel & Meetings 7,414 17,397 30,750 28, % Education & Training 555 1, % Fines and Penalties 1, % Bid Advertising 366 2,680 1,250 3,500 3, % 0.17% Special Events Services 45,134 5, % Special Event/Rail Project Expense 40, ,022 35,000 5,000 35, % 1.65% Lease Agreements 2,000 32, % Leases 896,536 1,053,372 1,384,468 1,314,634 1,242, % 58.66% $ 1,521,455 $ 1,916,578 $ 1,960,488 $ 1,808,834 $ 2,118, % % CP-8
217 Department Summary CAPITAL PROJECTS - CAPITAL PROGRAM Actual Budget Estimate Budget % Change % of 14/15 15/16 16/17 16/17 17/18 FY17 - FY18 Dept. Total Personnel Services $ 383,293 Materials & Services Total $ 383,293 CP-9
218 BUD1 Personnel Services CAPITAL PROJECTS - CAPITAL PROGRAM 14/15 15/16 16/17 16/17 17/18 Actual Actual Budget Est Budget Position Title Total Total Base Pos Total Total Base Pos Total Director, Project Development & Permitting $ 147,715 Director, Southwest Corridor 152,501 Director, Civil Construction 148,802 Director, Program Management 146,358 Director, Community Affairs 143,851 Manager, Quality Assurance 101,911 Manager, Project Communications 90,680 Manager, Community Affairs 83,355 Specialist, Administrative 240,607 Senior Estimator 90,366 Cost Estimator 64,810 Agency Architect 112,392 Engineer V, Program Schedule 112,758 Engineer V 211,618 Engineer IV 576,900 Engineer III 529,941 Engineer II 255,173 Engineer I 59,876 Specialist, Senior CAD 70,295 Community Affairs Representative 72,358 Specialist, Communications 54,066 Coordinator, Project 69,030 Analyst, Business Systems 86,174 Coordinator, Operations Administration 69,990 Coordinator, Environmental Permits 82,271 Fringe Benefits 1,464,915 Overtime 158 Capitalized Labor/Fringe (4,855,578) Total $ 383,293 CP-10
219 BUD2 Materials & Services CAPITAL PROJECTS - CAPITAL PROGRAM Actual Actual Budget Estimate Budget % Change % of Expense Category 14/15 15/16 16/17 16/17 17/18 FY17-FY18 M & S Total Professional & Technical Total *This Department had no Materials & Services for Actual 15/16. This Page Left Intentionally Blank. CP- 11
220 Department Summary CAPITAL PROJECTS - IN-STREET TRANSIT FACILITIES DEVELOPMENT Personnel Services $ 448,352 $ 489,233 Materials & Services 146, ,990 Total $ 595,235 $ 651,223 Actual Budget Estimate Budget % Change % of 14/15 15/16 16/17 16/17 17/18 FY17 - FY18 Dept. Total CP-12
221 BUD1 Personnel Services CAPITAL PROJECTS - IN-STREET TRANSIT FACILITIES DEVELOPMENT 14/15 15/16 16/17 16/17 17/18 Actual Actual Budget Est Budget Position Title Total Total Base Pos Total Total Base Pos Total Manager, In-Street Projects $ 101,407 $ 107,436 Community Affairs Specialist 48,146 56,416 Planner II 65,033 73,088 Coordinator, Operating Projects 65,092 72,451 Engineer III 31,339 Engineer I 25,163 49,308 Fringe Benefits 120, ,888 Capitalized Labor/Fringe (8,309) (5,354) Total $ 448,352 $ 489,233 CP-13
222 BUD2 Materials & Services CAPITAL PROJECTS - IN-STREET TRANSIT FACILITIES DEVELOPMENT Actual Actual Budget Estimate Budget % Change % of Expense Category 14/15 15/16 16/17 16/17 17/18 FY17-FY18 Projects Total Shelter Services $ 111,897 $ 133,918 Shelter Materials 26,122 23,632 Trash Containers 8,864 4,440 $ 146,883 $ 161,990 CP-14
223 BUDGET PROGRESSION SCHEDULE - CAPITAL PROJECTS Actual Actual Adopted Proposed Approved Adopted 14/15 15/16 16/17 17/18 17/18 17/18 Administration $ 324,265 $ 375,469 $ 580,523 Personnel Services $ 520,716 $ 520,716 $ 571,878 77,083 94, ,124 Materials & Services 195, , ,316 $ 401,348 $ 470,297 $ 907,647 Department Total $ 716,032 $ 716,032 $ 767,194 Development & Operations Support $ 1,456,761 $ 955,633 $ 668,947 Personnel Services $ 1,564,220 $ 1,564,220 $ 1,464,298 1,521,455 1,916,578 1,960,488 Materials & Services 2,098,101 2,098,101 2,118,101 $ 2,978,216 $ 2,872,211 $ 2,629,435 Department Total $ 3,662,321 $ 3,662,321 $ 3,582,399 Capital Program $ 383,293 Personnel Services Materials & Services $ 383,293 Department Total In-Street Transit Facilities Development $ 448,352 $ 489,233 Personnel Services 146, ,990 Materials & Services $ 595,235 $ 651,223 Department Total Division Total $ 2,229,377 $ 2,203,628 $ 1,249,470 Personnel Services $ 2,084,936 $ 2,084,936 $ 2,036,176 1,745,421 2,173,396 2,287,612 Materials & Services 2,293,417 2,293,417 2,313,417 $ 3,974,799 $ 4,377,024 $ 3,537,082 Total Capital Projects $ 4,378,353 $ 4,378,353 $ 4,349,593 CP-15
224 [This Page Left Intentionally Blank] CP-16
225 CIP RESOURCES Line Actual Actual Budget Estimate Budget No. 14/15 15/16 16/17 16/17 17/18 1. State, local government & private contributions $ 1,044,467 $ 1,213,766 $ 7,179,881 $ 5,594,798 $ 5,268, Federal Transit Administration grants, programmed 6,671,969 7,216,868 7,800,161 5,126,129 51,650, Revenue Bond Proceeds 71,885,000 33,076,607 18,806,933 61,790, Operating resources dedicated for capital* 65,384,128 19,836, ,015,667 61,095,083 84,376, Total CIP Resources $ 73,100,564 $ 100,152,054 $ 157,072,316 $ 90,622,943 $ 203,085,564 * Line included for information only. Operating resources are drawn on General Fund Resources. CIP-1
226 CIP REQUIREMENTS Line Actual Actual Budget Estimate Budget % of Total No. 14/15 15/16 16/17 16/17 17/18 Requirements 1. Public Affairs Division $ 572,840 $ 2,446,312 $ 8,127,404 $ 2,505,067 $ 2,233, % 2. Safety & Security Division 2,140,636 2,592,344 8,797,560 3,547,826 20,902, % 3. Information Technology Division 4,406,141 7,629,762 13,978,046 4,216,503 12,493, % 4. Finance & Administration Division 6,263,553 16,963,036 19,927,172 2,752,752 15,456, % 5. Legal Services Division 5,000 41, , , , % 6. Operations Division 49,887,817 55,061,484 63,989,560 47,979,891 78,348, % 7. Capital Projects Division 9,824,577 15,417,277 41,952,574 29,490,311 73,226, % 8. Total CIP Requirements $ 73,100,564 $ 100,152,054 $ 157,072,316 $ 90,622,943 $ 203,085, % CIP-2
227 External External TriMet TriMet FY2018 Project Contribution Carryover Contribution Carryover Revenue Bonds Total Notes Public Affairs Division Planning & Policy Bike & Ride efare Integration $ 64,611 $ 62,815 $ 127,426 Bike to Transit Facilities 26,523 26,523 Bus On-Street Layover Investments 25,000 25,000 Downtown Layover Facility $ 81,654 9,346 91,000 State 5311 Formula East Portland Transportation to Transit: Bike parking 41,080 $ 297,387 4,702 34, ,206 Federal STP & CMAQ Westside Bike & Rides 160,000 1,044,638 40, ,071 1,360,709 State Connect Oregon V Total Planning & Policy $ 282,734 $ 1,342,025 $ 145,182 $ 237,923 $ 2,007,864 Customer Experience Customer Support Facilities & Equipment $ 55,000 $ 21,013 $ 76,013 Transit Tracker Displays 150, ,000 Total Customer Experience $ 205,000 $ 21,013 $ 226,013 Total Public Affairs Division $ 282,734 $ 1,342,025 $ 350,182 $ 258,936 $ 2,233,877 Safety & Security Division Safety, Security, Environmental Services & Transportation Training CCTV Cameras (Networked) $ 850,000 $ 227,774 $ 1,077,774 Federal Transit Security CCTV Cameras (Vehicle Borne) 2,678,941 $ 2,247,649 4,926,590 ecitation 231, ,509 MAX Intrusion Detection 119, ,557 Operator Training Equipment 125,000 50, ,000 Rail Safety Enhancements 2,000,071 1,283,293 3,283,364 Rail Yard Fence Line and Intrusion Detection 185, , ,739 Relocate TriMet Transit Police $ 9,878,978 9,878, Bond Proceeds Roadway Workers Protection Plan - Technology 100,000 62, ,000 Transit Police South Precinct Expansion 100,000 26, ,881 Vehicle Intrusions 240, ,000 Total Safety, Security, Environmental Services & Transportation Training $ 850,000 $ 5,657,686 $ 4,515,728 $ 9,878,978 $ 20,902,392 Total Safety & Security Division $ 850,000 $ 5,657,686 $ 4,515,728 $ 9,878,978 $ 20,902,392 CIP-3
228 External External TriMet TriMet FY2018 Project Contribution Carryover Contribution Carryover Revenue Bonds Total Notes Information Technology Division Information Technology Alerts $ 53,337 $ 53,337 ATP Information Systems (BDS) $ 131, ,250 Bus Dispatch Replacement 3,881,370 3,881,370 Communication Environment Replacement 140, , ,446 Control Tools 39,961 39,961 Data Communications - Cable Plant 130, , ,218 Data Communications Systems Replacement 874, , ,063 Desktop Computing Replacement 612, ,855 Exchange 2010 Upgrade 110, ,942 Field Operations Coordinators Event Planning 3,150 3,150 MMIS Data Devices for REM and FM 185, ,785 Office 2016 Updgrade 25,000 25,000 Open Trip Planner $ 349,000 $ 365,000 40, , ,288 Federal Section 5312/Metro/Local Oracle Inventory Impl. & Parts Catalog 129, , ,482 IT Security Systems Replacement 70,000 70,000 Rail Operations Optimization Technology (ROOT) 73,037 2,270,005 2,343,042 Radio & Microwave Communication Equipment 10,000 77,975 87,975 Radio Tower Battery Backup Replacement 60,000 60,000 Servers Replacement 897, ,000 1,397,500 Turn by Turn Navigation 508, ,546 Voice Systems Replacement 40,000 40,000 Total Information Technology $ 349,000 $ 365,000 $ 3,979,375 $ 7,799,835 $ 12,493,210 Total Information Technology Division $ 349,000 $ 365,000 $ 3,979,375 $ 7,799,835 $ 12,493,210 Finance & Administration Division Budget & Grants Administration TAM - Transit Asset Management $ 500,000 $ 397,435 $ 897,435 Total Budget & Grants Administration $ 500,000 $ 397,435 $ 897,435 Fare Revenue Communications Equipment Replacement $ 43,500 $ 43,500 Electronic Fare System $ 14,515,456 14,515, /2017 Bond Proceeds Total Fare Revenue $ 43,500 $ 14,515,456 $ 14,558,956 Total Finance & Administration Division $ 500,000 $ 440,935 $ 14,515,456 $ 15,456,391 Legal Services Division Legal Services Information Governance Initiative $ 425,000 $ 425,000 Total Legal Services $ 425,000 $ 425,000 Total Legal Services Division $ 425,000 $ 425,000 CIP-4
229 External External TriMet TriMet FY2018 Project Contribution Carryover Contribution Carryover Revenue Bonds Total Notes Operations Division ATP-LIFT ATP Shop Equipment $ 45,000 $ 40,000 $ 85,000 LIFT Automated Customer Information $ 89, ,000 10, ,000 State STF Discretionary ATP Fleet Expansion/Replacement $ 1,051,915 1,981, ,093 3,709,919 State 5310 Formula Total ATP-LIFT $ 1,051,915 $ 89,730 $ 2,226,911 $ 726,363 $ 4,094,919 Commuter Rail WES ROW Maintenance Project (Track) $ 858,587 $ 945,539 $ 1,804,126 WES Vehicle & Shop Equipment Replacement 237, , ,342 Total Commuter Rail $ 1,096,462 $ 1,167,006 $ 2,263,468 Bus Maintenance 15 Expansion Low Floor 40' Buses (FY2018 order) $ 7,790,967 $ 7,790, Bond Proceeds 42 Replacement 40' Buses (FY2018 order) $ 2,877,416 18,172,421 21,049,837 Federal Section 5339(a)/2017 Bonds 33 Replacement Low Floor 40' Buses (FY2017 order) $ 449, ,591 Bus Shop Equip Repl/Repair > $5,000 $ 505, , ,327 Non-Revenue Vehicles > $5,000 1,987, ,000 2,387,651 Storeroom Master Plan, Reonovations & Equipment 285,000 97, ,400 Total Bus Maintenance $ 2,877,416 $ 2,777,978 $ 1,196,991 $ 25,963,388 $ 32,815,773 CIP-5
230 External External TriMet TriMet FY2018 Project Contribution Carryover Contribution Carryover Revenue Bonds Total Notes Operations Division (continued) Facilities Management Blue & Red Line Stations Tactile Pavers Replacement (ADA) $ 428,522 $ 44,287 $ 472,809 Buildings Exterior Painting 247,135 90, ,535 Buildings Interior Painting 887, ,413 Bus Maintenance Bathrooms Refurbishment 1,181,260 1,181,260 Bus Maintenance Lunch Rooms Refurbishment 234, ,620 Bus Maintenance Window Systems Replacements 1,032, ,483 1,680,609 Center Admin Cooling Tower/ Reserve Replacement 472, ,104 Center Admin Money Room & Spotter Shack 46,744 46,744 Center Maintenance Supervisor Office & Unit Remodel/Relocation 658, ,250 Center Street Bike Shelter Replacement 72,097 72,097 Cleveland Crew Room Renovation 364,002 $ 2,599,069 2,963, Bond Proceeds Elevator End of Life Program 1,316,659 1,703,401 3,020,060 Elmonica M4E Utility Relocation 73,890 73,890 Elmonica Maint. - Add Restroom Capacity 39,616 39,616 Elmonica Shop Railing Repainting 59,100 59,100 End-of-Route Permanent Operator Restroom 417, ,338 Facilities Components Replacements & Improvements 1,328,075 67,186 1,395,261 Facility System Remodel 171, ,451 Gateway ATC Vehicle Access Gate Replacement 2,853 2,853 Gateway Garage Stairwell Security Enclosure 61,118 61,118 Heavy Concrete Maintenance Program 200, ,000 HVAC Elmonica East Shop Air - Heat Improvements 268, ,240 HVAC Elmonica Shop Welding Area Ventilation 134, ,800 Jackson Terminus Landscape Rehab 7,500 7,500 MAX Platform RP Valve Retrofits 179,725 46, ,201 Merlo Transportation Interior Refurbishment 158, ,157 Nela HVAC Control Replacement 455, ,312 Platform Non-Skid Vault Lids Replacement 47,655 47,655 Platform End of Life Refurbishing 60,000 60,000 Powell LIFT Relocation 926,035 8,365,807 9,291, Bond Proceeds Powell Master Plan 2,649,730 4,014,813 6,664,543 Ruby Junction Exterior Lighting Improvements 156, ,590 TriMet Ticket Office Upgrades 94,245 94,245 Washington Park - Finishes & Landscaping 681, ,796 Washington Park Station Water Intrusion Analysis 187, ,350 WES Facility Stormwater Quality Compliance 47,959 47,959 Total Facilities Management $ 11,526,423 $ 10,438,090 $ 10,964,876 $ 32,929,389 CIP-6
231 External External TriMet TriMet FY2018 Project Contribution Carryover Contribution Carryover Revenue Bonds Total Notes Operations Division (continued) Rail Maintenance of Way MAX System Improvement Project $ 104,000 $ 104,000 MOW Electrification & Signals $ 1,110,000 1,110,000 MOW Track & Structures Replacement 1,880, ,500 2,241,500 MOW - Tools, Vehicle, Equipment 428, ,655 MOW Equipment <$5,000 51,662 51,662 Total Rail Maintenance of Way $ 3,470,317 $ 465,500 $ 3,935,817 Rail Equipment Maintenance Light Rail Shop Equipment $ 1,967,318 $ 1,967,318 Rail Maintenance Equipment 341, ,803 Total Rail Equipment Maintenance $ 2,309,121 $ 2,309,121 Total Operations Division $ 3,929,331 $ 89,730 $ 23,407,212 $ 13,993,950 $ 36,928,264 $ 78,348,487 Capital Projects Division Development & Operations Support ADA Requirements/Enhancements $ 155,871 $ 155,871 Center Street Campus Master Plan $ 64,063 64,063 Barbur-99W Corridor Safety & Access to Transit $ 239,805 $ 23,571 90, ,805 ODOT/Local Blue Line Station Rehab 3,454, ,692 3,746,032 Bus On-Street Related Maintenance 100,000 68, ,920 Bus Stop Development 800, ,000 Division Transit Project 7,673,854 2,589,170 10,263,024 CMAQ/ODOT/Local Highway 8 Corridor Safety & Access to Transit 196, ,770 Hogan Operations Facility $ 467, , Bond Proceeds MAX Red Line Extension to Fairplex 579, , ,748 Low-No Zero Emission Bus Project 1,700, ,000 2,000,000 Federal Section 5339(c)/Local Portland-Milwaukie Light Rail Project 23,801,300 23,801,300 Federal Section 5309 New Starts Positive Train Control 2,700, ,851 2,987,851 Powell-Division Corridor Safety & Access to Transit 83, ,303 9, ,128 1,088,000 Federal STP Rail Reliability - LRT System Improvements 4,065,232 1,187,577 5,252,809 Southwest Corridor Project 15,000,000 87, , ,980 16,499,874 CMAQ Steel Bridge Transit Improvements 846,772 1,376,125 2,222,897 WES RDCs 1,650,000 1,650,000 Willamette Shore Trolley 208, , ,428 Local Total Development & Operations Support $ 48,498,918 $ 1,211,919 $ 18,225,520 $ 4,822,035 $ 467,815 $ 73,226,207 Total Capital Projects Division $ 48,498,918 $ 1,211,919 $ 18,225,520 $ 4,822,035 $ 467,815 $ 73,226,207 Total CIP Requirements $ 53,909,983 $ 3,008,674 $ 52,544,975 $ 31,831,419 $ 61,790,513 $ 203,085,564 CIP-7
232 CIP - PUBLIC AFFAIRS Actual Actual Budget Estimate Budget % Change % of Expense Category 14/15 15/16 16/17 16/17 17/18 FY17-FY18 Projects Total Bike & Ride efare Integration $ 64,610 $ 1,795 $ 64, % 2.89% Bike Parking Modernization: Strategic Update $ 172,416 $ 264, % Bike Parking: East Portland Active Transport. 45, % Bike to Transit Facilities 16,315 26,041 25,750 25,750 26, % 1.19% Bus On-Street Layover Investments 50, % 0.00% Customer Support Facilities & Equipment 42, ,096 55,000 33,987 55, % 2.46% Downtown Layover Facility 1,897 91, % East Portland Access to Employment & Ed. 1,556, % 0.00% LED Digital Display Replacement 150, % 0.00% Orenco Bike & Ride 45,797 42, % Powell-Division Corridor 297,621 1,617,237 3,400,000 1,825, % 0.00% Transit Tracker Displays 2,888 95, , % Westside Bike & Rides 40, ,216 1,215,576 54, , % 8.95% 0.00% Carryover: 0.00% Bike & Ride efare Integration 62, % Bike Parking: East Portland Active Transport. 400,000 68, , % 14.84% Bus On-Street Layover Investments 25, % Customer Support Facilities & Equipment 21, % East Portland Access to Employment & Ed. 178, % 0.00% LED Digital Display Replacement 175, % 0.00% Transit Tracker Displays 557, , % 0.00% Westside Bike & Rides 300, ,000 1,160, % 51.97% $ 572,840 $ 2,446,312 $ 8,127,404 $ 2,505,067 $ 2,233, % % CIP-8
233 CIP - SAFETY & SECURITY Actual Actual Budget Estimate Budget % Change % of Expense Category 14/15 15/16 16/17 16/17 17/18 FY17-FY18 Projects Total All Facilities Maintenance Environmental $ 57,712 $ 132,011 $ 331,190 $ 331, % 0.00% CCTV Cameras (Networked) 1,000, , , ,523 $ 1,077, % 5.16% CCTV Cameras (Vehicle Borne) 1,497,299 2,365, ,993 2,678, % 12.82% E-Citation 44,096 29, , % 0.00% MAX Intrusion Detection System 21, % Merlo UST Replacement 300,984 1, % Operator Training Equipment 125, % Orenco Station Platform - Ped. Crossing Imps. 446,971 70, % Rail Safety Enhancements 70, ,593 2,000, ,149 2,000, % 9.57% Rail Yard Fence Line and Intrusion Detection 5, , , % 0.89% Relocate TriMet Transit Police 306, ,641 9,878, % 47.24% Roadway Workers Protection Plan - Technology 5, , , % 0.48% Safety Tracking Software 37,582 42, % See Something Say Something App 90, % 0.00% Storm Water UIC Permit 39,270 46,410 60,000 62, % 0.00% System Security Improvements 99,727 12, % TRACS - Door & Gate Readers 43,420 55,298 30,000 30, % 0.00% Transit Police South Precinct Expansion 19,100 48,269 21, , % 0.48% Vehicle Intrusions 240, % Willow Creek Security Improvements 41, % 0.00% Carryover: 0.00% All Facilities Maintenance Environmental 25,000 25, % 0.00% CCTV Cameras (Networked) 164, , % 0.00% CCTV Cameras (Vehicle Borne) 259, ,000 2,247, % 10.75% E-Citation 119,982 2, , % 1.11% MAX Intrusion Detection System 199,000 79, , % 0.57% Operator Training Equipment 50, % Rail Safety Enhancements 628, ,500 1,283, % 6.14% Rail Yard Fence Line and Intrusion Detection 240,000 93, , % 2.37% Roadway Workers Protection Plan - Technology 125,000 52,473 62, % 0.30% See Something Say Something App 133, % 0.00% Transit Police South Precinct Expansion 26, % Willow Creek Security Improvements 250, , % 0.00% $ 2,140,636 $ 2,592,344 $ 8,797,560 $ 3,547,826 $ 20,902, % % CIP-9
234 CIP - INFORMATION TECHNOLOGY Actual Actual Budget Estimate Budget % Change % of Expense Category 14/15 15/16 16/17 16/17 17/18 FY17-FY18 Projects Total Alerts $ 53, % ATP-LIFT MDT Dispatch & Communication System $ 95,008 $ 49, % Bus Dispatch Replacement 1,996,207 4,818,509 $ 7,385,000 $ 1,431, % 0.00% Communication Environment Replacement 131, , ,250 58, , % 1.12% Control Tools 39, % Data Communications - Cable Plant 60,455 44, , , % 1.04% Data Communications Systems Replacement 682, , , , , % 7.00% Desktop Computing Replacement 433, , , , , % 4.91% Digital Sign CPU Retrofit 95, % Exchange 2010 Upgrade 110, , , % 0.89% Field Operations Coordinators Event Planning 3,000 3,000 3, % 0.03% IT Security Systems Replacement 85,409 83,082 70, % MMIS Data Devices for REM and FM 109, % 0.00% MMIS Data Devices for REM and FM (capitalized labor) 74,956 48,331 86,680 23, , % 1.49% Office 2016 Upgrade 516, , % 0.00% Open Trip Planner 62, , % Operator Self Service (capitalized labor) 10, % Oracle Inventory Impl. & Parts Catalog 26, , , % 1.04% POS/POD Reduced Fare (capitalized labor) 57, % Radio & Microwave Communication Equipment 249,289 77,834 10,000 10, % 0.08% Radio Tower Battery Backup Replacement 60, % Rail Operations Optimization Technolgoy (ROOT) 1,067,360 73, % 0.58% Self Service Manager 69,930 2, % Servers Replacement 168, , , , % 7.18% Single Sign-On 6, % TimeClock Replacement 30, % Turn by Turn Navigation 508, % Voice Systems Replacement 130, ,800 40,000 40,590 40, % 0.32% CIP-10
235 CIP - INFORMATION TECHNOLOGY Actual Actual Budget Estimate Budget % Change % of Expense Category 14/15 15/16 16/17 16/17 17/18 FY17-FY18 Projects Total Carryover: ATP-LIFT MDT Dispatch & Communication System $ 150,000 $ 18,750 $ 131, % 1.05% Bus Dispatch Replacement 3,881, % Communication Environment Replacement 196, % Data Communications - Cable Plant 94,255 7, , % 1.90% Data Communications Systems Replacement 60,000 60, , % 0.81% Office 2016 Upgrade 25, % Open Trip Planner 510, % Oracle Inventory Impl. & Parts Catalog 99,852 83, , % 1.87% Radio & Microwave Communication Equipment 200, ,191 77, % 0.62% Rail Operations Optimization Technolgoy (ROOT) 1,265,576 62,931 2,270, % 18.17% Servers Replacement 500, , , % 4.00% $ 4,406,141 $ 7,629,762 $ 13,978,046 $ 4,216,503 $ 12,493, % % CIP-11
236 CIP - FINANCE & ADMINISTRATION Actual Actual Budget Estimate Budget % Change % of Expense Category 14/15 15/16 16/17 16/17 17/18 FY17-FY18 Projects Total Asset Management $ 2,831 $ 800,000 $ 402, % 0.00% Budget Module 394, , , % 0.00% Electronic Fare System $ 6,036,766 15,400,556 4,045,725 $ 695, % 4.50% Fare Equipment Replacement 53,554 43, % 0.00% Finance & Admin Sys/Agency Copier Cap Lease 177, % Finance/Procurement Digital Imaging System 7, % MAX Validators Replacement 45,600 15,900 15, % 0.00% Office Equipment 126,942 17, % Reorder Point Planning (23,750) 0.00% TAM - Transit Asset Management 500, % TriMet Ticket Office Point of Sale Upgrade 7, % TVM Conduit Replacement 148, % TVM Pedestals 836, % TVM System - Sensitive Info. Security 19, % 0.00% Carryover: 0.00% Asset Management 300, , , % 2.57% Budget Module 30,000 30, % 0.00% Electronic Fare System 13,666,747 1,581,768 13,820, % 89.42% Fare Equipment 43, % TVM Pedestals 627, % 0.00% $ 6,263,553 $ 16,963,036 $ 19,927,172 $ 2,752,752 $ 15,456, % % CIP-12
237 CIP - LEGAL SERVICES Actual Actual Budget Estimate Budget % Change % of Expense Category 14/15 15/16 16/17 16/17 17/18 FY17-FY18 Projects Total Information Governance Initiative $ 5,000 $ 41,839 $ 170,000 $ 593 $ 425, % % Carryover: Information Governance Initiative 130, , % 0.00% $ 5,000 $ 41,839 $ 300,000 $ 130,593 $ 425, % % CIP-13
238 CIP - OPERATIONS Actual Actual Budget Estimate Budget % Change % of Expense Category 14/15 15/16 16/17 16/17 17/18 FY17-FY18 Projects Total Additional CAD/AVL Equipment $ 556, % Asphalt Pavement Maintenance Program $ 212,200 $ 132, % 0.00% ATP Fleet Expansion/Replacement 2,343,531 $ 4,721,117 3,274,773 2,598,680 $ 3,033, % 3.87% ATP NW Nela Maintenance 21, % ATP Shop Equipment 22,000 45, % 0.06% Blue & Red Line Stations Tactile Pavers Replacement (ADA) 143,006 78, , % 0.55% Building Area & Components Layover 25,163 15, % Building Area/Components Replacement 138, , , % Buildings Interior Painting 150, , % 1.13% Bus Hoist Replacements 424, ,953 1,532, , % 0.00% Bus Maintenance Bathrooms Refurbishment 1,181, % Bus Maintenance Lunch Rooms Refurbishment 234, % Bus Maintenance Window Systems Replacement 666,400 17,917 1,032, % 1.32% Bus Shop Equip Repl/Repair > $5, ,838 77, , , , % 0.64% Bus Transit Center and Park & Rides Maintenance 2, % Center Admin Cooling Tower/Reserve Replacement 524,493 52, % 0.00% Center Admin Money Room & Spotter Shack 150, , % 0.00% Center HVAC Make-Up Air Unit 3 Replacement 56, % 0.00% Center Maint Battery Room Ventilation 138,193 70, % Center Maintenance - Operations Projects 149, % Center Maintenance Supervisor Office & Unit Remodel/Relocation 658, % Center Street Bike Shelter Replacement 11,016 69, % 0.00% Center Street Maintenance NRV Roof 78,000 78, % 0.00% Cleveland Crew Room Renovation 38, , ,998 2,599, % 3.32% Concession Services Development - Beaverton 17, % Electrical Equipment & System Replacements % Elevator End of Life Program 2 471,383 1,618,075 1,316, % 1.68% Elmonica Facility Non-Environmental 207,643 6, % Elmonica M4E Utility Relocation 73, % Elmonica Maint. - Add Restroom Capacity 39, % Elmonica Shop Railing Repainting 59, % End-of-Route Permanent Operator Restroom 23,841 75, ,000 82, % 0.00% Facilities Components Replacements & Improvements 1,511,084 1,343,743 1,328, % 1.70% Facilities Industrial Process Evaluation 80, % 0.00% Facility System Remodel 15, , % Fixed Route: 4 Replacement Hybrid 40' Buses (spare parts) 2,852, , , % 0.00% Fixed Route: Expansion Fixed Route Buses (Enhancement) 5,925,131 5,925,131 7,790, % 9.94% Fixed Route: Expansion Low Floor Buses - Cap./Rel. (FY17) 3,037,088 3,037, % 0.00% CIP-14
239 CIP - OPERATIONS Actual Actual Budget Estimate Budget % Change % of Expense Category 14/15 15/16 16/17 16/17 17/18 FY17-FY18 Projects Total Fixed Route: Fleet Expansion/Replacement $ 36,273, % Fixed Route: Replacement Low Floor 40' Buses $ 16,142,205 $ 15,692,614 $ 21,049, % 26.91% Fixed Route: Replacement Low Floor Buses (FY15 order) $ 39,134, % Gateway Garage Stairwell 61, % Gateway TC Vehicle Access Gate Replacement 35,075 32, % 0.00% Green Line Platforms Trash Receptacle Additions 193,500 85, % 0.00% Heavy Concrete Maintenance Program 200, % Hollywood Paving Project 33,299 15, % HVAC Elmonica East Shop Air - Heat Improvements 25, , % 0.34% HVAC Elmonica Shop Welding Area Ventilation 134, % HVAC Equipment & Systems Replacement 205,477 1,082, % Jackson Terminus Landscape Rehab 31, , % LIFT Automated Customer Information 100, , % 0.26% Lifting Equipment & Systems Replacement 95,212 97, % Light Rail Shop Equipment 166,020 52, , ,854 1,967, % 2.51% Light Rail Stations P&R, TC Maintenance (Park & Rides) 37, % Light Rail Stations P&R, TC Maintenance (Station Platforms) 68, % Light Rail Stations P&R, TC Maintenance (Transit Centers) 4,960 21, % Mall Shelters Maintenance ,034 8, % 0.00% MAX Platform RP Valve Retrofits 50,000 3, , % 0.23% Merlo Admin - Operations Projects % Merlo Maintenance - Operations Projects 12, % MOW - Tools, Vehicle, Equipment 428, % MOW Electrification & Signals 345, ,254 1,522,000 1,122,000 1,110, % 1.42% MOW Equipment <$5,000 51, % MOW Track & Structures Replacement 3,209,384 3,001,407 5,478,570 4,717,070 1,880, % 2.40% Mt. Scott Antenna Backup Power Supply & Bldg Rehab 16, ,500 34, % 0.00% Nela HVAC Control Replacement 471,700 16, % 0.00% Nela Roof Replacement 570, , % 0.00% Nela Tenant Improvements 5, % Non-Revenue Vehicles > $5, ,580 1,371, , ,020 1,987, % 2.54% Operator Training Equipment 327, % Other Building Systems & Equipment 43, , % Platform End of Life Refurbishing 60, % Platform Non-Skid Vault Lids Replacement 64,000 16, % 0.00% Powell Facility - Non-Environmental 27, % Powell LIFT Relocation 1,500, ,965 8,365, % 10.68% Powell Master Plan 229,163 4,500, ,110 2,649, % 3.38% Powell-Refurbish OPS (admin, bullpen, restrooms) 18, % CIP-15
240 CIP - OPERATIONS Actual Actual Budget Estimate Budget % Change % of Expense Category 14/15 15/16 16/17 16/17 17/18 FY17-FY18 Projects Total Rail Maintenance Equipment $ 17,874 $ 215,721 $ 203,975 $ 93,375 $ 341, % 0.44% Rail Maintenance of Way - Tools, Vehicle, Equipment 96,578 44,825 24,313 24, % 0.00% Rail MOW equipment Acquisition <$5,000 25,000 25, % 0.00% Ruby Junction Exterior Lighting Improvements 156, % Ruby Junction Hughes Building Reuse % Ruby Junction MOW Training Module 290,128 14, % Ruby Junction Non-Environmental 93, % Ruby North Mezzanine Gates 47, ,079 59, % 0.00% Shop Modifications for Type 4 Rebuilds 500, , % 0.00% Site-Property Systems 285, , % Steel Bridge Electrical Rehab 759,627 1,176,948 1,292, % 0.00% Steel Bridge Improvements 65, % Storeroom Renovations and Equipment 53, , , , % 0.36% Strategic Asset Management (Facilities) 56,648 1, % Sunset Transit Center - Platform Pavers Replacement 1,071, % TEI & Master Plan - New Construction 22, % TriMet Ticket Office Upgrades 94, % Washington Park - Station Finishes & Landscaping 4,148 70,690 1,588, , % 0.00% Washington Park Station Water Intrusion Analysis 187, % WES DMU Fleet Increase (2 additional) % WES Facility Stormwater Quality Compliance 47, % WES ROW Maintenance Project (Track) 249,863 1,105, , , % 1.10% WES Vehicle & Shop Equipment Replacement 30, , , , % 0.30% WSL - Trolley Fund 80, % 0.00% Carryover: 0.00% 33 Replacement Low Floor 40' Buses (FY2017 order) 957, , , % 0.57% 4 Replacement Hybrid 40' Buses (FY2015 order) 50,494 50, % 0.00% ATP Fleet Expansion/Replacement 676, % ATP Shop Equipment 35,000 17,000 40, % 0.05% Blue & Red Line Stations Tactile Pavers Replacement (ADA) 44, % Building Exterior Painting 60,000 40,914 90, % 0.12% Bus Hoist Replacements 220, , % 0.00% Bus Maintenance Window Systems Replacement 648, % Bus Shop Equip Repl/Repair > $5, , % Center Admin Cooling Tower/Reserve Replacement 472, % Center Admin Money Room & Spotter Shack 46, % Center Street Bike Shelter Replacement 10,000 7,140 72, % 0.09% Cleveland Crew Room Renovation 364, % CIP-16
241 CIP - OPERATIONS Actual Actual Budget Estimate Budget % Change % of Expense Category 14/15 15/16 16/17 16/17 17/18 FY17-FY18 Projects Total Elevator End of Life Program $ 600,000 $ 514,674 $ 1,703, % 2.17% End-of-Route Permanent Operator Restroom 175, , , % 0.53% Facility System Remodel 383, , , % 0.22% Facilities Components Replacements & Improvements 67, % Gateway TC Vehicle Access Gate Replacement 2, % Jackson Terminus Landscape Rehab 15,000 7,500 7, % 0.01% LIFT Automated Customer Information 100, % MAX Platform RP Valve Retrofits 46, % MAX System Improvement Project 150,000 46, , % 0.13% Merlo Admin Interior Refurbish 335, , , % 0.20% MOW Electrification & Signals 250, , % 0.00% MOW Track & Structures Replacement 400, , , % 0.46% Mt. Scott Antenna Backup Power Supply & Bldg Rehab 260, , % 0.00% Nela HVAC Control Replacement 455, % Nela Tenant Improvements 24,800 23, % 0.00% Non-Revenue Vehicles > $5,000 1,295,909 1,295, , % 0.51% Operator Training Equipment 50, % 0.00% Oregon City Transit Center 25, % 0.00% Platform Non-Skid Vault Lids Replacement 47, % Powell LIFT Relocation 926, % Powell Master Plan 220, ,000 4,014, % 5.12% Ruby North Mezzanine Gates 50,000 50, % 0.00% Storeroom Renovations and Equipment 97, % Washington Park - Station Finishes & Landscaping 369, , , % 0.87% WES ROW Maintenance Project (Track) 111, , , % 1.21% WES Vehicle & Shop Equipment Replacement 221, % $ 49,887,817 $ 55,061,484 $ 63,989,560 $ 47,979,891 $ 78,348, % % CIP-17
242 CIP - CAPITAL PROJECTS Actual Actual Budget Estimate Budget % Change % of Expense Category 14/15 15/16 16/17 16/17 17/18 FY17-FY18 Projects Total ADA Requirements/Enhancements $ 107,857 $ 155,345 $ 79,056 $ 155, % 0.21% Barbur-99W Corridor Safety & Access to Transit 154,000 40, , % 0.33% Blue Line Station Rehab $ 120,136 4,156,576 2,212,221 2,041,036 3,454, % 4.72% Bus On-Street Related Maintenance 51, , ,000 31, , % 0.14% Bus Shelter Replacement 48,338 86, , , % 0.00% Bus Stop Development 800, % Center Street Administration Refurbish 791,751 1, % Center Street Campus Master Plan 167, , % 0.00% Division Transit Project 10,263, % Eastside MAX Projects 1,587, , % Gresham Central Landscape/Hardscape Remodel 2, % Highway 8 Corridor Safety & Access to Transit 23, ,000 1, % 0.00% Hogan Operations Facility 131, , , , % 0.64% Kellogg Pedestrian Bridge 698, , % Lake Oswego DEIS/IGA 67,608 23, % Land Acquisition 326, % Lloyd District Transit Hub 8,656 5,938 4, % Low-No Zero Emission Bus Project 27,962 2,000, % MAX Red Line Extension to Fairplex 664, ,000 57, , % 0.79% Misc Artwork Installation 26, % Moving Together Costs % MOW Central Shop - Trolley Barn 1,294,267 1,025,662 5, % Neighborhood Shelter Replacements 35, ,505 (38,405) % 0.00% Neighborhood Shelters Refurbishment 134, , % On-Board Energy Storage Units 16, % Park & Ride Signage and Shared Use Support 5,752 7,121 25,000 19, % 0.00% Pedestrian Crossing Upgrades (Gresham LRV) 8, % Portland-Milwaukie Light Rail Project 26,873,400 19,359,341 23,801, % 32.50% Positive Train Control 3,383,693 5,479, , ,149 2,700, % 3.69% Powell-Division Corridor Safety & Access to Transit 1,080,000 85,569 93, % 0.13% CIP-18
243 CIP - CAPITAL PROJECTS Actual Actual Budget Estimate Budget % Change % of Expense Category 14/15 15/16 16/17 16/17 17/18 FY17-FY18 Projects Total Rail Reliability - LRT System Improvements $ 1,680,000 $ 492,423 $ 4,065, % 5.55% Ruby Junction Building Reuse $ 71,491 $ 464,185 42, % SE Tacoma Bridge 656, , % Southwest Corridor Project 197,300 1,098,341 3,200,000 2,675,462 15,975, % 21.82% Steel Bridge Transit Improvements 349, , , , % 1.16% WES DMU Fleet Increase (2 additional) 3, ,650, % Willamette Shore Trolley 309, , , % 0.00% 0.00% Carryover: 0.00% ADA Requirements/Enhancements 57,000 57, % 0.00% Barbur-99W Corridor Safety & Access to Transit 114, % Blue Line Station Rehab 532, , , % 0.40% Bus On-Street Related Maintenance 68, % Center Street Campus Master Plan 64, % Highway 8 Corridor Safety & Access to Transit 196, % Hogan Operations Facility 871, , % 0.00% MAX Red Line Extension to Fairplex 160, , , % 0.33% Neighborhood Shelters Refurbishment 15,000 15, % 0.00% Positive Train Control 287, % Powell-Division Corridor Safety & Access to Transit 994, % Rail Reliability - LRT System Improvements 1,187, % Ruby Junction Building Reuse 531, , % 0.00% Southwest Corridor Project 524, % Steel Bridge Transit Improvements 442, ,000 1,376, % 1.86% Willamette Shore Trolley 166, , , % 0.94% $ 9,824,577 $ 15,417,277 $ 41,952,574 $ 29,490,311 $ 73,226, % % CIP-19
244 [This Page Left Intentionally Blank] CIP-20
245 EXTERNAL LIGHT RAIL PROGRAM RESOURCES Line Actual Actual Budget Estimate Budget No. 14/15 15/16 16/17 16/17 17/18 1. State, local government & private contributions $ 120,656,991 $ 21,245, Federal Transit Administration Grants 100,000,000 11,479, Total Light Rail Program Resources $ 220,656,991 $ 32,724,998 * Starting FY2016/2017 Light Rail Program is now reflected in the CIP. Light Rail Program-1
246 LIGHT RAIL PROGRAM REQUIREMENTS Line Actual Actual Budget Estimate Budget No. 14/15 15/16 16/17 16/17 17/18 1. Portland-Milwaukie Light Rail Project $ 181,631,270 $ 44,920, Total Light Rail Program Requirements $ 181,631,270 $ 44,920,649 Light Rail Program-2
247 Division Summary LIGHT RAIL PROGRAM Personnel Services $ 12,453,808 $ 9,302,035 Materials & Services 169,177,462 35,618,614 Total $ 181,631,270 $ 44,920,649 Actual Budget Estimate Budget % Change % of 14/15 15/16 16/17 16/17 17/18 FY17- FY18 Dept. Total Page Light Rail Program Division Summary Light Rail Program-3 Portland-Milwaukie Light Rail Project Light Rail Program-4 Light Rail Program-3
248 Department Summary LIGHT RAIL PROGRAM - PORTLAND-MILWAUKIE LIGHT RAIL PROJECT Personnel Services $ 12,453,808 $ 9,302,035 Materials & Services 169,177,462 35,618,614 Total $ 181,631,270 $ 44,920,649 Actual Budget Estimate Budget % Change % of 14/15 15/16 16/17 16/17 17/18 FY17- FY18 Dept. Total Light Rail Program-4
249 BUD- Personnel Services LIGHT RAIL PROGRAM - PORTLAND-MILWAUKIE LIGHT RAIL PROJECT 14/15 15/16 16/17 16/17 17/18 Actual Actual Budget Est Budget Position Title Total Total Base Pos Total Total Base Pos Total Managing Director, Design & Construction $ 167,613 $ 183,142 Director, Systems Engineering 164, ,135 Director, Project Development & Permitting 144,496 51,124 Director, PMLR East Segment 147,711 68,861 Director, Program Management 146, ,736 Director, Community Affairs 108,009 40,078 Director, Real Property 132,061 90,687 Manager, Civil Construction 145,403 48,025 Manager, CRC Transit 133,131 56,746 Manager, Program 121, ,466 Manager, Structural Construction 125,468 10,222 Manager, Senior Inspector 108,418 21,175 Manager, Facilities Development 43,772 Manager, Quality Assurance 106, ,730 Manager, CAD 83,737 42,071 Manager, Mitigation 77,674 Manager, Insurance Programs 80,611 Manager, Project Communications 97,397 64,620 Manager, Public Arts Program 75, ,826 Manager, Community Affairs 106,130 38,927 Manager, Cost 80,055 Specialist, Real Property 733, ,251 Specialist, Administrative 1,558, ,108 Assistant, Administrative 102,876 Senior Cost Estimator 104,001 71,057 Cost Engineer 219, ,675 Program Scheduler, Engineer V 120,472 57,102 Program Scheduling Engineer 124,151 1,345 Supervisor, Cost 71,395 Light Rail Program-5
250 BUD- Personnel Services LIGHT RAIL PROGRAM - PORTLAND-MILWAUKIE LIGHT RAIL PROJECT 14/15 15/16 16/17 16/17 17/18 Actual Actual Budget Est Budget Position Title Total Total Base Pos Total Total Base Pos Total Specialist, Project Control $ 66,675 $ 62,408 Agency Architect 106,336 61,304 Engineer V 988, ,446 Engineer IV 1,616, ,869 Engineer III 1,917, ,785 Engineer II 896, ,698 Engineer II 924, ,737 Engineer I 512, ,760 Specialist, Senior CAD 67,141 Community Affairs Representative 307, ,642 Specialist, Communications 339, ,562 Coordinator, Project Design 143,269 55,008 Coordinator, Public Art 77,692 48,254 Planner II 164,300 64,244 Analyst, Business Systems 93,122 46,366 Coordinator, Operations Administration 66,806 41,439 Specialist, System Safety 189,230 78,370 Coordinator, Environmental Permits 76,772 53,766 Director, Diversity & Transit Equity 64,096 4,806 Policy Analyst 34,768 25,126 Director, Community Affairs 30,892 60,961 Manager, Construction Safety & Risk 93,427 15,385 Administrator III, Contracts 77,143 39,355 Light Rail Program-6
251 BUD- Personnel Services LIGHT RAIL PROGRAM - PORTLAND-MILWAUKIE LIGHT RAIL PROJECT 14/15 15/16 16/17 16/17 17/18 Actual Actual Budget Est Budget Position Title Total Total Base Pos Total Total Base Pos Total Coordinator, Procurement & Admin $ 20,467 $ 12,746 HR Business Partner 102,269 64,339 Paralegal I 31,464 12,248 Senior Deputy General Counsel 295,656 Deputy General Counsel I 156,421 Bus Stop Planner/Analyst 44,586 8,819 Director, Operations Planning & Develop. 29,922 1,346 Director, Operations Support 65,684 5,000 Manager, Rail Operations Planning 80,072 31,815 Sr ITS Software Systems Eng/Arch IV-Rail 114,668 19,300 Start Up: Maintenance of Way Supervisor 101,300 40,302 Training/Engineering Supervisor 82,739 83,656 Active Regular Operator 907, ,201 Transportation Training Supervisor 58,983 53,882 LRV Operator 807, ,159 Rail Supervisor 366, ,181 Plant Maint Mechanic Apprentice 623,467 9,333 Signal Maintainer/Apprentice 214,502 6,549 Substation Maintainer/Apprentice 223,467 37,408 Power Maintainer/Apprentice 259,892 12,353 Vehicle Maintainer/Apprentice 690,983 45,313 Vehicle Cleaner/Helper 158,992 24,045 Fringe Benefits 2,756,716 3,208,825 Limited Term Employment 136,677 Uncapitalized Labor & Fringe (9,986,602) (1,991,456) Total $ 12,453,808 $ 9,302,035 Light Rail Program-7
252 BUD2 Materials & Services LIGHT RAIL PROGRAM - PORTLAND-MILWAUKIE LIGHT RAIL PROJECT Actual Actual Budget Estimate Budget % Change % of Expense Category 14/15 15/16 16/17 16/17 17/18 FY17-FY18 M & S Total Guideway and Track $ 9,445,751 $ 549,119 Stations, Stops, Terminals 13,156, ,759 Support Facilities: Yards 9,530, ,197 Sitework & Special Conditions 44,789,920 8,158,554 Systems 28,066,336 4,790,373 ROW Land Existing Improvements 2,589,256 (625,465) Vehicles 29,540,643 10,211,270 Professional Services 8,474,838 4,682,754 Interim Finance 11,650,000 2,912,500 Capital & Local Interest 5,331,580 2,228,781 Startup 6,601,932 1,610,772 Total $ 169,177,462 $ 35,618,614 Light Rail Program-8
253 Exhibit 1. Ridership and Service (Fixed Route) 1 Fiscal Boarding Rides Percent Boarding Percent Originating Rides Percent Fixed Route Percent Fixed Route Veh Hrs Percent Fixed Route Veh Hrs Percent Year (Bus, Rail, WES) Change Rides/Capita Change (Bus, Rail, WES) Change Vehicle Hrs Change (In Bus Equivalents) Change In Bus Equiv/Capita Change 73 22,080, % % 17,258, % 818, % 818, % % 74 25,480, % % 20,550, % 887, % 887, % % 75 28,360, % % 22,690, % 1,122, % 1,122, % % 76 35,210, % % 28,170, % 1,287, % 1,287, % % 77 38,080, % % 30,460, % 1,360, % 1,360, % % 78 41,570, % % 32,630, % 1,432, % 1,432, % % 79 42,250, % % 33,160, % 1,443, % 1,443, % % 80 50,670, % % 39,760, % 1,544, % 1,544, % % 81 48,090, % % 37,740, % 1,560, % 1,560, % % 82 46,930, % % 36,960, % 1,615, % 1,615, % % 83 49,360, % % 36,520, % 1,747, % 1,747, % % 84 49,680, % % 36,720, % 1,723, % 1,723, % % 85 47,400, % % 35,640, % 1,522, % 1,522, % % 86 45,120, % % 33,720, % 1,515, % 1,515, % % 87 47,880, % % 35,400, % 1,529, % 1,529, % % 88 46,560, % % 35,520, % 1,545, % 1,545, % % 89 48,600, % % 37,440, % 1,544, % 1,709, % % 90 51,541, % % 39,661, % 1,570, % 1,730, % % 91 55,031, % % 42,311, % 1,602, % 1,776, % % 92 57,172, % % 43,996, % 1,643, % 1,823, % % 93 57,198, % % 44,021, % 1,700, % 1,889, % % 94 59,148, % % 45,612, % 1,793, % 1,985, % % 95 61,188, % % 47,184, % 1,837, % 2,025, % % 96 63,912, % % 49,248, % 1,880, % 2,076, % % 97 66,780, % % 51,432, % 1,879, % 2,074, % % 98 68,952, % % 53,100, % 1,936, % 2,170, % % 99 76,309, % % 59,647, % 2,068, % 2,573, % % 00 81,237, % % 63,608, % 2,152, % 2,707, % % 01 84,946, % % 66,484, % 2,177, % 2,739, % % 02 88,633, % % 69,367, % 2,232, % 2,850, % % 03 88,863, % % 69,591, % 2,241, % 2,880, % % 04 91,071, % % 71,284, % 2,249, % 2,877, % % 05 95,826, % % 75,014, % 2,278, % 3,033, % % 06 95,736, % % 74,947, % 2,192, % 2,938, % % 07 96,918, % % 75,870, % 2,206, % 2,966, % % 08 99,098, % % 77,582, % 2,231, % 3,019, % % ,466, % % 79,437, % 2,268, % 3,110, % % 10 99,337, % % 77,769, % 2,195, % 3,213, % % ,002, % % 78,286, % 2,038, % 3,064, % % ,238, % % 80,042, % 2,032, % 3,080, % % 13 99,246, % % 78,205, % 2,026, % 3,066, % % 14 98,775, % % 75,779, % 2,083, % 3,141, % % ,711, % % 77,260, % 2,175, % 3,234, % % ,478, % % 77,179, % 2,304, % 3,515, % % 17* 103,820, % % 79,745, % 2,393, % 3,640, % % 1) Excludes Streetcar * Data is based on Adopted Budget. General-1
254 Exhibit 2. Fares and Passenger Revenue (Fixed Route) Fiscal US City Avg Percent Passenger Rev 1 Percent Pass Rev/Veh Hr Percent Average Fare Percent Base Fare All Zone Pass Rev/Sys Cst Percent Year CPI W Change (Unadj. CPI) Change (Unadj. CPI) Change (Unadj. CPI) Change All Zone Monthly Pass (Unadj. CPI) Change % $6,155, % $ % $ % 57.22% 8.5% % $6,874, % $ % $ % 51.69% 9.7% % $7,291, % $ % $ % 39.02% 24.5% % $8,191, % $ % $ % 31.92% 18.2% % $9,545, % $ % $ % 30.81% 3.5% % $10,315, % $ % $ % 28.29% 8.2% % $12,457, % $ % $ % 29.44% 4.1% % $15,538, % $ % $ % 29.96% 1.8% % $19,029, % $ % $ % 32.56% 8.7% % $18,671, % $ % $ % 28.76% 11.7% % $18,659, % $ % $ % 26.69% 7.2% % $18,011, % $ % $ % 24.62% 7.8% % $18,088, % $ % $ % 25.70% 4.4% % $18,380, % $ % $ % 27.07% 5.3% % $19,532, % $ % $ % $1.10 $ % 5.0% % $21,224, % $ % $ % $1.15 $ % 0.8% % $21,420, % $ % $ % $1.15 $ % 5.7% % $22,272, % $ % $ % $1.20 $ % 3.1% % $25,591, % $ % $ % $1.20 $ % 9.4% % $26,281, % $ % $ % $1.20 $ % 5.2% % $27,387, % $ % $ % $1.25 $ % 6.2% % $27,905, % $ % $ % $1.25 $ % 4.4% % $30,228, % $ % $ % $1.30 $ % 1.8% % $31,843, % $ % $ % $1.30 $ % 3.1% % $34,627, % $ % $ % $1.35 $ % 2.2% % $35,518, % $ % $ % $1.35 $ % 3.2% % $40,611, % $ % $ % $1.40 $ % 4.2% % $45,907, % $ % $ % $1.45 $ % 0.7% % $51,164, % $ % $ % $1.50 $ % 6.0% % $52,628, % $ % $ % $1.55 $ % 3.4% % $52,093, % $ % $ % $1.55 $ % 5.2% % $54,978, % $ % $ % $1.60 $ % 1.4% % $58,740, % $ % $ % $1.68 $ % 4.0% % $67,542, % $ % $ % $1.88 $ % 10.7% % $74,765, % $ % $ % $2.00 $ % 8.0% % $79,638, % $ % $ % $2.05 $ % 0.1% % $88,726, % $ % $ % $2.30 $ % 3.1% % $92,414, % $ % $ % $2.30 $ % 0.4% % $95,529, % $ % $ % $2.35 $ % 5.8% % $100,587, % $ % $ % $2.40 $ % 0.2% % $110,793, % $ % $ % $2.50 $ % 5.2% % $113,229, % $ % $ % $2.50 $ % 0.1% % $115,466, % $ % $ % $2.50 $ % 1.9% % $116,941, % $ % $ % $2.50 $ % 7.5% 17* % $119,615, % $ % $ % $2.50 $ % 1.2% 1) Does not include ATP passenger revenue. * Datai is based on projection and Adopted Budget General-2
255 Exhibit 3. Employer Taxes (Unadjusted CPI W) Fiscal Employer Tax Percent Employer Tax / 0.10% 2 Percent Employer Tax Percent Employer Tax Percent Self Employment Percent State In Lieu Percent Year Rate 1 Point Diff. Change (Municipal & Private) Change Per Capita Change Tax Change Tax Change % 0.000% $2,173, % $6,519, % $ % % 0.000% $2,444, % $7,333, % $ % % 0.050% $2,573, % $9,008, % $ % % 0.100% $2,759, % $12,418, % $ % % 0.050% $3,409, % $17,048, % $ % % 0.000% $3,996, % $19,984, % $ % % 0.100% $4,546, % $27,276, % $ % % 0.000% $5,479, % $32,874, % $ % % 0.000% $5,827, % $34,965, % $ % % 0.000% $6,262, % $37,574, % $ % $906, % 0.000% $6,297, % $36,123, % $ % $1,660,000 $1,000, % % 0.000% $6,687, % $38,052, % $ % $2,074, % $1,478, % % 0.000% $7,364, % $41,654, % $ % $2,533, % $1,403, % % 0.000% $7,789, % $44,022, % $ % $2,713, % $1,169, % % 0.000% $8,179, % $46,176, % $ % $2,901, % $1,479, % % 0.000% $8,811, % $49,542, % $ % $3,328, % $1,481, % % 0.013% $9,606, % $54,818, % $ % $4,021, % $1,556, % % 0.005% $10,538, % $60,452, % $ % $4,635, % $1,698, % % 0.000% $11,504, % $66,181, % $ % $4,867, % $1,923, % % 0.000% $12,108, % $69,780, % $ % $5,001, % $2,068, % % 0.000% $13,232, % $76,438, % $ % $5,282, % $2,226, % % 0.000% $14,135, % $81,948, % $ % $5,353, % $2,233, % % 0.000% $15,487, % $90,006, % $ % $5,645, % $2,342, % % 0.000% $17,209, % $100,477, % $ % $5,810, % $1,968, % % 0.000% $19,444, % $113,734, % $ % $6,355, % $1,390, % % 0.000% $20,979, % $122,866, % $ % $6,700, % $1,407, % % 0.000% $22,141, % $130,309, % $ % $6,434, % $1,470, % % 0.000% $23,315, % $137,859, % $ % $6,137, % $1,513, % % 0.002% $25,546, % $151,015, % $ % $7,247, % $1,548, % % 0.002% $24,753, % $146,531, % $ % $7,385, % $1,924, % % 0.000% $24,562, % $145,478, % $ % $7,252, % $1,869, % % 0.000% $24,713, % $146,124, % $ % $7,541, % $1,855, % % 0.002% $26,254, % $155,987, % $ % $7,917, % $1,970, % % 0.010% $28,893, % $173,786, % $ % $9,485, % $1,990, % % 0.010% $30,892, % $187,531, % $ % $11,510, % $2,259, % % 0.010% $32,286, % $200,048, % $ % $11,200, % $2,254, % % 0.010% $31,690, % $200,176, % $ % $10,340, % $2,482, % % 0.010% $30,479, % $195,006, % $ % $10,518, % $2,676, % % 0.010% $31,905, % $207,882, % $ % $10,445, % $2,659, % % 0.010% $34,300, % $226,832, % $ % $11,314, % $2,871, % % 0.010% $35,526, % $237,979, % $ % $12,400, % $2,706, % % 0.011% $37,400, % $254,805, % $ % $13,063, % $2,694, % % 0.007% $39,637, % $273,078, % $ % $13,779, % $3,202, % % 0.002% $43,009, % $297,006, % $ % $15,336, % $1,974, % 17* % 0.010% $45,497, % $318,701, % $ % $16,249, % $1,795, % 1) Based on Fiscal Year (July June) 2) Includes Employer and Self Employment Tax, effective FY00 based on cash receipts. * Data is based on Adopted Budget. General-3
256 Exhibit 4. Expenses (Fixed Route) Fiscal Operations Costs 1 Percent Ops Costs/Veh Hr Percent Bus Ops Costs/Veh Hr Percent Rail Ops Costs/Veh Hr Percent WES Ops Costs/Veh Hr Percent Year (Adj. CPI 17) Change (Unadj. CPI) Change (Unadj. CPI) Change (Unadj. CPI) Change (Unadj. CPI) Change 73 $45,957, % $ % 74 $51,152, % $ % 75 $64,263, % $ % 76 $91,315, % $ % 77 $104,713, % $ % 78 $115,884, % $ % 79 $121,630, % $ % 80 $128,946, % $ % 81 $135,810, % $ % 82 $136,078, % $ % 83 $137,560, % $ % 84 $141,110, % $ % 85 $133,579, % $ % 86 $127,025, % $ % 87 $124,836, % $ % $36.41 $ $128,306, % $ % $ % $ % 89 $130,186, % $ % $ % $ % 90 $130,362, % $ % $ % $ % 91 $130,740, % $ % $ % $ % 92 $135,776, % $ % $ % $ % 93 $143,350, % $ % $ % $ % 94 $148,711, % $ % $ % $ % 95 $158,106, % $ % $ % $ % 96 $159,300, % $ % $ % $ % 97 $164,648, % $ % $ % $ % 98 $169,294, % $ % $ % $ % 99 $206,595, % $ % $ % $ % 00 $225,289, % $ % $ % $ % 01 $228,709, % $ % $ % $ % 02 $234,052, % $ % $ % $ % 03 $241,552, % $ % $ % $ % 04 $245,898, % $ % $ % $ % 05 $268,301, % $ % $ % $ % 06 $266,913, % $ % $ % $ % 07 $266,913, % $ % $ % $ % 08 $273,327, % $ % $ % $ % 09 $273,160, % $ % $ % $ % 10 $276,383, % $ % $ % $ % $1, $258,960, % $ % $ % $ % $1, % 12 $263,508, % $ % $ % $ % $1, % 13 $271,039, % $ % $ % $ % $1, % 14 $262,397, % $ % $ % $ % $1, % 15 $268,091, % $ % $ % $ % $1, % 16 $293,296, % $ % $ % $ % $1, % 17* $303,918, % $ % $ % $ % $1, % 1) Does not include General Admin, DMAP, ATP, Streetcar cost, Intergovernmental Transfers, and Medical Plans Retired/Disabled. * Data is based on Adopted Budget. General-4
257 Exhibit 5. Fixed Route Financial Indicators Fiscal Operation Costs 1 /Boarding Ride Percent Change Operation Costs/Boarding Ride Percent Change System Costs 2 /Boarding ride Percent Change System Costs/Boarding Ride Year (Adj. CPI 17) (Adj. CPI 17) 73 $ % $ % $ % $ $ % $ % $ % $ $ % $ % $ % $ $ % $ % $ % $ $ % $ % $ % $ $ % $ % $ % $ $ % $ % $ % $ $ % $ % $ % $ $ % $ % $ % $ $ % $ % $ % $ $ % $ % $ % $ $ % $ % $ % $ $ % $ % $ % $ $ % $ % $ % $ $ % $ % $ % $ $ % $ % $ % $ $ % $ % $ % $ $ % $ % $ % $ $ % $ % $ % $ $ % $ % $ % $ $ % $ % $ % $ $ % $ % $ % $ $ % $ % $ % $ $ % $ % $ % $ $ % $ % $ % $ $ % $ % $ % $ $ % $ % $ % $ $ % $ % $ % $ $ % $ % $ % $ $ % $ % $ % $ $ % $ % $ % $ $ % $ % $ % $ $ % $ % $ % $ $ % $ % $ % $ $ % $ % $ % $ $ % $ % $ % $ $ % $ % $ % $ $ % $ % $ % $ $ % $ % $ % $ $ % $ % $ % $ $ % $ % $ % $ $ % $ % $ % $ $ % $ % $ % $ $ % $ % $ % $ * $ % $ % $ % $3.89 1) Does not includes G&A, ATP, DMAP, Streetcar, Intergovernmental Transfers costs and Medical Plans Retired/Disabled 2) Does not includes ATP, DMAP, Streetcar, and Intergovernmental Transfers costs. * Data is based on Adopted Budget. General-5
258 Exhibit 6. LIFT Revenue, Ridership, and Service* Fiscal LIFT and Cab Percent LIFT and Cab Percent LIFT and Cab Percent LIFT and Cab Operating Percent LIFT and Cab Percent Year Vehicle Hours Change Ridership Change Operating Costs Change Costs per Ride Change Revenue Change , ,963 $5,639,847 $14.07 $78, , % 415, % $6,391, % $ % $81, % , % 462, % $7,322, % $ % $83, % , % 501, % $8,486, % $ % $125, % , % 553, % $8,778, % $ % $141, % , % 613, % $9,655, % $ % $215, % , % 649, % $11,050, % $ % $272, % , % 680, % $11,913, % $ % $380, % , % 735, % $15,573, % $ % $447, % , % 781, % $14,979, % $ % $541, % , % 845, % $16,481, % $ % $564, % , % 918, % $17,797, % $ % $653, % , % 958, % $21,395, % $ % $686, % , % 1,026, % $24,050, % $ % $747, % , % 1,050, % $26,236, % $ % $971, % , % 1,084, % $28,257, % $ % $1,090, % , % 1,122, % $30,890, % $ % $1,171, % , % 1,088, % $31,020, % $ % $1,289, % , % 1,072, % $30,700, % $ % $1,314, % , % 1,063, % $30,887, % $ % $1,360, % , % 1,062, % $31,744, % $ % $1,652, % , % 1,037, % $32,094, % $ % $1,707, % , % 1,036, % $33,173, % $ % $1,365, % , % 1,042, % $33,861, % $ % $1,220, % , % 1,064, % $35,271, % $ % $1,127, % 17** 614, % 1,095, % $35,824, % $ % $1,272, % * Service provided prior to 1992 are not included. ** Data is based on Adopted Budget. General-6
259 Exhibit 7. Local Economic Trends Fiscal Tri County Percent Tri County Percent Tri County Avg Pay Wage Tri County Property Value Percent Private Tri County Percent Year Population Change Employment 1 Change (Earn/Employee) Inflation Real Market Value (RMV) Change Payroll 1 Change , % 325, % $8, % $8,313,206, % $2,874,079, % , % 333, % $9, % $9,196,563, % $3,191,334, % , % 328, % $10, % $10,205,290, % $3,366,613, % , % 341, % $11, % $11,419,557, % $3,798,781, % , % 362, % $11, % $12,612,056, % $4,304,633, % 78 1,013, % 398, % $12, % $14,027,212, % $5,098,305, % 79 1,033, % 422, % $13, % $15,897,003, % $5,904,152, % 80 1,053, % 425, % $15, % $18,620,927, % $6,510,203, % 81 1,062, % 415, % $16, % $23,637,223, % $6,850,078, % 82 1,069, % 392, % $17, % $26,136,442, % $6,839,449, % 83 1,057, % 390, % $18, % $28,624,740, % $7,029,388, % 84 1,068, % 411, % $18, % $30,559,105, % $7,695,130, % 85 1,078, % 422, % $19, % $32,953,204, % $8,115,896, % 86 1,087, % 434, % $19, % $34,835,587, % $8,644,381, % 87 1,097, % 450, % $20, % $36,354,973, % $9,258,031, % 88 1,119, % 479, % $21, % $36,811,010, % $10,290,273, % 89 1,141, % 506, % $22, % $37,535,437, % $11,296,147, % 90 1,183, % 524, % $23, % $38,864,890, % $12,394,797, % 91 1,217, % 523, % $24, % $42,338,116, % $12,990,643, % 92 1,247, % 528, % $26, % $50,366,176, % $13,899,105, % 93 1,277, % 547, % $26, % $54,907,907, % $14,768,176, % 94 1,302, % 574, % $27, % $59,984,969, % $15,986,609, % 95 1,329, % 605, % $29, % $67,435,101, % $17,681,895, % 96 1,360, % 625, % $30, % $76,091,671, % $19,362,980, % 97 1,387, % 658, % $32, % $86,216,900, % $21,553,852, % 98 1,409, % 668, % $34, % $96,630,942, % $22,808,631, % 99 1,430, % 675, % $35, % $106,703,310, % $24,262,566, % 00 1,451, % 691, % $39, % $115,941,283, % $27,087,525, % 01 1,467, % 685, % $39, % $124,350,639, % $26,868,806, % 02 1,484, % 675, % $38, % $134,835,692, % $26,236,081, % 03 1,503, % 662, % $39, % $140,814,040, % $25,967,644, % 04 1,522, % 657, % $40, % $151,236,678, % $26,886,371, % 05 1,543, % 678, % $42, % $160,154,351, % $28,514,060, % 06 1,569, % 704, % $43, % $171,753,908, % $30,813,829, % 07 1,593, % 722, % $45, % $199,710,358, % $32,574,995, % 08 1,614, % 729, % $46, % $228,449,246, % $34,237,622, % 09 1,631, % 696, % $46, % $229,798,303, % $32,725,984, % 10 1,644, % 661, % $47, % $228,377,751, % $31,586,944, % 11 1,656, % 675, % $49, % $215,824,787, % $33,760,095, % 12 1,672, % 695, % $52, % $203,907,401, % $36,183,167, % 13 1,693, % 715, % $52, % $198,870,622, % $37,274,222, % 14 1,717, % 738, % $53, % $208,548,342, % $39,746,082, % 15 1,745, % 761, % $55, % $230,675,518, % $42,411,757, % 16 1,779, % 786, % $58, % $253,349,513, % $45,669,997, % 17* 1,811, % 809, % $59, % $273,617,474, % $48,410,197, % 1) Excludes: social services, membership of organization, federal and local governments. * Data is based on projection. General-7
260 Exhibit 8. Debt and Capital Investment Fiscal Debt Service Percent Debt Service Percent Capital and Percent Year (Senior Lien)/Capita Change (Senior Lien) Change Operating Projects 1 Change $3.23 $3,416, $ % $3,728, % 85 $ % $3,859, % 86 $ % $2,206, % 87 $ % $2,775, % 88 $ % $2,522, % 89 $ % $2,517, % 90 $ % $2,473, % 91 $ % $2,610, % $18,801, $ % $2,586, % $18,390, % 93 $ % $2,424, % $23,499, % 94 $ % $3,127, % $27,258, % 95 $ % $3,084, % $44,485, % 96 $ % $4,534, % $34,362, % 97 $ % $5,235, % $16,660, % 98 $ % $5,150, % $45,786, % 99 $ % $8,450, % $53,210, % 00 $ % $6,850, % $21,380, % 01 $ % $9,417, % $37,185, % 02 $ % $10,479, % $20,221, % 03 $ % $9,357, % $33,139, % 04 $ % $10,389, % $14,912, % 05 $ % $15,228, % $6,305, % 06 $ % $13,254, % $25,516, % 07 $ % $13,489, % $9,917, % 08 $ % $12,938, % $14,294, % 09 $ % $13,060, % $35,353, % 10 $ % $14,969, % $37,178, % 11 $ % $16,917, % $37,179, % 12 $ % $16,004, % $30,950, % 13 $ % $35,768, % $58,702, % 14 $ % $36,063, % $64,571, % 15 $ % $22,390, % $73,100, % 16 $ % $18,916, % $100,152, % 17* $ % $22,876, % $109,015, % 1) Excludes Rail, and Construction Projects. * Data is based on Adopted Budget. General-8
261 Local Economic Trends FY75 FY78 FY81 Millions FY84 FY87 FY90 FY93 FY96 FY99 FY02 FY05 FY08 FY11 FY14 FY17 $60 $50 $40 $30 $20 $10 $0 Tri County Population and Employment Population Employment FY75 FY78 FY81 Billions FY84 FY87 FY90 FY93 FY96 FY99 FY02 FY05 FY08 FY11 FY14 FY17 $65,000 $55,000 $45,000 $35,000 $25,000 $15,000 $5,000 Tri County Private Payrolls FY75 FY78 FY81 FY84 FY87 FY90 FY93 FY96 FY99 FY02 FY05 FY08 FY11 FY14 FY17 Tri County Average Yearly Earnings General-9
262 FY75 FY78 FY81 FY84 FY87 FY90 FY93 FY96 FY99 FY02 FY05 FY08 FY11 FY14 FY17 Ridership 120 Millions Fixed Route Boarding Rides Millions FY92 FY93 FY94 FY95 FY96 FY97 FY98 FY99 FY00 FY01 FY02 FY03 FY04 FY05 FY06 FY07 FY08 FY09 FY10 FY11 FY12 FY13 FY14 FY15 FY16 FY LIFT and Cab Boarding Rides FY75 FY78 FY81 FY84 FY87 FY90 FY93 FY96 FY99 FY02 FY05 FY08 FY11 FY14 FY17 Fixed Route Boarding Rides per Capita General-10
263 FY75 FY78 FY81 FY84 FY87 FY90 FY93 FY96 FY99 FY02 FY05 FY08 FY11 FY14 Service 5.0 Millions FY , , , , ,000 50,000 Total Fixed Route Service Hours in Bus Equivalents and Total Fixed Route Service Hours Fixed Route Service Hrs in Bus Equivalent Fixed Route Service Hours FY92 FY93 FY94 FY95 FY96 FY97 FY98 FY99 FY00 FY01 FY02 FY03 FY04 FY05 FY06 FY07 FY08 FY09 FY10 FY11 FY12 FY13 FY14 FY15 FY16 FY17 LIFT and Cab Service Vehicle Hours General-11
264 2.6% 5.3% 4.9% 1.7% 2.8% 1.5% 0.1% 0.3% 3.9% 5.6% 3.7% 6.3% 0.8% 3.4% 2.8% 22.0% 9.0% 1.5% 2.3% 3.2% 1.8% 9.1% 0.5% 0.0% 2.4% 0.1% 1.2% 6.3% 1.8% 2.9% 3.2% 2.2% 9.4% 3.6% Expense $350 $300 $250 $200 $150 $100 $50 $0 Fixed Route Operations Cost FY84 FY87 FY90 FY93 FY96 FY99 FY02 FY05 FY08 FY11 FY14 FY17 Millions 13.3% 14.6% 15.9% 3.4% 10.0% 14.5% 7.8% 30.7% 3.8% 10.0% 8.0% 20.2% 12.4% 9.1% 7.7% 9.3% 0.4% 1.0% 0.6% 2.8% 1.1% 3.4% 2.1% 4.2% 1.6% $40 $35 $30 $25 $20 $15 $10 $5 $0 LIFT and Cab Operations Costs FY93 FY95 FY97 FY99 FY01 FY03 FY05 FY07 FY09 FY11 FY13 FY15 FY17 5.0% 2.9% 2.5% 5.6% 10.0% 1.7% 1.2% 1.1% 3.0% 8.7% 2.8% 5.8% 0.9% 1.7% 1.2% 12.1% 5.5% 0.4% 0.4% 5.2% 1.3% 6.8% 3.5% 1.2% 4.1% 1.2% 4.6% 4.8% 2.7% 7.6% 1.3% 0.6% 10.0% 1.4% Millions 9.3% 3.1% 6.7% 6.3% 0.7% 8.1% 3.0% 20.9% 9.5% 1.8% 0.6% 15.3% 5.0% 6.6% 4.3% 5.6% 3.5% 0.4% 1.4% 2.9% 3.6% 3.5% 1.5% 2.0% 1.3% $3.5 $3.0 $2.5 $2.0 $1.5 $1.0 $0.5 $0.0 Fixed Route Operations Cost per Ride FY84 FY87 FY90 FY93 FY96 FY99 FY02 FY05 FY08 FY11 FY14 FY17 General-12 $40 $35 $30 $25 $20 $15 $10 $5 $0 LIFT and Cab Operations Costs per Ride FY93 FY95 FY97 FY99 FY01 FY03 FY05 FY07 FY09 FY11 FY13 FY15 FY17
265 Revenue Millions $400 $350 Total Payroll Tax Revenues (Includes Payroll, Self Employment, and State In Lieu) Millions $140 $120 Fixed Route Passenger Revenue $300 $100 $250 $200 $150 $100 $50 $80 $60 $40 $20 $0 FY84 FY87 FY90 FY93 FY96 FY99 FY02 FY05 FY08 FY11 FY14 FY17 $0 FY84 FY87 FY90 FY93 FY96 FY99 FY02 FY05 FY08 FY11 FY14 FY17 $200 Employer Tax per Capita 40.0% Fixed Route Fare Recovery Ratio $ % $ % $ % $0 FY84 FY87 FY90 FY93 FY96 FY99 FY02 FY05 FY08 FY11 FY14 FY17 0.0% FY84 FY87 FY90 FY93 FY96 FY99 FY02 FY05 FY08 FY11 FY14 FY17 Millions $1.8 $1.5 LIFT/Cab Passenger Revenue 6.0% 4.5% LIFT/Cab Fare Recovery Ratio $1.2 $ % $ % $0.3 $0.0 FY93 FY95 FY97 FY99 FY01 FY03 FY05 FY07 FY09 FY11 FY13 FY15 FY17 0.0% FY93 FY95 FY97 FY99 FY01 FY03 FY05 FY07 FY09 FY11 FY13 FY15 FY17 General-13
266 [This Page Left Intentionally Blank] General-14
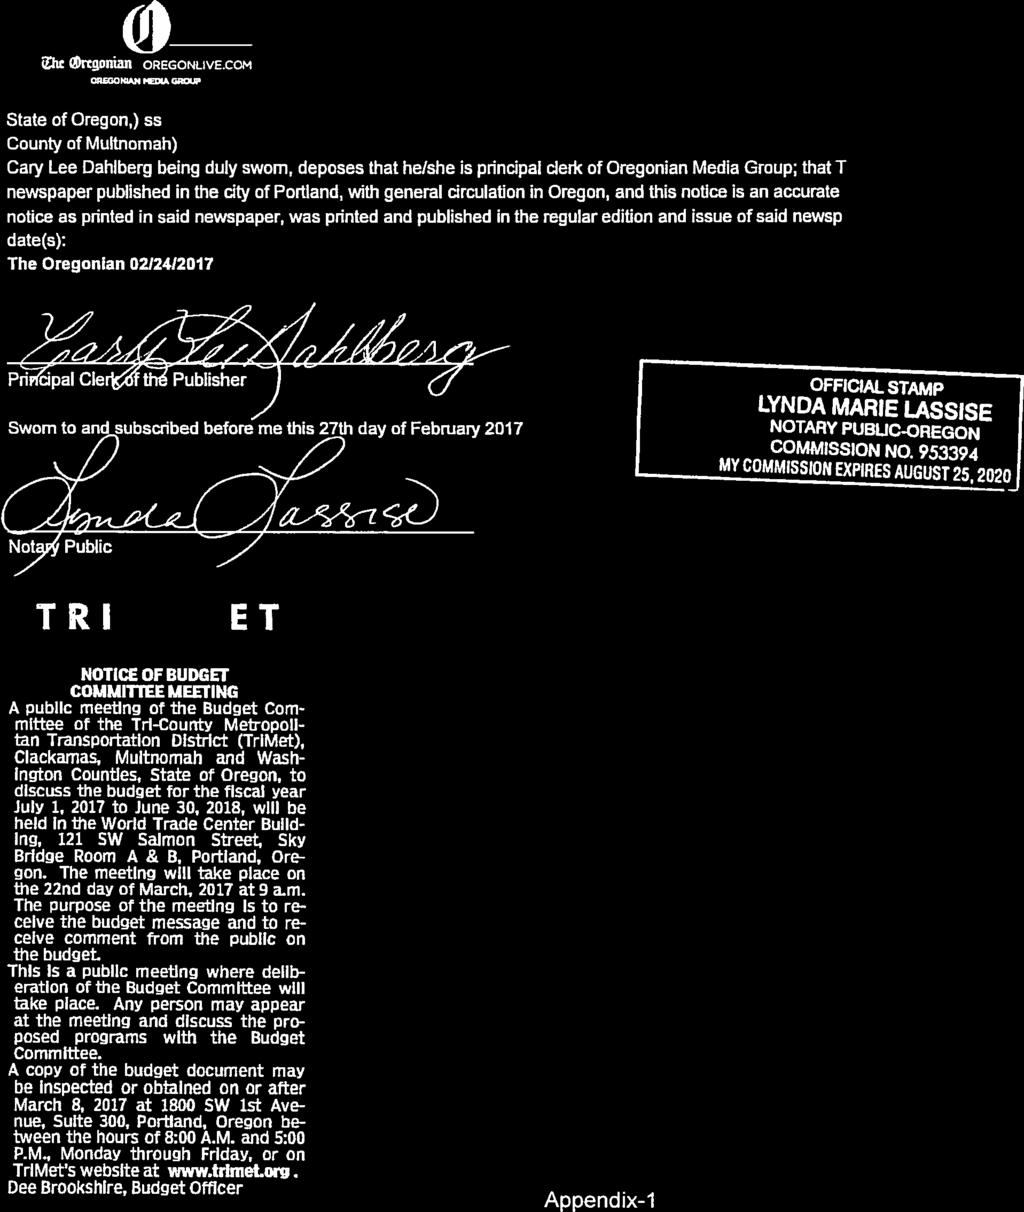


267
268

269
270 Appendix-4
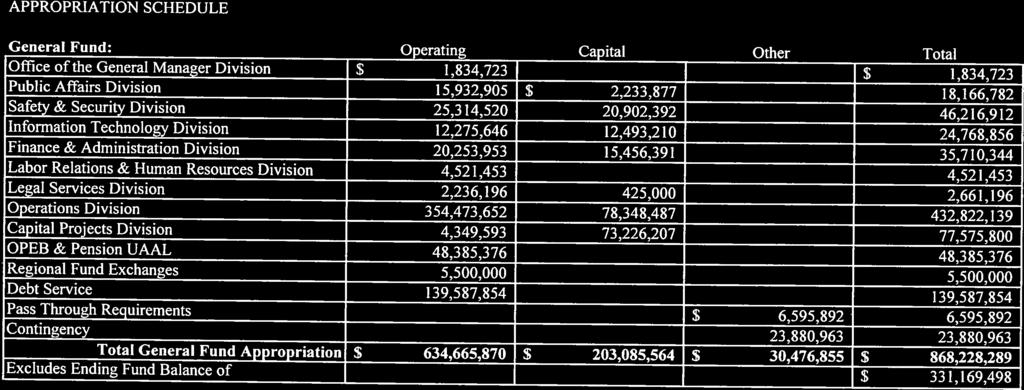
271


272
TABLE OF CONTENTS. Page. Page
 TABLE OF CONTENTS Page Overview Board of Directors... Overview-1 TriMet Officials... Overview-1 Budget Message... Overview-2 2016-2017 TriMet Organization Chart... Overview-9 Financial Summary General
TSCC Budget Review TriMet
 TSCC Budget Review 2017-18 TriMet 1. Introduction to the District: The Tri-County Metropolitan Transportation District (TriMet) boundary covers about 575 square miles of the urban portions of Multnomah,
Report of Independent Auditors and Financial Statements with Supplementary Information June 30, 2017 and 2016
 Report of Independent Auditors and Financial Statements with Supplementary Information June 30, 2017 and 2016 (including Audit Comments and Disclosures Required by State Regulations) Board of Directors
Report of Independent Auditors and Financial Statements with Supplementary Information June 30, 2016 and 2015
 Report of Independent Auditors and Financial Statements with Supplementary Information and 2015 Board of Directors Name District Bruce Warner, President #1 Joe Esmonde #2 Vacant #3 Lori Irish Bauman #4
Tri-County Metropolitan Transportation District of Oregon 2014 Annual Report
 Report of Independent Auditors and Financial Statements with Supplementary Information June 30, 2014 and 2013 Board of Directors Name District Bruce Warner, President #1 Joe Esmonde #2 Vacant #3 Consuelo
Tri-County Metropolitan Transportation District of Oregon 2013 Annual Report
 Report of Independent Auditors and Financial Statements with Supplementary Information June 30, 2013 and 2012 Board of Directors Name District Bruce Warner, President #1 Tiffany Sweitzer, Vice President
Adopted Budget Tri-County Metropolitan Transportation District of Oregon
 Adopted Budget 2011 2012 Tri-County Metropolitan Transportation District of Oregon TABLE OF CONTENTS Page Overview Board of Directors... 1 Citizens Advisory Committee/Budget... 1 TriMet Officials... 1
FINANCIAL FORECAST FY15 BUDGET FORECAST AND FINANCIAL ANALYSIS
 FINANCIAL FORECAST FY15 BUDGET FORECAST AND FINANCIAL ANALYSIS Fall 2013 Financial Analysis & Grants Administration Department, Fall 2013 Tri-County Metropolitan Transportation District of Oregon Fall
Columbia River Crossing Project Vancouver, Washington Engineering (Rating Assigned November 2012)
") Columbia River Crossing Project Vancouver, Washington Engineering (Rating Assigned November 2012) Summary Description Proposed Project: Light Rail Transit 2.9 Miles, 5 Stations Total Capital Cost ($YOE):
Columbia River Crossing Project Vancouver, Washington Engineering (Rating Assigned November 2012) Summary Description Proposed Project: Light Rail Transit 2.9 Miles, 5 Stations Total Capital Cost ($YOE):
The State of TriMet Contract Reform Needed to Fund Service
 The State of TriMet Contract Reform Needed to Fund Service Save Our Service February 13, 2013 Presented by: Neil McFarlane TriMet General Manager 1 Important to the Region* Record ridership: 102 million
May 31, 2016 Financial Report
 2016 May 31, 2016 Financial Report Capital Metropolitan Transportation Authority 7/13/2016 Table of Contents SUMMARY REPORTS Budgetary Performance - Revenue 2 - Sales Tax Revenue 6 - Operating Expenses
Date: April 24, Board of Directors. Neil McFarlane
 Date: April 24, 2013 To: From: Board of Directors Neil McFarlane Subject: RESOLUTION 13-04-29 OF THE TRI-COUNTY METROPOLITAN TRANSPORTATION DISTRICT OF OREGON (TRIMET) AUTHORIZING THE TRANSFER OF APPROPRIATED
Federal Assistance 13% Charges for Services 5% Appropriated Fund Balance.5% Other 3% Administration 6% Building Maintenance 3% Other 2%
 TRANSIT FUND The Transit Fund is used to account for the operations of the Town s public transit system. Federal Assistance 13% Transit Revenues State Assistance 12% Charges for Services 5% Appropriated
Financial Report Fiscal Year 2018
 Financial Report Fiscal Year 2018 Year to Date December 31, 2017 Presented on February 14, 2018 1 Major Highlights Revenue FY2018 sales tax revenue budgeted at 2.5% growth over FY2017 Sales tax remittances
VALLEY METRO RAIL FY18 Budget EXECUTIVE SUMMARY
 VALLEY METRO RAIL FY18 Budget EXECUTIVE SUMMARY FY18 ADOPTED ANNUAL OPERATING AND CAPITAL BUDGET Valley Metro Rail, Inc. (VMR) is a public non-profit corporation whose members are the cities of Chandler,
Total Operating Activities for FY17 are $56.9 million, an increase of $5.1M or 9.8% from FY16.
 FY17 ADOPTED ANNUAL OPERATING AND CAPITAL BUDGET Valley Metro Rail, Inc. (VMR) is a public non-profit corporation whose members are the cities of Chandler, Glendale, Mesa, Phoenix, and Tempe. VMR plans,
Funding Local Public Transportation
 Funding Local Public Transportation I. Metro A. SORTA, early history In 1969 the Southwest Ohio Regional Transit Authority was established by Hamilton County with Hamilton County as its jurisdiction. In
Financial Report Fiscal Year 2018
 Financial Report Fiscal Year 2018 Year to Date September 30, 2018 1 Major Highlights Revenue Sales tax remittances received in FY2018 are 6.5% higher than FY2017 Additional $20 million in operating grants
VALLEY METRO RPTA FY18 Budget EXECUTIVE SUMMARY
 VALLEY METRO RPTA FY18 Budget EXECUTIVE SUMMARY FY18 ADOPTED ANNUAL OPERATING AND CAPITAL BUDGET Valley Metro Regional Public Transportation Authority (RPTA) provides public transportation services for
Transportation Funding Overview. Travis Brouwer, ODOT Assistant Director House Transportation Policy Committee March 8, 2017
 Transportation Funding Overview Travis Brouwer, ODOT Assistant Director House Transportation Policy Committee March 8, 2017 Major Funding Sources Federal Surface Transportation Funding Federal Highway
Governor s FY 2019 Revised, FY 2020 and Capital Budget Recommendations House Finance Committee April 9, 2019
 Governor s FY 2019 Revised, FY 2020 and Capital Budget Recommendations House Finance Committee April 9, 2019 Quasi-public agency Established in 1964 Responsible: Fixed route bus service and Americans with
Federal Transit Funding Crisis: A Message to Congress Presented by Alex Clifford, CEO Santa Cruz Metropolitan Transit District (METRO) 2017
 2017") Federal Transit Funding Crisis: A Message to Congress Presented by Alex Clifford, CEO Santa Cruz Metropolitan Transit District (METRO) 2017 HOW CAN CONGRESS HELP? Santa Cruz Metropolitan Transit District
Federal Transit Funding Crisis: A Message to Congress Presented by Alex Clifford, CEO Santa Cruz Metropolitan Transit District (METRO) 2017 HOW CAN CONGRESS HELP? Santa Cruz Metropolitan Transit District
August 31, 2016 Financial Report
 August 31, 2016 Financial Report Capital Metropolitan Transportation Authority 10/14/2016 Table of Contents SUMMARY REPORTS Budgetary Performance - Revenue 2 - Sales Tax Revenue 6 - Operating Expenses
INVESTING STRATEGICALLY
 11 INVESTING STRATEGICALLY Federal transportation legislation (Fixing America s Surface Transportation Act FAST Act) requires that the 2040 RTP be based on a financial plan that demonstrates how the program
Management Committee Meeting date: March 8, 2017 For the Metropolitan Council meeting of March 22, 2017
 Business Item No. 2017-42 JT Management Committee Meeting date: March 8, 2017 For the Metropolitan Council meeting of March 22, 2017 Subject: 2017 Unified Budget Amendment Carryforward Amendment District(s),
Financial Report - FY 2017 Year to Date May 31, 2017
 Financial Report - FY 2017 Year to Date July 19, 2017 1 Major Highlights Revenue Sales tax remittances received through YTD April 2017 are 4.2% higher than YTD April 2016 Plaza Saltillo lease income budgeted
Northern Virginia Transportation Commission: 2018 Legislative and Policy Agenda
 Northern Virginia Transportation Commission: 2018 Legislative and Policy Agenda Northern Virginia s economic growth and global competitiveness are directly tied to the region s transit network. Transit
8. FINANCIAL ANALYSIS
 8. FINANCIAL ANALYSIS This chapter presents the financial analysis conducted for the Locally Preferred Alternative (LPA) selected by the Metropolitan Transit Authority of Harris County (METRO) for the.
SALEM-KEIZER TRANSIT 555 Court St. NE Suite 5230 Salem, OR
 SALEM-KEIZER TRANSIT 555 Court St. NE Suite 5230 Salem, OR 97301-3980 503-588-2424 Fax 503-566-3933 www.cherriots.org May 15, 2014 To: From: Subject: Salem Area Mass Transit District Budget Committee Allan
Washington Metropolitan Area Transit Authority Metro Budget Overview
 Washington Metropolitan Area Transit Authority Metro Budget Overview February 2011 Metro 10,877 Employees (10,974 budgeted) 1,491 Buses 588 Escalators and 237 Elevators 106 Miles of Track 92 Traction Power
ANNUAL REPORT AN UPDATE FOR OUR RIDERS AND THE COMMUNITY
 ANNUAL REPORT 2 0 1 8 AN UPDATE FOR OUR RIDERS AND THE COMMUNITY FROM THE GM FROM THE GM Dear Riders and Stakeholders, At the end of each year we have the opportunity to look back at everything we have
Chapter 4: Regional Transportation Finance
 4.1 Chapter 4: Regional Transportation Finance 2040 4.2 CONTENTS Chapter 4: Transportation Finance Overview 4.3 Two Funding Scenarios 4.4 Current Revenue Scenario Assumptions 4.5 State Highway Revenues
Governor s FY 2017 Revised, FY 2018 and Capital Budget Recommendations House Finance Committee April 12, 2017
 Governor s FY 2017 Revised, FY 2018 and Capital Budget Recommendations House Finance Committee April 12, 2017 Quasi-public agency Established in 1964 Responsible: Fixed route bus service and Americans
Chapter 3: Regional Transportation Finance
 Chapter 3: Regional Transportation Finance This chapter examines the sources of funding for transportation investments in the coming years. It describes recent legislative actions that have changed the
Vancouver Columbia River Crossing. (November 2009)
") EXHIBIT A Vancouver Columbia River Crossing Vancouver, Washington (November 2009) The Washington State Department of Transportation (WSDOT) proposes to construct the Columbia River Crossing, an approximately
EXHIBIT A Vancouver Columbia River Crossing Vancouver, Washington (November 2009) The Washington State Department of Transportation (WSDOT) proposes to construct the Columbia River Crossing, an approximately
April 30, 2016 Financial Report
 2016 April 30, 2016 Financial Report Capital Metropolitan Transportation Authority 6/15/2016 Table of Contents SUMMARY REPORT Budgetary Performance - Revenue 2 - Sales Tax Revenue 6 - Operating Expenses
FY2020 Budget Outlook
 Finance and Capital Committee Information Item IV-A October 11, 2018 FY2020 Budget Outlook 35 of 60 Washington Metropolitan Area Transit Authority Board Action/Information Summary Action Information MEAD
February 2016 Financial Report
 2016 February 2016 Financial Report Capital Metropolitan Transportation Authority 4/13/2016 Table of Contents SUMMARY REPORT Budgetary Performance - Revenue 2 - Sales Tax Revenue 5 - Operating Expenses
Financial Report Fiscal Year 2018
 Financial Report Fiscal Year 2018 Year to Date March 31, 2018 Presented on May 21, 2018 1 Major Highlights Revenue FY2018 sales tax revenue budgeted at 2.5% growth over FY2017 Sales tax remittances received
CHICAGO TRANSIT AUTHORITY CHICAGO, ILLINOIS
 CHICAGO, ILLINOIS FINANCIAL STATEMENTS AND SUPPLEMENTARY INFORMATION Years Ended (With Independent Auditor s Report Thereon) Chicago, Illinois FINANCIAL STATEMENTS Years Ended TABLE OF CONTENTS Independent
Birmingham-Jefferson County Transit Authority P.O. Box Birmingham, AL Phone: (205) Fax: (205)
 Fax: (205)") Birmingham-Jefferson County Transit Authority P.O. Box 10212 Birmingham, AL 35202-0212 Phone: (205) 521-0161 - Fax: (205) 521-0154 Program of Projects For Federal Fiscal Year 2018 (Utilizing FFY 2017 Apportionments)
Birmingham-Jefferson County Transit Authority P.O. Box 10212 Birmingham, AL 35202-0212 Phone: (205) 521-0161 - Fax: (205) 521-0154 Program of Projects For Federal Fiscal Year 2018 (Utilizing FFY 2017 Apportionments)
Executive Summary - Fiscal Year 2016 Valley Metro Rail Preliminary Annual Operating and Capital Budget
 Executive Summary - Fiscal Year 2016 Valley Metro Rail Preliminary Annual Operating and Capital Budget Valley Metro Rail, Inc. (VMR) is a public non-profit corporation whose members are the cities of Chandler,
TEX Rail Fort Worth, Texas Project Development (Rating Assigned November 2012)
") TEX Rail Fort Worth, Texas Project Development (Rating Assigned November 2012) Summary Description Proposed Project: Commuter Rail 37.6 Miles, 14 Stations (12 new, two existing) Total Capital Cost ($YOE):
TEX Rail Fort Worth, Texas Project Development (Rating Assigned November 2012) Summary Description Proposed Project: Commuter Rail 37.6 Miles, 14 Stations (12 new, two existing) Total Capital Cost ($YOE):
Notice of Public Hearing Washington Metropolitan Area Transit Authority
 Notice of Public Hearing Washington Metropolitan Area Transit Authority Docket B18-01: Proposed FY2019 Operating Budget and Docket B18-02: Proposed FY2019 Capital Improvement Program and Federal FY2018
Public Transit Services Summary of Submitted 2015 Budget From Rates
 Public Transit Services Summary of Submitted 2015 From Rates Service Expense 2014 2015 Revised Draft Non Tax Revenue Net Tax Supported Expense Non Tax Revenue Net Tax Supported Increase / (Decrease) Over
CHICAGO TRANSIT AUTHORITY. FINANCIAL STATEMENTS AND SUPPLEMENTARY INFORMATION December 31, 2010 and 2009 (With Independent Auditors Report Thereon)
") FINANCIAL STATEMENTS AND SUPPLEMENTARY INFORMATION (With Independent Auditors Report Thereon) Chicago, Illinois FINANCIAL STATEMENTS CONTENTS Independent Auditors Report... 1 Management s Discussion and
FINANCIAL STATEMENTS AND SUPPLEMENTARY INFORMATION (With Independent Auditors Report Thereon) Chicago, Illinois FINANCIAL STATEMENTS CONTENTS Independent Auditors Report... 1 Management s Discussion and
University Link LRT Extension
 (November 2007) The Central Puget Sound Regional Transit Authority, commonly known as Sound Transit, is proposing to implement an extension of the Central Link light rail transit (LRT) Initial Segment
Report by Finance and Administration Committee (B) Washington Metropolitan Area Transit Authority Board Action/Information Summary
 Washington Metropolitan Area Transit Authority Board Action/Information Summary") Report by Finance and Administration Committee (B) 01-28-2016 Washington Metropolitan Area Transit Authority Board Action/Information Summary Action Information MEAD Number: 201701 Resolution: Yes No TITLE:
Report by Finance and Administration Committee (B) 01-28-2016 Washington Metropolitan Area Transit Authority Board Action/Information Summary Action Information MEAD Number: 201701 Resolution: Yes No TITLE:
QUALITY TRANSPORTATION SUMMARY
 QUALITY TRANSPORTATION SUMMARY Quality Transportation Overview... 126 Department of Transportation... 127 Traffic Field Operations... 129 Winston-Salem Transit Authority... 131 Quality Transportation Non-Departmental...
SOUTHEASTERN PENNSYLVANIA TRANSPORTATION AUTHORITY. Financial Statements June 30, 2018 and (With Independent Auditors Report Thereon)
") SOUTHEASTERN PENNSYLVANIA TRANSPORTATION AUTHORITY Financial Statements June 30, 2018 and 2017 (With Independent Auditors Report Thereon) SOUTHEASTERN PENNSYLVANIA TRANSPORTATION AUTHORITY YEARS ENDED
SOUTHEASTERN PENNSYLVANIA TRANSPORTATION AUTHORITY Financial Statements June 30, 2018 and 2017 (With Independent Auditors Report Thereon) SOUTHEASTERN PENNSYLVANIA TRANSPORTATION AUTHORITY YEARS ENDED
METRO. Fiscal Year Monthly Performance Report. Revenue Expense Ridership Performance. November 2018 (Third Quarter Fiscal Year-to Date)
") METRO Fiscal Year 2019 Monthly Performance Report Revenue Expense Ridership Performance (Third Quarter Fiscal Year-to Date) 12/12/2018 Table of Contents Section A Section B Section C Section D Section
METRO Fiscal Year 2019 Monthly Performance Report Revenue Expense Ridership Performance (Third Quarter Fiscal Year-to Date) 12/12/2018 Table of Contents Section A Section B Section C Section D Section
Title VI Service Equity Analysis: FY2019 Annual Service Plan. Department of Diversity & Transit Equity
 Title VI Service Equity Analysis: FY2019 Annual Service Plan Department of Diversity & Transit Equity April 26, 2018 Executive Summary TriMet is proposing to implement several service improvements in fall
Governor s FY 2018 Revised, FY 2019 and Capital Budget Recommendations House Finance Committee April 12, 2018
 Governor s FY 2018 Revised, FY 2019 and Capital Budget Recommendations House Finance Committee April 12, 2018 Quasi-public agency Established in 1964 Responsible: Fixed route bus service and Americans
PROPOSED FISCAL YEAR 2011 BUDGET. Testimony of. Richard Sarles, General Manager. Washington Metropolitan Area Transit Authority.
 PROPOSED FISCAL YEAR 2011 BUDGET Testimony of Richard Sarles, General Manager Washington Metropolitan Area Transit Authority Before the Council of the District of Columbia Committee on Public Works and
Governor s FY 2016 Revised, FY 2017 and Capital Budget Recommendations House Finance Committee April 13, 2016
 Governor s FY 2016 Revised, FY 2017 and Capital Budget Recommendations House Finance Committee April 13, 2016 Quasi-public agency Established in 1964 Responsible: Fixed route bus service and Americans
Overview of Minnesota Highway and Transit Finance. Metropolitan Council Transportation Committee June 22, 2015 and July 13, 2015
 Overview of Minnesota Highway and Transit Finance Metropolitan Council Transportation Committee June 22, 2015 and July 13, 2015 Today s topics MN and Metro Area transportation revenues and expenditures
Peer Agency: King County Metro
 Peer Agency: King County Metro City: Seattle, WA Fare Policy: Service Type Full Fare Reduced Fare Peak: - 1 Zone $2.75 $1.00* or $1.50** - 2 Zones $3.25 $1.00* or $1.50** Off Peak $2.50 $1.00* or $1.50**
Metropolitan Transportation Authority (A Component Unit of the State of New York)
") (A Component Unit of the State of New York) Independent Auditors Review Report as of and for the Six-Month Period Ended June 30, 2018 Table of Contents INDEPENDENT AUDITORS REVIEW REPORT 3 MANAGEMENT S
(A Component Unit of the State of New York) Independent Auditors Review Report as of and for the Six-Month Period Ended June 30, 2018 Table of Contents INDEPENDENT AUDITORS REVIEW REPORT 3 MANAGEMENT S
FY2011 Budget Forum. District of Columbia. October 19, 2009
 FY2011 Budget Forum District of Columbia October 19, 2009 0 Meeting agenda What is Metro and what is the value of Metro service? What are the Fiscal Year 2011 budget challenges? What are the potential
Transportation Package HB 2017
 Transportation Package HB 2017 Increases in Rates and Revenue Raised Some traditional, and some new and innovative Commonly considered increases: Gas Tax and use fuel increase (Total 10 cents increase)
INVEST IN TRANSIT. The Regional Transit Strategic Plan for Chicago and Northeastern Illinois ANNUAL PROGRESS REPORT FEBRUARY 2019
 ANNUAL PROGRESS REPORT FEBRUARY 2019 INVEST IN TRANSIT The 2018-2023 Regional Transit Strategic Plan for Chicago and Northeastern Illinois Read the full plan at StrategicPlan.RTAChicago.org Chicago and
METRO. Fiscal Year Monthly Performance Report. Revenue Expense Ridership Performance. February 2018 (First Quarter Fiscal Year-to Date)
") METRO Fiscal Year 2018 Monthly Performance Report Revenue Expense Ridership Performance (First Quarter Fiscal Year-to Date) 3/12/2018 Table of Contents Section A Section B Section C Section D Section E
METRO Fiscal Year 2018 Monthly Performance Report Revenue Expense Ridership Performance (First Quarter Fiscal Year-to Date) 3/12/2018 Table of Contents Section A Section B Section C Section D Section E
METRO. Fiscal Year 2014 Monthly Board Report. May 2014
 METRO Fiscal Year 2014 Monthly Board Report Revenue Expense Ridership Performance 7/11/2014 Table of Contents Section A Section B Section C Section D Section E Section F Section G Section H Section I Section
CENTRAL CITY LINE PROJECT UPDATE AND SMALL STARTS EVALUATION & RATINGS APPLICATION UPDATED & REVISED 4/20/17
 CENTRAL CITY LINE PROJECT UPDATE AND SMALL STARTS EVALUATION & RATINGS APPLICATION UPDATED & REVISED 4/20/17 EXECUTIVE SUMMARY The Central City Line (CCL) is a proposed 6-mile long high performance Bus
Whatcom Transportation Authority
 Whatcom Transportation Authority Annual Budget 12/14/2017 This Page Intentionally Left Blank Whatcom Transportation Authority (WTA) Annual Budget Table of Contents General Manager s Budget Message... 2
Adopted 2018 OPERATING BUDGET Two-Year Financial Plan and Five-Year CAPITAL PROGRAM
 2018 Adopted 2018 OPERATING BUDGET Two-Year Financial Plan and Five-Year CAPITAL PROGRAM MOVING YOU Northeastern Illinois December 2017 RTA Board of Directors Kirk Dillard Chairman Anthony K. Anderson
Briefing on Fare Structure
 Briefing on Fare Structure Budget & Finance Committee January 22, 2019 Joseph G. Costello Senior Vice President, Finance 0 Calendar Date Subject Jan 22 Fare Structure Briefing Feb 26 FY 2018 Operating
FY2017 Budget Work Session
 Finance & Administration Committee Information Item IV-B January 14, 2016 FY2017 Budget Work Session Washington Metropolitan Area Transit Authority Board Action/Information Summary Action Information MEAD
Audit and Finance Subcommittee
 MEETING OF THE Audit and Finance Subcommittee MEETING DATE January 12, 2017 TIME LOCATION 12:00 p.m. Valley Metro 101 N. 1st Ave., 10th Floor Lake Mead Conference Room (10B) Phoenix, AZ 85003 VALLEY METRO
Metropolitan Transportation Authority (A Component Unit of the State of New York) Independent Auditors Review Report
 Independent Auditors Review Report") Metropolitan Transportation Authority (A Component Unit of the State of New York) Independent Auditors Review Report Consolidated Interim Financial Statements as of and for the Three-Month Period Ended
Metropolitan Transportation Authority (A Component Unit of the State of New York) Independent Auditors Review Report Consolidated Interim Financial Statements as of and for the Three-Month Period Ended
Portal North Bridge Project Hudson County, New Jersey Core Capacity Project Development (Rating Assigned February 2017)
") Portal North Bridge Project Hudson County, New Jersey Core Capacity Project Development (Rating Assigned February 2017) Summary Description Proposed Project: Commuter Rail Capacity Improvement 2.3 Miles
Portal North Bridge Project Hudson County, New Jersey Core Capacity Project Development (Rating Assigned February 2017) Summary Description Proposed Project: Commuter Rail Capacity Improvement 2.3 Miles
INVESTMENT STRATEGIES
 3 INVESTMENT STRATEGIES 70 INVESTMENT STRATEGIES 71 A key role of Mobilizing Tomorrow is to outline a strategy for how the region will invest in transportation infrastructure over the next 35 years. This
FY17 FY16 Valley Metro RPTA Sources of Funds FY17 vs FY16
 FY17 ADOPTED ANNUAL OPERATING AND CAPITAL BUDGET Valley Metro Regional Public Transportation Authority (RPTA) provides public transportation services for Maricopa County located in the metro Phoenix, Arizona.
D R A F T APPENDIX A. Future Employment Forecast Methodology
 Transit Development Plan Memo #3: Planning Framework Appendix A APPENDIX A Future Employment Forecast Methodology Transit Development Plan Memo #3: Planning Framework Appendix A APPENDIX A FUTURE EMPLOYMENT
8.0 FINANCIAL ANALYSIS
 Chapter 8 Financial Analysis 8.0 FINANCIAL ANALYSIS This chapter presents a summary of the financial analysis for the Central Corridor Light Rail Transit (LRT) Project, a description of the Project Sponsor
Overview of State Highway Fund 0006 Revenues and Allocations, the Texas Mobility Fund, and the Texas Rail Relocation and Improvement Fund
 Overview of State Highway Fund 0006 Revenues and Allocations, the Texas Mobility Fund, and the Texas Rail Relocation and Improvement Fund Legislative Budget Board Contents General Overview of State Highway
FY2017 Budget Guidance
 Finance & Administration Committee Information Item IV-D September 10, 2015 FY2017 Budget Guidance Washington Metropolitan Area Transit Authority Board Action/Information Summary Action Information MEAD
2016 Budget. Lakewood, Washington
 2016 Budget Lakewood, Washington Mission Statement Pierce Transit improves people s quality of life by providing safe, reliable, innovative and useful transportation services that are locally based and
CHAPTER 7: Financial Plan
 CHAPTER 7: Financial Plan Report Prepared by: Contents 7 FINANCIAL PLAN... 7-1 7.1 Introduction... 7-1 7.2 Assumptions... 7-1 7.2.1 Operating Revenue Assumptions... 7-2 7.2.2 Operating Cost Assumptions...
Overview of the Final New Starts / Small Starts Regulation and Frequently Asked Questions
 Overview of the Final New Starts / Small Starts Regulation and Frequently Asked Questions The Federal Transit Administration s (FTA) New Starts and Small Starts program represents the federal government
FY2014 Capital and Operating Budget Discussion
 Finance & Administration Committee Information Item III-B December 6, 2012 FY2014 Capital and Operating Budget Discussion Page 18 of 44 Washington Metropolitan Area Transit Authority Board Action/Information
Last year, transit spent almost $1.1 billion on materials and services contracts with more than 2,000 Pennsylvania businesses.
 TRANSIT D+ 2006 Report Card for Pennsylvania s Infrastructure In recent years, transit use has increased faster than any other mode of transportation. More than one million Pennsylvanians use public transit
Metro. Board Report. Fare revenue projections, based on preliminary assumptions for ridership
 Metro Board Report Los Angeles County Metropolitan Transportation Authority One Gateway Plaza 3rd Floor Board Room Los Angeles, CA SUBJECT: FY18 BUDGET DEVELOPMENT UPDATE ACTION: RECEIVE AND FILE RECOMMENDATION
10 Financial Analysis
 10 Financial Analysis This chapter summarizes the financial analysis for the No-Build Alternative and the proposed METRO Blue Line Light Rail Transit (BLRT) Extension project. This chapter also describes
METROPOLITAN TRANSIT AUTHORITY NASHVILLE, TENNESSEE AUDITED FINANCIAL STATEMENTS AND OTHER FINANCIAL INFORMATION JUNE 30, 2017 AND 2016
 NASHVILLE, TENNESSEE AUDITED FINANCIAL STATEMENTS AND OTHER FINANCIAL INFORMATION JUNE 30, 2017 AND 2016 Table of Contents Page INTRODUCTION... 1-2 INDEPENDENT AUDITOR S REPORT... 3-5 MANAGEMENT S DISCUSSION
Keeping Metro Safe, Reliable and Affordable
 Finance Committee Information Item III-B September 14, 2017 Keeping Metro Safe, Reliable and Affordable Washington Metropolitan Area Transit Authority Keeping Metro Safe, Reliable and Affordable 1 Purpose
Transit Subsidy. Mission Statement. Mandates
 Mission Statement The Potomac and Rappahannock Transportation Commission (PRTC) is a multi-jurisdictional agency representing Prince William, Stafford, and Spotsylvania Counties and the Cities of Manassas,
2040 Long Range Transportation Plan. Financial Summary
 2040 Long Range Transportation Plan Financial Summary FINANCIAL OUTLOOK Establishing MPO Transportation Plan fiscal forecasts for a twenty year planning horizon in today s transportation environment is
Chapter 9 Financial Considerations. 9.1 Introduction
 9.1 Introduction Chapter 9 This chapter presents anticipated costs, revenues, and funding for the NEPA BART Extension Alternative. A summary of VTA s financial plan for the BART Extension Alternative is
2019 MANAGEMENT & FINANCIAL PLAN
 INDIANAPOLIS PUBLIC TRANSPORTATION CORPORATION 2019 MANAGEMENT & FINANCIAL PLAN FISCAL YEAR JANUARY 1, 2019 THROUGH DECEMBER 31, 2019 INTRODUCED TO INDYGO BOARD: JULY 30, 2018 IndyGo Year 2019 INDIANAPOLIS
CHAPTER 9 FINANCIAL CONSIDERATIONS
 CHAPTER 9 FINANCIAL CONSIDERATIONS 9.1 INTRODUCTION This chapter presents anticipated costs, revenues, and funding for the Berryessa Extension Project (BEP) Alternative and the Silicon Valley Rapid Transit
South Central Transit Authority. Financial Statements June 30, 2015
 Financial Statements Table of Contents Page INDEPENDENT AUDITOR'S REPORT 1 and 2 MANAGEMENT'S DISCUSSION AND ANALYSIS 3 to 6 FINANCIAL STATEMENTS Statement of Net Position 7 Statement of Revenues, Expenses,
Approval of Proposed FY 2019 Annual Budget and 20-Year Financial Plan
 Approval of Proposed FY 2019 Annual Budget and 20-Year Financial Plan Committee of the Whole September 11, 2018 Joseph G. Costello Senior Vice President, Finance 0 Board Calendar Date Subject July 10 Draft
Report to the Board of Directors Citizens Advisory Committee on the Budget
 Report to the Board of Directors Citizens Advisory Committee on the Budget Tri-County Metropolitan Transportation District of Oregon Spring 2009 Tri-County Metropolitan Transportation District of Oregon
Contents. Appendix. Cost Model Structure. Tables
 Alternatives Analysis Alt ti A l i Technical Methodology Report: Operating and Cost Estimating and Results Prepared for: Washington County Regional Railroad Authority on behalf of the Gateway Corridor
SOUTHEASTERN PENNSYLVANIA TRANSPORTATION AUTHORITY. Financial Statements June 30, 2017 and (With Independent Auditors Report Thereon)
") SOUTHEASTERN PENNSYLVANIA TRANSPORTATION AUTHORITY Financial Statements June 30, 2017 and 2016 (With Independent Auditors Report Thereon) SOUTHEASTERN PENNSYLVANIA TRANSPORTATION AUTHORITY YEARS ENDED
SOUTHEASTERN PENNSYLVANIA TRANSPORTATION AUTHORITY Financial Statements June 30, 2017 and 2016 (With Independent Auditors Report Thereon) SOUTHEASTERN PENNSYLVANIA TRANSPORTATION AUTHORITY YEARS ENDED
APPENDIX I REVENUE PROJECTION AND ASSUMPTIONS
 APPENDIX I REVENUE PROJECTION AND ASSUMPTIONS The 2018 StanCOG Regional Transportation Plan/Sustainable Communities Strategy (RTP/SCS) financial forecasts provide revenue projections for StanCOG member
Transit Subsidy. Mission Statement. Mandates
 Mission Statement The Potomac and Rappahannock Transportation Commission (PRTC) is a multi-jurisdictional agency representing Prince William, Stafford, and Spotsylvania Counties and the Cities of Manassas,
Financial Snapshot October 2014
 Financial Snapshot October 2014 Financial Snapshot About the Financial Snapshot The Financial Snapshot provides answers to frequently asked questions regarding MoDOT s finances. This document provides
Getting Metro Back on Track
 NVTC Presents: Getting Metro Back on Track A discussion with Virginia members of the WMATA Board @NovaTransit This forum is sponsored by the Northern Virginia Transportation Commission. Learn more about