Population-based Funding Formula Review Technical Report
|
|
|
- Christopher Gordon
- 5 years ago
- Views:
Transcription
1 Population-based Funding Formula Review 2015 Technical Report Released 2016 health.govt.nz
 HP 6359 This document is available at health.govt.")
2 Citation: Ministry of Health Population-based Funding Formula Review 2015 Technical Report. Wellington: Ministry of Health. Published in March 2016 by the Ministry of Health PO Box 5013, Wellington 6145, New Zealand ISBN (online) HP 6359 This document is available at health.govt.nz This work is licensed under the Creative Commons Attribution 4.0 International licence. In essence, you are free to: share ie, copy and redistribute the material in any medium or format; adapt ie, remix, transform and build upon the material. You must give appropriate credit, provide a link to the licence and indicate if changes were made.
3 Acknowledgements The Ministry of Health would like to acknowledge the following members of the Populationbased Funding Formula (PBFF) Technical Advisory Group (TAG): Dr Wing Cheuk Chan Sandra Boardman Tony Hickmott John Marney Caroline Boyd Bronwyn Croxson Mhairi McHugh (Chair) Public Health Physician, Population Health, Counties Manukau District Health Board (DHB) Executive Director, Planning & Funding, Southern DHB Chief Financial Officer, Capital & Coast DHB Principal Advisor, the Treasury Manager, Strategy Policy, Ministry of Health Chief Economist, Ministry of Health Manager Capital and Operating, DHB Performance, Ministry of Health The authors of this report were Mhairi McHugh, Byron Gill, Bob Stephens, Phil McConville, Alison Williams, Sheetalpreet Singh and Karen Schwörer of the National Health Board. The Ministry of Health Core Project Team 1 was Kieran Reilly, Byron Gill, Phil McConville, Bob Stephens and Alan Keegan of the National Health Board. The authors gratefully acknowledge the peer reviewers of this report: Dr Peter Crampton Jo-Anne Skinner Michael Roberts Dr Martin Tobias Cathy Webber PBFF TAG members Pro-Vice-Chancellor, Division of Health Sciences and Dean, University of Otago Medical School Manager, Population Estimates and Projections, Statistics New Zealand Senior Policy Analyst, Strategy Policy, Ministry of Health Principal Technical Specialist Epidemiology, Ministry of Health Senior Advisor, Capital and Operating, DHB Performance, Ministry of Health The authors would also like to acknowledge: the University of Otago, Wellington; Statistics New Zealand; the National Health Board Information Group of the Ministry of Health; and Professor Toni Ashton. 1 There were contributions for certain portions of the project by other members. Population-based Funding Formula Review 2015 Technical Report iii
4
5 Contents Acknowledgements Executive summary The Population-based Funding Formula The Review Audit iii xi xi xii xix Introduction 1 What is the PBFF? 1 Background 4 Overview of the Review 6 Principles of the Review 6 The choice of factors upon which to distribute funding 6 International health care funding models 7 Evaluation of variables 11 The model 15 How the Population-based Funding Formula uses data 17 Population-based Funding Formula cost weight testing 23 Introduction 23 Personal Health: Hospital and Community Services 25 Personal Health: Primary Care 28 Health of Older People 31 Mental Health 36 Population-based Funding Formula adjuster development 40 The unmet need adjuster 40 The overseas eligible and refugees adjuster 43 The rural adjuster 48 The tertiary adjuster 53 The land adjuster 53 The final Population-based Funding Formula model 54 Lessons learned and recommendations for future reviews 59 Data quality and availability 59 Research 60 Training 60 Recommendations 60 Population-based Funding Formula Review 2015 Technical Report v
6 References 61 Appendix 1: Differences between NZDep06 and NZDep References 70 Appendix 2: Technical explanation of variable testing 71 Introduction 71 Background 71 Methods and data sources 72 Results 78 Conclusions 89 References 90 Appendix 3: Deriving estimated cost for the National Minimum Dataset and the National Non-Admitted Patient Collection 91 Appendix 4: Mental health cost assumption methodology 100 Introduction 100 Methodology 100 Volume data 100 Adjustments to PRIMHD 103 Total mental health expenditure (district health board general ledger accounts) 104 Price volume schedules 106 Event weightings 106 Results 111 Consultation 112 Appendix 5: The rural adjuster community services and facilities components 113 Introduction 113 Community services 113 Facilities 115 Appendix 6: Development of rural indexes 117 Introduction 117 Approach and data sources 117 Weighted population 117 Population density 118 Travel time and travel to tertiary 118 Travel to tertiary 118 Caveats 118 References 119 Appendix 7: Previous Ministry of Health Publications on the Populationbased Funding Formula 120 vi Population-based Funding Formula Review 2015 Technical Report
7 List of Tables Table 1: Summary of review of PBFF core variables and adjusters xiii Table 2: DHB PBFF shares using current and new models and population shares, 2015/16 xviii Table 3: Summary of international funding models 9 Table 4: Review of existing and new variables against review criteria 12 Table 5: Characteristics of different population measures at the DHB level 17 Table 6: The nine dimensions of deprivation included in NZDep Table 7: Final smoothed ethnicity adjusters (gender combined) for hospitalisation data 20 Table 8: Data sources for major service groups 21 Table 9: Proportion of expenditure modelled from individual service use data by service group 22 Table 10: Personal Health: Hospital and Community Services smoothing factors 25 Table 11: Personal Health: Primary Care smoothing factors 29 Table 12: Health of Older People: Other smoothing factors 32 Table 13: District health board costs for overseas eligible patients 2011/ /14 44 Table 14: Costs and details of specific refugee services provided by DHBs 45 Table 15: Distribution of overseas eligible and refugees adjuster, by district health board 47 Table 16: Description of components in rural adjuster models 49 Table 17: Share of the rural adjuster by DHB, 2013/14 52 Table 18: Weight by service group and DHB, 2013/14 56 Table 19: DHB results drivers of change 57 Table A1: Cell collapsing options tested 75 Table A2: Full list of variables tested 75 Table A3: Absolute value of percentage point error Personal Health: Hospital and Community Services 85 Table A4: Absolute value of percentage point error Personal Health: Primary Care 86 Table A5: Absolute value of percentage point error Health of Older People: Aged Residential Care 86 Table A6: Absolute value of percentage point error Health of Older People: Other 87 Table A7: Absolute value of percentage point error Mental Health 88 Table A8: Price list used for development of PBFF cost weights 92 Table A9: Programme for the Integration of Mental Health Data activity unit list 100 Table A10: Table A11: Programme for the Integration of Mental Health Data activity type descriptions 101 Programme for the Integration of Mental Health Data activity settings descriptions 102 Population-based Funding Formula Review 2015 Technical Report vii
8 Table A12: Table A13: Table A14: Total expenditure on mental health activity from district health board funder general ledger accounts, 2013/14 (actuals) 104 Purchase unit codes excluded from the mental health expenditure report 2013/ Calculation of mental health expenditure on bednights (inpatient and nongovernment organisation) 106 Table A15: Total mental health expenditure by activity unit type 106 Table A16: Table A17: Table A18: Table A19: Activity setting weightings for bednight events used in the calculation of mental health cost assumptions 107 Activity type weightings for bednight events used in the calculation of mental health cost assumptions 108 Activity setting weightings for contact events used in the calculation of mental health cost assumptions 109 Activity type weightings for contact events used in the calculation of mental health cost assumptions 110 Table A20: Mental health calculated cost assumption results, for input into cost weights 111 Table A21: Allocation of community services pool by district health board (for enhanced status quo model) 115 Table A22: Inputs to the facility diseconomy model 116 Table A24: Publications on population-based funding in New Zealand 120 List of Figures Figure 1: Distribution of overseas eligible and refugees adjuster pool by DHB, 2013/14 xiv Figure 2: Distribution of rural adjuster pool by DHB, 2013/14 xv Figure 3: Figure 4: Figure 5: Population-based Funding Formula aggregate cost weights for females of Other ethnicity, by age and NZDep2013 Population-based Funding Formula aggregate cost weights for males of Other ethnicity, by age and NZDep2013 Population-based Funding Formula aggregate cost weights for males of NZDep2013 quintile 4, by age and ethnicity Figure 6: Population-based Funding Formula aggregate cost weights, by age, 2007/08 and 2014/15 xvii Figure 7: Guide to the PBFF and the Budget 4 Figure 9: Figure 10: Figure 11: Figure 12: Unweighted cost weights for Personal Health: Hospital and Community Services, female Pacific peoples, by NZDep2013 quintile (not smoothed) 26 Unweighted cost weights for Personal Health: Hospital and Community Services, female Pacific peoples, by NZDep2013 quintile (smoothed) 26 Unweighted cost weights for Personal Health: Hospital and Community Services, by sex 27 Unweighted cost weights for Personal Health: Hospital and Community Services, by NZDep2013 quintile 27 xvi xvi xvii viii Population-based Funding Formula Review 2015 Technical Report
9 Figure 13: Figure 14: Figure 15: Unweighted cost weights for Personal Health: Hospital and Community Services, by ethnicity 28 Unweighted cost weights for Personal Health: Primary Care, female Māori/Pacific peoples, by NZDep2013 quintile (not smoothed) 29 Unweighted cost weights for Personal Health: Primary Care, female Māori/Pacific peoples, by NZDep2013 quintile (smoothed) 29 Figure 16: Unweighted cost weights for Personal Health: Primary Care, by sex 30 Figure 17: Unweighted cost weights for Personal Health: Primary Care, by NZDep2013 quintile 30 Figure 18: Unweighted cost weights for Personal Health: Primary Care, by ethnicity 31 Figure 19: Unweighted cost weights for Health of Older People: ARC, by sex 33 Figure 20: Unweighted cost weights for Health of Older People: ARC, by ethnicity 33 Figure 21: Figure 22: Unweighted cost weights for Health of Older People: Other, female, Pacific peoples, by NZDep2013 quintile (not smoothed) 34 Unweighted cost weights for Health of Older People: Other, female, Pacific peoples, by NZDep2013 quintile (smoothed) 34 Figure 23: Unweighted cost weights for Health of Older People: Other, by sex 35 Figure 24: Unweighted cost weights for Health of Older People: Other, by NZDep2013 quintile 35 Figure 25: Unweighted cost weights for Health of Older People: Other, by ethnicity 36 Figure 26: Figure 27: Figure 28: Figure 29: Figure 30: Unweighted cost weights for Mental Health, female, Pacific peoples, by NZDep2013 quintile and age (not smoothed) 37 Unweighted cost weights for Mental Health, female Pacific peoples, by NZDep2013 quintile and age (smoothed) 38 Unweighted cost weights for Mental Health, females, by NZDep2013 quintile and age 38 Unweighted cost weights for Mental Health, males, by NZDep2013 quintile and age 39 Unweighted cost weights for Mental Health, males and females, by ethnicity and age 39 Figure 31: Process flow chart for options for calculating rural adjuster 50 Figure 32: Comparison of proposed rural adjuster models 52 Figure 33: Figure 34: Figure 35: Aggregate cost weights for females of Other ethnicity, by age and NZDep Aggregate cost weights for males of Other ethnicity, by age and NZDep Aggregate cost weights for males of NZDep2013 quintile 4, by age and ethnicity 55 Figure 36: Population-based Funding Formula aggregate cost weights, by age, 2007/08 and 2014/15 55 Figure A1: Auckland District Health Board: NZDep2006 compared with NZDep Figure A2: Bay of Plenty District Health Board: NZDep2006 compared with NZDep Population-based Funding Formula Review 2015 Technical Report ix
10 Figure A3: Figure A4: Figure A5: Figure A6: Figure A7: Canterbury District Health Board: NZDep2006 compared with NZDep Capital & Coast District Health Board: NZDep2006 compared with NZDep Counties Manukau District Health Board: NZDep2006 compared with NZDep Hawke s Bay District Health Board: NZDep2006 compared with NZDep Hutt Valley District Health Board: NZDep2006 compared with NZDep Figure A8: Lakes District Health Board: NZDep2006 compared with NZDep Figure A9: MidCentral District Health Board: NZDep2006 compared with NZDep Figure A10: Nelson Marlborough District Health Board: NZDep2006 compared with NZDep Figure A11: Northland District Health Board: NZDep2006 compared with NZDep Figure A12: South Canterbury District Health Board: NZDep2006 compared with NZDep Figure A13: Southern District Health Board: NZDep2006 compared with NZDep Figure A14: Tairāwhiti District Health Board: NZDep2006 compared with NZDep Figure A15: Taranaki District Health Board: NZDep2006 compared with NZDep Figure A16: Waikato District Health Board: NZDep2006 compared with NZDep Figure A17: Wairarapa District Health Board: NZDep2006 compared with NZDep Figure A18: Waitemata District Health Board: NZDep2006 compared with NZDep Figure A19: West Coast District Health Board: NZDep2006 compared with NZDep Figure A20: Whanganui District Health Board: NZDep2006 compared with NZDep Figure A21: Unweighted cost weights for Personal Health: Hospital and Community Services, by sex 73 Figure A22: Unweighted cost weights for Mental Health, by sex 74 Figure A23: Percentage error by synthetic group for selected models Personal Health: Hospital and Community Services 83 x Population-based Funding Formula Review 2015 Technical Report
11 Executive summary The Population-based Funding Formula This report describes the 2014/15 Review of the Population-based Funding Formula (PBFF). The Ministry of Health uses the PBFF every year to distribute the bulk of the funding share of Vote Health to District Health Boards (DHBs). In 2015/16, the Ministry distributed approximately $11.7 billion 2 in this way. The PBFF system aims to give each DHB a similar opportunity, in terms of health resources, to respond to the needs of its population. It does not determine the overall level of funding DHBs receive (which is determined by the Budget process), nor how DHBs spend it. The PBFF covers a range of health services, including primary care, hospital and community care services, health of older people services, and mental health services. It does not cover disability support services for younger people, or public health services. The PBFF comprises two parts: the core model that determines relative health need and three adjusters that modify funding allocations between DHBs. The core model The most important factor in the PBFF model is the number of people in each DHB. That number having been determined, each DHB s share is adjusted for its particular demographic profile in terms of age, socioeconomic status, ethnicity (Māori, Pacific or Other) and sex. The socioeconomic variable was the New Zealand Index of Socioeconomic Deprivation 2006 which is a New Zealand small-area index of relative socioeconomic deprivation derived from census data. The core model of the PBFF system is based on cost weights: a cost weight is the national average expenditure per head per year for a person in a particular demographic group. Under the PBFF, the Ministry applies these cost weights to DHBs according to their numerical populations together with their demographic profiles in order to determine the share of funding each DHB should receive. For each financial year, the PBFF incorporates current DHB-level population projections produced by Statistics New Zealand. These projections are not part of any standard suite produced publicly by Statistics New Zealand; instead, Statistics New Zealand produces them for the Ministry of Health. The base (starting-point) for DHB ethnic population projections is the estimated resident population in that year, as opposed to the usually resident population. The estimated resident population is widely regarded as the best available measure of how many people live in a given geographic area, and their basic demographic characteristics (age, sex, major ethnic groups). The cost weights represent an estimate of future health need. The Ministry of Health calculates them from average DHB expenditure (at the national level) historically, using different service groups. 2 All financial figures in this report are expressed as GST exclusive. Population-based Funding Formula Review 2015 Technical Report xi
12 The adjusters In addition to demographic variables, there are three adjusters that modify the funding allocations between DHBs. The unmet need adjuster is a policy-based adjuster to target funding at population groups with issues accessing health services (Māori, Pacific peoples and those living in areas of high deprivation). The rural adjuster accounts for the cost of providing services in more rural areas. The overseas eligible and refugees adjuster accounts for the unavoidable costs of providing services to eligible overseas visitors, and is derived from estimated additional costs to DHBs. It includes an allowance to meet the high health costs of new refugees to New Zealand. The Review For the purposes of this Review, the Ministry set up a technical advisory group (TAG) comprising members from DHBs, the Ministry of Health and the Treasury. The formula was last updated in 2007/08 with the results coming into effect in 2009/10 financial year. Census 2013 is the basis of the current PBFF review which will come into effect in 2016/17. The Review investigated the extent to which the PBFF was: robust (developed with sound technical processes based on reliable evidence and data) legitimate (based on transparent formulae accessible to the sector and wider public) efficient (making use of formulae that were as simple as possible, with factors only included if they made, or could be expected to make, a significant material difference) effective (providing a workable outcome and minimising perverse incentives). The TAG broke the review process down into two key categories: review of the core model review of the adjusters. The TAG presented its recommendations to the Ministry s Policy Advice Improvement (PAI) Group and the Ministry provided recommendations to Ministers and Cabinet which were approved. Table 1 summarises these recommendations. xii Population-based Funding Formula Review 2015 Technical Report
13 Table 1: Summary of review of PBFF core variables and adjusters Component ($ in 2013/14 values) Core variables (approximately $10.8 billion) Unmet need adjuster (approximately $163 million) Rural adjuster (approximately $169 million) Overseas eligible and refugees adjuster (approximately $30.4 million) Tertiary adjuster (not part of PBFF) (approximately $120 million) Land adjuster (not part of PBFF) (approximately $9.2 million to Auckland DHB) Review recommendation Retain with updated inputs (age, sex, NZDep2013 and ethnicity (Māori, Pacific, Other)) Retain but update the current model with excess unmet need: variables are Māori and Pacific and people living in areas of high deprivation Retain but change to the rural population index model Retain with updated inputs and review the overseas eligible portion in one year with a report back as part of the 2017/18 DHB indicative funding advice Retain outside model The National Costing, Collection and Pricing Programme (NCCP) will review this adjuster and report back as part of the 2017/18 DHB funding advice Retain outside model Ministry of Health will provide recommendations in the 2016/17 indicative funding advice including a review process for the longer term The core model The Review recommended retaining the existing cost weight variables and not introducing new variables. It considered but decided against expanding the ethnicity categorisation to include Asian as a separate group. It also considered but decided against using burden of disease as a new variable. The Review recommended recalculating the core model cost weights by service group with the most up-to-date information available (2013/14 values by age, sex and ethnicity), and the latest version of the New Zealand Index of Deprivation (NZDep2013). The adjusters The unmet need adjuster The Review recommended retaining the unmet need adjuster but setting the amount by reference to excess unmet need based on the New Zealand Health Survey. 3 This produces a figure very similar to that of the prior model, but uses a more robust methodology. The Review considered but decided against using ambulatory sensitive hospitalisation (ASH) 4 rates in the model, because such an inclusion could be interpreted as rewarding system failure. The Review recommended retaining the current variables for distribution. It tested the current distribution variables against ASH and amenable mortality (AM) 5 rates to see if they gave a reasonable distribution of funding between DHBs, and found that the current variables performed well. 3 Excess unmet need is a measure of how much worse off the most deprived populations are, compared with the least deprived populations. Basing excess unmet need on the New Zealand Health Survey involves comparing the average rate of unmet need reported by non-māori and non-pacific peoples that live in NZDep 1 areas (ie, the least deprived quintile) to the average rate of unmet need reported by Māori and Pacific peoples who live in NZDep 4 and 5 areas (ie, the most deprived quintiles). The difference between the two rates is the excess unmet need. 4 Ambulatory sensitive hospitalisation rates measure the number of people who appear in hospital with conditions that could have been prevented or treated in out-of-hospital settings such as primary health care. 5 Amenable mortality rates measure the number of deaths that might have been prevented if health services had been delivered more effectively or if patients had accessed services earlier (either in primary care or in hospital). Population-based Funding Formula Review 2015 Technical Report xiii
14 The overseas eligible and refugees adjuster The TAG initially recommended that the adjuster for overseas eligible people be dealt with outside the model or dropped, due to concerns with the quality of the data used to calculate the component and inadvertent incentives provided by the indicator to increase administrative cost without improvement in health outcomes. However, the Minister of Health considers that the policy of compensating DHBs for overseas eligible patients remains valid, and desires that this component remain in the PBFF for one year, supported by further work to improve it. The Ministry plans to look at patient level data for overseas and refugee patients and cross-check it against immigration data. Currently the Ministry uses similar methods to check eligibility for primary health organisation (PHO) services. The Ministry will report back on this work as part of the 2017/18 DHB indicative funding advice at the end of Under the PBFF as it currently operates, the Ministry allocates DHBs extra funding for refugees based on estimates of annual settlement patterns and past recorded costs per refugee. Figure 1 presents the distribution of the overseas eligible and refugees adjuster funding pool by DHB in 2013/14 values. Figure 1: Distribution of overseas eligible and refugees adjuster pool by DHB, 2013/14 The rural adjuster The rural adjuster is based on rural population numbers and geography and the diseconomies of providing hospital services to a small population. The Review considered three options for allocating the rural adjuster against the criteria of fairness, flexibility, robustness and transparency. The Review ultimately recommended retaining the rural adjuster, but using a new weighted rural population index. First, the Ministry allocates DHBs funding from a rural pool to cover the additional costs of providing small and dispersed rural population groups with access to primary care, travel and accommodation, inter-hospital transport and community services. The allocation is based on measures of rural population numbers and estimated travel distance to services within the DHB and to tertiary-level services. xiv Population-based Funding Formula Review 2015 Technical Report
15 Secondly, the Ministry funds DHBs for two unavoidable diseconomies: that of providing full secondary-level hospital services for small populations (ie, at hospitals like Grey Base in the West Coast) and that of providing services on offshore islands such as the Chatham Islands. Small hospitals are located in towns which are not considered rural, and which were therefore not picked up in the weighted rural population index as it stood. The cost of services for offshore islands is considered extreme compared to other rural costs. The main advantage of the weighted rural population index is that it is a way of targeting funding more closely to DHBs with the most rural residents. A further advantage of using the index is that the prior spending patterns of DHBs are less likely to lock them into future funding entitlements with only a small necessary inclusion of cost structures to account for diseconomies. Figure 2 presents the distribution of the rural adjuster pool by DHB in 2013/14 values. Figure 2: Distribution of rural adjuster pool by DHB, 2013/14 Tertiary and land adjusters The Review recommended that the PBFF should include neither tertiary nor land adjusters. The NCCP will undertake a review of the tertiary adjuster and the role delineation model (RDM) as part of its work programme next year. Currently, a land adjuster is paid outside of PBFF to Auckland DHB for the cost associated with the high valuation of its land. A process for the review of this land adjuster will be part of the DHB 2016/17 funding advice. The revised PBFF cost weights As stated above, the Review recommended updating the core model cost weights. The following graphs (Figures 3, 4 and 5) illustrate the complete revised cost weights by age, sex, deprivation and ethnicity. The average cost per head of population by age group has remained largely stable. Of particular note are the higher cost weights for Māori and Pacific peoples compared with other population groups (ie, non-māori, non-pacific) and the higher cost weights for those living in areas of higher deprivation, as measured by the NZDep2013. Population-based Funding Formula Review 2015 Technical Report xv
16 Figure 3: Population-based Funding Formula aggregate cost weights for females of Other ethnicity, by age and NZDep2013 Figure 4: Population-based Funding Formula aggregate cost weights for males of Other ethnicity, by age and NZDep2013 xvi Population-based Funding Formula Review 2015 Technical Report
17 Figure 5: Population-based Funding Formula aggregate cost weights for males of NZDep2013 quintile 4, by age and ethnicity Figure 6 compares cost weights by age between the 2007/08 and 2014/15 PBFF reviews for those years. Given that these two sets of cost weights are based on different costs and base populations, they cannot be directly compared. However, the general trends they respectively demonstrate are remarkably similar until ages 65+, where a divergence appears. There is a number of possible reasons for increased aggregate cost weights for this age group, but the Review did not definitively quantify them. Figure 6: Population-based Funding Formula aggregate cost weights, by age, 2007/08 and 2014/15 The implementation of the PBFF Overall, the changes made to the PBFF following this year s Review are minimal. The small scale of the amendment to cost weights, in particular, indicates the robustness of the PBFF model over time. While the percentage of the total funding allocated by the rural and overseas eligible and refugees adjusters will not change markedly, there are material changes at a DHB level. Population-based Funding Formula Review 2015 Technical Report xvii
18 Table 2 shows the change in PBFF shares for 2015/16 between the current model and new model. Each DHB s 2015/16 PBFF share of the population is shown for comparative purposes. Table 2: DHB PBFF shares using current and new models and population shares, 2015/16 DHB Current PBFF model: 2015/16 New PBFF model: 2015/16 Percentage point variance Auckland 9.31% 9.12% -0.19% Bay of Plenty 5.55% 5.62% 0.07% Canterbury 10.94% 10.81% -0.13% Capital & Coast 5.76% 5.73% -0.03% Counties Manukau 10.81% 10.87% 0.06% Hawkes Bay 3.96% 3.95% -0.01% Hutt 3.09% 3.05% -0.04% Lakes 2.48% 2.54% 0.07% MidCentral 4.05% 4.08% 0.03% Nelson Marlborough 3.42% 3.40% -0.02% Northland 4.50% 4.63% 0.14% South Canterbury 1.46% 1.44% -0.02% Southern 6.78% 6.81% 0.03% Tairāwhiti 1.26% 1.30% 0.04% Taranaki 2.79% 2.73% -0.06% Waikato 8.91% 8.96% 0.06% Wairarapa 1.12% 1.11% -0.01% Waitemata 11.25% 11.23% -0.01% West Coast 0.89% 0.93% 0.04% Whanganui 1.69% 1.69% 0.00% Total % % 0.00% The final PBFF funding allocation relies on further data inputs including new population projections, new DHB starting points, and the level of new funding for DHBs. In addition, finalisation relies on the Minister of Health defining implementation rules that specify each DHB will receive a funding allocation comprising their previous year s funding plus a minimum increase percentage. In practical terms, this smooths the change in funding to DHBs and means that it can take a period of years to transition DHBs to their target PBFF share. Ultimately, the Government makes final funding allocations as part of the Budget process. For this reason, the Project Team cannot predict the full impact of the new PBFF model. It is important to note that individual DHB funding allocations are increased year on year across the board; what changes is the percentage share of overall funding for each DHB. This means that for a few DHBs, the annual funding growth rate will be less under the new model than under the previous model. The TAG and the Project Team recommend the following improvements prior to any future review: ensure all DHBs have a costing system in place and comply with costing standards update the RDM explore the feasibility of developing a set of cost outputs for mental health xviii Population-based Funding Formula Review 2015 Technical Report
19 improve non-governmental organisation (NGO) reporting for mental health explore the feasibility of developing a revised set of general ledger codes allow time for a research phase make review material and training slides available on the Ministry website. Audit An independent auditor audited the Review, and raised no concerns. Population-based Funding Formula Review 2015 Technical Report xix
20
21 Introduction This report describes the 2014/15 Review of the Population-based Funding Formula (PBFF) for district health boards (DHBs), and presents each DHB s percentage share of available funding as determined by the PBFF. What is the PBFF? The PBFF has been used to allocate funding to District Health Boards (DHBs) since 2003/04. This report details the Ministry of Health s 2014/15 Review of the PBFF. For the purposes of this Review, the Ministry set up a technical advisory group (TAG) comprising members from DHBs, the Ministry of Health and Treasury. It was last updated in 2007/08 with the results coming into effect in the 2009/10 financial year. Census 2013 is the basis of the current PBFF review which will come into effect in 2016/17. The scope The PBFF covers devolved health services that DHBs fund (approximately $11.7 billion). This includes primary care, hospital and community care services, health of older people and mental health. It does not cover younger Disability Support Services and Public Health. The PBFF does not: require boards to expend a specific amount in any service area compensate for additional costs of providing inter-regional/tertiary services set service level expectations (ie, require average intervention rates). Overview of the model The PBFF comprises: the core model that determines relative health need the adjusters that modify the funding allocations between DHBs by taking into account unmet need, rurality and overseas visitors and refugees. The core model The most important factor in the model is the number of people in each DHB. In addition to the number of people, the PBFF share is adjusted for the demographic profile (age, socioeconomic status (currently NZDep06), ethnicity (Māori, Pacific or Other), sex). The PBFF cost weights in the core model (cost of providing health care services) are then applied to each DHB population grouping, which gives the estimated PBFF share the DHB needs to provide for the range of health care services to its population. The adjusters In addition to the demographic variables the model also includes three adjustments to the costs of providing health services. Population-based Funding Formula Review 2015 Technical Report 1
22 Unmet need adjuster This is a policy based adjustment to target funding at population groups with access issues to health services. The current target groups are Māori, Pacific and those living in areas of high deprivation. Overseas eligible and refugees adjuster This adjusts for unavoidable costs of providing services to eligible overseas visitors and is derived from recent costs. It includes an allowance to meet the high health costs of new refugees to New Zealand. It includes cover for New Zealand citizens domiciled overseas who return to New Zealand for treatment, those patients for whom there is a reciprocal arrangement (UK and Australia and some Pacific Islands). Rural adjuster This compensates DHBs for having to provide services in more rural areas. The current adjuster services, inter-hospital transfers, travel and accommodation costs. The report begins with the background to the Review and an overview of the current PBFF model. It details the changes to be made to the PBFF model as a result of the Review: recalculation of core model cost weights by service group using 2013/14 data application of the latest version of the NZDep Index, from NZDep2006 to NZDep2013 redevelopment of the overseas eligible and refugees adjuster, with a further review of the overseas eligible portion in one year redevelopment of the rural adjuster, including application of a weighted rural population index redevelopment of the unmet need adjuster, including application of a new definition of excess unmet need. An independent auditor audited the Review, focusing on whether the technical results are consistent with the source data and reflective of the decisions from the Review. The audit found no issues with the accuracy of the work. The purpose of the Review was to examine the structure of the current PBFF to ensure it allocates funding equitably according to the relative need of DHB populations. The Review covered the following areas. Assessment of whether the current core model cost weight variables remain the best mechanism for determining relative health need Recalculation of the core model cost weight variables using the most recently available data Assessment of whether the adjusters (unmet need, overseas eligible and refugees, rural) remain appropriate mechanisms for adjusting funding allocations between DHBs Assessment of whether adjusters for land and tertiary services should be incorporated into the model. 2 Population-based Funding Formula Review 2015 Technical Report
23 To consider whether the tertiary adjuster should be included in the PBFF, the TAG commissioned an independent review of both the tertiary and rural adjusters from an independent research firm, Sapere. The Ministry of Health will implement the results of the Review in the 2016/17 financial year. The next major review of the PBFF will take place after the 2018 Census results become available. Population-based Funding Formula Review 2015 Technical Report 3
 to incorporate updated population data.")
24 Background The Ministry of Health developed the PBFF in 2000, based on then-available health service use data and population data. Cabinet approved the formula in November 2002 and directed that the Ministry review the PBFF every five years (following each population census) to incorporate updated population data. To be effective, the PBFF needs to be able to allocate funding according to the particular health needs of the population. The PBFF gives each DHB the same opportunity, in terms of resources, to respond to the needs of its population. In addition to PBFF shares, DHB funding includes a small number of permanent top slices for national services and temporary top slices for new initiatives. Figure 7 sets out how the PBFF operates in relation to the Budget. Figure 7: Guide to the PBFF and the Budget 4 Population-based Funding Formula Review 2015 Technical Report
25 The relevant Cabinet papers concerning DHB funding are: CAB (00) M 42/5 A, District Health Board funding: implementation of population-based funding CAB (00) M 42/5 B, District Health Board funding: appropriations CAB (00) M 42/5 C, District Health Board funding: structure of the population-based funding formula CAB (02) M 32/14, District Health Board funding: implementation of population based funding. The forthcoming update of the New Zealand Health Strategy may introduce some new elements to the way the health sector receives funds, for instance the extension of health investments and social investments. Nonetheless, it will remain the case that the Ministry of Health will need to distribute a very large amount of funding for core DHB business. It will continue to carry out this process using the PBFF; the amendments to the PBFF recommended by the review will improve the distribution process and its acceptability to DHBs. Population-based Funding Formula Review 2015 Technical Report 5
26 Overview of the Review Principles of the Review The Review investigated the extent to which the PBFF was: robust (developed with sound technical processes based on reliable evidence and data) legitimate (based on transparent formulae accessible to the sector and wider public) efficient (making use of formulae that were as simple as possible, with factors only included if they made, or can be expected to make, a significant material difference) effective (providing a workable outcome and minimising perverse incentives). The choice of factors upon which to distribute funding Smith, Rice and Carr-Hill (2001 page 222) say of the process of developing a formula to distribute funding to a nationwide health system: The general principles that should be applied when choosing needs factors should be that, other things being equal, they represent demonstrably material influences on the need to consume the service under consideration. It was important that clear criteria for inclusion of demographic factors were set, as the current variables were to be regularly reviewed for selection alongside potential new variables. Selecting variables can be a complex and sometimes controversial process. Smith, Rice and Carr-Hill (2001) put forward six reasons for this. Relevant data are often in short supply. Research evidence on appropriate needs factors is sparse, dated or ambiguous in its implication. There is great difficulty in handling covariance between needs factors. It is very difficult to disentangle legitimate needs factors from illegitimate (supply) influences on utilisation. The recipients of public sector budgets often feel that they have a clear idea about which needs factors will favour their area, and so will seek to influence the choice of needs factors through the political process. The central government (or distributor of funds) will often have a clear view on the result that it wishes to secure. The criteria chosen need to be robust enough to handle such challenges. Overseas examples of criteria for variables include the Norwegian set, which states that variables should: (a) be documented in previous analysis; (b) be included in capitation models in other countries; or (c) be judged as plausible based on medical literature (Magnussen 2010). 6 Population-based Funding Formula Review 2015 Technical Report
27 From its instigation, the PBFF had as its starting point the calculation of cost weights based upon the national average cost per head within defined demographic groups of health and disability support services. The first step in developing the formula was the choice of demographic factors. In considering potential factors for this purpose, the Ministry considered three criteria. 1. Was there a clear link between the factor and differences in need for health and disability services? 2. Was data available to allow us to calculate the difference in the current cost of meeting health and disability needs between demographic groups? 3. Was data available on the distribution of the factor within each DHB? The Ministry also desired a clear link between needs analysis, policy work and funding; the model would aid governance of the sector by allowing DHBs to look at their needs analysis and funding in terms of the same variables. Prior to development of the PBFF, much needs analysis and policy work focused on age, sex, socioeconomic status and ethnicity (See for example National Health Committee 1998; Ministry of Health 1999; Health Funding Authority and Ministry of Health 1998; Ministry of Health 2000; Minister of Health 2000; Mental Health Commission 1998). International health care funding models The Ministry of Health reviewed health care funding models in five comparable countries or states for their possible application to the PBFF: England, Scotland, Norway, New South Wales (Australia) and the Netherlands. Table 1 presents a summary of these examples. In England, the National Health Service s (NHS) formula generally considers age to be the main indicator of health need. However, the Government there rejected a formula proposed in 2012 because it did not accurately address unmet need. To correct this, the Government subsequently set aside 10 percent of total funding for clinical commissioning groups to be allocated by deprivation levels. England s formula has not yet factored in the rurality of an area s population, but work is under way to accommodate this (NHS England 2013). The NHS Scotland allocates funding across 14 territorial health boards according to a capitation formula that is similar to England s NHS. The formula makes some adjustment for the higher cost of delivering services in rural and remote areas. It also entails an urban rural classification for maternity services. The Scottish NHS uses deprivation levels, but does not explicitly use ethnicity (NHS Scotland 2007). Norway s health care expenditure per capita is one of the highest in the world, yet the country faces considerable challenges in the calculation of geographically equitable funding. It rejected one potential formula on the basis of politically unpalatable redistribution of funds between regions; components of the current formula have been agreed by a process of sound judgement. Magnussen (2010) notes the need in the Norwegian context for funding decisions to rely on a combination of empirical analysis and political strategy. New South Wales reformed its funding system during 2013/14, shifting the focus toward activity-based funding. The New South Wales funding formula discussed in Table 3 pertains to the system that was in place before this recent reform. This formula included variables designed specifically to capture unmet need in both homeless and indigenous populations (Gibbs et al 2002). Population-based Funding Formula Review 2015 Technical Report 7
28 The Netherlands operate a funding system based on competitive health insurance plans that initially seems incomparable with most aspects of New Zealand s capitation system. However, in the Netherlands, insurers receive half their income from a predominantly tax-based contribution that undergoes intricate risk-adjustment. This is made possible only by comprehensive databases of individual-level data. The Netherlands example shows that, as the availability of health data increases, there are increasing opportunities to hone the accuracy of New Zealand s population-based funding (Klazinga 2009). 8 Population-based Funding Formula Review 2015 Technical Report
29 Table 3: Summary of international funding models New Zealand England Scotland Norway Netherlands NSW Age/sex Age and sex are two variables within the cost weights. Age distribution is the first element applied to population in the weighted capitation formula, and is based on the national average spend on health services by age group. 20 age bands create a refined matrix of agesex weightings that are applied to the population. The age criteria makes up more than half the weighting for all parts of the capitation model except Ambulances and patient transport, totalling 53.89% of total weighting in the capitation model. Age and sex make up the first risk adjustment factor applied to the insured population. Age and sex weights are applied to the population count and applied across almost all of the programme components. Socioeconomic factors Standardised deprivation levels taken from census data make up a variable in the cost weights. Additional need over and above that relating to age is the second element applied, including calculations for socioeconomic status. The Additional need adjustment recognises relative additional needs based on mortality rate, unemployment rate, percentage of elderly on income support and deprivation level. The capitation model includes Employment status, Municipal socioeconomic index, Education level, and Social care recipient, all of which capture different aspects of socioeconomic status. Source of income is the second strata of risk adjustment applied, and distinguishes between five types of employment or welfare status. Socioeconomic status is a factor in the clustering of postcode areas. The Index of Education and Occupation applies a socioeconomic adjustment to the Health Needs Index. Rurality DHB funding allocations are adjusted to compensate DHBs for having to provide services in rural areas. Unavoidable geographical differences in the cost of providing services are the third element applied in the weighted capitation formula. Unavoidable geographical differences in the cost of providing services are applied in the weighted capitation formula. An urban-rural classification is included in the index for maternity services. The Ambulances and patient transport component includes the criterion travel distance to hospital to reflect the additional resource needed in the northern region. Rurality is not captured per se, but postcode areas with similar demographic and carerelated traits are gathered together into geographical clusters for the purpose of risk adjustment. The Dispersion Factor calculates distance from hospital and distance from nearest capital city, and is applied across three of the programme components. A national standard for measuring remoteness (ARIA) is included in the Health Needs Index. Diagnosis Diagnoses are not currently used in the funding formula (however, diagnosis is used in setting hospital prices, which set utilisation rates in the model). Inadequate information to summarise at this time. Inadequate information to summarise at this time. Diagnosis-related groups are used in calculating the activitybased funding portion of the formula. The diagnoses received by insured persons upon hospital discharge are gathered into the adjustment factor Diagnostic cost groups. Inadequate information to summarise at this time. Population-based Funding Formula Review 2015 Technical Report 9
30 New Zealand England Scotland Norway Netherlands NSW Unmet need Some funding is topsliced from the total allocation to compensate for gaps in utilisation data; this is targeted towards highneeds populations (those living in NZDep quintiles 4/5, Māori and Pacific peoples). Ten percent of the total funding will now be based on deprivation levels to reflect unmet need, with the intent of tackling health inequalities. An adjustment is made in the area of circulatory disease, as this is the only area in which there is consistent evidence of a shortfall in use of these services due to deprivation levels. The Index for climate and latitude is applied to Somatic care. Nonwestern immigrants is applied to psychiatric services and Metropolitan area is applied to substance abuse services. There is no adjustment for unmet need. Indigenous and homeless populations are given additional weighting in the population count to reflect unmet need. Ethnicity Ethnicity is a variable within the cost weights (Māori, Pacific peoples and Other). Inadequate information to summarise at this time. No adjustment is made for ethnicity, as the deprivation index sufficiently captures the additional needs of ethnic minorities that are related to their deprivation. The variable Nonwestern immigrants is included in the Psychiatric Care component. The proportion of nonwestern immigrants is factored in to the postcode area clustering. Aboriginal and Torres Strait Islanders are given additional weighting in the population count. They also receive additional weighting in the Health Need Index, to reflect their higher need for acute care hospital admissions. 10 Population-based Funding Formula Review 2015 Technical Report
31 Evaluation of variables The Project Team used the following criteria to evaluate potential variables for use in the PBFF: universally recorded, consistent and verifiable free from perverse incentives not vulnerable to manipulation reflects plausible determinants of individual need is not a measure of supply explains significant variation in the model feasible calibration to the model. This Review looked at the current variables (age, sex, ethnicity and socioeconomic status) alongside a selection of proposed new variables. Table 4 presents the results. The Review concluded that the current variables should be retained. There is substantial evidence that ethnicity and socioeconomic status should both be included as variables, as health disparities between ethnic groups are not due solely to socioeconomic factors (see for example Blakely et al 2007). Population-based Funding Formula Review 2015 Technical Report 11
32 Table 4: Review of existing and new variables against review criteria Criteria Universally recorded, consistent and verifiable Free from perverse incentives Not vulnerable to manipulation Reflect plausible determinants of individual need Not a measure of supply Explains significant variation in the model Calibration to the model feasible Age Met Met Met Met Met Met Met Sex Met Met Met Met Met No Met Ethnicity (Māori, Pacific peoples, Other) Largely met, but data quality issues exist Met Largely met Met Met Met Met, but data quality issues exist Socioeconomic status Met Met Met Met Met Met Met BMI Not met data is not consistently available and not readily available routinely Depends on construction if paid on % with high BMI, then perverse incentive exists Largely met BMI is an objective measurement but there is risk of measurement errors Largely met though BMI is not a perfect proxy of expected health need or health service utilisation in the next year Met individual based Possibly; unlikely to fully explain all the variation in the model Met but would require significant work. Major concerns about data quality Burden of disease Met this is available at an aggregate level across the country Depends on construction, but can be managed Largely met objective measurement, though capacity to benefit could be open to interpretation Met Met Possibly, but not clear unless further modelling work done Met but would require significant work Asian ethnicity Population projections are available for Asian ethnicities, but not available by Asian ethnic subgroups by age, sex and DHB Met Met No due to difficulties in disaggregating Asian Met Possibly, but not clear unless further modelling work done Met but would require significant work Prescription drugs as markers Met Not met Met Not met Not met Possibly, but not clear unless further modelling work done Met Other socioeconomic indicators Not met difficult to get consistent and reliable data on other socioeconomic factors Income would be most reliable and accessible Largely not met (depends on the indicator) Depends on the indicator some objective factors such as income are difficult to manipulate, while housing quality is difficult to standardise Largely met depends on the indicator. Income, for example, has a strong correlation with health status Met Possibly for some indicators, but not clear unless further modelling work done Met but would require significant work 12 Population-based Funding Formula Review 2015 Technical Report
33 Criteria Accident flags Environmental indicators Universally recorded, consistent and verifiable Met but data quality issues exist Free from perverse incentives Not vulnerable to manipulation Reflect plausible determinants of individual need Not a measure of supply Explains significant variation in the model Not met Not met Not sure Met Possibly, but not clear unless further modelling work done Met Met Data is objective, but effect of environment on health status is up for debate (thus manipulation) Not met as data is regional rather than individual. Also, environmental impact on health is influenced by other factors (such as income) Met Possibly, but not clear unless further modelling work done Calibration to the model feasible Met but would require significant work Met but would require significant work Population-based Funding Formula Review 2015 Technical Report 13
34 The Project Team discounted the majority of the alternative variables as not suitably meeting the criteria. However, the Team did identify two possible amendments as meriting further testing and possible incorporation into the PBFF in a subsequent review: expanding the ethnicity categorisation to include Asian as a separate group incorporating burden of disease as a variable. Including Asian as a separate group In the current PBFF, ethnicity is broken down as Māori, Pacific peoples and non-māori non- Pacific. The Review considered but ultimately decided against introducing an Asian category. The Asian population group is not homogenous; it includes people from a variety of ethnicities and backgrounds, 6 with different settlement histories. These factors all have an impact on health status and health need. For example, the Indian population has higher rates of obesity and cardiovascular disease and ischaemic heart disease hospitalisation rates than the total New Zealand population; this characteristic is not shared by other Asian ethnicities (Rush et al 2009; Stewart 2011). In New Zealand, as in other countries, there is evidence of the healthy migrant effect : in general, the health of individuals who have recently migrated to New Zealand tends to be better than that of the average population. This effect tends to erode over time. The 2013 Census found that approximately two out of ten people (23%) in the Asian population had been in New Zealand for less than five years (Statistics New Zealand 2014). The average health status of the Asian population may be influenced by the relatively better health of these recent migrants. Incorporating burden of disease as a variable The Project Team did not support adding burden of disease as a variable. The relationship between burden of disease (measured in disability-adjusted life years 7 (DALYs)) and health care expenditure is not only generally weak, but often inverse. That is, higher burden is typically associated with lower expenditure. This is not surprising considering a large component of DALYs is related to years of life lost, and people who have died do not require any health care expenditure. Cross-sectionally, there is little if any interpretable relationship between the two. The other limitation of using burden of disease as measured by DALYs in the PBFF context is that the measure does not take into account the cost-effectiveness of interventions. On the other hand, the current service data at a national level indirectly includes a cost-effectiveness component; DHBs are less likely to endorse the use of cost-ineffective interventions. If burden of disease were to be included as a variable, significant research would be needed on which markers of disease are significant predictors of expenditure. Burden of disease modelling is also affected by confounding variables. It would take several years to establish models and a further year s work to ensure uniform collection of information. It might be faster to use a model relying only on inpatient diagnosis. However, such models are known to have supply bias, which could create perverse incentives. The variable would only be impervious to manipulation if it depended on information collected throughout the whole health system, not solely inpatient information. 6 The Ministry of Health defines Asian people to include all people with origins in the Asian continent, from Afghanistan in the west to Japan in the east, and from China in the north to Indonesia in the south. 7 Number of disability-adjusted life years refers to number of years of healthy life lost due to ill-health, disability or early death. 14 Population-based Funding Formula Review 2015 Technical Report
35 The model The PBFF comprises: the core model that determines relative health need the adjusters that modify the funding allocations between DHBs by taking into account unmet need, rurality and overseas visitors and refugees. The PBFF core model calculates relative health need based on past use of health services and the average cost of providing those services. This data is then broken down according to the age, ethnicity, 8 sex and deprivation level of the population, and grouped into cost weights. A cost weight represents the average cost of delivering health services to an individual based on their demographic characteristics, and therefore an estimation of future health need. The PBFF thus allows the Ministry of Health to allocate funding to DHBs according to the relative health need of their population. While health service use is not the perfect proxy for health need, it remains the best available. The inherent limitations of using service use as a proxy for health needs include the following. Those in the most deprived populations may face barriers to accessing care, including affordability. Accessing services does not necessarily result in good health outcomes, nor are that services being provided to those who would benefit from them the most. The service mix model available in a particular DHB may not be optimal. Service use data can be limited in some settings for instance in community-based programmes such as those run by NGOs for mental health. A service use approach favours more expensive interventions. Accuracy of diagnosis is better in hospitals than primary care. The capacity of different DHBs to code accurately also differs. Funding does not guarantee capacity to deliver services. Other factors, including workforce factors, have an impact. The following diagram illustrates the general form of the PBFF formula over time. DHB's Populationbased Funding Share = DHB's Population (Age, Sex, Eth, Dep) National Population (Age, Sex, Eth, Dep) X X Σ Cost weights 1 (Age, Sex, Eth, Dep) Σ Cost weights 1 (Age, Sex, Eth, Dep) + + DHB's Rural Adjustment Total Rural Adjustment + + DHB's Overseas Adjustment Total Overseas Adjustment Where: Population Age Eth Dep = projected population as per Statistics New Zealand projections = age band = ethnicity = deprivation quintile 8 The PBFF assigns ethnicity using prioritised ethnic groups, where each person is allocated to a single group based on the those they have self-identified with, in a particular order of priority: Māori, Pacific peoples, Other. This means, for example, that if someone identifies as being Pacific peoples and Māori, the PBFF classifies them as Māori for the purpose of analysis. Population-based Funding Formula Review 2015 Technical Report 15
36 Service group = broad service group representing personal health, mental health and health of older people 1. Cost weights calculation: Σ Service Group 2 Costs (Age, Sex, Eth, Dep) Σ Cost weights = + Σ Population (Age, Sex, Eth, Dep) Unmet Need Policy Adjustment While the general formula has remained constant over time, improvements in the availability and quality of health data has enabled refinement of the cost weights and adjustments, both of which this report will explain in more detail later. The unmet need adjuster The significant health disparities between Māori and Pacific peoples and other New Zealanders are well documented across a wide range of health indicators. Similarly, significant health disparities are observed between people who live in the most deprived areas in New Zealand and those who live in the least deprived areas (over and above ethnic differences). The PBFF s cost weights are derived from the historical health care use (ie, met need ) of specific demographic groups. The fact that Māori, Pacific peoples and NZDep quintiles 4 and 5 residents experience poorer health outcomes than others suggests that these groups have health care needs that are not being met. Indeed, the New Zealand Health Survey reports that 27 percent of people face some unmet need for primary care, and that more individuals within Māori, Pacific peoples and NZDep quintiles 4 and 5 populations report unmet need than the rest of the population (Ministry of Health 2013). Therefore, the PBFF makes additional funding available for DHBs to address this excess unmet need. The rural adjuster The rural adjuster compensates for the extra costs of providing services to small or dispersed communities. The current adjuster separately estimates the costs to each DHB for small rural facilities, rural primary care, travel and accommodation, inter-hospital transport, governance, services provided on offshore islands and community services. Some expenditure estimates are based on actual DHB expenditure, and others are based on models. The overseas eligible and refugees adjuster The current overseas eligible and refugees adjuster compensates for the unavoidable differences in costs that DHBs face when providing services to eligible overseas visitors and refugees. It is based on actual past costs incurred by DHBs in providing these services. The adjustment for refugees covers additional costs known to be associated with the first three years of settlement for a refugee. 16 Population-based Funding Formula Review 2015 Technical Report
37 How the Population-based Funding Formula uses data Population data For each financial year, the PBFF incorporates DHB-level population projections produced by Statistics New Zealand. These projections are not part of any standard suite produced publicly by Statistics New Zealand; instead, Statistics New Zealand produces them for the Ministry of Health. Statistics New Zealand also provides a breakdown of age, sex and prioritised ethnicity population projections by DHB. The base (starting-point) for DHB ethnic population projections is the estimated resident population in that year, as opposed to the usually resident population. The estimated resident population is widely regarded as the best available measure of how many people live in a given geographic area, and their basic demographic characteristics (age, sex, major ethnic groups). Table 5 presents the differences between alternative population measures. Table 5: Characteristics of different population measures at the DHB level Group Census night population count Census usually resident population count Estimated resident population as at 30 June Residents who are present Yes Yes Yes Residents who are temporarily elsewhere in New Zealand No Yes Yes Visitors from elsewhere in New Zealand Yes No No Visitors from overseas Yes No No Adjustment for people who do not fill in census forms Adjustment for people who fill in more than one census form No No Yes No No Yes Residents who are temporarily overseas No No Yes Adjustment for birth, deaths and migration for subsequent period after census Adjustment for people who did not answer the ethnicity question No No Yes No No Yes Following a census, Statistics New Zealand conducts a post-enumeration survey (PES) to measure the completeness of census coverage. The PES measures both undercount (residents who should have been counted but were missed) and overcount (residents who were counted more than once, or visitors from overseas who were counted as residents). Since a PES was first run in 1996, undercount has been larger than overcount (ie, there has been a net census undercount). Importantly, the PES provides evidence about how the undercount varies between major population subgroups, which potentially affects funding allocation under the PBFF. 9 Because of the characteristics summarised in Table 5, the estimated resident population is widely regarded as the best available measure of how many people live in a given geographic area and their basic demographic characteristics. 9 Results of the PES can be found on the Statistics New Zealand website. Population-based Funding Formula Review 2015 Technical Report 17
38 The TAG has identified that in the future, the HealthTracker 10 may be a potential source of population data. The HealthTracker is a series of administrative health care data sets linked through National Health Index (NHI) numbers. This Review did not take it into account because there is currently no established methodology for projecting a HealthTracker population. Establishing such a methodology would require a significant amount of work, which was not within the scope of this Review. The 2013 New Zealand Index of Socioeconomic Deprivation The New Zealand Index of Socioeconomic Deprivation (NZDep) is a small area index of relative socioeconomic deprivation developed using census data by the University of Otago, Wellington School of Medicine. It was originally developed for the 1991 Census, and has been updated for each subsequent census. NZDep assigns relative deprivation scores to units called meshblocks, the smallest geographical units for which Statistics New Zealand gathers data. The 2013 version of NZDep used nine variables from the 2013 Census (presented in Table 6, in order of decreasing weight in the index) to derive each meshblock s deprivation score. Appendix 1 summarises changes between the 2006 and 2013 versions of NZDep, and the results by DHB. It is important to note that NZDep applies to areas, not individuals. Table 6: The nine dimensions of deprivation included in NZDep 2013 Dimension Communication Income Income Employment Qualifications Owned home Support Living space Transport Description People aged <65 with no access to the internet at home People aged receiving a means-tested benefit People living in equivalised* households with income below an income threshold People aged unemployed People aged without any qualifications People not living in own home People aged <65 living in a single-parent family People living in equivalised* households below a bedroom occupancy threshold People with no access to a car * Equivalisation: methods used to control for household composition. Deprivation scores range on an ordinal scale from 1 to 10, equating to ten deciles, decile 1 representing the least deprived areas and decile 10 the most deprived. The ordinal scale is designed so that each decile represents approximately 10 percent of the national population. At a DHB level the deciles reflect the respective DHB s population share of the respective decile. The PBFF model has previously used an NZDep output derived using the census usually resident population count. As census questions are used to inform the NZDep model, it makes perfect sense that meshblock scores are derived using this population measure. As a result of work between the University of Otago, Wellington and Statistics New Zealand on the 2013 NZDep, Statistics New Zealand were able for the first time to supply a population data set with 10 The HealthTracker is a set of data linkage methods. The HealthTracker produces its own population denominator known as the health service utilisation (HSU) population. The HSU population refers to the number of unique New Zealand residents who resided in New Zealand and had received any publicly funded health services in New Zealand within a time period of interest (usually within a year). One of the original aims of the HealthTracker is to provide disease prevalence estimates for a range of long term conditions by a number of demographic variables, such as DHB, age, gender, ethnicity, and NZDep. 18 Population-based Funding Formula Review 2015 Technical Report
39 NZDep included as at the 30 June 2013 estimated resident population. 11 This was derived using the NZDep2013 meshblock scores to determine the estimated resident population by deprivation decile. The Project Team considered whether to use the census usually resident population count (ie, the status quo) or the estimated resident population for NZDep data. The usually resident population undercounts Māori and Pacific peoples, resulting in a differential undercount. The Team decided to move to NZDep data based on estimated resident population, because it provides consistency with the population measure used as the starting point for population projections in the PBFF. Ethnicity data High-quality ethnicity data is essential for monitoring health trends by ethnicity. When calculating rates by ethnic group, numerator-denominator bias can occur. When ethnicity is collected in different ways across collections (eg, hospitalisation records and census data), numerator-denominator bias can occur in the calculation of rates (the same individual selfidentifying with different ethnicities over time and in different collections). Prioritisation Prioritisation of ethnicity 12 has been a health sector standard for a long time. At this point, there are no viable alternatives available. Prioritisation has the biggest impact on the Pacific peoples population group, because there is some significant overlap between the Māori and Pacific peoples ethnic populations. This effect is even more severe at different ages. For example, among those aged under five years, prioritisation reduces the Pacific peoples population by 31 percent. In addition, because multiple ethnicities are increasing over time, the ethnic overlap is increasing, and the effect of prioritisation is increasing. So for analytical and research purposes, it is difficult to argue the value of arbitrary prioritisation over total response. Whether reporting uses prioritisation or not, it should always evaluate the consistency of ethnic numerators with ethnic denominators. The ideal way of doing this is to link or match unit records from the numerator to the denominator and analyse reporting. Ethnic specific adjusters The Project Team sought out published work documenting the development of ethnic specific adjusters, for the purposes of the Review. The team only found adjusters for the Māori ethnic group; this is therefore the only adjuster for which this report presents data. Recent research has shown that Māori data on death registrations has improved to the point that there is no current net undercount of Māori deaths due to misclassification of ethnicity, as there was in the past (Fawcett et al 2008). Table 7 presents smoothed adjusters that were used to adjust hospital discharge data for an undercount in Māori hospitalisations due to misclassification of hospitalisation records in a series of Māori Health publications. 11 While NZDep2013 was supplied with the 30 June 2013 estimated resident population, it is not supplied with projection data, because it is a point-in-time index. As such, the assumption that the deprivation profiles of small areas remain constant until such time as the NZDep index is reviewed continues to apply. 12 Using this method, ethnicity is assigned using prioritised ethnic groups, where each person is allocated to a single group based on those they have self-identified with, in a particular order of priority: Māori, Pacific peoples, Other. This means, for example, that if someone identifies as being Pacific peoples and Māori, prioritisation classifies them as Māori for the purpose of analysis. Population-based Funding Formula Review 2015 Technical Report 19
40 Table 7: Final smoothed ethnicity adjusters (gender combined) for hospitalisation data Source and years Age group (in years) Hauora IV * Tatau Kahukura II ** Mātātuhi Tuawhenua: Rural Hospitalisations 2007 to 2011*** Tatau Kahukura III **** Notes: * Harris R, Purdie G, Robson B, et al Appendix 3: Estimating Māori Hospitalisation and Cancer Registrations. In Robson B, Harris R (eds). Hauora: Māori Standards of Health IV. A study of the years Wellington: Te Rōpū Rangahau Hauora a Eru Pōmare. ** Ministry of Health Appendix 4: Ethnicity adjusters for the analysis of hospitalisation data. In Ministry of Health. Tatau Kahukura: Māori Health Chartbook nd Edition. Wellington: Ministry of Health. *** Ministry of Health Appendix 3: Ethnicity adjusters for the analysis of hospitalisation data. In Ministry of Health. Mātātuhi Tuawhenua: Rural Hospitalisations 2007 to Wellington: Ministry of Health. **** Ministry of Health. in press. Appendix 4: Ethnicity: Adjusters for the analysis of hospitalisation data. In Ministry of Health. Tatau Kahukura: Māori Health Chartbook rd Edition. Wellington: Ministry of Health. The trend in the adjusters across time from to is a general decrease from more than 10 percent to around 1 percent. Tatau Kahukura: Māori Health Chartbook 2015 (Ministry of Health 2015) applied no adjusters to hospitalisation rates, as the smoothed adjusters were so close to 1. Use of multiple ethnic indicators raises some issues for the PBFF. Consideration of the most appropriate methods of categorisation of multiple ethnicities has been and will continue to be an issue in official statistics and health sector administrative data sets. The PBFF must not double count dollars or people, and therefore prioritisation of ethnicity is currently the best option. The Project Team have concluded that this approach best represents a match between the method and the purpose of the PBFF, in keeping with the conclusions of the report Classification and Output of Multiple Ethnicities: Considerations for Monitoring Māori Health (Cormack and Robson 2010, page 47): 20 Population-based Funding Formula Review 2015 Technical Report
41 There are potential strengths in having more than one option, however, as one single method is not always the most useful or appropriate. The health sector protocols recommend choosing the particular method that is most appropriate for the research question that is being asked, and being clear about what has been done. The Project Team did not believe there was enough empirical evidence to suggest that there should be a further adjustment to the cost weights by ethnic group. Health service use data The PBFF model uses individual-level service use data from national collections and payment systems, where that information is available, to determine the cost weights applied in the model. This data is aggregated into major service groups labelled Personal Health: Hospital and Community Services; Personal Health: Primary Care; Health of Older People: Aged Residential Care; Health of Older People: Other; and Mental Health. Table 8 presents these service groups, their respective data sources and the demographic variables. Later sections of this report discuss the development of the cost weights themselves. All modelled costs were weighted to the 2013/14 financial year for consistency. All financial figures mentioned in this report are to be considered as 2013/14 values. Table 8: Data sources for major service groups Service group Source data Variables Personal Health: Hospital and Community Services Personal Health: Primary Care Health of Older People: Aged Residential Care Health of Older People: Other Mental Health National Minimum Data Set (NMDS) National Non-Admitted Patient Collection (NNPAC) Pharmaceutical Warehouse (Pharms) Laboratory Warehouse (Labs) National Immunisation Register (NIR) PHO Register Client Claims Processing System (CCPS) NMDS NNPAC CCPS Programme for the Integration of Mental Health Data (PRIMHD) Age, sex, deprivation, ethnicity Age, sex, deprivation, ethnicity Age, sex and ethnicity Age, sex, deprivation, ethnicity Age, sex, deprivation, ethnicity For the purposes of the PBFF the Ministry of Health also compares service use data to DHB financial data, to assess the proportion of non-modelled expenditure for scaling in the final model. Most recently, it sourced this financial data from the DHBs 2013/14 profit and loss statements. In particular, it used expenditure from DHB financial accounts, 13 as this allows for a reasonable aggregation of DHB general ledger (GL) codes into comparable service groups. Table 9 outlines the proportion of expenditure modelled overall and by service group series general ledger (GL) codes. Population-based Funding Formula Review 2015 Technical Report 21
42 Table 9: Proportion of expenditure modelled from individual service use data by service group Major service group Percentage of expenditure modelled Personal Health: Hospital and Community Services Personal Health: Primary Care Health of Older People: Aged Residential Care Health of Older People: Other Mental Health Total Population-based Funding Formula Review 2015 Technical Report
43 Population-based Funding Formula cost weight testing Introduction This section outlines the process the Project Team carried out over the course of their Review in order to test the cost weight variables used in the PBFF. Appendix 2 provides full details of the Team s methodology. The following is a brief summary. Purpose The goal of the testing was to investigate whether the combinations of demographic variables in the PBFF model could be simplified by collapsing variables into a smaller number of categories or dropping variables altogether. The PBFF as a cell-based model The PBFF is a cell-based model. A cell-based model calculates costs for each unique group of age, sex, NZDep Quintile and ethnicity independently, avoiding interactions. Cell-based models are easier to understand, and allow problems with correlations between variables to be avoided. They make calculations more transparent and accessible; in the case of the PBFF, a cell-based model of the calculation of the final cost weights could be reproduced by others using partially aggregated summary data. In its testing of variables within the PBFF, the Project Team modelled cost weight variables for the major service groups separately, because the groups have very different usage patterns. The decision as to whether to collapse certain cells depends on whether there are cells which are too small, or whether using all of the cells results in overfitting. When exploring possible models involving collapsed cells, the Project Team assigned individuals into groups to create hypothetical geographic populations. Methods and data sources The Project Team based its testing on how well health expenditure could be predicted in the 2013/14 financial year, using various cell-based models fitted to the previous two years of expenditure. The Team tested this fit by cross-validation: a technique for evaluating the predictive power of a model that is robust against overfitting. Cross-validation partitions data into two sets: a training set that the model is built upon and a testing set to evaluate predictions against. The models the Team tested were based on modifying the full model by either one or two variables at a time. The Team combined the variables into a number of models as follows: full age, sex, ethnicity and NZDep quintile unmodified per capita removing all demographic information except number of people Population-based Funding Formula Review 2015 Technical Report 23
44 replacing one variable at a time in the full model replacing two variables at a time in the full model. Service use data was available for 88 percent of health system activity relating to devolved funding across three years. The evaluation criteria the Team used to test the models were that the prediction error for all individual synthetic groups 14 was within one percentage point and that the administrative demographic data was available and of sufficient statistical quality for the preferred models. Key findings The Project Team decided to adopt the model using five-year age bands up to 85+ years for all major service groups, except for Health of Older People: Aged Residential Care, where it is worth including 90+ years. Collapsing ethnicity variables did not sufficiently address the problem of volatility of cost weights in older age groups with small sizes. The Team did not see it as worthwhile to move away from the current three prioritised ethnic groups if such a move did not address this volatility. The Team considered it desirable to have a single model for nearly all major service groups, to provide consistency and transparency. The per capita model consistently performed worse than any other model. Aside from this, there was little material difference in how well the models could predict health care expenditure. The full model that is, the model that made use of all possible combinations of: five-year age bands, sex, prioritised ethnicity and NZDep2013 quintiles did not have the best predictive power of all the models tested (note that this is not the status quo, but rather the complete combination of all demographic variables). The consistently worse results for the per capita model across all major service groups confirms that age band, sex, prioritised ethnicity and NZDep demographic variables are useful predictors of health care expenditure, as expected. Slightly improved fit was possible at the service group level from simplification of the model, but there was no consistency across service groups to provide guidance in how to simplify. Of particular note is the continuing evidence of higher cost weights for Māori and Pacific peoples, compared with other (ie, non-māori, non-pacific) New Zealanders, and the higher cost weights for those living in areas of higher deprivation, as measured by the NZDep2013. Taking into account deprivation, Māori and Pacific peoples still have higher cost weights than non- Māori, non-pacific people. This is in keeping with research that has shown that the difference in health status between ethnic groups is not solely due to differences in socioeconomic status (see for example Blakely et al 2007). 14 The synthetic groups were artificially generated groups that were statistically representative of different areas in New Zealand: that is, they looked similar to the real New Zealand population area groups when analysed. For example, they had similar proportions of Pacific peoples and people aged over 65, and a similar association between ethnicity and deprivation. 24 Population-based Funding Formula Review 2015 Technical Report
45 Personal Health: Hospital and Community Services Summary The Project Team derived cost weights for the Personal Health: Hospital and Community Services service group using National Minimum Dataset (NMDS), and National Non-Admitted Patients Collection (NNPAC) data extracts from the financial years 2011/ /14. The final analysis uses data from 2013/14 only, and models age, sex, deprivation and ethnicity. Where the Team found model results to be unstable, it smoothed results by modelling the interaction between age, sex and deprivation and then making a multiplicative adjustment to account for the differential costs attributable to ethnicity. Methodology The Project Team derived cost weights for this service group using the sum of estimated costs 15 in the 2013/14 financial year divided by the sum of the population by age, sex, NZDep2013 quintile and ethnicity. It sourced service use data from NMDS and NNAPC and supplemented it with data on additional expenditure from DHB financial accounts. The Team defined population group variables as age band (five-year age groups up until 85+ years), sex, NZDep2013 quintile and prioritised ethnicity. The Team added NZDep2013 data through the NHI, based on meshblocks. Where deprivation was not assigned, the Team added associated cost to the quintiles using the known quintile proportions for each age, sex and ethnic population group (approximately 3.24% of modelled data). The Team included prioritised ethnicity data as follows: Māori, Pacific peoples and Other. When the Project Team modelled the interaction between all four variables it found instability due to small data size in the costs weights. Within this particular service group, the instability began to be influential from the years age band onwards. To adjust for this, the Team applied smoothing to age bands above 55 years by modelling the interaction between age band, sex and NZDep2013 and then applying a multiplicative adjustment for ethnicity that simulates the differential effect for ethnicity not described by age band, sex and deprivation for the 55+ years age bands. Table 10 illustrates the adjustment factors with figures greater than one representing that the model by age, sex and NZDep2013 alone underrepresents the respective ethnic group and vice versa. Table 10: Personal Health: Hospital and Community Services smoothing factors Female Male Māori Other Pacific peoples Māori Other Pacific peoples Figures 9 and 10 further illustrate the impact of the adjustment. Note the y axis in Figure 10 has been constrained for illustrative purposes due to an extreme outlier. 15 Appendix 3 presents event cost methodology. Population-based Funding Formula Review 2015 Technical Report 25
 26 Population-based Funding Formula Review 2015 Technical")
46 Figure 9: Unweighted cost weights for Personal Health: Hospital and Community Services, female Pacific peoples, by NZDep2013 quintile (not smoothed) Figure 10: Unweighted cost weights for Personal Health: Hospital and Community Services, female Pacific peoples, by NZDep2013 quintile (smoothed) 26 Population-based Funding Formula Review 2015 Technical Report

47 Results Figures 11, 12 and 13 show the final cost weights by sex, by NZDep2013 quintile and by ethnicity, and show a clear relationship between age and sex, age and NZDep2013 and age and ethnicity. The general trends of these results are consistent with previous iterations of the PBFF model. Figure 11: Unweighted cost weights for Personal Health: Hospital and Community Services, by sex Figure 12: Unweighted cost weights for Personal Health: Hospital and Community Services, by NZDep2013 quintile Population-based Funding Formula Review 2015 Technical Report 27
48 Figure 13: Unweighted cost weights for Personal Health: Hospital and Community Services, by ethnicity Personal Health: Primary Care Summary The Project Team developed Personal Health: Primary Care cost weights using service use data from the National Pharmacy (Pharms), Laboratory (Labs) data collections, the National Immunisation Register (NIR), and also capitation data from the PHO enrolment register. The team obtained service use data for the period 2011/ /14 and capitation data from the 2014 Quarter 1 register. The final analysis uses data from 2013/14 only from the service usebased data, and annualises the 2014 Quarter 1 register. It models age, sex, deprivation and ethnicity. Where the Team found model results to be unstable, it smoothed results by modelling the interaction between age, sex and deprivation and then making a multiplicative adjustment to account for the differential costs attributable to ethnicity. Methodology The Project Team derived cost weights for this service group using the sum of actual costs 16 in the 2013/14 financial year divided by the sum of the population by age, sex, NZDep2013 quintile and ethnicity. It sourced service use data from the Pharms and Labs national collections, the NIR and the PHO enrolment register. The PHO capitation funding streams the Team included are for First Contact, Health Promotion and Services to Improve Access. The Team defined population group variables as age band, sex, NZDep2013 quintile and prioritised ethnicity. Age band consists of five-year age groups up until 85+ years. The Team added NZDep2013 data through the NHI, based on meshblocks. Where deprivation was not assigned, the Team added associated cost to the quintiles using the known quintile proportions for each age, sex and ethnic population group (approximately 2.48% of modelled data). The Team included prioritised ethnicity as follows: Māori/Pacific peoples and Other. Māori and Pacific ethnic groups were merged for this service group as they both had significant variation from the Other ethnic group but did not significantly vary from each other. 16 The Team used actual costs where available. It used gross drug cost (as opposed to gross reimbursement cost) for Pharmacy, due to the robustness of the data. It used estimated amount paid as provided in the Labs collection where tests were covered by a bulk funding arrangement. The Team annualised PHO costs. 28 Population-based Funding Formula Review 2015 Technical Report


49 As with the Personal Health: Hospital and Community Services service group, cost weight instability occurred in the modelling due to small cell size. Analysis identified that instability occurred at the same points, so the Team applied the same smoothing methodology. Table 11 shows the Personal Health: Primary Care smoothing factors. Figures 14 and 15 give an example of the adjustment. When compared to Personal Health: Hospital and Community Services, the smoothing factors for this service group have a noticeably smaller impact. Table 11: Personal Health: Primary Care smoothing factors Female Male Māori/Pacific Other Māori/Pacific Other Figure 14: Unweighted cost weights for Personal Health: Primary Care, female Māori/Pacific peoples, by NZDep2013 quintile (not smoothed) Figure 15: Unweighted cost weights for Personal Health: Primary Care, female Māori/Pacific peoples, by NZDep2013 quintile (smoothed) Population-based Funding Formula Review 2015 Technical Report 29

50 Results Figures 16, 17 and 18 show the final cost weights by sex, by NZDep2013 quintile and by ethnicity. The results for this service group share traits with Personal Health: Hospital and Community Services. However, age explains the majority of the variation in costs per person. Figure 16: Unweighted cost weights for Personal Health: Primary Care, by sex Figure 17: Unweighted cost weights for Personal Health: Primary Care, by NZDep2013 quintile 30 Population-based Funding Formula Review 2015 Technical Report
51 Figure 18: Unweighted cost weights for Personal Health: Primary Care, by ethnicity Health of Older People Summary The Project Team developed Health of Older People cost weights using service use data from NMDS and NNAPC for assessment, treatment and rehabilitation (AT&R) services and from the Client Claims Processing System (CCPS) for home support services and aged residential care (ARC). The Team obtained data for the period 2011/ /14; the final analysis uses data from 2013/14 only. For the final model, the Team split Health of Older People into two categories: ARC and Other (AT&R and home support). Health of Older People: ARC models age, sex and ethnicity. The results for this category were largely stable: only a single cell was constrained due to data issues. Health of Older People: Other models age, sex, deprivation and ethnicity. Where the Project Team found model results to be unstable, it smoothed results by modelling interaction between age, sex and deprivation and then making a multiplicative adjustment to account for the differential costs attributable to ethnicity. Methodology Health of Older People: ARC The Project Team derived cost weights for Health of Older People: ARC using the sum of actual costs 17 in the 2013/14 financial year divided by the sum of the population by age, sex and ethnicity. It sourced service use data from CCPS. The Team defined population group variables as age band, sex and prioritised ethnicity. Age band consists of five-year age groups from years to 90+ years. The Team included prioritised ethnicity as follows: Māori, Pacific peoples and Other. The Team did not include deprivation in the model, as this variable, which is a location-based index, is not considered to have a material relationship with the cost of ARC services. For people living in an aged care facility, the deprivation score would be based on the location of the facility, and would therefore add no additional information. 17 Actual costs represent the sum of the government contribution for episodes within the given financial year as recorded in CCPS. Population-based Funding Formula Review 2015 Technical Report 31
52 Unlike the other service groups, Health of Older People: ARC only models the interaction between three variables. As such, the Team did not need to apply a smoothing methodology. However, the Team noted that the male, Pacific peoples, 90+ years cell returns a lower value than the male, Pacific peoples, years cell. The Team attributed this to small cell size, and therefore assigned the cell the same value as the male, Pacific peoples years cell. Health of Older People: Other The Project Team derived cost weights for Health of Older People: Other using the sum of a combination of actual costs and estimated costs 18 in the 2013/14 financial year divided by the sum of the population by age, sex and ethnicity. It sourced service use data from the NMDS, NNPAC and CCPS. The Team defined population group variables as age band, sex, NZDep2013 quintile and prioritised ethnicity. Age band consists of five-year age groups to 85+ years. The Team added NZDep2013 data through the NHI, based on meshblocks. Where deprivation was not assigned, the Team added associated cost to the quintiles using the known quintile proportions for each age, sex and ethnic population group (approximately 6.09% of modelled data). The Team included prioritised ethnicity as follows: Māori, Pacific peoples and Other. As with other service groups, there were instances where cost weight instability occurred; the Team therefore applied smoothing to age bands above 50 years. The Team applied smoothing using the same methodology as it did for the Personal Health: Hospital and Community Services and Personal Health: Primary Care service groups, with the different age band range. Table 12 presents the smoothing factors the Team used for Health of Older People: Other. Note that these smoothing factors more closely resemble those used for Personal Health: Hospital and Community Services than those used for Personal Health: Primary Care. Table 12: Health of Older People: Other smoothing factors Female Male Māori Other Pacific peoples Māori Other Pacific peoples Actual costs represent the sum of the government contribution for episodes within the given financial year as recorded in CCPS. The Team derived estimated costs using the methodology outlined in Appendix 3 for NMDS and NNPAC data. 32 Population-based Funding Formula Review 2015 Technical Report
53 Results Health of Older People: ARC Figures 19 and 20 show the final cost weights by sex and by ethnicity. Figure 20 highlights the relationship between age and ethnicity for ARC: in higher age bands the cost weights for Health of Older People: ARC climb significantly with respect to both Māori and Pacific peoples. Figure 19: Unweighted cost weights for Health of Older People: ARC, by sex Figure 20: Unweighted cost weights for Health of Older People: ARC, by ethnicity Population-based Funding Formula Review 2015 Technical Report 33
54 Health of Older People: Other Figures 21 and 22 give an example of the impact of smoothing on the Health of Older People: Other cost weights. Note that the scale in Figure 21 has been constrained for comparative purposes, as the 85+ years, Quintile 2 weight value climbs to 12,789. Figure 21: Unweighted cost weights for Health of Older People: Other, female, Pacific peoples, by NZDep2013 quintile (not smoothed) Figure 22: Unweighted cost weights for Health of Older People: Other, female, Pacific peoples, by NZDep2013 quintile (smoothed) 34 Population-based Funding Formula Review 2015 Technical Report
55 Figures 23, 24 and 25 show the final cost weights by sex, by NZDep2013 quintile and by ethnicity. They demonstrate clear relationships between all variables as age increases. Figure 23: Unweighted cost weights for Health of Older People: Other, by sex Figure 24: Unweighted cost weights for Health of Older People: Other, by NZDep2013 quintile Population-based Funding Formula Review 2015 Technical Report 35
 from the financial years 2011/12 2013/14. DHBs purchase mental health services on an input basis (eg, available beds) and do not record prices at the patient event level.")
56 Figure 25: Unweighted cost weights for Health of Older People: Other, by ethnicity Mental Health Summary The Project Team derived Mental Health cost weights from the Programme for the Integration of Mental Health Data (PRIMHD) from the financial years 2011/ /14. DHBs purchase mental health services on an input basis (eg, available beds) and do not record prices at the patient event level. The Project Team calculated a list of proxy cost assumptions for a range of event types; this method represents a departure from the cost assumptions agreed upon in the 2006/07 PBFF Review. The Team tested options for all variables and combinations of variables. The variables used in the preferred model are age, sex, deprivation and prioritised ethnicity. Background PRIMHD is considered to be a near complete data set. Generally, data on inpatient activity is considered complete, but there is some doubt around the completeness of non-inpatient data. The Mental Health and Addictions team within the Ministry of Health have estimated that PRIMHD captures over 90 percent of the applicable mental health activity in New Zealand. The Ministry of Health is aware that some of the missing 10 percent is accountable to missing NGO data, and had made an adjustment to PRIMHD accordingly. PRIMHD does not record any pricing data, so the Project Team developed a cost assumption methodology to use as an input into the Mental Health cost weights. It calculated cost assumptions based on a series of estimated weightings for various types of events and the total DHB spend on mental health activity. This methodology and the results it produced are not intended to be used outside of the PBFF Review, and do not constitute a national pricing framework for mental health activity. Appendix 4 presents details of the cost assumption methodology. 36 Population-based Funding Formula Review 2015 Technical Report


57 The 2006/07 Mental Health cost weights were based on data derived from the Mental Health Information National Collection (MHINC). This data set does not include any cost data and NGO event data was limited. Some additional NGO event data was available direct from DHBs. Analysis of the available data in the MHINC found that Māori service use was underrepresented. An adjustment was therefore made to the MHINC data for recorded Māori events. Proxy prices were calculated based on the split between contact and bednight events in the MHINC data set and the total DHB spend on mental health activity. Methodology The Project Team derived Mental Health cost weights from calculated cost assumptions and a combination of actual and estimated service use data. It defined population profile groups by age, sex, NZDep2013 quintile and prioritised ethnicity. The age groups were five-year age bands to 85+ years. Prioritised ethnicity data came from a combination of the PRIMHD prioritised ethnicity classification and the mapped NHI prioritised ethnicity classification. Where deprivation was not assigned, the Team added associated cost to the quintiles using the known quintile proportions for each age, sex and ethnic population (approximately 0.37% of modelled data). The Project Team explored small data cell smoothing options, and ultimately applied smoothing to all age bands by modelling interaction between age, sex and NZDep2013 quintile and applying a multiplicative adjustment to account for the differential costs attributable to ethnicity. Figures 26 and 27 give an example of the effect of smoothing on the cost weights for this service group. Figure 26: Unweighted cost weights for Mental Health, female, Pacific peoples, by NZDep2013 quintile and age (not smoothed) Population-based Funding Formula Review 2015 Technical Report 37


58 Figure 27: Unweighted cost weights for Mental Health, female Pacific peoples, by NZDep2013 quintile and age (smoothed) Results Figures 28 and 29 show the final Mental Health cost weights for females and males by NZDep2013 quintile and age. Figure 30 shows the final Mental Health cost weights for combined sex by ethnicity and age. The patterns of service use illustrate the relationship between age, sex, deprivation and ethnicity. The Mental Health service group shows a distinctly different pattern of service use and expenditure by age when compared to the other service groups. The relationship between age and NZDep2013 seems the most marked when this service group is compared to the others. Age by ethnicity shows a different trend to the other service groups altogether: the Pacific peoples ethnic group has lower value cost weights compared to the Māori ethnic group. Figure 28: Unweighted cost weights for Mental Health, females, by NZDep2013 quintile and age 38 Population-based Funding Formula Review 2015 Technical Report


59 Figure 29: Unweighted cost weights for Mental Health, males, by NZDep2013 quintile and age Figure 30: Unweighted cost weights for Mental Health, males and females, by ethnicity and age Population-based Funding Formula Review 2015 Technical Report 39
60 Population-based Funding Formula adjuster development As part of its Review of the PBFF, the Project team set out to test the reliability of the respective adjusters. This section outlines their findings. The unmet need adjuster Summary The unmet need adjuster accounts for actual or potential health care costs that are not captured by the data informing the core model of the PBFF. The additional funding allocated through the adjuster aims to reduce inequity and improve population health outcomes overall and the sustainability of the health system. Unmet need arises when barriers to accessing primary care (such as cost, health literacy, distance and availability of after-hours care) prevent timely intervention. When need escalates, many people whose needs were unmet in primary care reach secondary services via acute admissions. Individuals reporting higher levels of unmet need may incur the same (or higher) levels of expenditure in secondary services, but they arrive there later and sicker. If a person s need has been met in primary care then we can expect that access to secondary care should follow only as necessary. In any event, once a person has made contact with primary care, that individual is in the system, which contains levers such as referral guidelines to address unmet need. This justifies focusing on primary care as an avenue to address unmet need. There is no one right level for the additional unmet need weighting built in to the PBFF; rather, it is a matter of policy. In calculating the unmet need adjuster the Ministry of Health has therefore considered available evidence on health disparities. The unmet need adjuster was originally set at $120 million (2002 values), targeted at Māori and Pacific peoples populations and at those in high-deprivation areas. In 2013/14, the value of the unmet need adjuster was $165 million. The funding was primarily intended to reduce the costly secondary admissions resulting from unmet need. Methodology Amount The Project Team considered four options for calculating the amount of an unmet need adjuster: keep the status quo. benchmark against excess unmet need. benchmark against ambulatory sensitive hospitalisation 19 (ASH) rates. remove the unmet need adjuster altogether. 19 Ambulatory sensitive hospitalisation rates measure the number of people who appear in hospital with conditions that could have been prevented or treated in out-of-hospital settings such as primary health care. 40 Population-based Funding Formula Review 2015 Technical Report
61 Distribution The Project Team tested the current distribution variables (ethnicity and NZDep2013) against ASH and amenable mortality 20 (AM) rates. These are considered excellent measures of unmet need, so provide a good test of the distribution model. Results Amount Option 1: Keep the status quo The current unmet need adjuster was calculated from an estimate of the likely cost of services to improve primary care access, balanced by consideration of affordability within the overall allocation. The current factors in the unmet need adjuster are ethnicity (Māori and Pacific peoples ethnicities have a weighting of 1) and socioeconomic position (NZDep2013 quintiles 4 and 5 have a weighting of 1). These factors were chosen because the evidence has shown these two factors to be very good proxies for health need. The current model is a bottom-up estimate of addressing some of the unmet need in primary care. The next two options involve top-down calculations. Like Option 1, these options continue to benchmark unmet need against primary care funding. Option 2: Benchmarking against excess unmet need Option 2 was to use an estimate of the excess unmet need. The Project Team derived this figure from the New Zealand Health Survey, by comparing the average rate of unmet need reported by non-māori and non-pacific peoples who live in NZDep quintile 1 areas (ie, the least deprived areas) with the average rate of unmet need reported by Māori, Pacific peoples and those who live in NZDep quintiles 4 and 5 areas. The Team called the difference between these two rates the excess unmet need. It is a measure of how much worse off the most deprived populations are when compared with the least deprived populations. The Team found 304,000 more people in the most deprived group (as defined above) reporting unmet need than would be expected if that group had the same rate of unmet need as the least deprived group (as defined above). This represents 6.79 percent of the population. If we allocated to each of these people an extra amount equal to the average cost of primary care per person per year, the following calculation would follow. (Note that this is a proxy measure of unmet need: these people do have some if not complete access to meet their health needs.) Unmet need value = 6.79 percent x total annual primary care funding ($2,400 million) Unmet need value = $163 million The closeness of this figure to the current unmet need adjuster ($165 million) is coincidental, but suggests that the current adjuster is reasonable. 20 Amenable mortality rates measure the number of deaths that might have been prevented if health services had been delivered more effectively or if patients had accessed services earlier (either in primary care or in hospital). Population-based Funding Formula Review 2015 Technical Report 41
62 Option 3: Benchmarking against ambulatory sensitive hospitalisation rates Option 3 was to use excess ASH rates as an adjuster for unmet need. Māori and Pacific peoples are significantly more likely to experience an ASH; although they make up 22.0 percent of the total New Zealand population, these groups made up 30,478 (35.8%) of the 85,067 ASHs in 2013/14. If Māori and Pacific peoples had the same ASH rate as other ethnicities, we would expect there to have been only 16,605 ASHs in 2013/14, instead of 30,478. This means there was an excess of 13,873 ASHs (ie, the figure can only be explained by ethnicity), or 16.2 percent of the total ASHs. Once again, it must be noted that this is a proxy measure of unmet need. These people do have some if not complete access to meet their health needs. Using ASH rates to measure unmet need, the following calculation would follow. Unmet need value = 16.2 percent x total annual primary care funding ($2,400 million) Unmet need value = $389 million Two points regarding option 3 are important. First, the calculated excess of 16.2 percent only represents Māori and Pacific peoples. It does not include residents in NZDep quintiles 4 and 5. If this group was taken into account, the excess would be in the order of 40 percent, due to the strong correlation between deprivation and ASH. This would lead to an unmet need adjuster of $960 million. Secondly, the risk with using ASH as a benchmark is that ASHs represent the worst case scenario of failed primary care (aside from death), and are unlikely to reflect accurate rates of unmet need for different populations. Rates of ASHs only represent unmet need resulting in hospitalisation; they do not reflect the wider volume of unmet need that does not lead to acute admission. In addition, ASHs occur from poor quality primary care as well as unmet need. Poorquality primary care is undesirable, but it has different drivers than unmet need and should not be conflated. Option 4: Remove the unmet need adjuster A final option was to remove the unmet need adjuster altogether. The Project Team decided against this, as it would undermine the needs-based formula. Preferred option The Project Team preferred Option 2: calculation of the unmet needs adjuster based on excess unmet need based on the New Zealand Health Survey. This approach produced a very similar figure to the status quo but used a more robust methodology. Distribution of funding between DHBs As discussed above, the current variables performed well against ASH and AM rates. Ambulatory sensitive hospitalisation rates in particular are extremely strongly correlated with Māori and Pacific peoples and NZDep quintiles 4 and 5 populations (over 70% of ASHs occur in those populations). The Review did not recommend using ASH or AM rates in the model, as this could be interpreted as rewarding system failure. Therefore, the review decided to retain the current distributions, variables and weights. 42 Population-based Funding Formula Review 2015 Technical Report
63 The overseas eligible and refugees adjuster Summary The PBFF does not directly fund DHBs for providing health care services to overseas eligible patients and refugees, as they are not included or counted in a DHB s resident population, which is the core basis of the PBFF. As such, the PBFF has always included an adjuster to compensate DHBs for the costs they incur in regard to these patients. Ineligible overseas patients are required to pay for services; any bad debts associated with this are considered a DHB overhead cost. Where a DHB s costs are above average for bad debts, it receives additional funding outside of the PBFF. The basis for the refugee component of this adjuster is twofold: specific costs submitted by DHBs, and a calculation of the annual cost of treating refugees. Overseas eligible patients Methodology In order to test the reliability of the overseas eligible adjuster, the Project Team set out to calculate the actual cost of overseas eligible patients. It produced a three-year data set from the NMDS using a specific overseas eligible identification code. It then sent a data request to all DHBs asking them to either validate the data or provide a revised set of figures. Eighteen of twenty DHBs verified the data. Using the revised data, the Team calculated the average annual cost that each DHB incurs from treating overseas eligible patients. Table 13 summarises the results. Population-based Funding Formula Review 2015 Technical Report 43
64 Table 13: District health board costs for overseas eligible patients 2011/ /14 DHB 2011/12 actual at 2013/14 values $ 2012/13 actual at 2013/14 values $ 2013/14 actual at 2013/14 values $ Average annual cost at 2013/14 values $ Auckland 1,221,497 1,205,615 1,002,603 1,143,238 Bay of Plenty 576, , , ,110 Canterbury 6,766,951 8,862,430 10,477,540 8,702,307 Capital & Coast 3,477,843 3,789,266 3,602,868 3,623,326 Counties Manukau 1,630,232 1,221,256 1,657,429 1,502,972 Hawkes Bay 204, , , ,896 Hutt 98, ,364 97, ,769 Lakes 478, , , ,739 MidCentral 536, , , ,284 Nelson Marlborough 258, , , ,054 Northland 542, , , ,246 South Canterbury 89, , , ,304 Southern 570, , , ,661 Tairāwhiti 8,271 89,116 39,949 45,779 Taranaki 327, , , ,897 Waikato 756, , , ,397 Wairarapa 1, Waitemata 4,737,000 5,124,507 5,390,791 5,084,099 West Coast 24,822 3,990 9,604 Whanganui 21,057 63,987 34,510 39,851 Total 22,327,885 24,756,585 27,178,052 24,754,174 The table shows some significant variations between DHBs, to the extent that it is clear DHBs have not been identifying and recording these patients in a consistent way. The Project Team noted that overseas eligible coding is not formally audited or standardised across the country, and sought alternative data sources to identify these patients. However, it did not find any more reliable figures. Following the Review, the TAG recommended that the adjuster for overseas eligible people be dealt with outside of the model or dropped, because of these concerns with the quality of the data. However, the Ministry of Health believe that the policy of compensating DHBs for overseas eligible patients remains valid. They have requested that this component remain in the PBFF for one year, and that further work is done to improve the information. The Ministry of Health will conduct a review of the overseas eligible component alongside a review of bad debts for overseas ineligible patients due to the overlapping data quality issue. 21 It will look at patient-level data for these two groups and cross-check it against immigration data, as it currently does to check eligibility for PHO services. The Ministry of Health will report back on this work as part of the 2017/18 DHB indicative funding advice at the end of Bad debts for overseas ineligible patients sit outside the PBFF model. 44 Population-based Funding Formula Review 2015 Technical Report
65 Refugees specific costs submitted by DHBs Methodology A data request was sent out to obtain data from DHBs on the annual costs and service descriptions of specific refugee health services that they provide (or fund other organisations to deliver) that are funded directly out of devolved funding (ie, not public health funded services or Ministry-contracted services). Table 14 presents this information. Table 14: Costs and details of specific refugee services provided by DHBs DHB Annual budgeted cost of service at 2014/15 values Auckland 124,382 Refugee Primary Health Services Bay of Plenty Detail of service No specific services for Refugees provided Canterbury 579,503 Interpreters / Refugee support services / counselling services / Mental Health NGO service Capital & Coast 1,029,050 Refugee Trauma Recovery / Infant, child, adolescent & youth community mental health services / Refugee Mental Health and Addiction Service / Asian Migrant & Refugee Cultural Support Coordination Service Mental Health / Refugee new settlers Primary Care services Counties Manukau 1,904,367 Primary Care Refugee Wrap Around Services / Mobile Refugee Clinical Team / Mental Health Services Hawkes Bay 0 No specific services for Refugees provided Hutt 178,661 Refugee Mental Health and Addiction Service / Asian Migrant & Refugee Cultural Support Coordination Service Mental Health Lakes 0 No specific services for Refugees provided MidCentral 114,133 NGO Refugee Support services Nelson Marlborough 208,216 Interpreters / Refugee support services Northland 0 No specific services for Refugees provided South Canterbury 0 No specific services for Refugees provided Southern 1,596 IDF charge from Auckland DHB Tairāwhiti 0 No specific services for Refugees provided Taranaki 0 No specific services for Refugees provided Waikato 365,815 Refugee Mental Health packages of care / refugee addiction services / Interpreters / PHO services for refugees Wairarapa 0 No specific services for Refugees provided Waitemata 386,000 Refugee Primary Health Services / Labs services for Refugee & Asylum Seekers / Interpreter services West Coast 0 No specific services for Refugees provided Whanganui 0 No specific services for Refugees provided Total 4,891,723 Population-based Funding Formula Review 2015 Technical Report 45
66 Refugees Annual costs of treating refugees Methodology The Project Team studied a cohort of 1392 refugees that arrived in New Zealand between July 2010 and June 2012, to draw inferences about the cost of treating refugees. Immigration New Zealand supplied the data for the cohort and the Team matched the encrypted NHIs to the refugees patient data in the National Collections database. Immigration New Zealand also supplied data that showed refugee settlement patterns across New Zealand over the past five years. The Project Team was interested in the annual cost of treating refugees over the four years from 2010/11 to 2013/14. As the refugees in the cohort arrived intermittently between July 2010 and June 2012, the Team estimated the cost during the first two years based on the number of months each refugee had resided in New Zealand. All 1392 refugees were present during the last two years, 2012/13 and 2013/14. The Project Team averaged the data to calculate the annual cost of treating an individual refugee. Results The Project Team found that the annual cost of a treating a refugee was approximately $436 more per year on average than the cost of treating a typical New Zealand citizen. The Project Team calculated annual costs of treating refugees per DHB by multiplying the average number of refugees resettling in each region by the estimated additional cost per refugee ($436). It then multiplied this by three, so that the figure represented the costs of treating refugees for their first three years of settlement ($892,012). 46 Population-based Funding Formula Review 2015 Technical Report
67 Total overseas eligible and refugees adjuster Having investigated the costs of overseas eligible patients and refugees across the country, the Project Team summed the figures to ascertain the total extent of the adjuster required for each DHB. Table 15 presents these figures. Table 15: Distribution of overseas eligible and refugees adjuster, by district health board DHB Overseas eligibles DHB data request based on three-year average Specific refugee services provided by DHBs Refugee additional health costs based on three-year average Total overseas adjuster as at 2013/14 values Auckland 1,143, , ,026 1,396,910 Bay of Plenty 624, ,110 Canterbury 8,702, ,754 12,818 9,281,880 Capital & Coast 3,623,326 1,006, ,454 4,799,190 Counties Manukau 1,502,972 1,862,471 77,998 3,443,441 Hawkes Bay 187,896 1, ,204 Hutt 106, ,731 86, ,542 Lakes 474, ,739 MidCentral 522, , , ,526 Nelson Marlborough 258, , , ,752 Northland 590, ,246 South Canterbury 134, ,304 Southern 589,661 1, ,221 Tairāwhiti 45,779 45,779 Taranaki 405, ,897 Waikato 708, , ,640 1,170,804 Wairarapa Waitemata 5,084, ,508 79,044 5,540,652 West Coast 9,604 9,604 Whanganui 39,851 39,851 Total 24,754,174 4,784, ,012 30,430,292 Population-based Funding Formula Review 2015 Technical Report 47
68 The rural adjuster Summary The rural adjuster allocates funding to DHBs for the unavoidable extra costs associated with providing health services to rural communities. The current model is based on seven separate service areas in which DHBs have previously indicated they face additional costs relating to rurality, and the distribution of funding is strongly linked to existing service provision. These seven service areas are: offshore islands rural GP/PHO payments travel and accommodation inter-hospital transfers community services facilities governance (removed in the Review). The Review modelled an enhanced version of the current model and two alternative models that placed emphasis on distributing funding more in line with rural populations and travel distances and times. The Review recommended the adoption of the weighted rural population index model, which combines funding for some DHB-specific diseconomies with funding distributed in line with rural populations and geography. Background The Project Team commissioned an independent research firm, Sapere, to review the rural and tertiary adjusters. The report recommended the development of an enhanced status quo model containing improvements and refinements to the current model and a population-based model that allowed for differences in population and geography (Moore et al 2015). The Project Team recommended that diseconomies related to governance costs (an adjuster for small size rather than rurality) be dropped; this reflects unanimous feedback from DHB interviews and workshops. Methodology In response to Sapere s recommendations, the Project Team developed three models: enhanced status quo model weighted density index weighted rural population index. All three models are based on the same national pool of funding, which is established on the basis of a mixture of diseconomy modelling and actual costs. Table 16 presents the development of each model, and Figure 31 presents each diagrammatically. The community services and facility components are more complex than the others; Appendix 5 supplies additional detail on these. 48 Population-based Funding Formula Review 2015 Technical Report
69 Table 16: Description of components in rural adjuster models Component Offshore islands Rural GP/PHO payments Travel and accommodation Inter-hospital transfers Community services Size (millions) $3.5 $21.5 $21 $28.4 $60 $35.1 Description Extra costs faced by DHBs in providing health services to offshore islands comprising a rural bonus/remote rural practice area funding payment; a rural workforce retention premium; a reasonable roster amount; and a rural after-hours payment Data DHB supplied 2014 Ministry stocktake of rural payments plus funding devolved since that date Pool calculation Distribution enhanced status quo Distribution weighted rural population index Distribution weighted density index DHB-supplied costs less amounts covered in other components DHBs contribution to pool calculation DHBs contribution to pool calculation DHBs contribution to pool calculation Total payments DHBs contribution to pool calculation Weighted rural population index Weighted rural density index DHBs reimbursement of eligible patients for travel and accommodation Payment system data extracted for 2010/ /14, validated by DHBs Total payments less the national population times the Auckland DHB cost per person DHBs contribution to pool calculation Weighted rural population index Weighted rural density index The cost of transporting patients between facilities Expenditure recorded against GL codes 4950 (Ambulance) and 4955 (Air Ambulance) (2011/ /14 years), supplied by DHBs Total payments less the national population times the Auckland metro cost per person DHBs contribution to pool calculation Weighted rural population index Weighted rural density index The extra costs of providing community services to small and/or sparse populations either services in the home, integrated family health clinics or small rural hospitals National Cost Data and four DHB case studies (Northland, Bay of Plenty, Waikato, Nelson Marlborough) Comprising an estimated top-up per person for the highly rural population and the rural population with low urban influence DHBs contribution to pool calculation Weighted rural population index Weighted rural density index Facilities The diseconomy cost of providing a full role delineation model level 3 service to a small population National Cost Data Estimation using cost data and a diseconomy model of the diseconomy for inpatient, emergency department, assessment treatment and rehabilitation and mental health DHBs contribution to pool calculation DHBs contribution to pool calculation DHBs contribution to pool calculation Population-based Funding Formula Review 2015 Technical Report 49
70 Figure 31: Process flow chart for options for calculating rural adjuster Rural Adjuster Process Flow Rural Adjuster Inputs: Offshore Islands Rural GP T&A IHT Community Service Base Hospital Enhanced Status Quo Offshore Islands $ (Actuals) Rural GP/ PHO payments $ (Actuals) Travel & Accommodation $ (Expected) Inter Hospital Transfers $ (Expected) Community services & small facilities $ 2% 13% 12% 17% 35% 21% Facilities $ 77% Funding Pool Options Weights are selected for the Population, Travel Time and Travel to Tertiary indices. The weights determine the funding pool size (the share of the 77%) for each of the indices. The current weight settings produce this division: Population* 30% Travel Time 32% Travel to Tertiary 15% *used by both the Wgtd Rural Popn Index and Wgtd Density Index DHB Populations Wgtd Rural Population Weighted Density Wgtd Travel Time Wgtd Travel to Tertiary Displays the population count for highly rural/remote, rural with Assigns a higher weighting for Assigns weights based on Assigns weights based on Assigns weights based on low urban influence and the total highly rural/remote and divides population density (least travel time to base hospitals travel distance to tertiary population for each DHB the 30% Population value dense) and divides the 30% and divides the 32% hospitals and divides the between the DHBs between the DHBs between the DHB's 15% between the DHB's Weighted Density Index Offshore Islands Weighted Density Wgtd Travel Time Wgtd Travel to Tertiary Facilities 2% 30% 32% 15% 21% Weighted Rural Population Index Offshore Islands Weighted Rural Population Wgtd Travel Time Wgtd Travel to Tertiary 2% 30% 32% 15% 21% Facilities 50 Population-based Funding Formula Review 2015 Technical Report
71 Development of the two new rural indexes Each of the two potential new rural indexes, the weighted density index and the weighted rural population index, uses three new inputs. The three new inputs in the weighted density index are as follows. Weighted density uses Statistics New Zealand s estimated resident population data (as at 30 June 2013), split into five population density quintiles: quintile 1 is the least dense in population (hence, the most rural). The model distributes 30% of the funding pool based on each DHB s share of the number of people in quintile 1. Weighted travel time uses the estimated resident population that is within a certain travel time away from a base hospital. The model distributes 32% of the funding pool based on each DHB s share of the population that lives ( minutes and >245 minutes away from the base hospital. There are only 160 people in the >245 minutes category and they have been weighted at 10 times the minutes category. Weighted travel to tertiary uses the estimated resident population divided into categories according to distance from the nearest tertiary hospital, where quintile 1 is the closest to a tertiary hospital. The model distributes 15% of the funding pool based on each DHB s share of the population in quintile 4 and 5. The quintile 5 category population has twice the weighting of the quintile 4 category. The three new inputs in the weighted rural population index are as follows. Weighted rural population uses Statistics New Zealand s estimated resident population data (as at 30 June 2013). The model distributes 30% of the funding pool based on each DHB s share of the rural population. A weight of 2 was applied to the Highly rural/remote population 22 total to account for the greater cost of providing services to highly rural people, while a weight of 0.2 was applied to the Rural with low urban influence population. The model uses weighted travel time as described above. The model uses weighted travel to tertiary as described above. Appendix 6 provides further details on the methodology used to calculate weighted density, weighted travel time and weighted travel to tertiary. Results As expected, the Project Team found that the two population-based models were a better fit than the enhanced status quo model, as they targeted the variable of interest (rural population) directly. The DHBs with the highest weighted rural populations were Southern (22.1%), Waikato (13.0%), Northland (12.5%), Canterbury (11.5%) and West Coast (5.6%). It can be reasonably expected that the model with the most appropriate fit would assign a similar pattern of funding to DHBs. 22 Statistics New Zealand definitions are as follows: Highly rural/remote area: an area in which there is minimal dependence on urban areas in terms of employment, or where there is a very small employed population. Rural area with low urban influence: an area with a strong rural focus. The majority of the population in these areas works in a rural area. Population-based Funding Formula Review 2015 Technical Report 51


72 Figure 32 compares the enhanced status quo model against the two population-based indexes. It shows that the weighted rural population index allocates proportionally more funding to DHBs with the most highly rural people than the other models. For example, Southern receives 18 percent of the funding under the weighted rural population index but only 14.7 percent or 13.7 percent under the weighted density index and the enhanced status quo models respectively. With the addition of the travel time and travel to tertiary inputs that are not included in the enhanced status quo model, the weighted rural population index compensates DHBs more appropriately. Under this model, funding correlates more accurately with the rurality of the population and the time and distance to the nearest hospital. Note that on 1 July 2015, the responsibility for providing health services to the residents of the Chatham Islands transferred from Hawke s Bay DHB to Canterbury DHB. In the status quo model, the Chatham Islands were included in Hawke s Bay DHB s rural allowance. In the proposed models, they were included as part of Canterbury DHB. Figure 32: Comparison of proposed rural adjuster models Table 17: Share of the rural adjuster by DHB, 2013/14 DHB Percentage share of rural adjuster Auckland 0.6% Bay of Plenty 5.6% Canterbury 8.7% Capital & Coast 0.0% Counties Manukau 0.3% Hawkes Bay 4.4% Hutt Valley 0.0% Lakes 4.3% MidCentral 2.4% Nelson Marlborough 5.3% Northland 10.8% South Canterbury 3.3% Southern 18.0% Tairāwhiti 5.9% Taranaki 3.5% 52 Population-based Funding Formula Review 2015 Technical Report
73 Waikato 8.8% Wairarapa 2.6% Waitemata 0.5% West Coast 11.9% Whanganui 3.1% Total 100.0% The recommendation to use the weighted rural population index was a majority decision by TAG, but was not supported by all members. The tertiary adjuster The tertiary adjuster is the price premium that all DHBs pay to ensure that there is tertiary-level hospital capacity available for their populations. There are some similarities between the rural adjuster and the tertiary adjuster so the Project Team decided to review them together. Sapere completed a review of both. Sapere identified two options for reform of the tertiary adjuster: 1. enhanced status quo a package of refinements to clarify the purpose of the tertiary adjuster, improve building blocks such as the role delineation model (RDM), input cost data and reduce volatility through additional analysis and multi-year smoothing of diagnosis related group (DRG) margins 2. a policy-based cap limiting annual growth in the tertiary adjuster pool to no more than the percentage increase in the population-based funding pool, so as to encourage ongoing efficiency gains within tertiary services and ensure services are affordable. The Sapere report (Moore et al 2015, page 42) noted that a DHB offering a series of services with relatively low volumes may well be disadvantaged relatively to a DHB with large volumes. The Project Team did not ultimately identify a solution. The Project Team has referred the Sapere Report to the NCCP, which will undertake a review of the tertiary adjuster and the RDM next year. Improvements are needed to DHB costing systems, in terms of both their coverage and quality, as the tertiary adjuster pool results are being driven by variations in the secondary costs supplied. The land adjuster The PBFF model does not make any allowance for the differential costs of capital associated with high land valuations, revaluations or the step increase in costs following large hospital building projects. However, the Ministry of Health pays a land adjuster outside of the PBFF to Auckland DHB to compensate for its high land valuation. Because the PBFF is reviewed only every five years, it is incompatible with an adjustment related to revaluations or capital rebuilds. Since the review of capital costs and revenue sits outside the PBFF, the Project Team recommended that this Review not consider the land adjuster. Instead, it recommends that the land adjuster and the process for managing revaluations should be reviewed as part of a wider review of funding for health capital. Population-based Funding Formula Review 2015 Technical Report 53
74 The final Population-based Funding Formula model The following graphs illustrate the complete set of cost weights within the final PBFF following the Project Team s Review, by age, sex, deprivation and ethnicity. Figure 33: Aggregate cost weights for females of Other ethnicity, by age and NZDep2013 Figure 34: Aggregate cost weights for males of Other ethnicity, by age and NZDep Population-based Funding Formula Review 2015 Technical Report

75 Figure 35: Aggregate cost weights for males of NZDep2013 quintile 4, by age and ethnicity Figure 36 below compares the aggregate cost weights by age between the results of the 2014/15 and 2007/08 PBFF reviews. Given that the results compared use different years cost and base populations it is expected that there is some variation between the two. However the trend is remarkably similar until ages 65+ where we do see a divergence between the two models. There are a number of possible reasons for the increased aggregate cost weights here, however the review did not qualify the drivers of this change. Figure 36: Population-based Funding Formula aggregate cost weights, by age, 2007/08 and 2014/15 Table 18 outlines the respective weight that each service group and adjuster holds in the model at the DHB and national level after this adjustment. Service group and adjuster weights will change as populations change, with the exception of the rural and overseas eligible and refugees adjuster. The rural and overseas eligible and refugees adjusters are not updated annually for population growth; their respective weights are fixed, as opposed to their monetary value. 23 They will continue to hold the same weight in the model irrespective of population growth in future years. 23 In the prior model, the monetary value of these adjusters was fixed. This resulted in the respective weights of the rural and overseas eligible and refugees adjusters decreasing over time as the population-driven service groups and unmet need adjuster gained weight. Population-based Funding Formula Review 2015 Technical Report 55
76 Table 18: Weight by service group and DHB, 2013/14 DHB Personal health: hospital and community services Personal health: primary Health of older people: other Health of older people: aged residential care Mental health Unmet need Rural adjustment Overseas adjustment Auckland 54.37% 20.88% 3.78% 8.00% 11.18% 1.55% 0.10% 0.14% Bay of Plenty 52.46% 19.01% 5.31% 9.69% 10.28% 1.58% 1.57% 0.10% Canterbury 52.20% 21.16% 4.66% 9.92% 9.00% 0.99% 1.27% 0.80% Capital & Coast 53.94% 21.35% 4.04% 8.64% 9.98% 1.27% 0.01% 0.77% Counties Manukau 56.00% 19.59% 3.53% 6.40% 11.85% 2.29% 0.05% 0.30% Hawkes Bay 52.59% 19.06% 4.92% 9.20% 10.72% 1.74% 1.72% 0.04% Hutt 54.18% 20.49% 4.34% 8.50% 10.73% 1.65% 0.00% 0.11% Lakes 52.80% 18.52% 4.29% 7.29% 12.30% 2.02% 2.60% 0.17% MidCentral 52.90% 19.31% 5.29% 9.31% 10.52% 1.60% 0.90% 0.17% Nelson Marlborough 51.87% 20.69% 5.15% 10.37% 8.34% 0.99% 2.44% 0.15% Northland 52.12% 18.00% 4.92% 7.83% 11.41% 1.92% 3.67% 0.12% South Canterbury 50.62% 19.99% 5.70% 11.46% 7.68% 0.88% 3.59% 0.09% Southern 51.12% 20.27% 4.79% 9.70% 8.87% 1.06% 4.11% 0.08% Tairāwhiti 50.68% 16.49% 4.06% 6.29% 13.11% 2.33% 7.00% 0.03% Taranaki 52.24% 19.64% 5.10% 9.73% 9.76% 1.38% 2.02% 0.14% Waikato 53.16% 19.35% 4.63% 8.21% 11.24% 1.74% 1.55% 0.12% Wairarapa 51.24% 19.36% 5.38% 9.85% 9.15% 1.39% 3.63% 0.00% Waitemata 54.34% 21.56% 4.18% 8.90% 9.33% 1.16% 0.07% 0.46% West Coast 43.51% 17.08% 3.76% 6.91% 7.84% 0.98% 19.92% 0.01% Overall the changes in the formula are minimal and the consistency between results with respect to the new cost weights indicates the robustness of the model over time. The key drivers of change in the model are the inclusion of NZDep2013, the recalculation of the core model cost weights and the redevelopment of the rural and overseas eligible and refugees adjusters. 56 Population-based Funding Formula Review 2015 Technical Report
77 Table 19 uses percentage point change in each DHB s PBFF share to illustrate the impact of each of these drivers. Table 19: DHB results drivers of change DHB Current PBFF model: 2015/16 New PBFF model: 2015/16 Percentage point variance (cost weight) Percentage point variance (NZDep) Percentage point variance (rural and overseas adjusters) Percentage point variance Percentage variance Auckland 9.31% 9.12% 0.02% -0.13% -0.09% -0.19% -2.05% Bay of Plenty 5.55% 5.62% 0.00% 0.03% 0.04% 0.07% 1.20% Canterbury 10.94% 10.81% -0.05% -0.18% 0.10% -0.13% -1.16% Capital & Coast 5.76% 5.73% 0.04% -0.05% -0.02% -0.03% -0.49% Counties Manukau 10.81% 10.87% 0.10% 0.06% -0.10% 0.06% 0.52% Hawkes Bay 3.96% 3.95% -0.01% 0.04% -0.04% -0.01% -0.15% Hutt 3.09% 3.05% 0.00% -0.02% -0.03% -0.04% -1.41% Lakes 2.48% 2.54% 0.01% 0.05% 0.00% 0.07% 2.64% Mid Central 4.05% 4.08% -0.03% 0.07% -0.01% 0.03% 0.68% Nelson Marlborough 3.42% 3.40% -0.03% 0.02% -0.01% -0.02% -0.68% Northland 4.50% 4.63% 0.01% 0.09% 0.04% 0.14% 3.05% South Canterbury 1.46% 1.44% -0.01% 0.00% -0.01% -0.02% -1.13% Southern 6.78% 6.81% -0.05% -0.02% 0.09% 0.03% 0.44% Tairāwhiti 1.26% 1.30% 0.02% 0.01% 0.01% 0.04% 2.89% Taranaki 2.79% 2.73% -0.02% -0.03% -0.01% -0.06% -1.99% Waikato 8.91% 8.96% -0.03% 0.07% 0.02% 0.06% 0.63% Wairarapa 1.12% 1.11% -0.01% 0.02% -0.02% -0.01% -0.86% Waitemata 11.25% 11.23% 0.06% -0.05% -0.03% -0.01% -0.13% West Coast 0.89% 0.93% -0.01% -0.03% 0.08% 0.04% 4.37% Whanganui 1.69% 1.69% -0.01% 0.04% -0.03% 0.00% 0.10% Total % % 0.00% 0.00% 0.00% 0.00% Population-based Funding Formula Review 2015 Technical Report 57
78 The final implementation of the PBFF relies on further data inputs and implementation rules. The data required includes the new population projections, DHB starting points, and the level of new funding for DHBs. The implementation rules are agreed by the Minister of Health and as a result mean that each DHB will receive a minimum funding allocation of their previous year s funding plus a minimum increase percentage. In practical terms, this smooths changes to the funding to DHBs and means that it can take a period of years to transition DHBs to their target PBFF share. Final funding allocations are however, made by Government as part of the Budget process. For this reason the full impact of the new PBFF model is not yet known at the time of writing of the report. It is important to note, however, that individual DHB funding allocations are increased year on year. What will change for a very small number of DHBs is their percentage share of overall funding. This means that for a few DHBs their respective annual growth rate in funding will be more or less than under the previous PBFF model. 58 Population-based Funding Formula Review 2015 Technical Report
79 Lessons learned and recommendations for future reviews This section lists recommendations from the TAG and Project Team on areas for potential improvement prior to any future review of the PBFF. Data quality and availability District Health Board cost data underpins the quantification of the costs of service delivery that the PBFF uses to set cost weights and to assess the additional costs of small hospitals or tertiary services. Currently not all DHBs have costing systems, and compliance with the costing standards is variable. The revised rural adjuster included diseconomy funding for facilities where the RDM had assessed the majority of services as level 3. The tertiary adjuster model provides additional funding for services at level 6. The RDM has not been updated since 2010 over time it will become out of date. Mental health services are purchased on an input basis, which is difficult to cost against and is of limited use in quantifying the costs of population groups. For the purposes of this Review project, the Project Team developed a system of grouping outputs that could be further developed to provide a set of cost outputs for mental health. The national data collections provided the majority of the service use data used in this project. The Project Team found some areas of incomplete data, requiring them to estimate figures. Where there was no service use data, the Project Team used GL codes to estimate the type and amount of missing data. It notes that the current codes have developed in an ad hoc manner, and do not provide a useful overview of service level activity. Ideally, future reviews would make use of linked data sets across different national collections and payment systems. Review teams could use such data sets to fill in missing data, cross-check data (eg, on ethnicity) and introduce health status variables into the model. This year, the Project Team was unable to make full use of linked data sets for the following reasons. The HealthTracker (an existing linked data set) is not maintained between projects, and was therefore not current enough to use. There were issues with double counting in the PHO data sets and the NHI data set that required a higher level of data cleaning to resolve than the project had time to deal with. To support cross-government social sector work, government agencies are working on the Integrated Data Infrastructure (IDI), which will combine information from a range of organisations (such as health and education data). This could inform future reviews of the PBFF. Population-based Funding Formula Review 2015 Technical Report 59
80 Research A one-year time frame for review of the PBFF does not allow sufficient time for research into radical changes (eg, a shift to a health disparities model). For the next review, the Project Team therefore recommends that potential areas of research are identified in advance, to allow a separate research phase. Training The Project Team suggests that material from the Review alongside training slides should be available on the Ministry website. Recommendations The Project Team therefore makes the following recommendations. 1. Ensure all DHBs have a costing system in place and comply with costing standards. 2. Update the RDM. 3. Explore the feasibility of developing a set of cost outputs for mental health. 4. Improve NGO reporting for mental health. 5. Explore the feasibility of developing a revised set of GL codes. 6. Allow time for a research phase. 7. Make Review material and training slides available on the Ministry website. 60 Population-based Funding Formula Review 2015 Technical Report
81 References Atkinson J, Salmond C, Crampton P NZDep2013 Index of Deprivation. Wellington: University of Otago. Blakely T, Tobias M, Atkinson J, et al Tracking Disparity: Trends in ethnic and socioeconomic inequalities in mortality, Wellington: Ministry of Health. Chan W, Papaconstantinou D, Winnard D Service planning implications of estimating Primary Health Organisation enrolment rate based on a Health Service Utilisation population rather than a Census-derived population. New Zealand Medical Journal 128(1418): Cormack D, Harris R Issues in Monitoring Māori Health and Ethnic Disparities: An update. Wellington: Te Rōpū Rangahau Hauora a Eru Pōmare. Cormack D, Robson C Classification and Output of Multiple Ethnicities: Considerations for Monitoring Māori Health. Wellington: Te Rōpū Rangahau Hauora a Eru Pōmare. Fawcett J, Atkinson J, Herd P, et al Record Linkage of Census and Mortality Records: New Zealand Census-Mortality Technical Report No. 6. Wellington: Department of Public Health, University of Otago. Gibbs A, Sondalini R, Pearse J The NSW Health Resource Distribution Formula and Health Inequalities. NSW Public Health Bulletin 13(3): Health Funding Authority, Ministry of Health Disability in New Zealand: Overview of the 1996/97 survey. Hamilton and Wellington: Health Funding Authority, Ministry of Health. Klazinga N The health system in the Netherlands. Eurohealth 14(1): Magnussen J Equal access for equal need? Constructing and implementing a capitation-based formula for the distribution of health care resources in Norway. International Journal of Circumpolar Health 69(5): Mental Health Commission Blueprint for Mental Health Services in New Zealand: How things need to be. Wellington: Mental Health Commission. Minister of Health The New Zealand Health Strategy. Wellington: Ministry of Health. Ministry of Health Taking the Pulse: The 1996/97 New Zealand Health Survey. Wellington: Ministry of Health. Ministry of Health Our Health, Our Future Hauora Pakari, Koiora Roa: The Health of New Zealanders Wellington: Ministry of Health. Ministry of Health New Zealand Health Survey: Annual update of key findings 2012/13. Wellington: Ministry of Health. Ministry of Health Annual Update of Key Results 2013/14: New Zealand Health Survey. Wellington: Ministry of Health. Moore D, Blick G, Whelan C Report prepared for the Ministry of Health: Review of the rural and tertiary adjusters. Wellington: Sapere. National Health Committee The Social, Cultural and Economic Determinants of Health in New Zealand: Action to improve health. Wellington: National Health Committee. Population-based Funding Formula Review 2015 Technical Report 61
82 NHS England Fundamental Review of Allocations Policy Annex C: Technical Guidance to Weighted Capitation Formula for Clinical Commissioning Groups. London: National Health Service England. NHS Scotland Delivering Fair Shares for Health in Scotland The report of the NHS Scotland Resource Allocation Committee. Edinburgh: National Health Service Scotland. Rush EC, Freitas I, Plank LD Body size, body composition and fat distribution: comparative analysis of European, Maori, Pacific Island and Asian Indian adults. British Journal of Nutrition 102(4): Smith PC, Rice R, Carr-Hill R Capitation funding in the public sector. Journal of the Royal Statistical Society 164(2): Stewart RAH The challenge of reducing socioeconomic and ethnic differences in cardiovascular disease. New Zealand Medical Journal 124(1333): Statistics New Zealand Census QuickStats about culture and identity. URL: (accessed 6 December 2015). 62 Population-based Funding Formula Review 2015 Technical Report
83 Appendix 1: Differences between NZDep06 and NZDep2013 The NZDep2013 index is similar to the NZDep2006 index. However, NZDep2013 contains a new indicator: people aged under 65 years with no access to the internet at home. This component now has the highest weight in the index. The indicator measuring people with no access to any phone was removed from the index. In addition, the 2013 Census individual questionnaire added new brackets to the personal income question. The category $50,001 $70,000 was split into two income brackets: $50,001 $60,000 and $60,001 $70,000. A new income band was added above $100,001 or more, which resulted in the inclusion of the following new categories: $100,001 $150,000 and $150,001 or more (Atkinson et al 2014). The following series of figures present the changes in NZDep profile (percentage of the population living in each quintile) by DHB between NZDep2006 and NZDep2013. Figure A1: Auckland District Health Board: NZDep2006 compared with NZDep2013 Population-based Funding Formula Review 2015 Technical Report 63
84 Figure A2: Bay of Plenty District Health Board: NZDep2006 compared with NZDep2013 Figure A3: Canterbury District Health Board: NZDep2006 compared with NZDep2013 Figure A4: Capital & Coast District Health Board: NZDep2006 compared with NZDep Population-based Funding Formula Review 2015 Technical Report
85 Figure A5: Counties Manukau District Health Board: NZDep2006 compared with NZDep2013 Figure A6: Hawke s Bay District Health Board: NZDep2006 compared with NZDep2013 Figure A7: Hutt Valley District Health Board: NZDep2006 compared with NZDep2013 Population-based Funding Formula Review 2015 Technical Report 65
86 Figure A8: Lakes District Health Board: NZDep2006 compared with NZDep2013 Figure A9: MidCentral District Health Board: NZDep2006 compared with NZDep2013 Figure A10: Nelson Marlborough District Health Board: NZDep2006 compared with NZDep Population-based Funding Formula Review 2015 Technical Report
87 Figure A11: Northland District Health Board: NZDep2006 compared with NZDep2013 Figure A12: South Canterbury District Health Board: NZDep2006 compared with NZDep2013 Figure A13: Southern District Health Board: NZDep2006 compared with NZDep2013 Population-based Funding Formula Review 2015 Technical Report 67

88 Figure A14: Tairāwhiti District Health Board: NZDep2006 compared with NZDep2013 Figure A15: Taranaki District Health Board: NZDep2006 compared with NZDep2013 Figure A16: Waikato District Health Board: NZDep2006 compared with NZDep Population-based Funding Formula Review 2015 Technical Report
89 Figure A17: Wairarapa District Health Board: NZDep2006 compared with NZDep2013 Figure A18: Waitemata District Health Board: NZDep2006 compared with NZDep2013 Figure A19: West Coast District Health Board: NZDep2006 compared with NZDep2013 Population-based Funding Formula Review 2015 Technical Report 69
90 Figure A20: Whanganui District Health Board: NZDep2006 compared with NZDep2013 References Atkinson J, Salmond C, Crampton P NZDep2013 Index of Deprivation. Wellington: University of Otago. 70 Population-based Funding Formula Review 2015 Technical Report
91 Appendix 2: Technical explanation of variable testing Introduction The Project Team tested the demographic variables in the PBFF to investigate whether the combinations of the variables could be simplified as a way to improve the fit of the model. The testing looked at the following questions. Does a full combination of demographic variables result in statistical overfitting? What is the quality of health service use and population data likely to be in the future? Potentially, the model could be simplified by aggregating (collapsing) the variables into a smaller number of categories: for example, reducing prioritised ethnicity from three groups (Māori, Pacific peoples and Other) to two groups (Māori and non-māori, or Māori and Pacific peoples and non-māori non-pacific). The Project Team tested variables for the five service groups: Personal Health: Hospital and Community Services Personal Health: Primary Health Care Health of Older People: ARC Health of Older People: Other Mental Health. Background The PBFF was developed as a cell-based model; such models are easy to understand, and avoid problems with correlation between variables. A cell-based model calculates costs for each unique group of age, sex, NZDep Quintile and ethnicity independently, avoiding interactions. The model retains statistical interaction between variables. However, it requires a large amount of information in order to fill all cells. Fortunately in the case of the PBFF, such information was available. The fundamental unit of analysis and modelling in the PBFF is the cost weight: the mean cost per person for a service, given that person s demographic characteristics. The mean cost per person includes both users and non-users. That is, it includes people for whom no costs or zero costs were recorded. Cost weights for each service are calculated as follows. Population-based Funding Formula Review 2015 Technical Report 71
92 Equation 1: Cost weight formula W jklm = ijklm E ijklm jklm N jklm where W jklm is the cost weight, E ijklm is the total expenditure of a demographic group resident in a DHB and N jklm is the number of people nationally in that demographic group. The subscripts j, k, l, and m refer to each age band (19), sex (2), prioritised ethnicity (3) and deprivation quintile (5) respectively. So there are 570 ( ) cost weights to calculate altogether. The DHBs (20) are represented by subscript i. As cost weights are usually presented in tabular form, combinations of the demographic variables are referred to as cells. For simplicity the number of combinations of demographic variables (cells) is described for the full model without any collapsed categories. Note that when any categories are collapsed the number of cost weight terms W jklm will be reduced from 570 accordingly. As an example of how a cost weight is calculated: the cost weight for Māori males aged resident in quintile 2 areas is equal to the total costs for that demographic group, divided by the total number of people in that demographic group (both users and non-users of a service). That is, it represents the mean cost of a service for that group. The cost weights are calculated on a national basis, therefore the numerator has 11,400 (20 570) addends but the denominator has 570 cells. The share of funding that each DHB receives in any particular year is calculated on a proportional basis, based on the cost weights and population projections of the number of people in each demographic. 24 Methods and data sources Statistical methods The Project Team used SAS Enterprise Guide 5.1 for all analysis. It wrote custom code for generating synthetic populations statistically representative of the New Zealand population, and cross-validation. It carried out most of the aggregation of the data, such as assembling major service group data, or creating a pseudo health register, using PROC SUMMARY. Approach The goal of this analysis was to investigate whether the PBFF could be simplified. A key consideration was statistical overfitting. Cross-validation is a technique for evaluating the predictive power of a model that is robust against overfitting. It partitions data into two sets: a training set that the model is built upon and a testing set to evaluate predictions against. 24 The analysis described in this paper excluded adjusters. Any indirect effects of adjusters should have been spread evenly over all people in the New Zealand population, due to random allocation in the modelling. Allocation of people to areas was based on synthetic groups selected at random, rather than to DHBs based on their catchment area. 72 Population-based Funding Formula Review 2015 Technical Report
93 There are hundreds of millions of unit records in the service use data sets. The Project Team distilled these into seven parameters per major service group. (There are seven parameters per group rather than 20 because seven synthetic populations 25 were used instead of DHBs.) Each unique person in the service use data set was randomly allocated to a synthetic population group. This was done 20 times for each group to generate a plausible range of populations, thus generating a plausible range of predicted major service group spends in 2013/14 dollars. The parameters used for predictive purposes was the expenditure in 2013/14 dollars, in year h by population group i, D hi. For each service group, this was estimated as follows. Equation 2: Parameter for the model to predict D hi = (N hijklm W jklm ) jklm, given hi The values were varied for W jklm by the random allocation and by various cell collapsing options in Table 1. The team used only data from the first two years to calculate the W jklm values. The values for N hijklm were held fixed to the 30 June 2013 estimated resident population. That is, the Team assumed a static population (no births, deaths, migration nor ageing) over three years. The Team evaluated predictions of D hi using Equation 2 (the training set) against the 2013/14 dollars (the test set). The 20 iterations of each population group generated by the various cross-validations were not averaged at the end to generate a single final set of predictions. There was only one test set, not 20 iterations of the test set. Separate models for each major service group The Project Team modelled the major service groups separately, because they have very different usage patterns. For example, there are different distributions of cost weights by age for Personal Health: Hospital and Community Services and Mental Health. Figure A21: Unweighted cost weights for Personal Health: Hospital and Community Services, by sex 25 Synthetic population groups were designed so that their demographic profiles were representative of the possible scenarios found in various geographic locations across the general New Zealand population. Population-based Funding Formula Review 2015 Technical Report 73


94 Figure A22: Unweighted cost weights for Mental Health, by sex The cost weights for Personal Health: Hospital and Community Services have a small peak at birth, diverge for the sexes at typical child-bearing ages then increase into older age. The cost weight distribution in the Mental Health service group is very different; female cost weights have a high plateau between 20 and 55 years, while male cost weights peak at the mid-30 years. Cost weights decrease into older ages for both sexes. There is a divergence between the sexes in this service group as well, but the order of the sexes is reversed. Options for collapsing cells In making a decision as to which cells to collapse in the model, the Project Team looked at whether: cells were too small (too few people) using all of the 570 possible cells resulted in statistical overfitting. Collapsing too many cells would introduce a risk of failure to recognise real variation between groups. Table A1 presents the options the Project Team considered for collapsing cells. Variation in usage patterns may mean different cells will be collapsed for different major service groups. 74 Population-based Funding Formula Review 2015 Technical Report
95 Table A1: Cell collapsing options tested Variable Options for potential collapse Details or issues Age Collapsing under 5s, 5 14, 15 19, 20 24, 25 64, 65 84, 85+ Sex Ethnicity Deprivation index Not collapsing and 90+ into one 85+ age band Keep male and female categories (that is, do not collapse), or remove sex altogether for part or all of a particular model for a major service Collapsing categories into Māori and non-māori, or Māori/Pacific peoples and other Collapsing categories into low deprivation (quintiles 1 and 2) and high (quintiles 3 5), or high deprivation (quintile 5) and not high (quintiles 1 4) Ages linked to eligibility for subsidies or other incentives related to health care use. Bands like 6 13 or are not feasible, as data is only available in five-year age groups. People are living longer, up to age 85 and beyond, and this age group has very high costs. But the numbers may not be high enough to justify separating out. Some sex differences are birth complications for boys, maternity care, aged care, missing males and other aspects that may or may not be addressed by unmet need. Māori continue to be a group of high policy interest. There are quality issues in data sources now and in the future, and public attitudes to national and/or ethnic identity affect this. The effect of deprivation quintiles is not linear. That is, the difference between quintiles 1 and 2 is not the same as the difference between quintiles 3 and 4. It might seem easier to not collapse cells at all; that is, to fit a full model. However, as some cells have few or no people in them, some cost weights must be imputed. So the Project Team had to find an acceptable imputation model. Variables tested The models the Project Team tested were based on modifying the full model by either one or two variables at a time. Table A2 presents the full list of variables tested by the team. The number in brackets is the number of levels of that variable. Table A2 should be read in conjunction with Table A1. Table A2: Full list of variables tested Variable Levels age (19) 0 4, 5 9, 10 14, 15 19, 20 24, 25 29, 30 34, 35 39, 40 44, 45 49, 50 54, 55 59, 60 64, 65 69, 70 74, 75 79, 80 84, 85 89, 90+ age2 (7) 0 4, 5 14, 15 19, 20 24, 25 64, 65 84, 85+ age3 (18) 0 4, 5 9, 10 14, 15 19, 20 24, 25 29, 30 34, 35 39, 40 44, 45 49, 50 54, 55 59, 60 64, 65 69, 70 74, 75 79, 80 84, 85+ sex (2) nosex (0) ethnicity (3) ethnicity2 (2) ethnicity3 (2) quintile (5) quintile2 (2) quintile3 (2) female, male none Māori, Pacific peoples, Other Māori, non-māori Māori/Pacific peoples, non-māori/non-pacific peoples Q1, Q2, Q3, Q4, Q5 Q1 Q4, Q5 Q1 Q3, Q4 Q5 Population-based Funding Formula Review 2015 Technical Report 75
96 The Team combined the variables into a number of models, as follows: full age, sex, ethnicity and quintile unmodified per capita removing all demographic information except number of people replacing one variable at a time in full model (7 models) replacing two variables at a time in full model, but not ethnicity3 combined with the quintile changes. 26 The Team labelled the models that replaced one or two variables at a time by the variables that were replaced in relation to the full model. For example, the age3 model is the same as the full model except that instead of the full model s age variable, the age3 variable was used. There was no NZDep2013 quintile recorded for Health of Older People: ARC. Therefore the Team tested fewer models for that service group. Synthetic population The Project Team used the 30 June 2013 estimated resident population to create seven synthetic population groups, by resampling seven composite groups with replacement proportional to demographic group size. The rationale for using resampling proportional to size, rather than a simple random sample, was so that the demographic profiles of the synthetic groups would be similar to the general New Zealand population. The Team deliberately stratified the proportion of individuals in Groups 1 7 so that they were not equal to the original group size. Larger urban areas were scaled down, and older, more diverse and rural areas were scaled up. The purpose of this rescaling, alongside mixing within groups, was so that synthetic groups could not be inferred to be direct, simple aggregations of actual DHB populations. Summary of procedure The Project Team undertook the following steps in testing the variables. Assemble the datasets of each major service group 1. Clean data by ensuring all variable names match, and coding is consistent (eg, change F to Female ). 2. Add the variables with collapsed categories (see Table A2). 3. Aggregate expenditure by unique NHI 27 for the training period (first two years) and test period (third year). 4. Calculate the number of non-users for each demographic group and impute them with zero expenditure. 5. Randomly allocate NHIs to synthetic population groups with probabilities based on their demographic group. 6. Calculate actual costs for the complete data set. 7. Calculate cost weights based on two years to predict the third year. 8. Calculate mean-squared errors and percentage point differences. 26 By mistake two models were not tested: ethnicity3 with quintile2, and ethnicity3 with quintile3. 27 All NHI numbers contained in the service use data were encrypted specifically for the purpose of this Review. 76 Population-based Funding Formula Review 2015 Technical Report
97 Create a pseudo health expenditure register Aggregate all usage data by unique NHI. Calculate each person s expenditure in the first two years for the training period, and use the third year for the test period. The Personal Health: Hospital and Community Services and Personal Health: Primary Care service groups had high coverage of the population. The Project Team imputed non-users with zero costs; it assumed non-users to be 4.4 million people (the total of the 30 June 2013 estimated resident population) minus the number of unique people who were in the data in a three-year period. The Team randomly assigned individuals (unique NHIs) to a synthetic population group, with replacement. The Team calculated the number of non-users for each cell. It then subtracted the number of users from the cell total. If a cell had more users than the population projection stated (that is, the difference was negative) the Team assumed the number of non-users to be zero. However, this resulted in the number of users and non-users added together for all cells being higher than the population projection total. The Team therefore removed excess non-users at random to ensure the pseudo register had the same number of people as the projection. There was a discrepancy between the user count according to service use data (a cumulative figure over a period of time) and population projections (a point-in-time measure). Some cells, according to the projections, contained no people, where the service use data indicated otherwise. This tended to happen in older age groups, especially for Māori and Pacific peoples. Assignment to a synthetic group was not equally likely, but stratified based on the distribution of demographic variables and sizes of the synthetic groups. In other words, being of a certain age, sex or ethnicity, or resident in a certain deprivation quintile, influenced the chance an individual was assigned a synthetic group. The Team used PROC SURVEY SELECT to randomly assign people to synthetic population group, with stratification and without replacement. For this reason, the assignment of individuals to a synthetic group was random, and statistically independent of the DHB area where people were domiciled. This meant that variation due to DHB management of health care demand did not bias the results. Predict synthetic group expenditure in dollars The full model is not the same as the prior PBFF model. In the prior model, all of the variables were used in complete combination, including ethnicity. Previously, ethnicity had been calculated as a flat percentage multiplier on top of the three-way cells of age, sex, and ethnicity. The Project Team assumed the share of the expenditures that the seven synthetic groups had in the test set (the 2013/14 year) to be true and correct for the purpose of calculating a mean squared error. The Team used a mean squared error so larger errors in predictions were penalised disproportionately more than smaller errors. The Team replicated each model 20 times, changing the random assignment to synthetic group each time. The Team used the training set to make predictions of synthetic group expenditure in the test period in dollars, based on summing cost weights multiplied by population counts for each cell (age sex ethnicity deprivation), by synthetic groups for each proposed model. Population-based Funding Formula Review 2015 Technical Report 77
98 As there is expenditure growth between years, the Team multiplied the average of the first two years by an adjustment factor before using it to predict the third year. The Team used the ratio of actual expenditure of the training period to the test period to calculate the adjustment factor. This value ranged between 1 and 3 percent for the service models tested. The Team calculated this ratio without any synthetic data or resampling. Differences for major service groups compared to Personal Health: Hospital and Community Services Personal Health: Primary Care: Personal Health: Primary Care has high service use rates. The number of unique NHIs (4,478,060) in this data set was higher than the total estimated resident population used for analysis (4,425,131). However, the Team dropped 138,293 users by excluding those with missing demographic information. So despite the source data being oversized, some non-users were still imputed. Health of Older People and Mental Health: Health of Older People and Mental Health have low service use rates. This made using PROC SURVEY SELECT computationally inefficient for creating a synthetic population. For the reason, the Project Team rewrote the section of code that randomly assigned a synthetic population group. It computed a cumulative density function for synthetic groups, conditional on the demographic variables, and used it to inverse transform pseudorandom uniform numbers between 0 and 1. Results Key findings The Project Team found that there was little material difference in how well the models could predict health care expenditure. However, it found that the model that only used population number (the per capita model) consistently performed worse than any other model. The full model that is, the model that used all possible combinations of five-year age bands, sex, prioritised ethnicity and NZDep2013 quintiles did not have the best predictive power out of the models tested, except for in the case of the Mental Health service group, where it had the barest of margins against the next few places. The margin between the models was very small. In terms of prediction error across all synthetic groups, nearly all of the models tested were within plus or minus half a percentage point of the full model. Outputs The following tables shows results for all synthetic groups combined by service group. 78 Population-based Funding Formula Review 2015 Technical Report

99 Results for all synthetic groups combined Population-based Funding Formula Review 2015 Technical Report 79


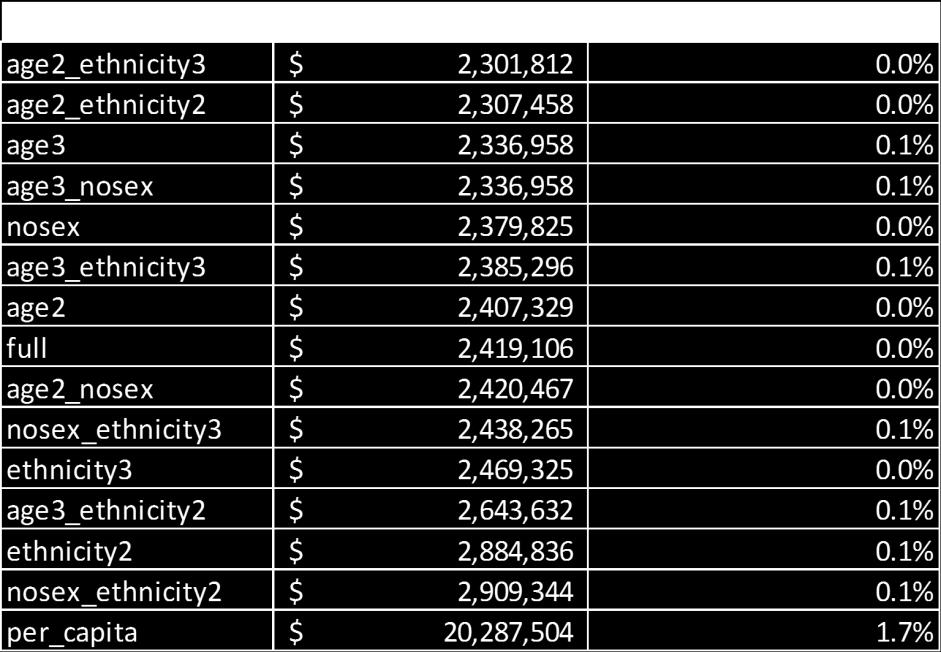
100 80 Population-based Funding Formula Review 2015 Technical Report

101 Population-based Funding Formula Review 2015 Technical Report 81
BSA New Zealand Taranaki District Health Board Coverage Report
 BSA New Zealand Taranaki District Health Board Coverage Report For the period ending 31 December 2017 Citation: Ministry of Health. January 2018. BSA New Zealand District Health Board Coverage Report:
Ministry of Health DHB Funding Allocation - Estimates Process Review: Lessons Learnt and Recommendations. 1 August 2017
 Ministry of Health DHB Funding Allocation - Estimates Process Review: Lessons Learnt and 1 August 2017 Contents About this Review 1 DHB Funding Estimates Process (historical) 2 What happened? 3 Why did
Vote Health. APPROPRIATION MINISTER(S): Minister of Health (M36) APPROPRIATION ADMINISTRATOR: Ministry of Health
: Minister of Health (M36) APPROPRIATION ADMINISTRATOR: Ministry of Health") Vote Health APPROPRIATION MINISTER(S): Minister of Health (M36) APPROPRIATION ADMINISTRATOR: Ministry of Health RESPONSIBLE MINISTER FOR MINISTRY OF HEALTH: Minister of Health THE ESTIMATES OF APPROPRIATIONS
Vote Health APPROPRIATION MINISTER(S): Minister of Health (M36) APPROPRIATION ADMINISTRATOR: Ministry of Health RESPONSIBLE MINISTER FOR MINISTRY OF HEALTH: Minister of Health THE ESTIMATES OF APPROPRIATIONS
B.29 [16k] District health boards response to asset management requirements since 2009
![B.29 [16k] District health boards response to asset management requirements since 2009](/thumbs/85/91311144.jpg "B.29 [16k] District health boards response to asset management requirements since 2009") B.29 [16k] District health boards response to asset management requirements since 2009 B.29[16k] District health boards response to asset management requirements since 2009 Presented to the House of Representatives
B.29 [16k] District health boards response to asset management requirements since 2009 B.29[16k] District health boards response to asset management requirements since 2009 Presented to the House of Representatives
Remuneration of Public Service and State sector chief executives as at 30 June 2015
 of Public Service and State sector chief executives as at 30 June 2015 State Services Commission Published by the State Services Commission November 2015 ISBN 978-0-478-43448-4 (online version) Copyright/Terms
Remuneration of Public Service and State sector senior staff as at 30 June 2014
 Remuneration of Public Service and State sector senior staff as at 30 June 2014 State Services Commission Published by the State Services Commission December 2014 ISBN 978-0-478-43431-6 (print version)
JOINT MINISTRY OF HEALTH / MENTAL HEALTH COMMISSION RING-FENCE PROTECTION PROJECT
 JOINT MINISTRY OF HEALTH / MENTAL HEALTH COMMISSION RING-FENCE PROTECTION PROJECT REPORT 31 January 2003 EXECUTIVE SUMMARY The Ring-Fence Protection Project was a joint project between the Ministry of
Initial Guidance for the Preparation of Long Term Investment Plans in the Health Sector
 Initial Guidance for the Preparation of Long Term Investment Plans in the Health Sector version date 4 November 2015 Purpose This document provides guidance on the content expected to be provided in a
POSITIVE AGEING INDICATORS 2007
 POSITIVE AGEING INDICATORS 2007 Acknowledgements The Ministry of Social Development wishes to thank the staff of the following agencies who helped in producing this report: Statistics New Zealand Ministry
The Social Cost of Road Crashes and Injuries 2013 update
 The Social Cost of Road Crashes and Injuries 2013 update ANNUAL UPDATE NOVEMBER 2013 Prepared by Financial, Economic and Statistical Analysis Team, Ministry of Transport ISSN 1173-1370 Technical queries
Social cost of road crashes and injuries 2016 update. March 2017
 Social cost of road crashes and injuries 2016 update March 2017 Technical queries and comments on this report should be referred to: Financial, Economic and Statistical Analysis Team Ministry of Transport
Social cost of road crashes and injuries 2017 update. December 2017
 Social cost of road crashes and injuries 2017 update December 2017 Technical queries and comments on this report should be referred to: Domain Strategy, Economics and Evaluation Ministry of Transport PO
Social cost of road crashes and injuries 2015 update. March 2016
 Social cost of road crashes and injuries 2015 update March 2016 Technical queries and comments on this report should be referred to: Financial, Economic and Statistical Analysis Team Ministry of Transport
NHS ENGLAND - BOARD PAPER. Title: Allocation of resources to NHS England and the commissioning sector for 2019/20 to 2023/24
 Paper: PB.31.01.2019/04 NHS ENGLAND - BOARD PAPER Title: Allocation of resources to NHS England and the commissioning sector for 2019/20 to 2023/24 From: Matthew Style, Interim Chief Financial Officer,
Financial Allocations 2016/ /21
 Financial Allocations 2016/17-2020/21 Document Title Allocations Financial Allocations 2016/17-2020/21 Version number: 2.0 First published: 8 January 2016 Prepared by: John Bailey The National Health Service
Insolvency Statistics and Debtor Profile Report 1 JULY 2016 TO 30 JUNE 2017
 Insolvency Statistics and Debtor Profile Report 1 JULY 2016 TO 30 JUNE 2017 MB14340 Contents Introduction 2 Annual Statistics 3 Key Characteristics of Debtors 11 Summary Instalment Orders 12 No Asset Procedures
Phase 1 Evaluation of The Training Incentive Allowance
 Phase 1 Evaluation of The Training Incentive Allowance C. Adamson J. Forbes T. Woodson Centre for Social Research and Evaluation Te Pokapü Rangahau Arotake Hapori June 2003 The view and opinions expressed
Insolvency Statistics and Debtor Profile Report 1 JULY 2015 TO 30 JUNE 2016
 Insolvency Statistics and Debtor Profile Report 1 JULY 2015 TO 30 JUNE 2016 MB12830 Contents Introduction 2 Annual Statistics 3 Key Characteristics of Debtors 11 Summary Instalment Orders 12 No Asset Procedures
Did the 2018 Budget provide enough for health?
 Working Paper on Health Number 20, 21 June 2018 Did the 2018 Budget provide enough for health? Bill Rosenberg, Policy Director/Economist, NZCTU Te Kauae Kaimahi Lyndon Keene, Director of Policy and Research,
Change to asset thresholds for residential care subsidy and change to the maximum contribution for residential care
 25 June 2014 Dear Resident Change to asset thresholds for residential care subsidy and change to the maximum contribution for residential care Note: if you are already receiving a Residential Care Subsidy,
Population health profile of the. Northern Rivers. Division of General Practice: supplement
 Population health profile of the Northern Rivers Division of General Practice: supplement Population Profile Series: No. 3a PHIDU March 007 Copyright Commonwealth of 007 This work may be reproduced and
A brave new world. CDANZ 9 May Shamubeel Eaqub, CFA fb.me/seaqub
 A brave new world CDANZ 9 May 2018 Shamubeel Eaqub, CFA 021 573 218 @Seaqub fb.me/seaqub shamubeel@sense.partners A brave new world A rapidly changing world Economy, jobs Demographics Why it matters: Careers
BNZ-Nine Rewards Consumer Trends Survey
 BNZ-Nine Rewards Consumer Trends Survey 6 September 2013 ISSN 2324-4321 Mission Statement To help Kiwi businesspeople and householders make informed financial decisions by discussing the economy in a language
Governments invest substantial
 MORTALITY How efficient are New Zealand s District Health Boards at producing life expectancy gains for Māori and Europeans? Peter Sandiford, 1,2 David Juan José Vivas Consuelo, 3 Paul Rouse 4 Governments
ECONOMIC INEQUALITIES IN HEALTH
 ECONOMIC INEQUALITIES IN HEALTH Aim of Master Class Gain a better understanding of the causal relationships between economic factors on health over time Plan of attack Kristie Carter Overview of economic
Care and Support Workers (Pay Equity) Settlement
 Settlement") Care and Support Workers (Pay Equity) Settlement Operational Policy Document For Aged Residential Care Working Document Released 16 June 2017 health.govt.nz Citation: Ministry of Health This work is licensed
Care and Support Workers (Pay Equity) Settlement Operational Policy Document For Aged Residential Care Working Document Released 16 June 2017 health.govt.nz Citation: Ministry of Health This work is licensed
PART B Details of ICT collections
 PART B Details of ICT collections Name of collection: Household Use of Information and Communication Technology 2006 Survey Nature of collection If possible, use the classification of collection types
Coversheet: Increasing the minimum wage
 Coversheet: Increasing the minimum wage Advising agencies Decision sought Proposing Ministers Ministry of Business, Innovation and Employment Increasing the Minimum Wage Minister for Workplace Relations
Senior Pay Report. Including Chief Executive Remuneration Disclosure 2016/17
 Senior Pay Report Including Chief Executive Remuneration Disclosure 2016/17 State Services Commissioner s Introduction The State Services Commission has been disclosing chief executive (CE) remuneration
Guidance on the market forces factor: A supporting document for the 2017 to 2019 National Tariff Payment System
 Guidance on the market forces factor: A supporting document for the 2017 to 2019 National Tariff Payment System NHS England and NHS Improvement December 2016 Contents Unavoidable costs... 3 Application
How are population-based funding formulae for healthcare composed? A comparative analysis of seven models
 Penno et al. BMC Health Services Research 2013, 13:470 RESEARCH ARTICLE Open Access How are population-based funding formulae for healthcare composed? A comparative analysis of seven models Erin Penno
Page 1 healthalliance (FPSC) Limited Statement of Intent
 Limited Statement of Intent") Page 1 healthalliance (FPSC) Limited Statement of Intent 2017-2021 Page 1 healthalliance (FPSC) Limited Statement of Intent 2017-2021 Contents Message from the CEO... 4 About healthalliance (FPSC)... 5
Page 1 healthalliance (FPSC) Limited Statement of Intent 2017-2021 Page 1 healthalliance (FPSC) Limited Statement of Intent 2017-2021 Contents Message from the CEO... 4 About healthalliance (FPSC)... 5
Evaluation of the Primary Health Care Strategy: Changes in Fees and Consultation Rates between 2001 and 2007
 Evaluation of the Primary Health Care Strategy: Changes in Fees and Consultation Rates between 2001 and 2007 Antony Raymont Jacqueline Cumming Barry Gribben SEPTEMBER 2013 1 Published in September 2013
Raphael Wittenberg LONG-TERM CARE FOR OLDER PEOPLE: ECONOMIC ISSUES. Myers JDC Brookdale Institute, Jerusalem 25 December 2013
 LONG-TERM CARE FOR OLDER PEOPLE: ECONOMIC ISSUES Raphael Wittenberg Personal Social Services Research Unit, LSE Centre for Health Services Economics & Organisation, Oxford Myers JDC Brookdale Institute,
Executive Summary MINISTRY OF BUSINESS, INNOVATION & EMPLOYMENT MĀORI IN THE LABOUR MARKET
 Executive Summary in the Labour Market presents key labour market information from 2009 to 2014 from the Household Labour Force Survey (HLFS) for both at a national and regional level. The key findings
Quarterly Labour Market Report. September 2016
 Quarterly Labour Market Report September 2016 MB13809 Sept 2016 Ministry of Business, Innovation and Employment (MBIE) Hikina Whakatutuki - Lifting to make successful MBIE develops and delivers policy,
Annual Report. Ministry of Health. for the year ended 30 June 2016
 E.10 AR (2015/16) Annual Report for the year ended 30 June 2016 Ministry of Health Presented to the House of Representatives pursuant to section 44 of the Public Finance Act 1989 Released 2016 health.govt.nz
Quarter Quarter Quarter Additional information / Action taken Non-Residential services commissioned and provided for
 Financial Monitoring 2017/18 General Fund Revenue Material s Appendix 2 Education, Communities and Economy Children s Services Reason for Additional information / Action taken Non-Residential services
Projections for Palmerston North
 1 Projections for Palmerston North 2006-2031 Draft for consultation Prepared by: Peter Crawford Jason Pilkington Kirsten Wierenga July 2008 1 2 Table of Contents Executive Summary 3 Introduction 6 Overview
Happiness of New Zealand
 UMR Omnibus Results January 2012 Happiness of New Zealand Email: umr@umr.co.nz WELLINGTON 3 Collina Terrace Thorndon WELLINGTON 6011 NEW ZEALAND Tel: +64 4 473 1061 Fax: +64 4 472 3501 Website: www.umr.co.nz
Ministry of Economic Development SMEs in New Zealand: Structure and Dynamics
 Ministry of Economic Development 27 SMEs in New Zealand: Structure and Dynamics July 27 1 Contents List of Graphs and Tables...3 Overview...5 Defining Small and Medium-Sized Enterprises...6 Employment
Clarifying joint financing arrangements A briefing paper for health bodies and local authorities
 Clarifying joint financing arrangements A briefing paper for health bodies and local authorities Introduction 1 Health organisations and local authorities have long been encouraged to work together to
How does the Treasury s Long-Term Fiscal Model work, and what is our initial analysis showing?
 How does the Treasury s Long-Term Fiscal Model work, and what is our initial analysis showing? Speech delivered by Girol Karacaoglu Chief Economist, the Treasury Affording O ur Future Conference 2012 Victoria
INDIGENOUS DARWIN AND THE REST OF THE NORTHERN TERRITORY
 POPULATION STUDIES RESEARCH BRIEF ISSUE Number 2009026 School for Social and Policy Research 2008 Population Studies Group School for Social and Policy Research Charles Darwin University Northern Territory
Public Health Monograph Series No. 28 ISSN
 Public Health Monograph Series No. 28 ISSN 1178-7139 - 5 December 2012 A working paper published by the Department of Public Health, University of Otago, Wellington, New Zealand ISBN 978-0-9876663-3-8
Care and Support Workers (Pay Equity) Settlement
 Settlement") Care and Support Workers (Pay Equity) Settlement Operational Policy Document For Home and Community Support Services Providers Working document released 16 June 2017 health.govt.nz Citation: Ministry of
Care and Support Workers (Pay Equity) Settlement Operational Policy Document For Home and Community Support Services Providers Working document released 16 June 2017 health.govt.nz Citation: Ministry of
Section 3: Tertiary education sector
 State Services Commission Annual Report G.3 Section 3: Tertiary education sector The following two tables present similar information to that in Section 2, above, for the tertiary education sector. Table
questions for written response
 2007/08 financial review of Retirement Commissioner questions for written response Why did the Commission have a $463k surplus in the 2007/08 financial year when it budgeted on a $1.049 million deficit?
june 07 tpp 07-3 Service Costing in General Government Sector Agencies OFFICE OF FINANCIAL MANAGEMENT Policy & Guidelines Paper
 june 07 Service Costing in General Government Sector Agencies OFFICE OF FINANCIAL MANAGEMENT Policy & Guidelines Paper Contents: Page Preface Executive Summary 1 2 1 Service Costing in the General Government
SMEs in New Zealand: Structure and Dynamics 2011
 SMEs in New Zealand: Structure and Dynamics 2011 Ministry of Economic Development September 2011 ISSN 1178-3281 Contents List of Commonly Used Abbreviations...2 Part 1: Overview...3 Introduction...3 Layout
Neighbourhoods. The English Indices of Deprivation Bradford District. Neighbourhoods. Statistical Release. June 2011.
 Neighbourhoods Statistical Release The English Indices of Deprivation 2010 Bradford District About this release This release provides an overview of the findings of the English Indices of Deprivation 2010
Financial Transaction Reports Regulations 1990
 Financial Transaction Reports Regulations 1990 Statutory Rules 1990 No. 36 as amended made under the Financial Transaction Reports Act 1988 This compilation was prepared on 13 March 2003 taking into account
Fact Sheet: Investor Confidence Rating (ICR)
") Fact Sheet: Investor Confidence Rating (ICR) Investor Confidence Rating Ensuring value from government investments Establishing how agencies are managing investments and assets is a critical way to ensure
Fact Sheet: Investor Confidence Rating (ICR) Investor Confidence Rating Ensuring value from government investments Establishing how agencies are managing investments and assets is a critical way to ensure
2017/18 Annual review of the Wairarapa District Health Board
 2017/18 Annual review of the Wairarapa District Health Board Report of the Health Committee March 2019 Contents Recommendation... 2 Background... 2 Financial overview... 2 Audit results... 2 Financial
REMUNERATION SURVEY 2017 SNAPSHOT
 REMUNERATION SURVEY 2017 SNAPSHOT THIS YEAR, MORE THAN 3,100 MEMBERS FILLED IN OUR SURVEY STEADY AS WE GO While salaries are relatively static, with graduate salaries the same as last year and team leaders
Economic Standard of Living
 DESIRED OUTCOMES New Zealand is a prosperous society, reflecting the value of both paid and unpaid work. All people have access to adequate incomes and decent, affordable housing that meets their needs.
Economic Standard of Living
 DESIRED OUTCOMES New Zealand is a prosperous society where all people have access to adequate incomes and enjoy standards of living that mean they can fully participate in society and have choice about
THE CAYMAN ISLANDS LABOUR FORCE SURVEY REPORT SPRING 2017
 THE CAYMAN ISLANDS LABOUR FORCE SURVEY REPORT SPRING 2017 Published AUGUST 2017 Economics and Statistics Office i CONTENTS SUMMARY TABLE 1: KEY LABOUR FORCE INDICATORS BY STATUS... 1 SUMMARY TABLE 2: KEY
Health Equity & Social Determinants
 Health Equity & Social Determinants Overview Professor Tony Blakely, University of Otago 1 Index Preliminaries Acknowledgements and conference pack Acknowledgements: NZMA and University of Otago teams
Financing II: Pooling and (Re-)Allocation
Allocation") Financing II: Pooling and (Re-)Allocation Managing and Researching Health Care Systems Reinhard Busse, Prof. Dr. med. MPH FFPH FG Management im Gesundheitswesen, Technische Universität Berlin (WHO Collaborating
Financing II: Pooling and (Re-)Allocation Managing and Researching Health Care Systems Reinhard Busse, Prof. Dr. med. MPH FFPH FG Management im Gesundheitswesen, Technische Universität Berlin (WHO Collaborating
Healthy life expectancy: key points (new data this update)
") NOTE: This is an Archive Report of the Healthy Life Expectancy web pages on the ScotPHO website, as at 16 December 2014 Links within this report have been disabled to avoid users accessing out-of-date
NOTE: This is an Archive Report of the Healthy Life Expectancy web pages on the ScotPHO website, as at 16 December 2014 Links within this report have been disabled to avoid users accessing out-of-date
Climate Change: Adaptation for Queensland. Issues Paper
 Climate Change: Adaptation for Queensland Issues Paper QCOSS Submission, October 2011 1 Climate Change: Adaptation for Queensland QCOSS response to the Issues Paper Introduction Queensland Council of Social
(Submitted by the Central Statistical Office, Salisbury, Rhodesia and
 a. CAS/2. WP/4 ECONOMIC COMMISSION FOE AFRICA CONFERENCE OP AFRICAN STATISTICIANS SECOND CONFERENCE JUUE, 1961 TUNIS, TUNISIA Provisional Agenda Item No, 5(a) FEH3HATI0N OP RHOEBSIA AND NYASALAND FIVE
SENIOR MEDICAL AND DENTAL OFFICERS 1 JULY MARCH 2020
 NEW ZEALAND DISTRICT HEALTH BOARDS SENIOR MEDICAL AND DENTAL OFFICERS COLLECTIVE AGREEMENT 1 JULY 2017 31 MARCH 2020 L11 The Bayleys Building, 36 Brandon Street, PO Box 10763 Wellington, New Zealand P
A deprivation and demographic profile of the Nelson Marlborough DHB
 A deprivation and demographic profile of the Nelson Marlborough DHB Nelson Marlborough DHB, showing overall IMD deprivation with the most deprived areas shaded darkest Rachael Yong, Michael Browne, Dr
MOH Future Directions for Eating Disorders document (2008)
") Rachel Lawson South Island Eating Disorders Service, CDHB Roger Mysliwiec, Maugan Rimmer, Liesje Donkin Regional Eating Disorders Service, ADHB Sharleen Tippett Central Region Eating Disorders Service,
Rachel Lawson South Island Eating Disorders Service, CDHB Roger Mysliwiec, Maugan Rimmer, Liesje Donkin Regional Eating Disorders Service, ADHB Sharleen Tippett Central Region Eating Disorders Service,
Regulatory Impact Statement Minimum Wage Review 2016
 Regulatory Impact Statement Minimum Wage Review 2016 Agency Disclosure Statement 1. 2. 3. 4. 5. 6. 7. This Regulatory Impact Statement (RIS) has been prepared by the Ministry of Business, Innovation and
Tertiary Education Commission
 Financial Review briefing to the Education and Science Committee 2008/09 Financial Year Tertiary Education Commission 1 17 February 2010 2 Assistance to the Committee The Education and Science Committee
What are the next steps?
 KiwiSaver and the ageing population: What are the next steps? Susan St John RPRC Business School The University of Auckland KiwiSaver is here to stay But how stable and sensible are our policies looking
Vulnerability of Norwegian Municipalities to Natural Hazards
 Vulnerability of Norwegian Municipalities to Natural Hazards Trondheim Ivar S. Holand PhD Research Fellow Department of Geography, Norwegian university of Science and Technology (NTNU), Norway Ivar.S.Holand@hint.no
Global and National Action on SDH. Michael Marmot UCL
 Global and National Action on SDH Michael Marmot UCL Secretary s Advisory Committee on National Health Promotion and Disease Prevention Objectives for 2010 Web-based Meeting 11 th Dec 2009 Lessons from
Discussion paper. Insuring public assets
 Discussion paper Insuring public assets Office of the Auditor-General PO Box 3928, Wellington 6140 Telephone: (04) 917 1500 Facsimile: (04) 917 1549 Email: reports@oag.govt.nz Website: www.oag.govt.nz
Small and Medium Scale Enterprises Development
 Berichte aus der Volkswirtschaft Denis M. Sandy Small and Medium Scale Enterprises Development A Strategy for Poverty Alleviation in Sierra Leone D 46 (Diss. Universitat Bremen) Shaker Verlag Aachen 2003
KENYA NATIONAL HEALTH ACCOUNTS 2012/13
 REPUBLIC OF KENYA KENYA NATIONAL HEALTH ACCOUNTS 2012/13 Ministry of Health KENYA NATIONAL HEALTH ACCOUNTS 2012/13 ii P age NHA 2012/2013 Collaborating Institutions COLLABORATING INSTITUTIONS Ministry
Patient Protection and Affordable Care Act: HHS Notice of Benefit and Payment Parameters for 2014 Final Rule Summary.
 Patient Protection and Affordable Care Act: HHS Notice of Benefit and Payment Parameters for 2014 Final Rule Summary March 21, 2013 On March 11, 2013, the Centers for Medicare & Medicaid Services (CMS)
Scottish Indices of Multiple Deprivation (SIMD)
") Scottish Indices of Multiple Deprivation (SIMD) The dataset for the Lothian NHS Board Public Health Annual Report 2004 uses the Scottish Indices of Multiple Deprivation (SIMD). These indices are the most
Scottish Indices of Multiple Deprivation (SIMD) The dataset for the Lothian NHS Board Public Health Annual Report 2004 uses the Scottish Indices of Multiple Deprivation (SIMD). These indices are the most
Using the United Nations Madrid indicators to better understand our ageing population
 Using the United Nations Madrid indicators to better understand our ageing population Office of the Auditor-General PO Box 3928, Wellington 6140 Telephone: (04) 917 1500 Facsimile: (04) 917 1549 Email:
Methodology and Tools for Supporting the Formulation of Evidence-based Policies in Response to the Challenge of Population Ageing in Malawi
 Methodology and Tools for Supporting the Formulation of Evidence-based Policies in Response to the Challenge of Population Ageing in Malawi By Jesman Chintsanya, PhD Department of Population Studies, Chancellor
Economic Standard of Living
 DESIRED OUTCOMES New Zealand is a prosperous society, reflecting the value of both paid and unpaid work. Everybody has access to an adequate income and decent, affordable housing that meets their needs.
New Zealand Business Number agreement to issue Whole of Government directions
 OFFICE OF THE MINISTER OF FINANCE OFFICE OF THE MINISTER FOR ECONOMIC DEVELOPMENT OFFICE OF THE MINISTER OF STATE SERVICES The Chair Economic Growth and Infrastructure Committee New Zealand Business Number
POPULATION AGEING AND HEALT H SPENDING: 50-YEAR PROJECTIONS
 POPULATION AGEING AND HEALT H SPENDING: 50-YEAR PROJECTIONS Grant Johnston and Audrey Teasdale Policy Branch Ministry of Health OCCASIONAL PAPER December 1999 NO 2 NOTE ABOUT THE OCCASIONAL PAPERS SERIES
HEALTH CARE SYSTEM IN CROATIA
 HEALTH CARE SYSTEM IN CROATIA Professor Miroslav Mastilica Andrija Štampar School of Public Health University of Zagreb mmastil@snz.hr Vanesa Benković, MA Public Health Leadership and Management vanesa@mediametar.hr
The Treasury. Social Bonds Information Release. Release Document April
 The Treasury Social Bonds Information Release Release Document April 2017 www.treasury.govt.nz/publications/informationreleases/socialbonds Key to sections of the Official Information Act 1982 under which
Public Health Wales Standing Orders
 Public Health Wales and Reservation and Delegation of Powers Date: January 2018 Version: 5 Page: 1 of 80 Foreword National Health Service Trusts ( NHS Trusts ) in Wales must agree (SOs) for the regulation
2017 general practice workforce survey
 THE ROYAL NEW ZEALAND COLLEGE OF GENERAL PRACTITIONERS 2017 general practice workforce survey Demographics Working arrangements Retirement intentions Wellbeing 1 PART Published by The Royal New Zealand
NEW ZEALAND BUSINESS BENCHMARKING SURVEY - QUESTIONNAIRE ITEMS
 NEW ZEALAND BUSINESS BENCHMARKING SURVEY - QUESTIONNAIRE ITEMS Numeric values are assigned to each of the demographic question options below to use when importing/submitting client data. These values are
INDEPENDENT POLICE CONDUCT AUTHORITY
 G. 51 INDEPENDENT POLICE CONDUCT AUTHORITY Statement of Performance Expectations - 2018/19 G.51 Copyright This copyright work is licensed under the Creative Commons Attribution 3.0 licence. In essence
Napier City Socio-Demographic Profile Report prepared for the Napier City Council by Professor Natalie Jackson
 Napier City Socio-Demographic Profile 1986-2011 Report prepared for the Napier City Council by Professor Natalie Jackson November 2011 Table of Contents EXECUTIVE SUMMARY 4 What you need to know about
Communities and Local Government Committee. Reforming Local Authority Needs Assessment. Paper 1 Simplifying the Needs Assessment Formula
 LG FUTURES Communities and Local Government Committee Reforming Local Authority Needs Assessment Paper 1 Simplifying the Needs Assessment Formula October 2017 FINANCE WITH VISION LG Futures Ltd., Marlowe
Mandatory insulation requirements for rental properties
 1 Mandatory insulation requirements for rental properties A review of the cost benefit analysis January 2016 2 About Tailrisk Economics Tailrisk Economics is a Wellington economics consultancy. It specialises
In Confidence. Office of the Minister for Regional Economic Development. Chair, Cabinet THE PROVINCIAL GROWTH FUND. Purpose
 In Confidence Office of the Minister for Regional Economic Development Chair, Cabinet THE PROVINCIAL GROWTH FUND Purpose This paper sets the broad parameters for the Provincial Growth Fund. This will enable
The Ngāi Tahu population is growing...
 State of the Nation introduction The Ngāi Tahu State of the Nation report has been developed to provide detailed information on the nature of our whānui. The Ngāi Tahu population is unique and cannot be
Impact Assessment Risk Stratification
 Privacy Impact Assessment Risk Privacy Stratification Impact Assessment Risk Stratification IG Taskforce Consultation Paper CP-02 March 2014 PIA Risk stratification Page 1 of 23 NHS England INFORMATION
The Relationship between Psychological Distress and Psychological Wellbeing
 The Relationship between Psychological Distress and Psychological Wellbeing - Kessler 10 and Various Wellbeing Scales - The Assessment of the Determinants and Epidemiology of Psychological Distress (ADEPD)
42 USC 1395ww. NB: This unofficial compilation of the U.S. Code is current as of Jan. 4, 2012 (see
 TITLE 42 - THE PUBLIC HEALTH AND WELFARE CHAPTER 7 - SOCIAL SECURITY SUBCHAPTER XVIII - HEALTH INSURANCE FOR AGED AND DISABLED Part E - Miscellaneous Provisions 1395ww. Payments to hospitals for inpatient
2017 Protection Gap Study Singapore
 2017 Protection Gap Study Singapore Prepared by Ernst & Young Advisory Pte Ltd Published on: 26 April 2018 Table of contents 1. Executive Summary... 2 2. Introduction... 4 3. Definition of the protection
The Economic Value of the Adult Social Care sector - UK Final report
 The Economic Value of the Adult Social Care sector - UK Final report 05 June 2018 Final report The Economic Value of the Adult Social Care sector - UK Final report A report submitted by ICF Consulting
Release of the Victorian Health Policy and Funding Guidelines
 Release of the Victorian Health Policy and Funding Guidelines 2014-15 19 th September 2014 The Victorian Department of Health released the Victorian health policy and funding guidelines 2014-15. The document