Vulnerability of Norwegian Municipalities to Natural Hazards
|
|
|
- Sharlene Bernadette Dalton
- 6 years ago
- Views:
Transcription
, Norway Ivar.S.Holand@hint.")
1 Vulnerability of Norwegian Municipalities to Natural Hazards Trondheim Ivar S. Holand PhD Research Fellow Department of Geography, Norwegian university of Science and Technology (NTNU), Norway Project: Geography of social vulnerability, environmental hazards, and climate change (VULCLIM)
. Wisner et al.")
2 Vulnerability the characteristics of a person or group and their situation that influence their capacity to anticipate, cope with, resist, and recover form the impact of a natural hazard (an extreme natural event or process). Wisner et al Social vulnerability perspective Only people are vulnerable (a house is unsafe, a slope is unstable etc.)
3 Objectives Quantify social vulnerability to natural hazards in Norwegian municipalities Map differences in relative vulnerability between municipalities. A secondary objective is to establish a knowledge basis that facilitates further in depth analyses of social vulnerability to natural hazards in selected regions at a lower geographical level, and for analyses of future vulnerability.
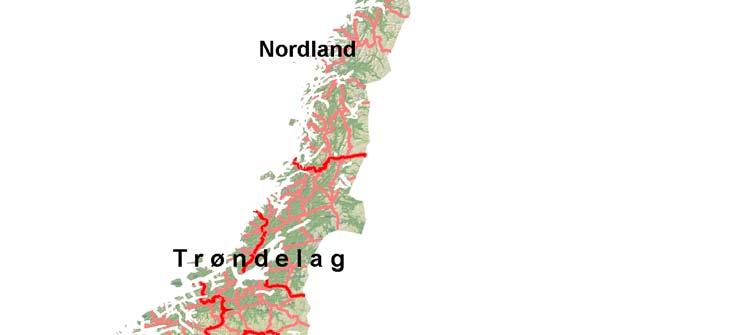
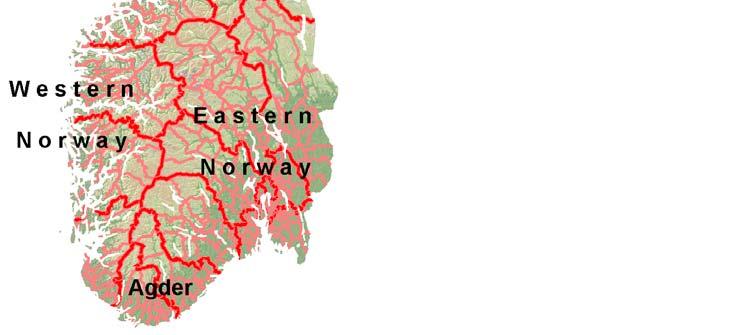
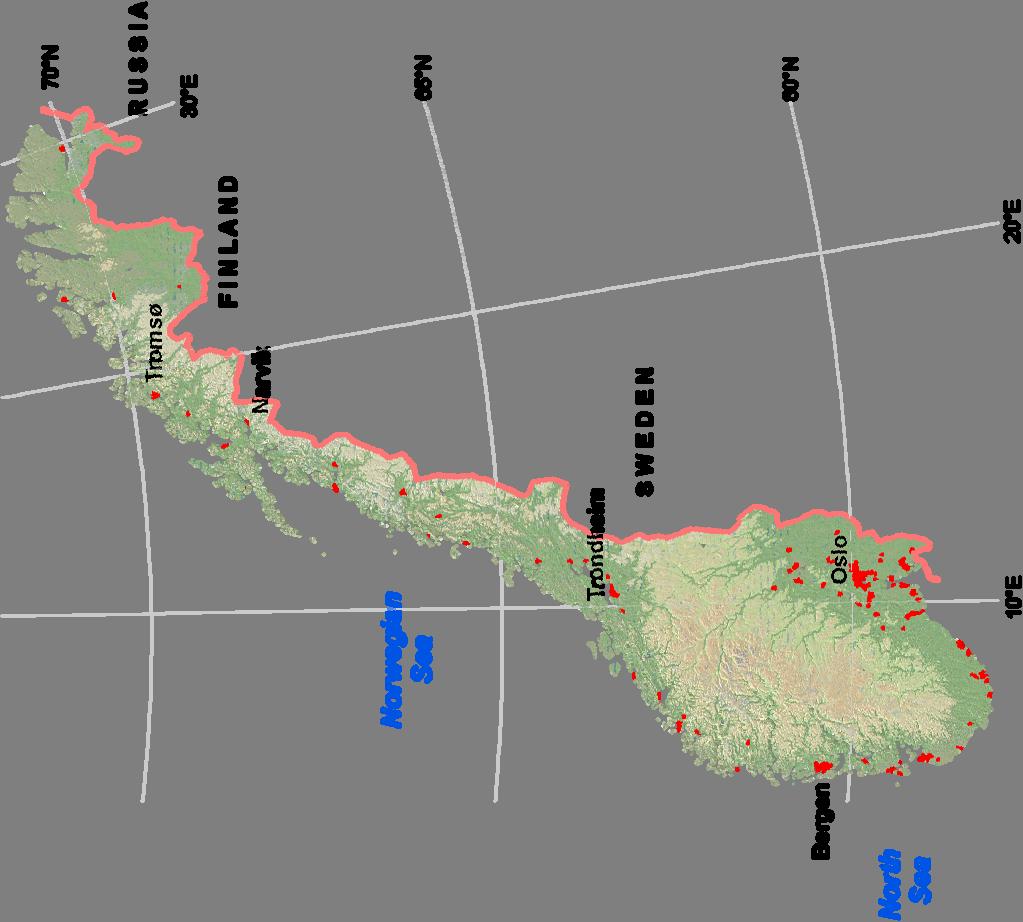
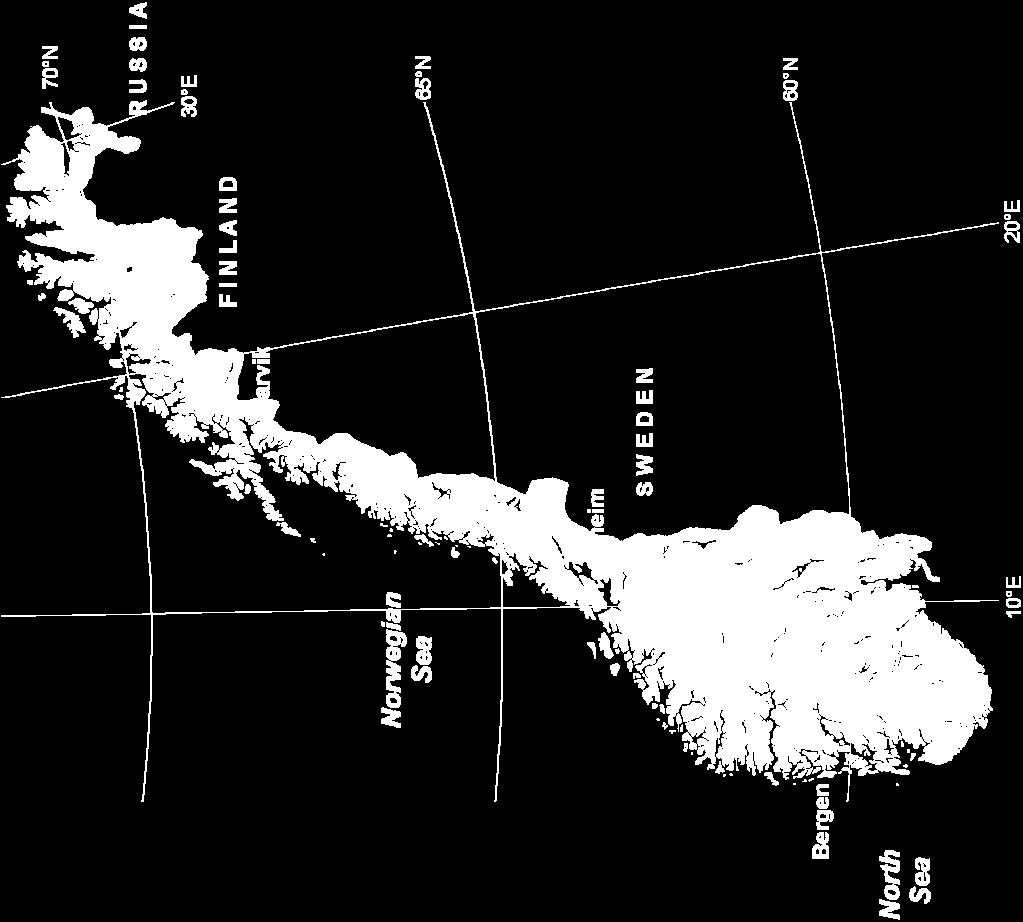
4 Norway
.")
, 90 knots in")

5 Per capita damages (NOK) from the Norwegian Natural Perils Pool to victims of natural hazards, (NOK 1 NT$ 5). Situation New Yea rs Morning 1992: Sustained wind 70 knots in cities close to the coast (hurricane 1), 90 knots in lighthouses on the coast (major hurricane 3). Gusts up to 120 knots. Large damage, small casualties January , UTC


6 The Fjørå community before and after the 1934 Tafjord accident (3 million m³ rockslide tsunami) Photo: Ingvald Uri. Source: geoporalen.no


7 Photo: Aaknes (danger of million m³ rockslide and tsunami)

 Photo: Erik Olsen,")
8 Photo: Erik Olsen, NGU archives Where the gound failed in the 1893 Verdal valley quick clay slide and the valley after the slide (65 million m³ quick clay slide dam flood) Photo: Erik Olsen, NTNU archives

9 Quick clay slide in Reina, Nord-Trøndelag, million m³ moving 1,3 km downstream.

10 Photo: Lars Erik Skjærseth/NRK
11 Approach Apply approach of Cutter and associates (Cutter et al. 2003; Borden et al. 2007), that utilises the hazardsof place model of vulnerability (Cutter 1996; Cutter et al. 2000) to build vulnerability indices. Two versions: Replica Adapted
12 Method 1. Select statistical indicators of social vulnerability on the basis of empirical knowledge 2. Reduce complexity of data using factor analysis 3. Compile index from factor scores in an additive process Do results make sense?
13 Because we run the analysis twice; we also study two major sets of data variables: 1. Data that replicate the variables included in the Cutter et al. (2003) SoVI model 2. Data where concepts and metrics have been reconsidered and adapted to the Norwegian setting
14 Example: Original considerations of vulnerability concept gender Cutter et al (2003) consider: Due to gender inequalities, women s role in care giving, lack of mobility, and limited access to resources, gender is regarded as a significant, explanatory variable in disaster and vulnerability research (Fothergill 1996). Disadvantaged women suffer disproportionally in a disaster (Hewitt 1997). Many women in low skill service occupations employment that is more likely to be affected by disasters (Morrow 1999). High proportion of females in population increases vulnerability (Cutter et al. 2003) High proportion of females participating in the work force increases vulnerability (Cutter et al. 2003). Therefore, in the American context, the proportion of women in population and in workforce is considered to increase vulnerability.
15 Example: Reconsideration to the Norwegian setting We reconsider: Nordic countries have high levels of gender equality (Plantenga et al. 2009; Hausmann et al. 2007), which reduces the significance of gender as a major contributor to vulnerability. Female participation in the labour force reduces women s economic dependency, and female participation in the labour force contributes positively to women s health (Rostad et al. 2009). Many women are employed in sheltered sectors health care and primary and secondary education. High proportion of women in population signifies vital community Therefore, in the Norwegian context, we consider gender equality to moderate vulnerability.
16 Age Vulnerability concept Socioeconomic status Gender Immigration and ethnicity Commercial and industrial development Employment loss Rural / urban Residential property Infrastructure and lifelines Renters Occupation Family structure Education Population growth Medical services Social dependence Special needs populations Gender (+) Nonwhite (+) Non Anglo (+) High density (+) High value (+) Employment loss (+) Rural (+), Urban (+) Mobile homes (+) Extensive infrastructure (+) Renters (+) Professional or managerial ( ) Clerical or laborer (+), Service sector (+) High birth rates (+), Large families (+) Single parent households (+) Little education (+), Highly educated ( ) Rapid growth (+) SoVI (Cutter et al. 2003) High Status (+/ ) Low income or status (+) Elderly (+), Children (+) Higher density of medical ( ) High dependence (+), Low dependence ( ) Large special needs populations (+) Increases (+) or decreases ( ) social vulnerability High status ( ), Low income or status (+) Good public finances ( ), Civic involvement ( ) Gender equality ( ) Immigrants of non western origin (+) Western immigrants ( ) Elderly (+), Children (+) High density (+) Employment loss (+) Rural (+), Urban (+) House value ( ), Old houses (+) Extensive infrastructure (+) Old infrastructure (+), Exit routes ( ) Renters (+) Low skilled service sector (+), Primary sector (+), Labour force participation ( ) Single parent households (+) Little education (+), Highly educated ( ) Out migration (+) SeVI and BEVI Higher density of medical ( ) Distance to medical services (+) High dependence (+), Low dependence ( ) Large special needs populations (+) Table 1. Cutter et al. (2003) vulnerability concepts and metrics vs. Norway adapted SeVI and BEVI.
17 Factor Label Variable (main loading) Loading Sign % population 67 years or older 0.89 % population 5 years or younger 0.79 % households with income less than NOK Population structure % population change 0.69 % population living in nursing homes (old & disabled) 0.67 Birth rate (number of births per 1,000 population) 0.66 Average number of household members 0.53 % females in labour force 0.77 % employed in service sector Gender % females 0.67 % employed in primary extractive industries Distance to nearest hospital 0.47 % electorate voting in municipal election 0.45 # commercial establishments per km² 0.78 Average income Income % households earning more than NOK 0.69 % first or second generation non western immigrants 0.64 Value of housing units 0.56 % urban population 0.53 % unemployed 0.83 % receiving invalidity pension Socioeconomic status % with only lower secondary education 0.63 % participating in the labour force % single parent households 0.53 % agricultural land Renters # physician labour years in primary health care per inhabitants 0.56 % renters NOTE: Table shows the results from Principal Components Factoring (PCF) analysis with Varimax rotation and Horst normalization. Analysis is based on 431 Norwegian municipalities and 27 variables. 5 factors were extracted. For the method, variables, and definitions, see the text. Sign adjustment: absolute ( ), negative ( ), or positive (+). Table 2. Factors, factor labels, factor loadings, and factor sign adjustment for the SoVINOR model.
18 Factor Label 1. Population structure and socioeconomic status 2. High skilled, equal, and multiethnic vs. lowskilled Variable (main loading) % households with income less than NOK % population 67 years or older % population living in nursing homes (old & disabled) % receiving invalidity pension % households earning more than NOK Median income % participating in the labour force % population 5 years or younger % Labour force employed in health care and social services % with only lower secondary education % employed in primary sector (farming, fishing, forestry) % first or second generation non western immigrants % Western immigrants % employed in low skill services % with 4 years or more of tertiary education Loading Gender equality 0.66 Average value of housing units 0.65 % municipality's net debt of gross revenue Municipal viability % municipality's expenditure on debt service of total income 0.49 Municipality's disposable income per inhabitant 0.73 % electorate voting in municipal election 0.63 % unemployed Declining periphery % out migration 0.64 % single parent households 0.54 Median per capita capital assets 0.55 NOTE: Table shows the results from Principal Components Factoring (PCF) analysis with Varimax rotation and Horst normalization. Analysis is based on 431 Norwegian municipalities and 25 variables. 4 factors were extracted. For the method, variables, and definitions, see the text. Sign adjustment: negative ( ) or positive (+). Sign + Table 2. Factors, factor labels, factor loadings, and factor sign adjustment for the SeVI model.
19 Factor Label 1. Lifelines 2. Settlement pattern 3. Aging infrastructure Variable (main loading) Length of municipal roads (km per capita) # exit routes per 1000 inhabitants Distance to nearest hospital Population density Number of housing construction sites Average age of water pipelines Average age of sewer pipes Loading % residential building stock built after NOTE: Table shows the results from Principal Components Factoring (PCF) analysis with Varimax rotation and Horst normalization. Analysis is based on 431 Norwegian municipalities and 8 variables. 3 factors were extracted. For the method, variables, and definitions, see the text. Sign adjustment: absolute, negative ( ), or positive (+) Sign + + Table 2. Factors, factor labels, factor loadings, and factor sign adjustment for the BEVI model.
20 Where is the GIS in this? Createvariables(density measures, distance to nearest hospital, exit routes) Inspection of results impossible without maps Communicaterelative differences in vulnerability

21 Relative differences in vulnerability SoVINOR replica Results I SeVI adapted BEVI adapted
22 Results II Social vulnerability index framework applicable also outside the USA Because the social order of societies varies, it is important to adjust models to local context
23 Results III The building of indices such as the Social Vulnerability Index using factor analysis is a subjective process Are concepts universal? What metrics to use? Directionality of indicators? Parameters for the statistical analysis? How many factors to retain? but our our results are stable across a number of model specifications. How to interpret the results
24 Ivar S. Holand Department of Geography, Norwegian university of Science and Technology (NTNU), Norway Päivi Lujala Department of Economics, NTNU, Norway Jan Ketil Rød Department of Geography, NTNU, Norway
Northeast Florida Healthcare Coalition Multi-Year Strategic Plan ( )
") INTRODUCTION Northeast Florida Healthcare Coalition Multi-Year Strategic Plan (2014-2017) The Northeast Florida Healthcare Coalition (NEFLHCC) was organized in early 2014 with six county and four discipline
INTRODUCTION Northeast Florida Healthcare Coalition Multi-Year Strategic Plan (2014-2017) The Northeast Florida Healthcare Coalition (NEFLHCC) was organized in early 2014 with six county and four discipline
P R E S S R E L E A S E Risk of poverty
 HELLENIC REPUBLIC HELLENIC STATISTICAL AUTHORITY Piraeus, 23 / 6 / 2017 P R E S S R E L E A S E Risk of poverty 2016 SURVEY ON INCOME AND LIVING CONDITIONS (Income reference period 2015) The Hellenic Statistical
Socio-Economic Vulnerability and Losses
 Systemic Seismic Vulnerability and Risk Analysis for Buildings, Lifeline Networks and Infrastructures Safety Gain Socio-Economic Vulnerability and Losses B. Khazai, J.E. Daniell, F. Wenzel Karlsruhe Institute
CEDIM Forensic Disaster Analysis Group (FDA) Mw 6.9 Earthquake Lombok, Indonesia
 Mw 6.9 Earthquake Lombok, Indonesia") CEDIM Forensic Disaster Analysis Group (FDA) Mw 6.9 Earthquake Lombok, Indonesia 07.08.2018 Situation Report No. 1 00:00 UTC Authors: James Daniell and Andreas Schaefer Official Disaster Name Date UTC
CEDIM Forensic Disaster Analysis Group (FDA) Mw 6.9 Earthquake Lombok, Indonesia 07.08.2018 Situation Report No. 1 00:00 UTC Authors: James Daniell and Andreas Schaefer Official Disaster Name Date UTC
Context/ Questions/ Methods/ Findings/ Policy Implications
 Built-In-Resilience: Learning from Grassroots Coping Strategies to Climate Variability Huraera Jabeen BRAC University, Bangladesh Adriana Allen University College London, UK Dr Cassidy Johnson University
at 8 th IAEG-SDGs Proportion of men, women and children of all ages living in poverty in all its dimensions according to national definition
 indicators and changes made at 8 th meeting of the IAEG-SDGs Target Indicator / changes made at 8 th IAEG-SDGs 1.2 1.2.2 Proportion of men, women and children of all ages living in poverty in all its dimensions
HAZUS th Annual Conference
 HAZUS 2014 7 th Annual Conference Welcome 2 Nicky Hastings, Natural Resources Canada REFLECTING ON AN EARTHQUAKE ANALYSIS FOR A MID-SIZED URBAN COMMUNITY IN WESTERN CANADA Opportunity or Liability? Resilience
Israel. Israel: regional, urban and rural development policies
 Key facts and issues Israel Israel is a unitary country with a population of 8.4 million. Its subnational governments are responsible for 13.4 of public expenditures, ranking Israel the 8 th least decentralised
Village of Blue Mounds Annex
 Village of Blue Mounds Annex Community Profile The Village of Blue Mounds is located in the southwest quadrant of the County, north of the town of Perry, west of the town of Springdale, and south of the
Climate change & social justice: Introducing Climate Just
 Climate change & social justice: Introducing Climate Just Katharine Knox Simon Industrial and Professional Fellow University of Manchester Edinburgh 17 April 2018 Overview Climate justice in the UK Introducing
Methodology and Tools for Supporting the Formulation of Evidence-based Policies in Response to the Challenge of Population Ageing in Malawi
 Methodology and Tools for Supporting the Formulation of Evidence-based Policies in Response to the Challenge of Population Ageing in Malawi By Jesman Chintsanya, PhD Department of Population Studies, Chancellor
Social Protection Strategy of Vietnam, : 2020: New concept and approach. Hanoi, 14 October, 2010
 Social Protection Strategy of Vietnam, 2011-2020: 2020: New concept and approach Hanoi, 14 October, 2010 Ministry of Labour,, Invalids and Social Affairs A. Labour Market Indicators 1. Total population,
Population & Demographic Analysis
 Population & Demographic Analysis The United States Census Bureau conducts a nationwide census every ten years. This census compiles information relating to the socio-economic characteristics of the entire
Mapping Flood Risk in the Upper Fox River Basin:
 Mapping Flood Risk in the Upper Fox River Basin: Vulnerable Populations and Adverse Health Effects Presented by: Angelina Hanson STUDY AREA: Wisconsin's Upper Fox River Basin Total Population 139,309.
Montenegro. Country coverage and the methodology of the Statistical Annex of the 2015 HDR
 Human Development Report 2015 Work for human development Briefing note for countries on the 2015 Human Development Report Montenegro Introduction The 2015 Human Development Report (HDR) Work for Human
MODULE 1 MODULE 1. Risk Management. Session 1: Common Terminology. Session 2: Risk Assessment Process
 Risk Management Session 1: Common Terminology Session 2: Risk Assessment Process Learning Objectives By the end of this module, the participant should be able to: Describe the basic terms and concepts
IN FIGURES 2015/2016
 IN FIGURES 2015/2016 Symbols Population TARTU IN FIGURES 2015/2016 Arms of Tartu Tartu is the second largest city in Estonia Tartu first mentioned in written sources 1,030 Length of the Emajõgi River in
Methods and Data for Developing Coordinated Population Forecasts
 Methods and Data for Developing Coordinated Population Forecasts Prepared by Population Research Center College of Urban and Public Affairs Portland State University March 2017 Table of Contents Introduction...
Katahdin Region Socioeconomic Indicators Katahdin Region
 Katahdin Region Socioeconomic Indicators Town of Medway Katahdin Region Socioeconomic Indicators Katahdin Region Report by Senator George J. Mitchell Center for Sustainability Solutions University of Maine
2016 Labor Market Profile
 2016 Labor Market Profile Prepared by The Tyler Economic Development Council Tyler Area Sponsor June 2016 The ability to demonstrate a regions availability of talented workers has become a vital tool
Executive Summary. Findings from Current Research
 Current State of Research on Social Inclusion in Asia and the Pacific: Focus on Ageing, Gender and Social Innovation (Background Paper for Senior Officials Meeting and the Forum of Ministers of Social
BROAD DEMOGRAPHIC TRENDS IN LDCs
 BROAD DEMOGRAPHIC TRENDS IN LDCs DEMOGRAPHIC CHANGES are CHALLENGES and OPPORTUNITIES for DEVELOPMENT. DEMOGRAPHIC CHALLENGES are DEVELOPMENT CHALLENGES. This year, world population will reach 7 BILLION,
World Social Security Report 2010/11 Providing coverage in times of crisis and beyond
 Executive Summary World Social Security Report 2010/11 Providing coverage in times of crisis and beyond The World Social Security Report 2010/11 is the first in a series of reports on social security coverage
Urban Action Agenda Community Profiles COVER TO GO HERE. City of Beacon
 Urban Action Agenda Community Profiles COVER TO GO HERE City of Beacon COMMUNITY OVERVIEW MAP POPULATION & DEMOGRAPHICS Population Basics 2,212 Population (2015) Population Change 2. since 2000 0.5 Square
Sharm El Sheikh Declaration on Disaster Risk Reduction. 16 September Adopted at the Second Arab Conference on Disaster Risk Reduction
 Sharm El Sheikh Declaration on Disaster Risk Reduction 16 September 2014 Adopted at the Second Arab Conference on Disaster Risk Reduction City of Sharm El Sheikh, Arab Republic of Egypt, 14 16 September
LABOUR MARKET. People in the labour market employment People in the labour market unemployment Labour market policy and public expenditure
 . LABOUR MARKET People in the labour market employment People in the labour market unemployment Labour market policy and public expenditure Labour market People in the labour market employment People
Workforce participation of mature aged women
 Workforce participation of mature aged women Geoff Gilfillan Senior Research Economist Productivity Commission Productivity Commission Topics Trends in labour force participation Potential labour supply
Two cases: Naga City Hangberg, Cape Town
 PMapping and PGIS for Participatory Hazard-Risk Management (CRA) M.K. McCall, ITC, Enschede Use of GIS and RS in Disaster Risk Management APDC ITC AIT Bangkok, May 2008 Two cases: Naga City Hangberg, Cape
Serbia. Country coverage and the methodology of the Statistical Annex of the 2015 HDR
 Human Development Report 2015 Work for human development Briefing note for countries on the 2015 Human Development Report Serbia Introduction The 2015 Human Development Report (HDR) Work for Human Development
THE CAYMAN ISLANDS LABOUR FORCE SURVEY REPORT SPRING 2017
 THE CAYMAN ISLANDS LABOUR FORCE SURVEY REPORT SPRING 2017 Published AUGUST 2017 Economics and Statistics Office i CONTENTS SUMMARY TABLE 1: KEY LABOUR FORCE INDICATORS BY STATUS... 1 SUMMARY TABLE 2: KEY
Karlstad, Sweden. Local progress report on the implementation of the 10 Essentials for Making Cities Resilient ( )
") Karlstad, Sweden Local progress report on the implementation of the 10 Essentials for Making Cities Resilient (2013-2014) Mayor: Ulf Nyqvist Name of focal point: -Anna -Sjödin Organization: -Karlstad Municipality
Karlstad, Sweden Local progress report on the implementation of the 10 Essentials for Making Cities Resilient (2013-2014) Mayor: Ulf Nyqvist Name of focal point: -Anna -Sjödin Organization: -Karlstad Municipality
Working Paper Regional Expert Group Meeting on Capacity Development for Disaster Information Management
 Working Paper Regional Expert Group Meeting on Capacity Development for Disaster Information Management A Proposal for Asia Pacific Integrated Disaster Risk Information Platform Prof. Mohsen Ghafouri-Ashtiani,
IB Economics Development Economics 4.1: Economic Growth and Development
 IB Economics: www.ibdeconomics.com 4.1 ECONOMIC GROWTH AND DEVELOPMENT: STUDENT LEARNING ACTIVITY Answer the questions that follow. 1. DEFINITIONS Define the following terms: Absolute poverty Closed economy
Introduction to the Disaster Risk Profile of Chittagong
 Introduction to the Disaster Risk Profile of Chittagong subir Das Focal Person Youth Issue Young Power in Social Action (YPSA) Cell: +01716692292 Email: subir18bd@yahoo.com Chittagong at a Glance 2nd largest
Government Decree on Flood Risk Management 659/2010
 Ministry of Agriculture and Forestry, Finland NB: Unofficial translation; legally binding texts are those in Finnish and Swedish. Government Decree on Flood Risk Management 659/2010 Section 1 Preliminary
TRAINING COURSE ON SOCIAL PROTECTION & FORMALIZATION TRINIDAD AND TOBAGO MARCH 15, 2017 INTRODUCTION
 TRAINING COURSE ON SOCIAL PROTECTION & FORMALIZATION TRINIDAD AND TOBAGO MARCH 15, 2017 INTRODUCTION INTRODUCTION Design of the NIS Assistance from the ILO in the 1960 s Social Security Minimum Standards
Section II: Vulnerability Assessment and Mitigation
 Section II: Vulnerability Assessment and Mitigation 1. Hazard Vulnerability Analysis (facility name) should conduct a thorough Hazard Vulnerability Analysis to help determine what events or incidents may
Oman. Country coverage and the methodology of the Statistical Annex of the 2015 HDR
 Human Development Report 2015 Work for human development Briefing note for countries on the 2015 Human Development Report Oman Introduction The 2015 Human Development Report (HDR) Work for Human Development
SDMX CONTENT-ORIENTED GUIDELINES LIST OF SUBJECT-MATTER DOMAINS
 SDMX CONTENT-ORIENTED GUIDELINES LIST OF SUBJECT-MATTER DOMAINS 2009 SDMX 2009 http://www.sdmx.org/ Page 2 of 10 SDMX list of statistical subject-matter domains 1 : Overview Domain 1: Demographic and social
Delhi Development Report
 Delhi Development Report PLANNING COMMISSION GOVERNMENT OF INDIA NEW DELHI Published by ACADEMIC FOUNDATION NEW DELHI '&.' " ': Contents o The Core Committee, including Partner Agencies and Project Team
PROPOSED SHOPPING CENTER
 PROPOSED SHOPPING CENTER Southeast Corner I-95 & Highway 192 Melbourne, Florida In a 5 Mile Radius 80,862 Population 32,408 Households $61K Avg HH Income SOONER INVESTMENT Commercial & Investment Real
Social security inequality among elderly Chinese persons
 Social security inequality among elderly Chinese persons Dr Zhixin (Frank) Feng Centre for Research on Ageing, University of Southampton www.southampton.ac.uk/ageing 1 Introduction China A developing country
POPULATION 3 MULLSJÖ KOMMUN
 POPULATION Population change - Population by age 9 9 9 + Age Share Population december st Population change after Age shares Year Population Net Net births migration W M Tot W M Tot W M Tot - - - - - 9
POPULATION 3 MULLSJÖ KOMMUN
 Share POPULATION 3 Population change 3-1 Population by age 1 7 1 7 1 7 1 7 7 7 7 7 9 9 3 7 9 11 1 3 7 9 1+ Age Population december 31st 1 Population change after 3 Age shares Year Population Net Net births
Town of Montrose Annex
 Town of Montrose Annex Community Profile The Town of Montrose is located in the Southwest quadrant of the County, east of the Town of Primrose, south of the Town of Verona, and west of the Town of Oregon.
6 Capacity CAPACITY 59
 CAPACITY 59 6 Capacity Changing climate conditions will have a number of potential impacts on agriculture. Farmers have differing adaptive capacities to adjust and moderate potential damages or take advantage
Briefing note for countries on the 2015 Human Development Report. Lesotho
 Human Development Report 2015 Work for human development Briefing note for countries on the 2015 Human Development Report Lesotho Introduction The 2015 Human Development Report (HDR) Work for Human Development
Summary. Evelyn Dyb and Katja Johannessen Homelessness in Norway 2012 A survey NIBR Report 2013:5
 22 Summary Evelyn Dyb and Katja Johannessen Homelessness in Norway 2012 A survey NIBR Report 2013:5 This report is an analysis of a survey of homeless people in Norway. The information on which the report
Sendai Cooperation Initiative for Disaster Risk Reduction
 Sendai Cooperation Initiative for Disaster Risk Reduction March 14, 2015 Disasters are a threat to which human being has long been exposed. A disaster deprives people of their lives instantly and afflicts
Impacts of severe flood events in Central Viet Nam: Toward integrated flood risk management
 Impacts of severe flood events in Central Viet Nam: Toward integrated flood risk management Bui Duc Tinh, Tran Huu Tuan, Phong Tran College of Economics, Hue University Viet Nam 1. Research problem 2.
HUMAN GEOGRAPHY. By Brett Lucas
 HUMAN GEOGRAPHY By Brett Lucas DEVELOPMENT Overview Economic indicators of development Social indicators of development Demographic indicators of development Economic Indicators Indicators of Development
I Overview of the System and the Basic Statistics [1] General Welfare and Labour
![I Overview of the System and the Basic Statistics [1] General Welfare and Labour](/thumbs/82/85260124.jpg "I Overview of the System and the Basic Statistics [1] General Welfare and Labour") I Overview of the System and the Basic Statistics [1] General Welfare and Labour Population Structure Overview The Population Pyramid in Japan Age 100 or over Age 76: the number of births decreased in
I Overview of the System and the Basic Statistics [1] General Welfare and Labour Population Structure Overview The Population Pyramid in Japan Age 100 or over Age 76: the number of births decreased in
Estimating Internet Access for Welfare Recipients in Australia
 3 Estimating Internet Access for Welfare Recipients in Australia Anne Daly School of Business and Government, University of Canberra Canberra ACT 2601, Australia E-mail: anne.daly@canberra.edu.au Rachel
CONSTITUENCY PROFILE: DUBLIN SOUTH-WEST
 CONSTITUENCY PROFILE: DUBLIN SOUTH-WEST CONTENTS Introduction 2 Glossary 3 Demographics 4 Families 8 Education 10 Employment 12 Households and housing 16 Voting and turnout 20 This profile is based on
GEOGRAPHY 4370, NOVEMBER 2005, MARK SCHEME
 GEOGRAPHY 70, NOVEMBER 005, MARK SCHEME PAPER 1F 1. (a) (i) x 1 marks for accurate plotting & labelling Afghanistan 1 (iii) 1 (iv) x 1 marks for any valid reasons e.g. little water treatment; waste disposal
Populations: an Introduction to Demography. Population Trends In Canada
 Populations: an Introduction to Demography Population Trends In Canada Demography Demography is the study of populations over time and over place. The three major components of demography are: (1) mortality,
Land area: 282 sq km Inhabitants/sq km: 57. Age. Source: Population statistics, SCB Population by age, 2014 Population trends,
 2015 Land area: 282 sq km Inhabitants/sq km: 57 Population by age, 2014 Age 1,2 1,0 0,8 0,6 % Population by age, 2014 Population trends, 2004 2014 Age Percentage distribution Year Population Excess of
Toronto s City #3: A Profile of Four Groups of Neighbourhoods
 Toronto s City #3: A Profile of Four Groups of Neighbourhoods A supplement to the Three Cities in Toronto analysis of trends, focused on City #3, the 40% of the City s neighbourhoods with the lowest incomes
Social vulnerability and climate change in Flood Risk Management in Scotland
 Social vulnerability and climate change in Flood Risk Management in Scotland Leigh Fraser leigh.fraser@sepa.org.uk Senior Policy Officer, Flood Risk Management Planning and Policy Scottish Environment
Mournag, Tunisia. Local progress report on the implementation of the 10 Essentials for Making Cities Resilient ( )
") Mournag, Tunisia Local progress report on the implementation of the 10 Essentials for Making Cities Resilient (2013-2014) Name of focal point: Kamal Alelwy Organization: La ville de Mournag Title/Position:
Mournag, Tunisia Local progress report on the implementation of the 10 Essentials for Making Cities Resilient (2013-2014) Name of focal point: Kamal Alelwy Organization: La ville de Mournag Title/Position:
Updating the ON-Marg for health equity monitoring without the longform
 Updating the ON-Marg for health equity monitoring without the longform census Flora I. Matheson, Centre for Urban Health Solutions. St. Michael s Hospital Kathryn McIsaac, Centre for Urban Health Solutions.
AUGUST THE DUNNING REPORT: DIMENSIONS OF CORE HOUSING NEED IN CANADA Second Edition
 AUGUST 2009 THE DUNNING REPORT: DIMENSIONS OF CORE HOUSING NEED IN Second Edition Table of Contents PAGE Background 2 Summary 3 Trends 1991 to 2006, and Beyond 6 The Dimensions of Core Housing Need 8
We propose the following changes to the Puerto Rico Action Plan under five key categories for your consideration during this public comment period.
 May 25, 2018 Mr. Fernando Gil Enseñat, Esq. Secretary Department of Housing PO Box 21365 San Juan, Puerto Rico 00928-1365 RE: Comments on the PRDOH CDBG-DR Draft Action Plan Dear Secretary Gil Enseñat:
INDIGENOUS DARWIN AND THE REST OF THE NORTHERN TERRITORY
 POPULATION STUDIES RESEARCH BRIEF ISSUE Number 2009026 School for Social and Policy Research 2008 Population Studies Group School for Social and Policy Research Charles Darwin University Northern Territory
REPLIES OF THE GOVERNMENT OF ALBANIA TO THE QUESTIONNAIRE OF THE INDEPENDENT EXPERT ON EXTREME POVERTY
 REPLIES OF THE GOVERNMENT OF ALBANIA TO THE QUESTIONNAIRE OF THE INDEPENDENT EXPERT ON EXTREME POVERTY Social protection of categories of persons in need is carried out through three core programmes, aiming
1981 Population Census Preliminary Report on Labour Force Composition
 1981 Population Census Preliminary Report on Labour Force Composition Section 1 - Introduction Section 2 * Broad conclusions Section 3 * Detailed findings (i) Labour force participation and unemployment
New Bru nswick Regiona l Prof i les H IGHLIGHTS AN D U PDATES. Northeast Economic Region
 New Bru nswick Regiona l Prof i les H IGHLIGHTS AN D U PDATES Northeast Economic Region New Brunswick Regional Profiles: Highlights and Updates Northeast Economic Region Province of New Brunswick PO 6000,
Tartu City Government
 Tartu in figures Symbols Arms of Tartu Flag of Tartu Logo of Tartu Tartu City Day June 29 Tartu is the second largest city in Estonia. Tartu first mentioned in written 1,030 The length of the River Emajõgi
Birth Age
 Social security system supporting people throughout their lifetime Birth Age 6 12 15 18 20 40 50 60 70 75 Before school School period Child-raising/working period After retirement [Health/medical care]
Emergency Management. December 16, 2010
 Applications of Hazus-MH for Emergency Management December 16, 2010 What is Hazus-MH? Free ArcGIS extension Facilitates a risk-based approach to mitigation Identifies and visually displays hazards and
Page 1. Rebuilding after Hurricane Charley: A Look at which Homes Still Need Repairs
 Page 1 Rebuilding after Hurricane Charley: A Look at which Homes Still Need Repairs By: Lea Schlanger Mentor: Dr. Beverly Ward July 24, 2008 Page 2 Introduction: On August 13, 2004 (Friday the 13 th ),
MATRIX OF STRATEGIC VISION AND ACTIONS TO SUPPORT SUSTAINABLE CITIES
 Urban mission and overall strategy objectives: To promote sustainable cities and towns that fulfill the promise of development for their inhabitants in particular, by improving the lives of the poor and
Lake County. Government Finance Study. Supplemental Material by Geography. Prepared by the Indiana Business Research Center
 County Government Finance Study Supplemental Material by Geography Prepared by the Indiana Business Research www.ibrc.indiana.edu for Sustainable Regional Vitality www.iun.edu/~csrv/index.shtml west Indiana
The Norwegian Economy Lecture in Norwegian Life and Society
 1 The Norwegian Economy Lecture in Norwegian Life and Society Joakim Blix Prestmo Economist Reseacher Reseach Department, Statistics Norway 1 Outline of today's lecture a. Norway in figures b. Why is Norway
The Norwegian State Housing Bank. Summary of Activities
 The Norwegian State Housing Bank Summary of Activities February 2009 2 1. Objectives and measures The vision for the Norwegian housing policy is adequate and secure housing for all. This will be achieved
Why is understanding our population forecasts important?
 % Population Growth per annum Population Why is understanding our population forecasts important? Understanding the ACT s population growth and its demographic trends, is fundamental to longterm strategic
REDUCING DISASTER RISK a challenge for development
 Reducing Disaster Risk: a challenge for development REDUCING DISASTER RISK a challenge for development A Global Report from : United Nations Development Programme Bureau for Crisis Prevention and Recovery
Disaster Risk Management in Nepalese Development Plans
 Learning Workshop on Disaster Risk Management in Nepal GoN, Ministry of Home Affairs, NASC and UNDP 24-25 December 2015 Disaster Risk Management in Nepalese Development Plans Rabi S. Sainju 1 Presentation
Toward Active Participation of Women as the Core of Growth Strategies. From the White Paper on Gender Equality Summary
 Toward Active Participation of Women as the Core of Growth Strategies From the White Paper on Gender Equality 2013 Summary Cabinet Office, Government of Japan June 2013 The Cabinet annually submits to
Shifts in Non-Income Welfare in South Africa
 Shifts in Non-Income Welfare in South Africa 1993-2004 DPRU Policy Brief Series Development Policy Research unit School of Economics University of Cape Town Upper Campus June 2006 ISBN: 1-920055-30-4 Copyright
Tartu in figures 2006
 Tartu in figures 2006 Sümbolid Arms of Tartu Flag of Tartu Logo of Tartu Tartu City Day June 29 Population Number of inhabitants (according to Inhabitants Registry Office) 1.01.2003 100,912 1.01.2004 100,482
Land area: 283 sq km Inhabitants/sq km: 52. Age. Source: Population statistics, SCB Population by age, 2010 Population trends,
 2011 Land area: 283 sq km Inhabitants/sq km: 52 Population by age, 2010 Age 1,2 1,0 0,8 0,6 % Population by age, 2010 Population trends, 2000 2010 Age Percentage distribution Year Population Excess of
ECONOMICS AND STATISTICS BRANCH DEPARTMENT OF FINANCE
 ECONOMICS AND STATISTICS BRANCH DEPARTMENT OF FINANCE The Branch is responsible for meeting the broad macroeconomic and statistical requirements of Government and its agencies. As part of this mandate,
Human Development Indices and Indicators: 2018 Statistical Update. Dominica
 Human Development Indices and Indicators: 2018 Statistical Update Briefing note for countries on the 2018 Statistical Update Introduction Dominica This briefing note is organized into ten sections. The
County of Kaua'i Multi-Hazard Mitigation and Resilience Plan, 2015 Update
 Executive Summary: County of Kaua'i Multi-Hazard Mitigation and Resilience Plan Introduction to the Mitigation and Resilience Plan In this third plan, the longer term needs for sustaining mitigation efforts
ECONOMICALLY ACTIVE POPULATION: EMPLOYMENT, UNEMPLOYMENT, UNDEREMPLOYMENT
 UN-ESCWA Expert Group Meeting on Labour Statistics (Beirut, Lebanon, 29-30 June 2011) Session 1: ECONOMICALLY ACTIVE POPULATION: EMPLOYMENT, UNEMPLOYMENT, UNDEREMPLOYMENT DECENT WORK MEASUREMENT FRAMEWORK
Human Development Indices and Indicators: 2018 Statistical Update. Nigeria
 Human Development Indices and Indicators: 2018 Statistical Update Briefing note for countries on the 2018 Statistical Update Introduction Nigeria This briefing note is organized into ten sections. The
Land area: 489 sq km Inhabitants/sq km: 65. Age. Source: Population statistics, SCB Population by age, 2015 Population trends,
 2016 Land area: 489 sq km Inhabitants/sq km: 65 Population by age, 2015 Age 1,0 0,8 0,6 % Population by age, 2015 Population trends, 2005 2015 Age Percentage distribution Year Population Excess of Net
MAIN FINDINGS OF THE DECENT WORK COUNTRY PROFILE ZAMBIA. 31 January 2013 Launch of the Decent Work Country Profile
 MAIN FINDINGS OF THE DECENT WORK COUNTRY PROFILE ZAMBIA Griffin Nyirongo Griffin Nyirongo 31 January 2013 Launch of the Decent Work Country Profile OUTLINE 1. Introduction What is decent work and DW Profile
Monitoring the Performance of the South African Labour Market
 Monitoring the Performance of the South African Labour Market An overview of the South African labour market for the Year Ending 2012 8 October 2012 Contents Recent labour market trends... 2 A labour market
A Collection of Statistical Data for Huron County and its Census Subdivisions
 A Collection of Statistical Data for and its Census Subdivisions The following information is a collection of statistical data describing key elements (language, labour market, income levels, migration
Wyoming Economic and
 Wyoming Economic and Demographic Data Tools for your Toolbox Presented to: Wyoming Association of Municipal i Clerks and Treasurers (WAMCAT) 2011 Region VIII & WAMCAT Winter Workshop Jackson, Wyoming January
WESTERN NEW YORK LAW CENTER
 WESTERN NEW YORK LAW CENTER Discriminatory Auto Insurance Practices in Western New York An examination of the impact non-driving and socioeconomic factors have on Western New York Drivers Auto Insurance
Sustainable Recovery and Reconstruction Framework (SURRF)
") Sustainable Recovery and Reconstruction Framework (SURRF) Saroj Kumar Jha Program Manager Global Facility for Disaster Reduction and Recovery The World Bank Group, Washington DC 1 The definitional challenge
Sustainable Recovery and Reconstruction Framework (SURRF) Saroj Kumar Jha Program Manager Global Facility for Disaster Reduction and Recovery The World Bank Group, Washington DC 1 The definitional challenge
Human Development Indices and Indicators: 2018 Statistical Update. Russian Federation
 Human Development Indices and Indicators: 2018 Statistical Update Briefing note for countries on the 2018 Statistical Update Introduction This briefing note is organized into ten sections. The first section
FLOOD RISK MANAGEMENT GUIDELINES FOR LOCATION OF NEW FACILITIES FUNDED BY ALBERTA INFRASTRUCTURE
 FLOOD RISK MANAGEMENT GUIDELINES FOR LOCATION OF NEW FACILITIES FUNDED BY ALBERTA INFRASTRUCTURE June 2017 Flood Risk Management GUIDELINES for Location of New Facilities Funded by Alberta Infrastructure
Coping with Population Aging In China
 Coping with Population Aging In China Copyright 2009, The Conference Board Judith Banister Director of Global Demographics The Conference Board Highlights Causes of Population Aging in China Key Demographic
Women s pay and employment update: a public/private sector comparison
 Women s pay and employment update: a public/private sector comparison Report for Women s Conference 01 Women s pay and employment update: a public/private sector comparison Women s employment has been
STEP 7. Before starting Step 7, you will have
 STEP 7 Gap analysis Handing out mosquito nets in Bubulo village, Uganda Photo credit: Geoff Sayer/Oxfam Step 7 completes the gap-analysis strand. It should produce a final estimate of the total shortfall
Human Development Indices and Indicators: 2018 Statistical Update. Brazil
 Human Development Indices and Indicators: 2018 Statistical Update Briefing note for countries on the 2018 Statistical Update Introduction Brazil This briefing note is organized into ten sections. The first