April 6, Table of contents. Global Inflation Outlook
|
|
|
- Mercy Parks
- 6 years ago
- Views:
Transcription
1 Global Inflation Outlook Global Inflation Outlook April 6, 2018 This document contains a selection of charts that are the output of Fulcrum s quantitative toolkit for monitoring global inflation trends. All of our forecasts and projections are the output of formal econometric models that have been developed in the academic literature, and therefore contain little input from direct judgement. All charts and models are up to date with available data up to April 6, a Table of contents Inflation 2 Consumer Prices Inflation Forecasts Producer and Import Prices Inflation Forecasts Stock and Watson Consumer Prices Trend Inflation United States: PCE Trend Inflation by Components United States: Wage Trend Inflation Market Measures of Inflation Expectations Global Oil Market 23 a More details of the specific models, and intra-month updates, are available upon request. April 6,
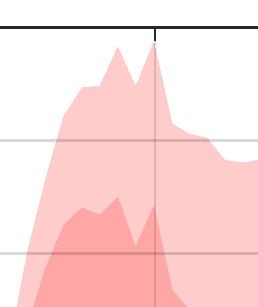
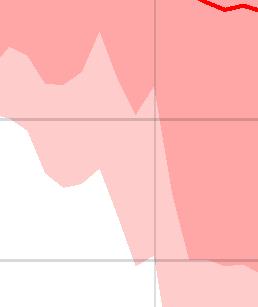
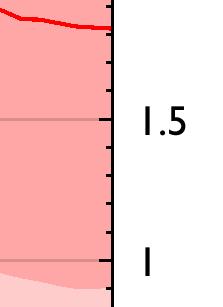
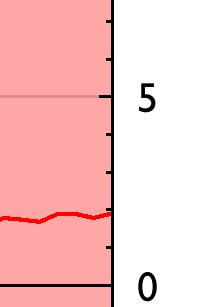
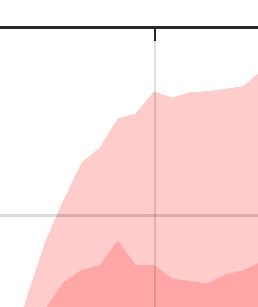
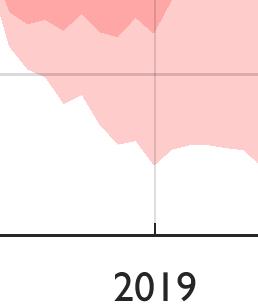
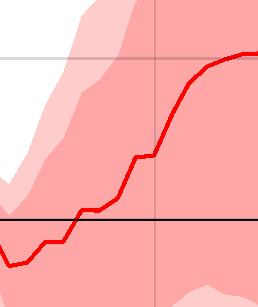
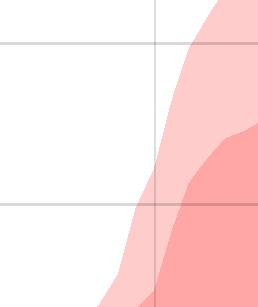
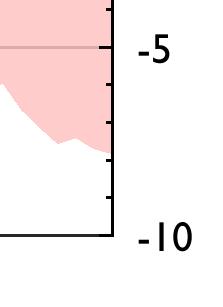
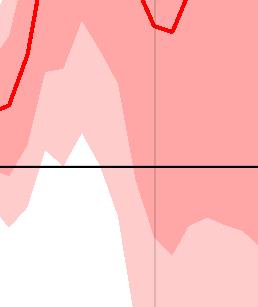
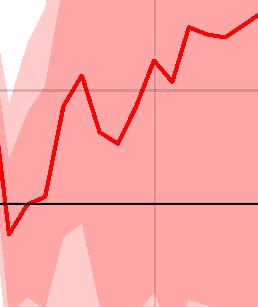
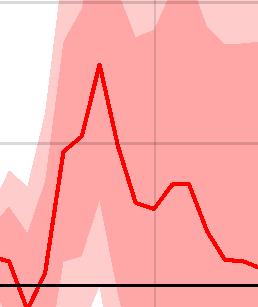
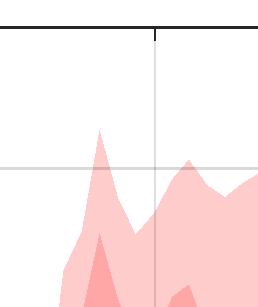
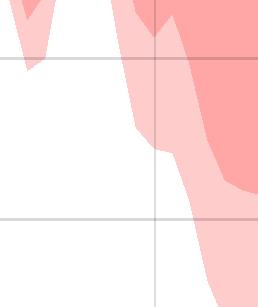
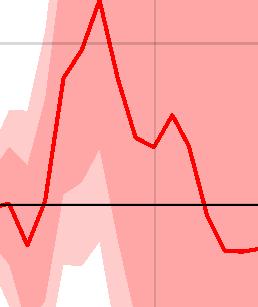
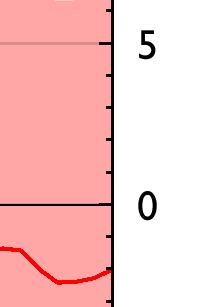
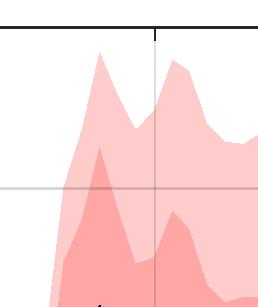
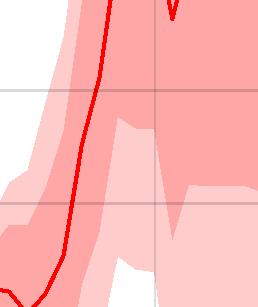
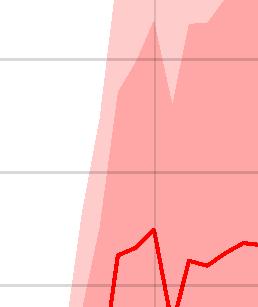
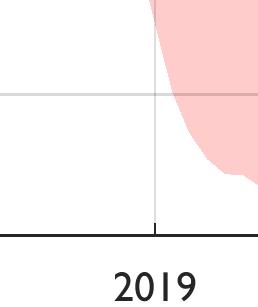
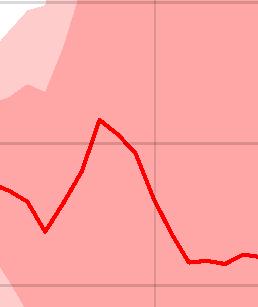
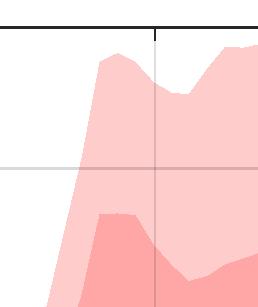
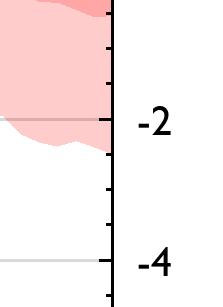
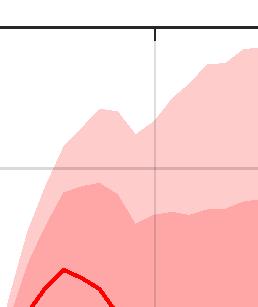
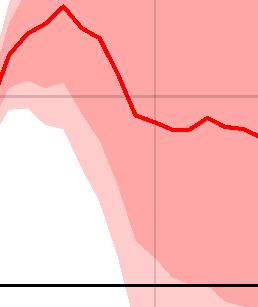
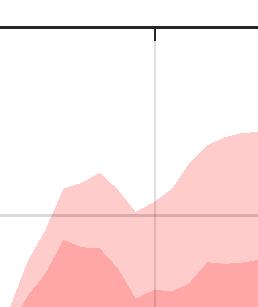
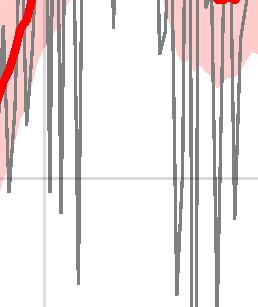
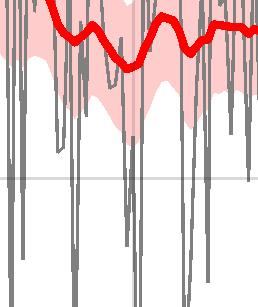
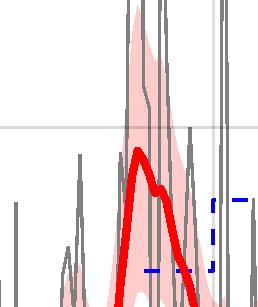
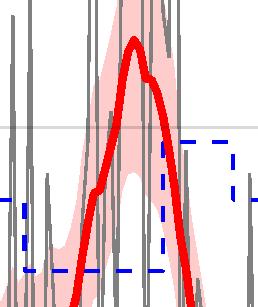
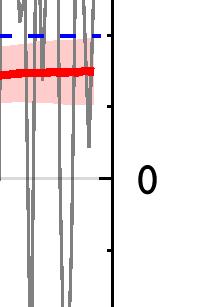
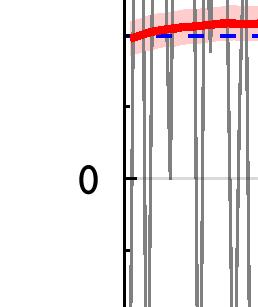
2 Inflation Consumer Prices Inflation Forecasts Fulcrum short-term inflation forecasting models The following charts present the equal weighted average of the inflation forecasts estimated using two models: a Bayesian Vector Autoregressive Model (see following paragraph) and an Unobserved Components model (see next section). For each country, the BVAR model includes: headline inflation, core inflation, the oil price, the trade weighted exchange rate, import prices inflation, producer prices inflation and non-energy commodity prices inflation. We use Minnesota priors, as in Doan, Litterman, and Sims (1983), to shrink the coefficients of the BVAR towards a more parsimonious specification. When available, the charts present the market forecast as implied by the inflation swaps. For the UK and the US, inflation swaps are linked respectively to RPI and CPI inflation. Therefore, we compute market implied forecasts for CPI and PCE inflation conditioning on the paths for RPI and CPI implied by the inflation swaps. How to read the graphs The following charts display the predictive distribution of inflation for the next two years in the form of fan charts. The solid red line represents the most recent median forecast of inflation and the dark and the light red areas around it represent respectively the 68% and the 90% confidence bands. The dashed black line shows the market forecast. The blue dots represent the forecasts published by the policy makers. Whenever these are expressed as annual average forecasts, the comparable annual numbers produced by our models are displayed as red dots. Notes and data definitions Headline inflation: USA: PCE deflator; Euro Area: HICP inflation; Canada: CPI; Japan: CPI excluding fresh food; Sweden: CPI; UK: CPI. Core inflation: USA: PCE excluding food and energy; Euro Area: HICP excluding Energy, Food, Alcohol and Tobacco; Canada: CPI excluding food and energy; Japan: CPI excluding food, beverages and energy; Sweden: CPI with fixed interest rates excluding energy; UK: CPI excluding energy, food, alcoholic beverages and tobacco. The USA model includes CPI and core CPI inflation as additional indicators. The UK model includes RPI inflation as an additional indicator. We exclude VAT increases by assuming full and immediate pass-through on the month of implementation. Sources: Fulcrum calculations based on Haver Analytics data. April 6,

 Note:")

, Euro Area,")


3 Inflation Forecasts from Bayesian Model Averaging (% 12 month change) Note: Advanced economies is the PPP weighted average of US (PCE), Euro Area, UK, Japan, Canada, Sweden and Norway. World is the PPP weighted average of the former economies and China. April 6,


4 Inflation Forecasts from Bayesian Model Averaging (% 12 month change) Note: The blue dots represent the forecasts published by the policy makers. The dashed black line shows the market forecast. April 6,


5 Inflation Forecasts from Bayesian Model Averaging (% 12 month change) Note: The blue dots represent the forecasts published by the policy makers. The dashed black line shows the market forecast. April 6,


6 Inflation Forecasts from Bayesian Model Averaging (% 12 month change) Note: The blue dots represent the forecasts published by the policy makers. The dashed black line shows the market forecast. April 6,
7 Producer and Import Prices Inflation Forecastss Fulcrum short-term inflation forecasting models The following charts present the inflation forecasts estimated using the Bayesian Vector Autoregressive Model described in the previous section. How to read the graphs The following charts display the predictive distribution of inflation for the next two years in the form of fan charts. The solid red line represents the most recent median forecast of inflation and the dark and the light red areas around it represent respectively the 68% and the 90% confidence bands. Sources: Fulcrum calculations based on Haver Analytics data. April 6,


 Note:")


8 Inflation Forecasts from a Bayesian Vector Autoregressive Model (% 12 month change) Note: Advanced economies is the PPP weighted average of US, Euro Area, UK, Japan, Canada, Sweden and Norway. World is the PPP weighted average of the former economies and China. April 6,


9 Inflation Forecasts from a Bayesian Vector Autoregressive Model (% 12 month change) April 6,


10 Inflation Forecasts from a Bayesian Vector Autoregressive Model (% 12 month change) April 6,


11 Inflation Forecasts from a Bayesian Vector Autoregressive Model (% 12 month change) April 6,
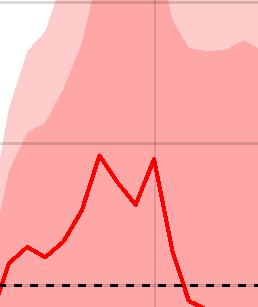
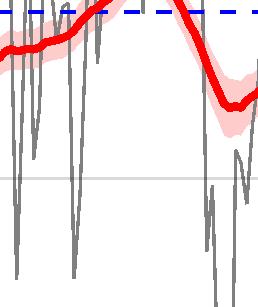
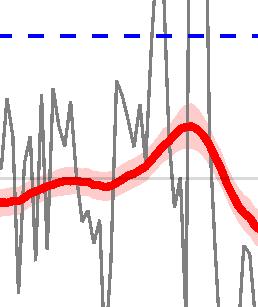
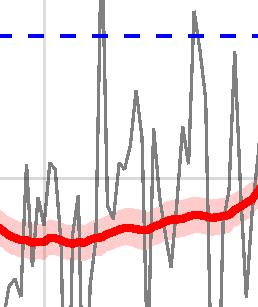
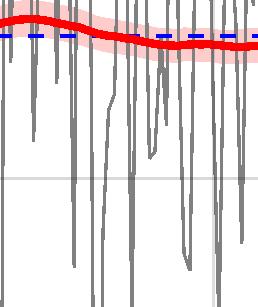
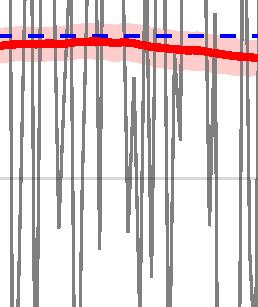
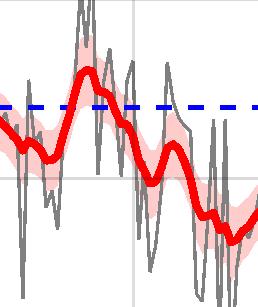
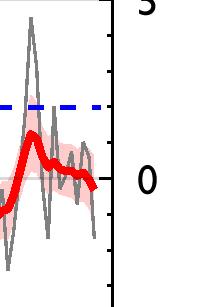
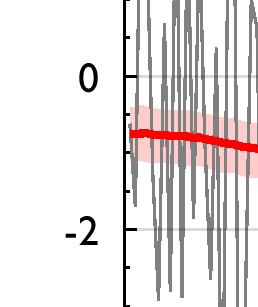
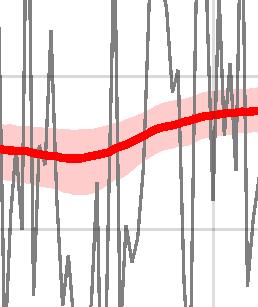
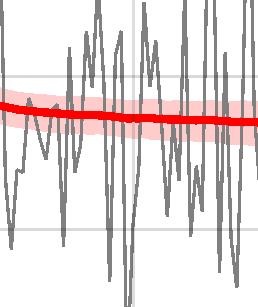
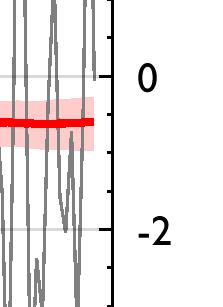
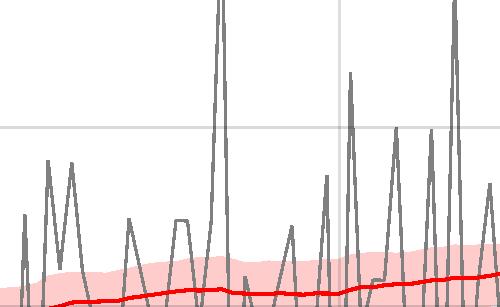
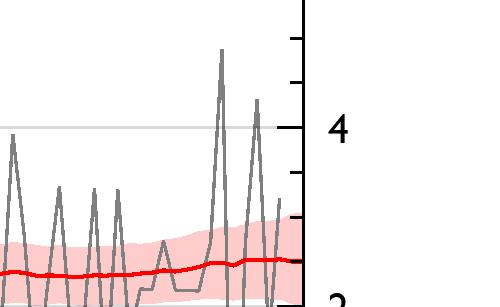
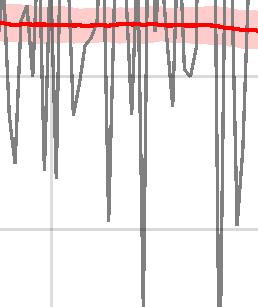
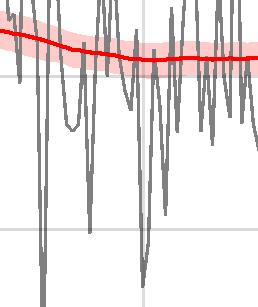
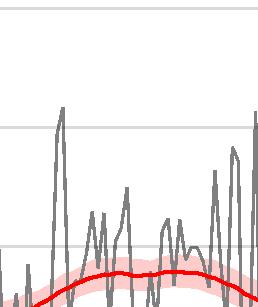
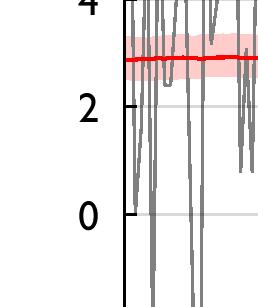
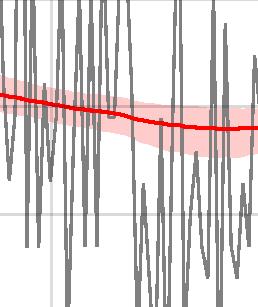
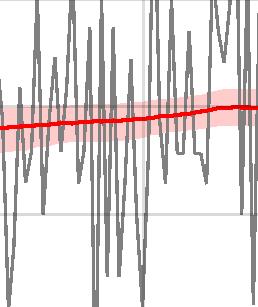
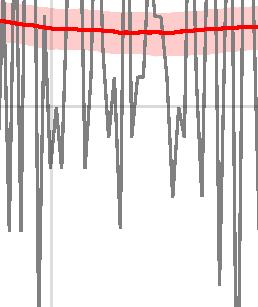
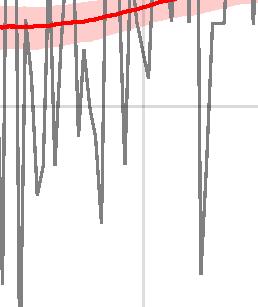
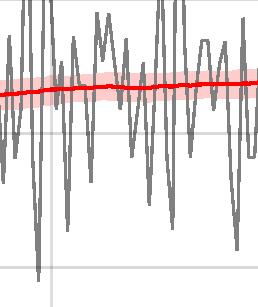
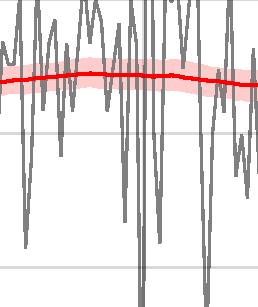
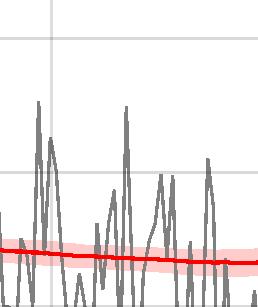
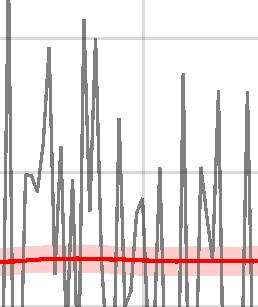
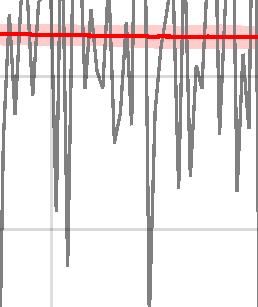
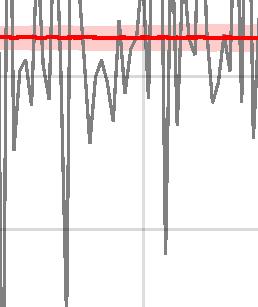
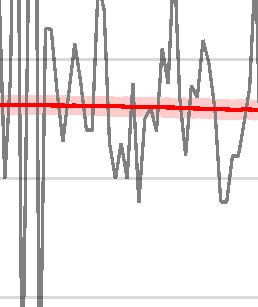
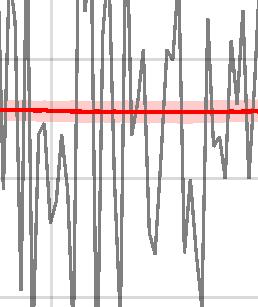
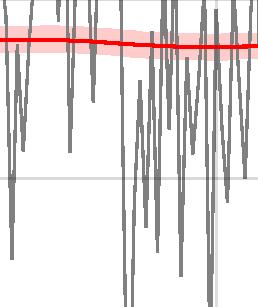
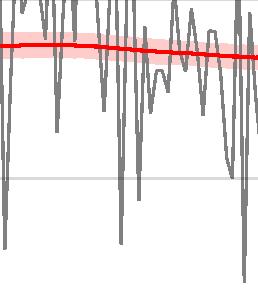
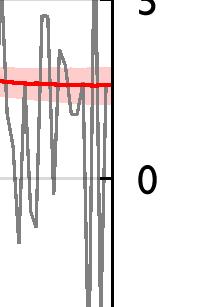
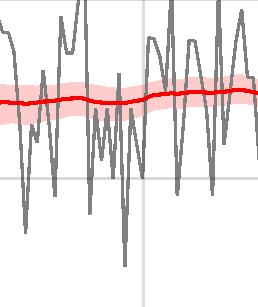
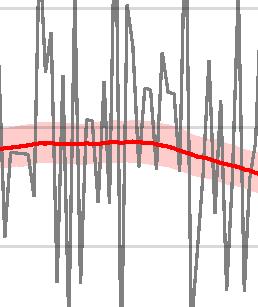
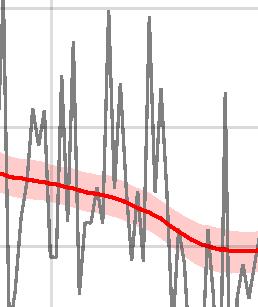
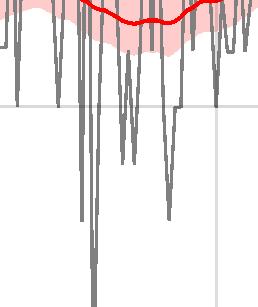
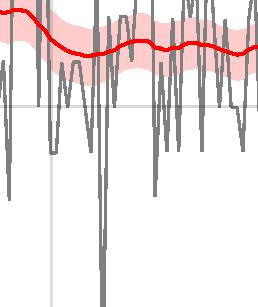
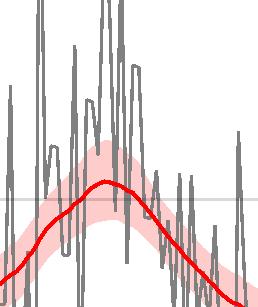
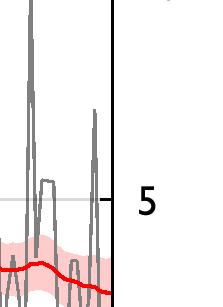
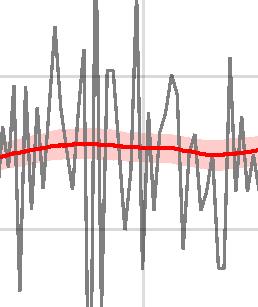
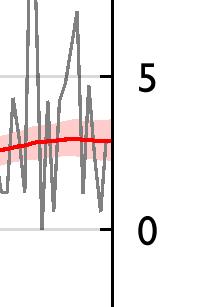
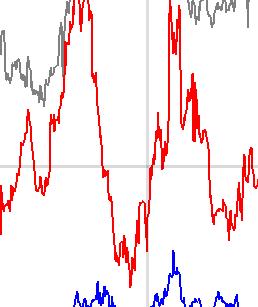
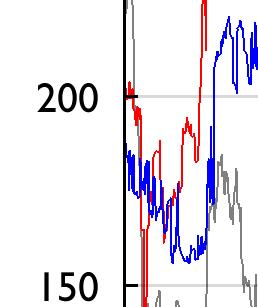
12 Stock and Watson Consumer Prices Trend Inflation Fulcrum trend inflation models The following charts present our estimates of trend inflation. The model splits inflation into a persistent component ( trend ) and a purely transitory component ( noise ), which reverts within one month. Therefore, the trend captures long-term as well as cyclical influences and can be thought of as a measure of core inflation derived from the time series behaviour of inflation. The estimates are produced using a version of the Unobserved Components model with Stochastic Volatility and Outlier detection (UCSVO) introduced in Stock and Watson (2007, 2016). The main difference with Stock and Watson (2016) lies in the modelling of outliers. Rather than using discrete probabilities of outliers, we use a fat-tailed distribution for the variance of the noise component, in line with Jacquier et al. (2004). When possible, we use the multivariate version of the model (M-UCSVT), which models the main subcomponents of inflation independently and aggregates the trends using the official weights. Otherwise, we use the univariate model (UCSVT), which models directly the headline inflation series. How to read the graphs In the following graphs, the grey line represents the monthly inflation rate (% MoM Ann.). The solid red line represents the estimate of trend inflation. The red area represents the 68% confidence band around it. Data definition USA: PCE deflator; Euro Area: HICP inflation; China: CPI; Japan: CPI excluding fresh food; UK: CPI; Canada: CPI; Sweden: CPI; Norway: CPI; Switzerland: CPI. Sources: Fulcrum calculations based on Haver Analytics data. April 6,


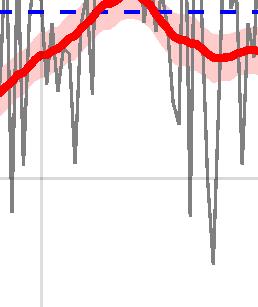
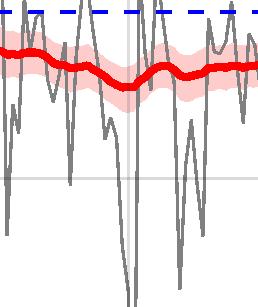

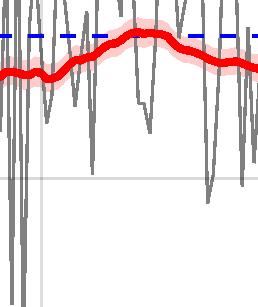
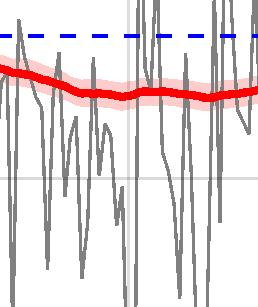
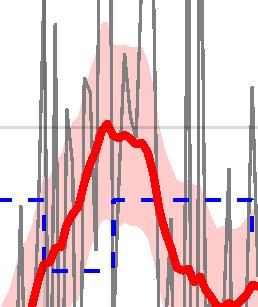
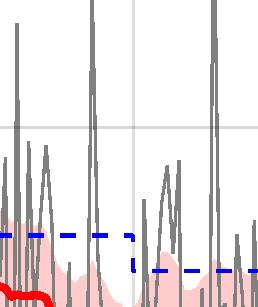
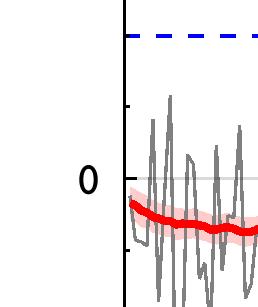
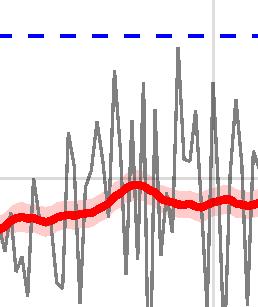
13 Stock and Watson trend inflation April 6,


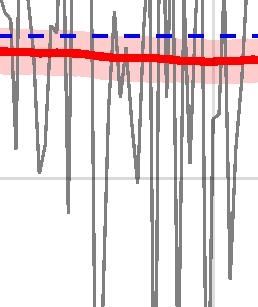
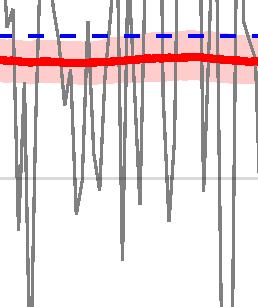
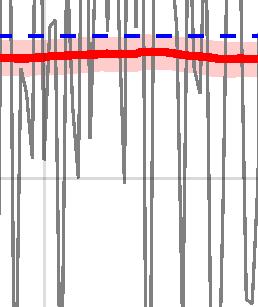
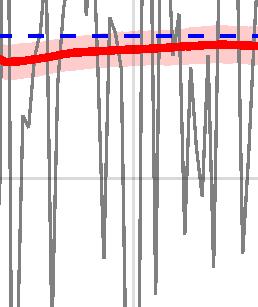
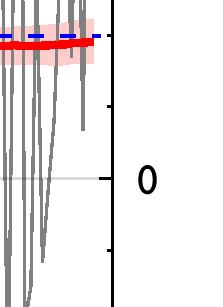
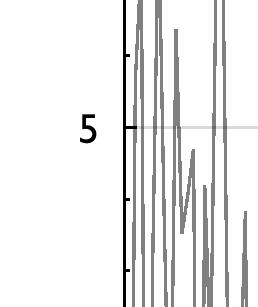
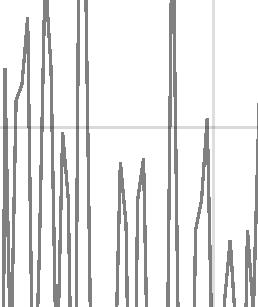
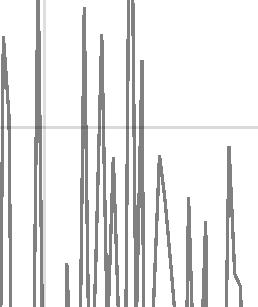
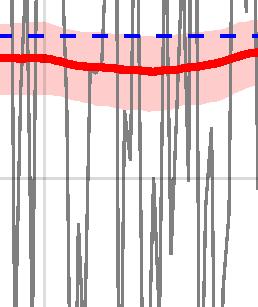
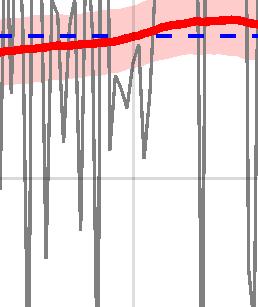
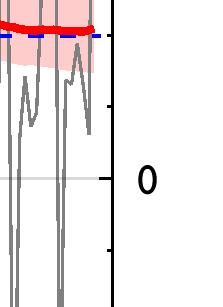
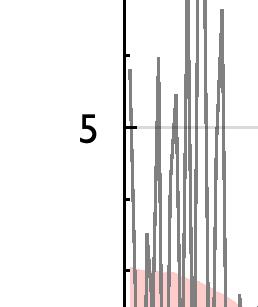
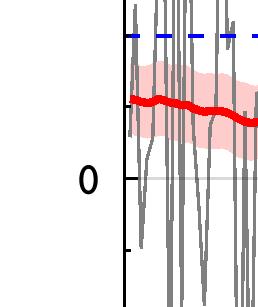
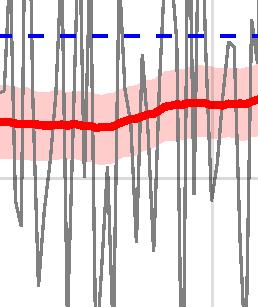
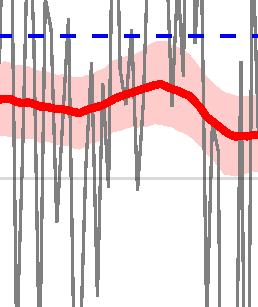
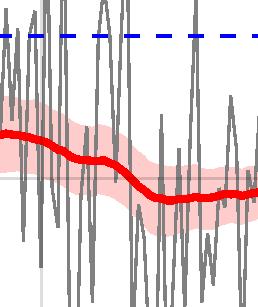
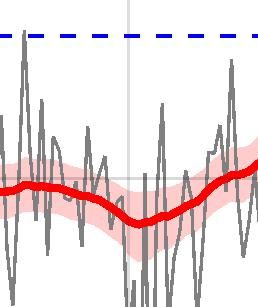
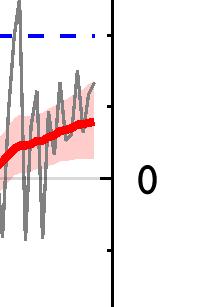
14 Stock and Watson trend inflation April 6,
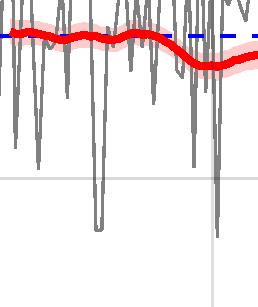
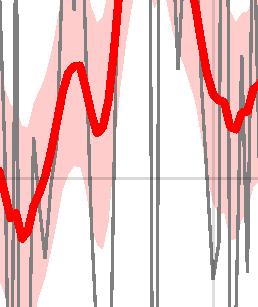
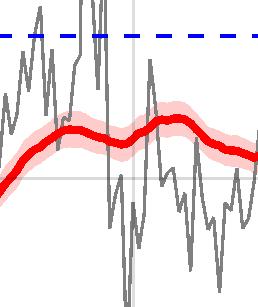
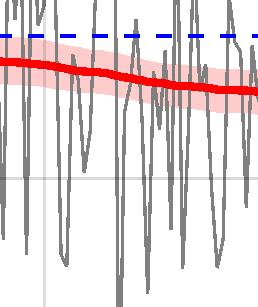
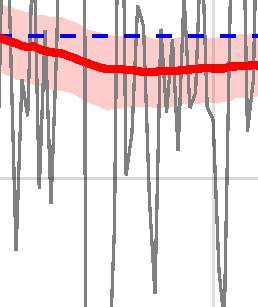
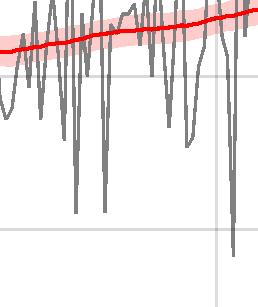
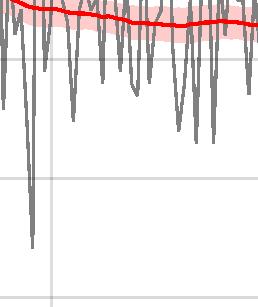
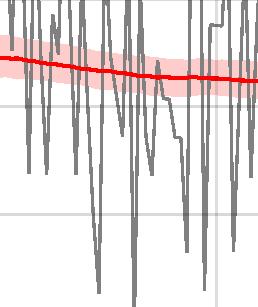
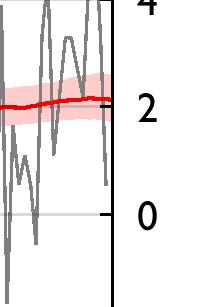
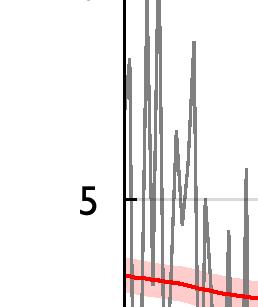
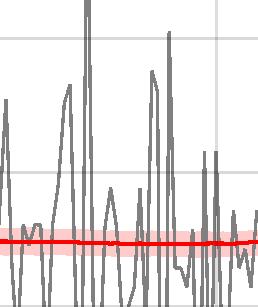
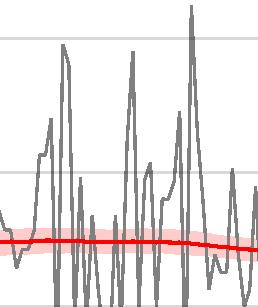
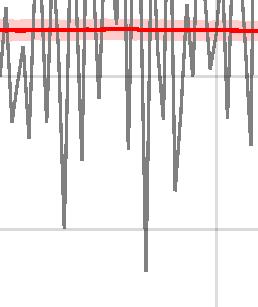
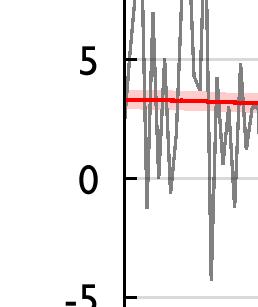
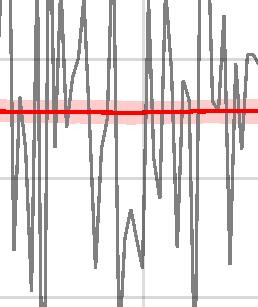
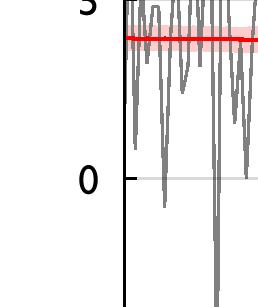
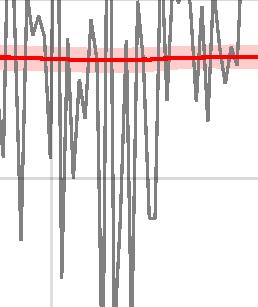
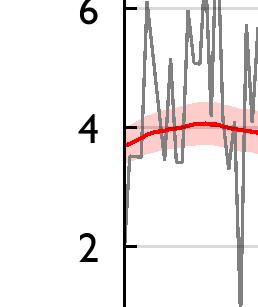
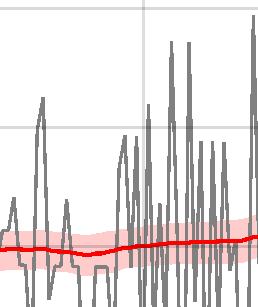
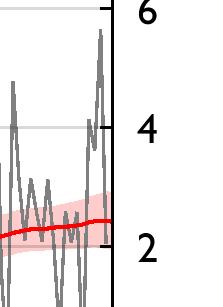
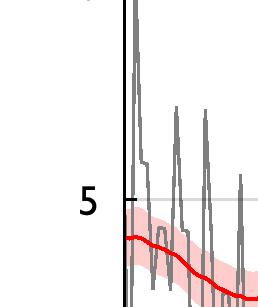
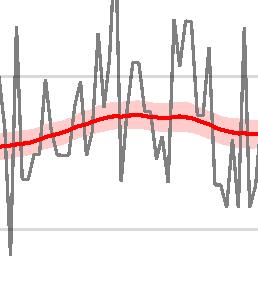
15 United States: PCE Trend Inflation by Components Fulcrum trend inflation models The following charts present our estimates of trend inflation for the four main subcomponents of PCE inflation in the United States. The estimates are produced using the statistical model described in the previous section (UCSVT). How to read the graphs In the following graphs, the grey line represents the monthly inflation rate (% MoM Ann.). The solid red line represents the estimate of trend inflation. The red area represents the 68% confidence band around it. Sources: Fulcrum calculations based on Haver Analytics data. April 6,


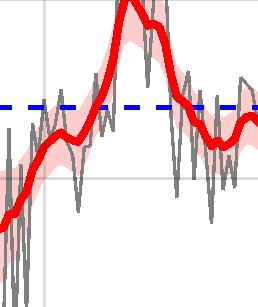
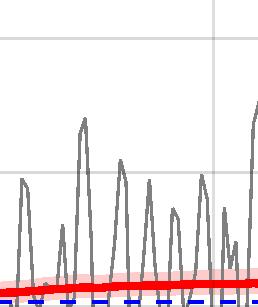
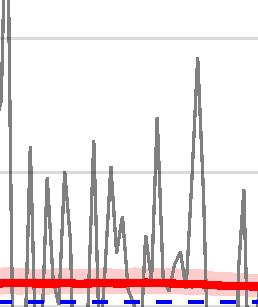
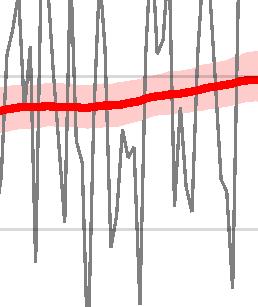

16 US PCE trend inflation April 6,
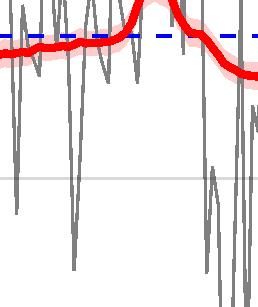
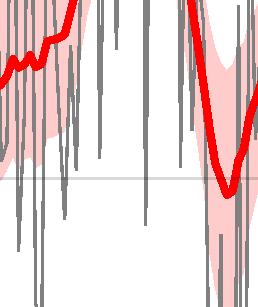
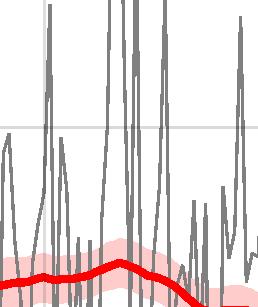
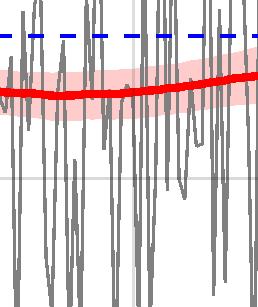
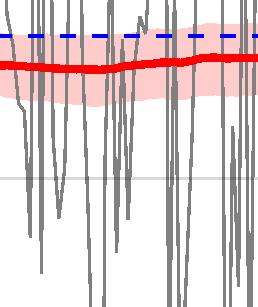
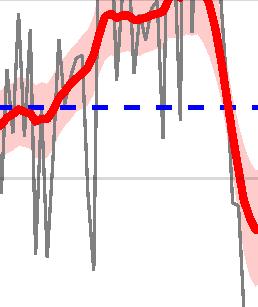
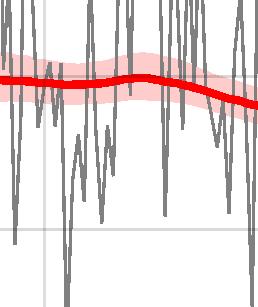
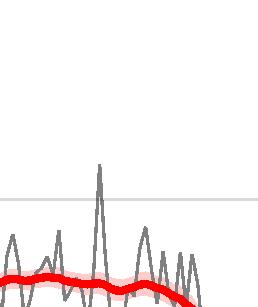
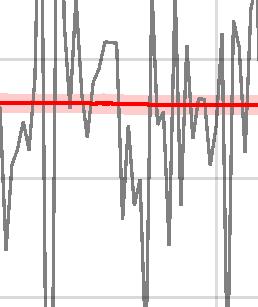
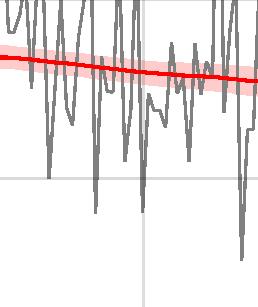
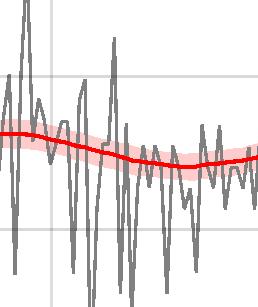
17 United States: Wage Trend Inflation Fulcrum wage inflation model The following charts present our estimates of wage trend inflation in the United States. The estimates are produced using the statistical model described in the previous section (UCSVT). How to read the graphs In the following graphs, the grey line represents the monthly wage inflation rate (% MoM Ann.). The solid red line represents the estimate of wage trend inflation. The red area represents the 68% confidence band around it. Sources: Fulcrum calculations based on Haver Analytics data. April 6,


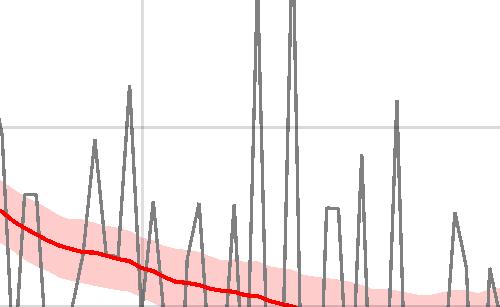
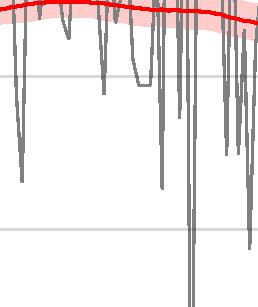
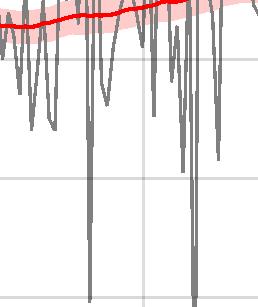
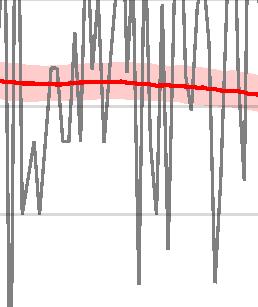
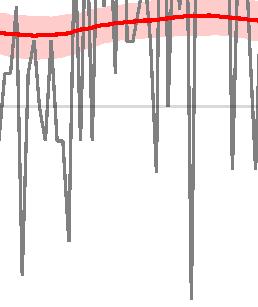
18 US Wage Trend Inflation April 6,


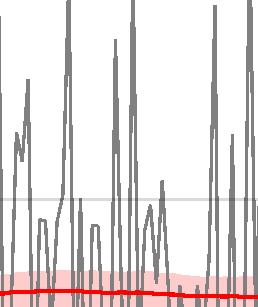

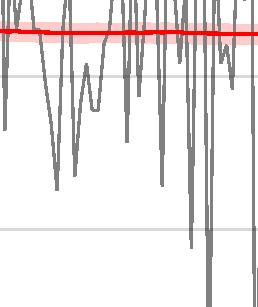
19 US Wage Trend Inflation April 6,


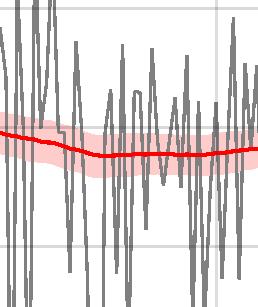
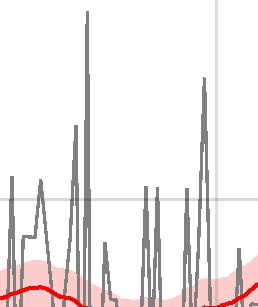
20 US Wage Trend Inflation April 6,
21 Market Measures of Inflation Expectations Definitions Five year inflation-linked swap rates The swap rates are linked to CPI inflation in the US, HICP inflation in the Euro Area and RPI inflation in the UK. The horizontal dashed line represents the policy maker s target. In the case of the US and the UK we have added 0.5% and 0.6% to reflect the average bias of US CPI and UK RPI over the inflation measures targeted by the Federal Reserve and the Bank of England (respectively PCE inflation and CPI inflation). Inflation protection The inflation protection is an annual inflation cap of 4% over 5 years. Deflation protection The deflation protection is an annual inflation floor of 0% over 5 years. Developments should be interpreted with caution due to limited market liquidity. Sources: Fulcrum calculations based on Bloomberg data. April 6,

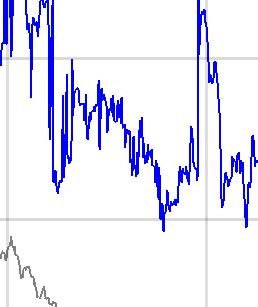
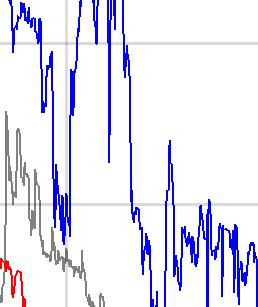


22 Market Inflation Expectations (derived from swaps) April 6,
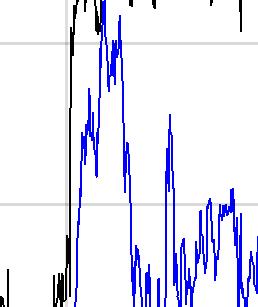
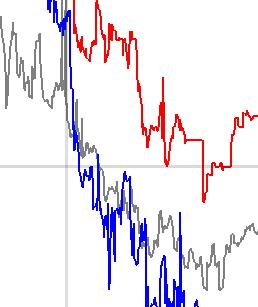
23 Global Oil Market The following charts present forecasts of the oil price and its drivers estimated using a modified version of the VAR model of Kilian and Murphy (2014). This VAR uses four variables: the real price of oil, global crude oil production, global crude oil inventories and the index of real economic activity developed in Kilian (2009). For our version, we use Minnesota priors as in Doan et al. (1983) to shrink the coefficients of the BVAR towards a more parsimonious specification. How to read the graphs: The first chart shows the predictive distribution of Brent crude oil in the form of a fan chart. The solid black line represents the actual and forecasted Brent crude oil price. The dark and the light grey areas around it represent respectively the 68% and the 90% confidence bands. We also show the evolution of WTI crude oil prices and the Brent-WTI spread. The dashed lines show the futures prices. The remaining charts show the evolution of the three additional variables included in the model. a Notes and data definitions: Crude oil prices: Nominal spot Brent crude oil prices. Prior to 1985 we use spot oil price for West Texas Intermediate (WTI). To deflate the nominal spot oil price, we use the U.S. consumer price index for all urban consumers. Whenever necessary, we use the forecast of the CPI from the previous section. Crude oil production: Monthly world oil production data measured in thousands of barrels of oil per day were obtained from the U.S. Energy Information Administration s (EIA) Monthly Energy Review. For the figure, we plot petroleum (i.e. crude oil and refined products) production from EIA, Energy Intelligence, and OPEC. Crude oil inventories: We obtain an estimate for global inventories as in Kilian and Murphy (2012) by multiplying the U.S. crude oil inventories by the ratio of OECD inventories of crude petroleum and petroleum products to U.S. inventories of petroleum and petroleum products. Index of real economic activity: Cost of international shipping deflated by the U.S. CPI and then reported in deviations from a linear trend, as in Kilian (2009). b Sources: Fulcrum calculations based on Haver Analytics and Bloomberg data. a We actually show various estimates of global petroleum production, as opposed to global crude oil production. b This is downloaded from Lutz Kilian s website: lkilian/paperlinks.html. To nowcast the most recent values, we deflate and de-trend the Baltic Dry Index. April 6,


24 Oil Market Note: The dashed lines in the first chart show the futures prices. April 6,
25 References Doan, T., R. B. Litterman, and C. A. Sims (1983): Forecasting and Conditional Projection Using Realistic Prior Distributions, NBER Working Papers 1202, National Bureau of Economic Research, Inc. Jacquier, E., N. G. Polson, and P. E. Rossi (2004): Bayesian analysis of stochastic volatility models with fat-tails and correlated errors, Journal of Econometrics, 122, Kilian, L. (2009): Not All Oil Price Shocks Are Alike: Disentangling Demand and Supply Shocks in the Crude Oil Market, American Economic Review, 99, Kilian, L. and D. P. Murphy (2014): The Role Of Inventories And Speculative Trading In The Global Market For Crude Oil, Journal of Applied Econometrics, 29, Stock, J. H. and M. W. Watson (2007): Why Has U.S. Inflation Become Harder to Forecast? Journal of Money, Credit and Banking, 39, (2016): Core Inflation and Trend Inflation, Review of Economics and Statistics, 98, April 6,
26 Disclaimer This material is for your information only and is not intended to be used by anyone other than you. It is directed at professional clients and eligible counterparties only and is not intended for retail clients. The information contained herein should not be regarded as an offer to sell or as a solicitation of an offer to buy any financial products, including an interest in a fund, or an official confirmation of any transaction. Any such offer or solicitation will be made to qualified investors only by means of an offering memorandum and related subscription agreement. The material is intended only to facilitate your discussions with Fulcrum Asset Management as to the opportunities available to our clients. The given material is subject to change and, although based upon information which we consider reliable, it is not guaranteed as to accuracy or completeness and it should not be relied upon as such. The material is not intended to be used as a general guide to investing, or as a source of any specific investment recommendations, and makes no implied or express recommendations concerning the manner in which any client s account should or would be handled, as appropriate investment strategies depend upon client s investment objectives. Funds managed by Fulcrum Asset Management LLP are in general managed using quantitative models though, where this is the case, Fulcrum Asset Management LLP can and do make discretionary decisions on a frequent basis and reserves the right to do so at any point. Past performance is not a guide to future performance. Future returns are not guaranteed and a loss of principal may occur. Fulcrum Asset Management LLP is authorised and regulated by the Financial Conduct Authority of the United Kingdom (No: ) and incorporated as a Limited Liability Partnership in England and Wales (No: OC306401) with its registered office at Marble Arch House, 66 Seymour Street, London, W1H 5BT. Fulcrum Asset Management LP is a wholly owned subsidiary of Fulcrum Asset Management LLP incorporated in the State of Delaware, operating from 350 Park Avenue, 13th Floor New York, NY Fulcrum Asset Management LLP. All rights reserved. April 6,
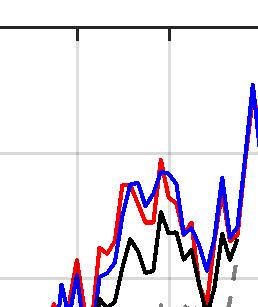
Figure 1: Underlying Activity Growth (% MoM Ann.) for Global Aggregates
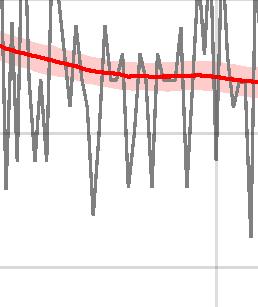
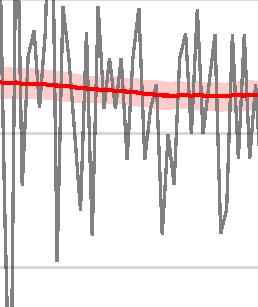
 for Global Aggregates") Figure 1: Underlying Activity Growth (% MoM Ann.) for Global Aggregates World Advanced Economies Emerging Market Economies Notes: The black dashed line represents the model s estimate of long-run growth.
Figure 1: Underlying Activity Growth (% MoM Ann.) for Global Aggregates World Advanced Economies Emerging Market Economies Notes: The black dashed line represents the model s estimate of long-run growth.
Figure 1: Underlying Activity Growth (% MoM Ann.) for Global Aggregates
 for Global Aggregates") Figure 1: Underlying Activity Growth (% MoM Ann.) for Global Aggregates World Advanced Economies Emerging Market Economies Notes: The black dashed line represents the model s estimate of long-run growth.
Figure 1: Underlying Activity Growth (% MoM Ann.) for Global Aggregates World Advanced Economies Emerging Market Economies Notes: The black dashed line represents the model s estimate of long-run growth.
Stress-testing the Impact of an Italian Growth Shock using Structural Scenarios
 Stress-testing the Impact of an Italian Growth Shock using Structural Scenarios Juan Antolín-Díaz Fulcrum Asset Management Ivan Petrella Warwick Business School June 4, 218 Juan F. Rubio-Ramírez Emory
The Fulcrum Expected Returns Model: A Primer
 : A Primer Juan Antolín-Díaz Fulcrum Asset Management London Business School Gino Cenedese Fulcrum Asset Management March 31, 2019 Motivation Traditional approaches to computing longer-term expected returns
Chapter 1 International economy
 Chapter International economy. Main points from the OECD's Economic Outlook A broad-based recovery has taken hold Asia, the US and the UK have taken the lead. Continental Europe will follow Investment
Keynote Address: Jeff Gundlach Presenter Chief Executive Officer & Chief Investment Officer DoubleLine Capital
 Keynote Address: Jeff Gundlach Presenter Chief Executive Officer & Chief Investment Officer DoubleLine Capital This Time It s Different 2 3 Past Fed Tightening Cycles Source: ValueWalk, Taking a Lesson
Vanguard commentary April 2011
 Oil s tipping point $150 per barrel would likely be necessary for another U.S. recession Vanguard commentary April Executive summary. Rising oil prices are arguably the greatest risk to the global economy.
February Working Paper Modelling the Global Price of Oil: Is there any Role for the Oil Futures-spot Spread?
 February 218 Working Paper 6.218 Modelling the Global Price of Oil: Is there any Role for the Oil Futures-spot Spread? Daniele Valenti Economic Theory Series Editor: Matteo Manera Modelling the Global
Session 1: What is the Impact of Negative Interest Rates on Europe s Financial System? How Do We Get Back to Normal?
 : What is the Impact of Negative Interest Rates on Europe s Financial System? How Do We Get Back to Normal? Disclaimer: The views expressed in this presentation are those of the presenter and do not necessarily
Core Inflation and the Business Cycle
 Bank of Japan Review 1-E- Core Inflation and the Business Cycle Research and Statistics Department Yoshihiko Hogen, Takuji Kawamoto, Moe Nakahama November 1 We estimate various measures of core inflation
Monetary Policy Report 3/11. Charts
 Monetary Policy Report / Charts Chart. Projected output gap¹) for Norway's trading partners. Per cent. Q Q - - - - MPR / MPR / - - - - - 7 9 ) The output gap measures the percentage deviation between GDP
Outlook for the Norwegian economy
 .9.9 Outlook for the Norwegian economy Governor Svein Gjedrem, Norges Bank, September 9 Indicator for world trade -month change. Per cent. January July 9 Manufacturing production Growth in past months.
Global Economic Prospects: A Fragile Recovery. June M. Ayhan Kose Four Questions
 //7 Global Economic Prospects: A Fragile Recovery June 7 M. Ayhan Kose akose@worldbank.org Four Questions How is the health of the global economy? Recovery underway, broadly as expected How important is
Modelling the Global Price of Oil: Is there any Role for the Oil Futures-spot Spread?
 Fondazione Eni Enrico Mattei Working Papers 3-13-218 Modelling the Global Price of Oil: Is there any Role for the Oil Futures-spot Spread? Daniele Valenti University of Milan, Department of Economics,
Monetary Policy Report September 2017
 Monetary Policy Report September 2017 Chapter 1 Figure 1.1. Repo rate with uncertainty bands Per cent Note. The uncertainty bands for the repo rate are based on the Riksbank s historical forecasting errors
Predicting the Markets: Chapter 9 Charts: Predicting the Fed
 Predicting the Markets: Chapter 9 Charts: November, 1 Dr. Edward Yardeni Chief Investment Strategist Mali Quintana Senior Economist info@yardenibook.com Please visit our sites at www. blog. thinking outside
High Frequency Economic Indicators
 High Frequency Economic Indicators October 23, 211 Dr. Edward Yardeni 516-972-7683 eyardeni@ Mali Quintana 48-664-1333 aquintana@ Please visit our sites at www. blog. thinking outside the box Table Of
Bank of Japan Review. The Uncertainty of the Economic Outlook and Central Banks Communications
 Bank of Japan Review 8-E- The Uncertainty of the Economic Outlook and Central Banks Communications Monetary Affairs Department Koji Nakamura and Shinichiro Nagae June 8 Central Banks make policy decisions
Figure 1.1. Repo rate with uncertainty bands
 Chapter 1 Figure 1.1. Repo rate with uncertainty bands Per cent Note. The uncertainty bands for the repo rate are based on the Riksbank s historical forecasting errors and the ability of risk-premium adjusted
Outlook for the Mexican Economy Alejandro Díaz de León Carrillo, Governor, Banco de México. April, 2018
 Alejandro Díaz de León Carrillo, Governor, Banco de México April, Outline 1 External Conditions Current Outlook.1. Monetary Policy and Inflation Determinants in Mexico Evolution of Economic Activity Recent
United States. Gross Domestic Product Percent change over year-ago level. Industrial Production Index, 2010=100. Unemployment Rate Percent
 United States Summary Indicators Gross Domestic Product Percent change over year-ago level Industrial Production Index, 2010=100 1.0 1.5 2.0 2.5 3.0 3.5 4.0 2.5 108 110 112 114 114.9 4.0 4.5 5.0 5.5 6.0
U.S. Economic Activity. Federal Reserve Bank of Dallas
 U.S. Economic Activity Federal Reserve Bank of Dallas 2018 Contents 1 Economic Activity 2 Wages and Prices 3 Financial Activity Economic Activity Economic Activity 1 month % change 1.0 Real Personal Consumption
U.S. Economic Activity. Federal Reserve Bank of Dallas
 U.S. Economic Activity Federal Reserve Bank of Dallas 2018 Contents 1 Economic Activity 2 Wages and Prices 3 Financial Activity Economic Activity Economic Activity Initial Claims for Unemployment and Unemployment
U.S. Economic Activity. Federal Reserve Bank of Dallas
 U.S. Economic Activity Federal Reserve Bank of Dallas 2018 Contents 1 Economic Activity 2 Wages and Prices 3 Financial Activity Economic Activity Economic Activity New Orders for Durable Goods Billions
U.S. Economic Activity. Federal Reserve Bank of Dallas
 U.S. Economic Activity Federal Reserve Bank of Dallas 2018 Contents 1 Economic Activity 2 Wages and Prices 3 Financial Activity Economic Activity Economic Activity Initial Claims for Unemployment and Unemployment
Inflation Regimes and Monetary Policy Surprises in the EU
 Inflation Regimes and Monetary Policy Surprises in the EU Tatjana Dahlhaus Danilo Leiva-Leon November 7, VERY PRELIMINARY AND INCOMPLETE Abstract This paper assesses the effect of monetary policy during
Stochastic analysis of the OECD-FAO Agricultural Outlook
 Stochastic analysis of the OECD-FAO Agricultural Outlook 217-226 The Agricultural Outlook projects future outcomes based on a specific set of assumptions about policies, the responsiveness of market participants
Global Economic Outlook and Risks
 Global Economic Outlook and Risks Global Finance Conference, Hofstra University Matthew Higgins, Vice President, Research & Statistics Group May 5, 2017 The views expressed here are those of the author,
Challenges In Modelling Inflation For Counterparty Risk
 Challenges In Modelling Inflation For Counterparty Risk Vinay Kotecha, Head of Rates/Commodities, Market and Counterparty Risk Analytics Vladimir Chorniy, Head of Market & Counterparty Risk Analytics Quant
Flash Economics. What difference does it make having a stable oil price at 50 dollars a barrel or an oil price rising by 10 dollars per year?
 8 June 7-9 What difference does it make having a stable oil price at dollars a barrel or an oil price rising by dollars per year? Since the end of, oil prices have remained stable at around dollars a barrel
Online Appendixes to Missing Disinflation and Missing Inflation: A VAR Perspective
 Online Appendixes to Missing Disinflation and Missing Inflation: A VAR Perspective Elena Bobeica and Marek Jarociński European Central Bank Author e-mails: elena.bobeica@ecb.int and marek.jarocinski@ecb.int.
Short-Term Inflation Projections: a Bayesian Vector Autoregressive approach
 Short-Term Inflation Projections: a Bayesian Vector Autoregressive approach Domenico Giannone (Université Libre Bruxelles) Michele Lenza (European Central Bank) Daphne Momferatou (European Central Bank)
Estimating and Accounting for the Output Gap with Large Bayesian Vector Autoregressions
 Estimating and Accounting for the Output Gap with Large Bayesian Vector Autoregressions James Morley 1 Benjamin Wong 2 1 University of Sydney 2 Reserve Bank of New Zealand The view do not necessarily represent
[ ] WEEKLY CHANGES AGAINST THE USD
![[ ] WEEKLY CHANGES AGAINST THE USD](/thumbs/80/81644725.jpg "[ ] WEEKLY CHANGES AGAINST THE USD") February 26, 2018 [ ] MACRO & MARKETS COMMENTARY» Federal Reserve officials see the economic growth and the acceleration of inflation as a good signal to continue to raise interest rate gradually over
February 26, 2018 [ ] MACRO & MARKETS COMMENTARY» Federal Reserve officials see the economic growth and the acceleration of inflation as a good signal to continue to raise interest rate gradually over
Global economy on track for solid recovery
 Global economy on track for solid recovery World real GDP grew by 5 percent in 20 Real GDP growth, percent 8 6 4 2 0-2 -4 Emerging and developing economies Advanced economies World -6 1980 1985 1990 1995
Chart Collection for Morning Briefing
 Chart Collection for Morning Briefing February 12, 219 Dr. Edward Yardeni 516-972-7683 eyardeni@ Mali Quintana 48-664-1333 aquintana@ Please visit our sites at blog. thinking outside the box 25 Figure
Predicting the Markets Chapter 15 Charts: Predicting Commodities
 Predicting the Markets Chapter 15 Charts: November 2, 216 Dr. Edward Yardeni 516-972-7683 eyardeni@ Mali Quintana 48-664-1333 aquintana@ Please visit our sites at www. blog. thinking outside the box Table
Cocos: Not to be ignored
 Cocos: Not to be ignored Cocos have performed positively this year, however, risk premiums have room to decline and carry remains a powerful driver of returns going forward. Cocos are no longer a niche
Discussion of Trend Inflation in Advanced Economies
 Discussion of Trend Inflation in Advanced Economies James Morley University of New South Wales 1. Introduction Garnier, Mertens, and Nelson (this issue, GMN hereafter) conduct model-based trend/cycle decomposition
News Shocks and the Term Structure of Interest Rates: Reply Online Appendix
 News Shocks and the Term Structure of Interest Rates: Reply Online Appendix André Kurmann Drexel University Christopher Otrok University of Missouri Federal Reserve Bank of St. Louis March 14, 2017 This
Fiscal Policy: Ready for The Next Shock?
 Fiscal Policy: Ready for The Next Shock? Franziska Ohnsorge December 217 Duration of Global Expansions: Getting Older Although Not Yet Dying of Old Age 18 Global expansions (Number of years) 45 Expansions
Discussion on. Trend Inflation Estimates for Thailand from Disaggregated Data
 Discussion on Trend Inflation Estimates for Thailand from Disaggregated Data by Pym Manopimoke and Vorada Limjaroenrat PIER Research Workshop 2016 8-9 July 2016 Pisut Kulthanavit Faculty of Economics,
MPC update: The SARB cuts interest rates by 25bp as risks to inflation outlook seen to be reduced as SA avoids a Moody's rating downgrade
 Figure 1: SA Consumer Inflation: history and forecasts 14 12 % change y/y 10 8 6 4 2 2005 2006 2007 2008 2009 2010 2011 2012 2013 2014 2015 2016 2017 2018 2019 2020 MPC target period Actual Investec CPI
Inflation projection of Narodowy Bank Polski based on the NECMOD model
 Economic Institute Inflation projection of Narodowy Bank Polski based on the NECMOD model Warsaw / 9 March Inflation projection of the NBP based on the NECMOD model Outline: Introduction Changes between
Chart 1. U.S. Personal Saving Rate and Household Debt (consu plus mortgage) as a % of Disposable Personal Incom
 as a % of Disposable Personal Incom") Chart 1 U.S. Personal Saving Rate and Household Debt (consu plus mortgage) as a % of Disposable Personal Incom 16% 14% 12% 10% 8% 6% 4% Last Points 4Q 2015- Saving Rate, 5.4%; HH Debt, 1 140% 130% 120%
Chart 1 U.S. Personal Saving Rate and Household Debt (consu plus mortgage) as a % of Disposable Personal Incom 16% 14% 12% 10% 8% 6% 4% Last Points 4Q 2015- Saving Rate, 5.4%; HH Debt, 1 140% 130% 120%
[ ] WEEKLY CHANGES AGAINST THE USD
![[ ] WEEKLY CHANGES AGAINST THE USD](/thumbs/83/87976656.jpg "[ ] WEEKLY CHANGES AGAINST THE USD") February 12, 2018 [ ] MACRO & MARKETS COMMENTARY» In the early hours of last Friday, U.S Congress approved a major budget deal that opens the door for more increase in defense and non-defense spending
February 12, 2018 [ ] MACRO & MARKETS COMMENTARY» In the early hours of last Friday, U.S Congress approved a major budget deal that opens the door for more increase in defense and non-defense spending
2016 Investment Outlook: Crosscurrents
 216 Investment Outlook: Crosscurrents January 13, 216 MODERATED BY: Celia Dallas Chief Investment Strategist Wade O Brien Managing Director, Global Investment Research Christopher Hunter Managing Director,
The policy challenge: Catalyse the private sector for stronger and more inclusive growth
 OECD ECONOMIC OUTLOOK The policy challenge: Catalyse the private sector for stronger and more inclusive growth Ángel Gurría OECD Secretary-General Catherine L. Mann OECD Chief Economist Paris, 28 November
Quarterly Report April June 2017 August 30th, 2017
 Quarterly Report April June August th, Outline 1 Monetary Policy and Inflation External Conditions Evolution of the Mexican Economy Forecasts and Final Remarks Quarterly Report April - June 1 Conduction
Pairs trading: opportunities in oil. 28th January 2009 Anthony Grech Research Analyst IG Index
 Pairs trading: opportunities in oil 28th January 2009 Anthony Grech Research Analyst IG Index Pairs trading: opportunities in oil 01 Pairs trading: opportunities in oil Co-relating the price ratio between
The current definition of spare capacity is. When has OPEC Spare Capacity Mattered for Oil Prices?
 When has OPEC Spare Capacity Mattered for Oil Prices? Oil prices usually feed off multiple influences, as noted in Büyükşahin (2011). The various influences on oil prices are illustrated in Figure 1. But
Simulations Illustrate Flaw in Inflation Models
 Journal of Business & Economic Policy Vol. 5, No. 4, December 2018 doi:10.30845/jbep.v5n4p2 Simulations Illustrate Flaw in Inflation Models Peter L. D Antonio, Ph.D. Molloy College Division of Business
Monetary Policy Report 2/12. Charts
 Monetary Policy Report / Charts Chart. Yields on -year government bonds. Percent. January June Greece (left-hand scale) Germany Spain Italy 8 7 Jan- Jul- Jan- Jul- Jan- Source: Thomson Reuters Chart. Developments
The Evidence for Differences in Risk for Fixed vs Mobile Telecoms For the Office of Communications (Ofcom)
") The Evidence for Differences in Risk for Fixed vs Mobile Telecoms For the Office of Communications (Ofcom) November 2017 Project Team Dr. Richard Hern Marija Spasovska Aldo Motta NERA Economic Consulting
The Evidence for Differences in Risk for Fixed vs Mobile Telecoms For the Office of Communications (Ofcom) November 2017 Project Team Dr. Richard Hern Marija Spasovska Aldo Motta NERA Economic Consulting
Quarterly Report. April June 2015
 April June August 12, 1 1 Outline 1 2 Monetary Policy External Conditions 3 Economic Activity in Mexico Inflation Determinants Forecasts and Balance of Risks April-June 2 Monetary Policy Conduction in
Recent Economic Developments and Monetary Policy in Mexico
 Recent Economic Developments and Monetary Policy in Mexico Javier Guzmán Calafell, Deputy Governor, Banco de México* United States-Mexico Chamber of Commerce, Northeast Chapter New York City, 2 June 2017
Economic recovery dashboard
 CURRENT AS OF OCTOBER 31, 2009 Economic recovery dashboard Summary of current state Market indicators Most indicators changed little over the previous month. VIX increased, closing the month at 30.69,
Emerging Trends in the U.S. and Colorado Economies
 Emerging Trends in the U.S. and Colorado Economies Sam Chapman Associate Economist Federal Reserve Bank of Kansas City Denver Branch The views expressed are those of the presenter and do not necessarily
Quarterly Report. October December 2014
 October December February 18, 2015 Outline 1 2 Monetary Policy External Conditions 3 4 5 Economic Activity in Mexico Inflation Determinants Forecasts and Balance of Risks 2 Recent Evolution of Inflation
Quarterly Report. July-September 2015
 July-September November 0, 1 1 Outline 1 Monetary Policy External Conditions Economic Activity in Mexico Inflation Determinants Forecasts and Balance of Risks July September Monetary Policy Conduction
Implications of Low Inflation Rates for Monetary Policy
 EMBARGOED UNTIL MONDAY, NOVEMBER 10, 2014 AT 5:10 P.M. EASTERN TIME OR UPON DELIVERY Implications of Low Inflation Rates for Monetary Policy Eric S. Rosengren President & CEO Federal Reserve Bank of Boston
Dietrich Domanski, Jonathan Kearns, Marco J. Lombardi and Hyun Song Shin
 Oil and Debt Dietrich Domanski, Jonathan Kearns, Marco J. Lombardi and Hyun Song Shin OPEC, 3 March 215 The views expressed are solely those of the authors and should not be attributed to the BIS Restricted
What to expect from inflation, growth and central banks
 Your access to capital markets. www.baaderbank.com / www.helvea.com What to expect from inflation, growth and central banks Uto Baader Founder & Consultant, Baader Bank AG Porec October 2016 Source: Thomson
Performance of Statistical Arbitrage in Future Markets
 Utah State University DigitalCommons@USU All Graduate Plan B and other Reports Graduate Studies 12-2017 Performance of Statistical Arbitrage in Future Markets Shijie Sheng Follow this and additional works
Monetary Policy report October 2015
 Monetary Policy report October 2015 Chapter 1 Figure 1.1. Repo rate with uncertainty bands Per cent Note. The uncertainty bands for the repo rate are based on the Riksbank s historical forecasting errors
U.S. Economy and Financial Markets
 U.S. Economy and Financial Markets Economic Growth and Output Business Income and Finance Business Inventory Business Investment Consumption Housing Investment Income and Savings U.S. Aggregate Demand
Monetary Policy Report 1/12. Charts
 Monetary Policy Report / Charts Chart. Projected output gap¹) for Norway's trading partners. Percent. Q Q - - - - MPR / MPR / - - - - - 8 ) The output gap measures the percentage deviation between GDP
Economic Outlook. William Strauss Senior Economist and Economic Advisor Federal Reserve Bank of Chicago
 Economic Outlook Chicago Association of Spring Manufacturers, Inc Des Plaines, IL January 15, 215 William Strauss Senior Economist and Economic Advisor Federal Reserve Bank of Chicago The Great Recession
Inflation Report. July September 2012
 July September 1 November 7, 1 1 Outline 1 External Conditions Economic Activity in Mexico 3 Monetary Policy and Inflation Determinants Forecasts and Balance of Risks External Conditions The growth rate
ECONOMIC COMMENTARY. When Might the Federal Funds Rate Lift Off? Edward S. Knotek II and Saeed Zaman
 ECONOMIC COMMENTARY Number 213-19 December 4, 213 When Might the Federal Funds Rate Lift Off? Computing the Probabilities of Crossing Unemployment and Inflation Thresholds (and Floors) Edward S. Knotek
Predicting the Markets: Commodities
 Predicting the Markets: Commodities August 17, 16 Dr. Edward Yardeni 516-972-7683 eyardeni@ Mali Quintana 48-664-1333 aquintana@ Please visit our sites at www. blog. thinking outside the box Table Of Contents
World Economic Trend, Spring 2006, No. 9
 World Economic Trend, Spring, No. 9 Published on June 8 by the Cabinet Office Key Points of Chapter 1 (summary) 1. Global price stability: Global economy continues to show price stability and recovery
Rebalancing Economic Themes and Emerging Risks for the Balance of 2016
 Rebalancing Economic Themes and Emerging Risks for the Balance of 2016 Page 1 Themes Oil s Not Well A world of cheap petroleum Eastern Anxiety China attempts a difficult transition Growing Prospects Central
Monetary Policy Report 3/12. Charts
 Monetary Policy Report / Charts Chart. Key rates and estimated forward rates as at June and October.¹) Percent. January December ²) US Euro area³) UK 9 ) Broken lines show estimated forward rates as at
Market Correlations: Trade-Weighted Dollar
 Market Correlations: Trade-Weighted Dollar March 11, 218 Dr. Edward Yardeni 516-972-7683 eyardeni@ Joe Abbott 732-497-536 jabbott@ Mali Quintana 48-664-1333 aquintana@ Please visit our sites at www. blog.
Economic Outlook. Ottawa Chamber of Commerce/ Ottawa Business Journal: Mayor s Breakfast Series Ottawa, Ontario 27 April 2012.
 Economic Outlook Ottawa Chamber of Commerce/ Ottawa Business Journal: Mayor s Breakfast Series Ottawa, Ontario 27 April 2012 Mark Carney Mark Carney Governor Agenda Three global forces The consequences
Auscap Long Short Australian Equities Fund Newsletter August 2015
 Auscap Asset Management Limited Disclaimer: This newsletter contains performance figures and information in relation to the from inception of the Fund. The actual performance for your account will be provided
World Economic outlook
 Frontier s Strategy Note: 01/23/2014 World Economic outlook IMF has just released the World Economic Update on the 21st January 2015 and we are displaying the main points here. Even with the sharp oil
2016 European Pay-for- Performance Methodology
 2016 European Pay-for- Performance Methodology Frequently Asked Questions Effective for Meetings on or after February 1, 2016 www.issgovernance.com 2016 ISS Institutional Shareholder Services Table of
Damn the End of QE! Buy the Dollar and Treasurys!
 Damn the End of QE! Buy the Dollar and Treasurys! Dr. A. Gary Shilling President A. Gary Shilling & Company, Inc. A. Gary Shilling & Co., Inc. Economic Consultants Chart 1 Historic Inflation and Deflation
Technical Appendix: Policy Uncertainty and Aggregate Fluctuations.
 Technical Appendix: Policy Uncertainty and Aggregate Fluctuations. Haroon Mumtaz Paolo Surico July 18, 2017 1 The Gibbs sampling algorithm Prior Distributions and starting values Consider the model to
Maintaining Price Stability with Unconventional Monetary Policy
 Peter Praet Member of the Executive Board of the European Central Bank Maintaining Price Stability with Unconventional Monetary Policy Council of the European Union Brussels, 29 January 218 Global PMI
Modelling Credit Spreads for Counterparty Risk: Mean-Reversion is not Needed
 Modelling Credit Spreads for Counterparty Risk: Mean-Reversion is not Needed Ignacio Ruiz, Piero Del Boca May 2012 Version 1.0.5 A version of this paper was published in Intelligent Risk, October 2012
UBS Forum. Sharper opinions, smarter decisions
 Thursday, February 5 2015 UBS Forum. Sharper opinions, smarter decisions Madrid Milan London Frankfurt Zurich Chief Investment Office WM The Diverging World CIO Year Ahead 2015 Bill O'Neill Head of Investment
Predicting Inflation. Yardeni Research, Inc. January 31, Dr. Edward Yardeni Chief Investment Strategist. thinking outside the box
 Predicting Inflation January, Dr. Edward Yardeni Chief Investment Strategist Please visit our sites at blog. thinking outside the box Table Of Contents Table Of Contents Measuring Price Inflation - Tolstoy
WEEKLY CHANGES AGAINST THE USD MACRO & MARKETS COMMENTARY
 July 31, 2017 [ W E E K LY E C O N O M I C C O M M E N TA R Y ] WEEKLY ANALYSIS FOR THE MOST CRITICAL ECONOMIC AND FINANCIAL DEVELOPMENTS MACRO & MARKETS COMMENTARY» Federal Open Market Committee (FOMC)
Quarterly Report. July September 2014
 July September November 19, Outline 1 2 Monetary Policy External Conditions 3 4 5 Economic Activity in Mexico Inflation Determinants Forecasts and Balance of Risks 2 Monetary Policy Conduction By constitutional
One Policymaker s Wait for Better Economic Data
 EMBARGOED UNTIL MONDAY, JUNE 1, 2015 AT 9:00 A.M. EASTERN TIME OR UPON DELIVERY One Policymaker s Wait for Better Economic Data Eric S. Rosengren President & CEO Federal Reserve Bank of Boston June 1,
Predicting the Markets: Chapter 9 Charts: Predicting the Fed
 Predicting the Markets: Chapter 9 Charts: August 7, 17 Dr. Edward Yardeni 1-97-73 eyardeni@ Mali Quintana --1333 aquintana@ Please visit our sites at www. blog. thinking outside the box Table Of Contents
WEEKLY CHANGES AGAINST THE USD MACRO & MARKETS COMMENTARY
 July 03, 2017 [ W E E K LY E C O N O M I C C O M M E N TA R Y ] WEEKLY ANALYSIS FOR THE MOST CRITICAL ECONOMIC AND FINANCIAL DEVELOPMENTS MACRO & MARKETS COMMENTARY» Central banker s comments dominated
[ ] WEEKLY CHANGES AGAINST THE USD
![[ ] WEEKLY CHANGES AGAINST THE USD](/thumbs/78/77362224.jpg "[ ] WEEKLY CHANGES AGAINST THE USD") January 15, 2018 [ ] MACRO & MARKETS COMMENTARY» The European central bank (ECB) has indicated it should revisit its communication stance in early 2018, according to the ECB s minutes of December meeting
January 15, 2018 [ ] MACRO & MARKETS COMMENTARY» The European central bank (ECB) has indicated it should revisit its communication stance in early 2018, according to the ECB s minutes of December meeting
Aon Retirement and Investment. Aon Investment Research and Insights. Dangers Ahead? Navigating hazards using scenario analysis.
 Aon Retirement and Investment Aon Investment Research and Insights Dangers Ahead? Navigating hazards using scenario analysis March 2018 Table of contents Executive summary....1 Introduction...1 Scenario
Can global economic conditions explain low New Zealand inflation?
 Can global economic conditions explain low New Zealand inflation? AN5/ Adam Richardson May 5 Reserve Bank of New Zealand Analytical Note series ISSN -555 Reserve Bank of New Zealand PO Box 98 Wellington
Progress towards Strong, Sustainable and Balanced Growth. Figure 1: Recovery from Financial Crisis (100 = First Quarter of Real GDP Contraction)
") Progress towards Strong, Sustainable and Balanced Growth Figure 1: Recovery from Financial Crisis (100 = First Quarter of Real GDP Contraction) Source: OECD May 2014 Forecast, Haver Analytics, Rogoff and
Progress towards Strong, Sustainable and Balanced Growth Figure 1: Recovery from Financial Crisis (100 = First Quarter of Real GDP Contraction) Source: OECD May 2014 Forecast, Haver Analytics, Rogoff and
Forecasting Australian new motor vehicle prices
 0 September 00 Economics@ Forecasting Australian new motor vehicle prices Background The Economics@ANZ motor vehicle price model aims to forecast the price index for new cars as published by the Australian
SHORT-TERM INFLATION PROJECTIONS: A BAYESIAN VECTOR AUTOREGRESSIVE GIANNONE, LENZA, MOMFERATOU, AND ONORANTE APPROACH
 SHORT-TERM INFLATION PROJECTIONS: A BAYESIAN VECTOR AUTOREGRESSIVE APPROACH BY GIANNONE, LENZA, MOMFERATOU, AND ONORANTE Discussant: Andros Kourtellos (University of Cyprus) Federal Reserve Bank of KC