THE VALUE OF AN INVESTMENT & INSURANCE CUSTOMER TO A BANK
|
|
|
- Francine Merritt
- 6 years ago
- Views:
Transcription

1 THE VALUE OF AN INVESTMENT & INSURANCE CUSTOMER TO A BANK 2012 by Strategic Business Insights and K&C Partners. Unauthorized use or reproduction prohibited.
2
3 TABLE OF CONTENTS THE VALUE OF AN INVESTMENT & INSURANCE CUSTOMER TO THE BANK...1 Beyond Profit Contribution...1 The Data Source...1 PROFILE OF THE INVESTMENT SERVICES CUSTOMER AT A BANK...2 Investable Assets...2 Checking Balances...2 Savings Balances...2 Number of Banking Products...3 Credit and Remote Banking Products...3 CUSTOMER LOYALTY...4 MISSED OPPORTUNITY...6 Primary Financial Institution...7 Place for Savings & Investments...8 Trust in Banks...9 THE BANK OPPORTUNITY IN INVESTMENT & INSURANCE SERVICES...10 APPENDIX A MACROMONITOR SURVEY METHODOLOGY APPENDIX B SURVEY WEIGHTING PROCEDURES
4 THE VALUE OF AN INVESTMENT & INSURANCE CUSTOMER TO THE BANK

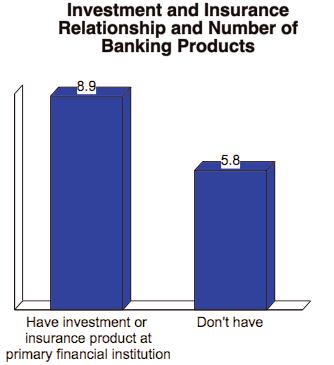
5 PROFILE OF THE INVESTMENT SERVICES CUSTOMER AT A BANK
6

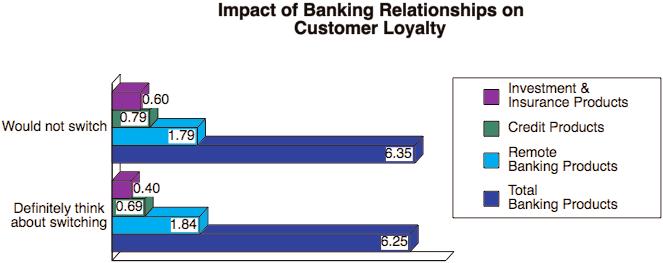
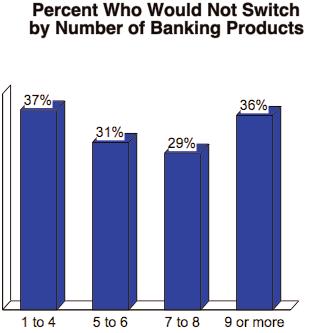
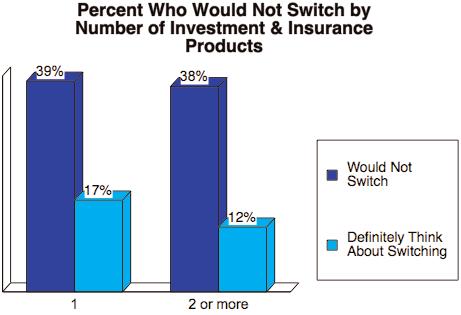
7 CUSTOMER LOYALTY
8
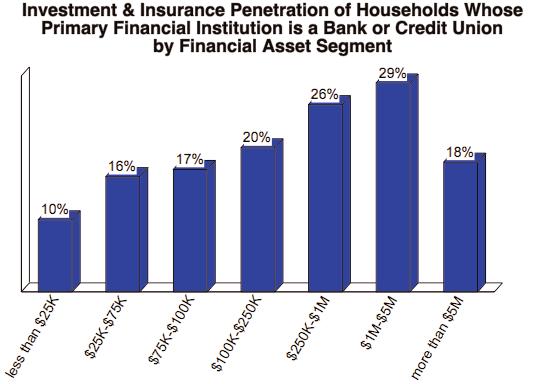
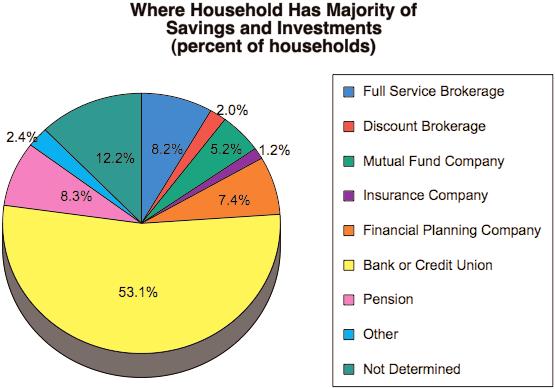
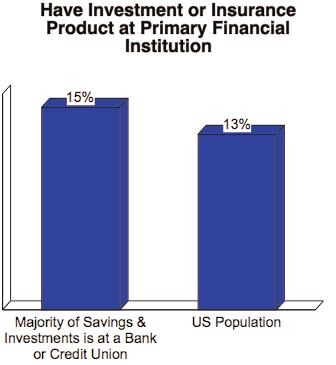
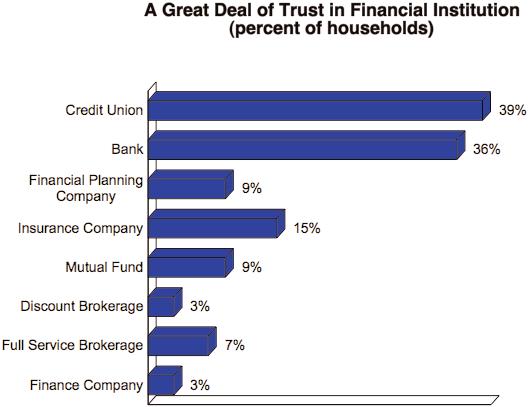
9 MISSED OPPORTUNITY
10
11
12


13 THE BANK OPPORTUNITY IN INVESTMENT & INSURANCE SERVICES
14
15 APPENDIX A MACROMONITOR SURVEY METHODOLOGY
16 Appendix A QUESTIONNAIRE DESIGN MACROMONITOR SURVEY METHODOLOGY The MacroMonitor questionnaire maintains a design that has remained consistent for more than 30 years to measure consumer attitudes, behaviors, and motivations about financial services. In 2010, Strategic Business Insights (SBI s) Consumer Financial Decisions (CFD) group developed a draft questionnaire and submitted it to clients for suggested comments, deletions, and additions. Knowledge Networks (KN) programmed the questionnaire to allow online participation. All questions in the final MacroMonitor questionnaire are closed end or limited open end. Respondents enter actual dollar amounts of their balances, actual numbers of household members, and actual numbers at other numerical questions. DATA COLLECTION Introduction Knowledge Networks conducted the MacroMonitor survey on behalf of Strategic Business Insights Consumer Financial Decisions group. It conducted the survey on the KnowledgePanel. Sample Definition The survey consists of two household-level target populations. One is a general population sample of households headed by adults age 18 and older residing in the United States; the other is an oversample of affluent households those households with a total household income of at least $100,000 or total assets (excluding the home) of at least $500,000. To create the target population, Knowledge Networks randomly sampled households from its KnowledgePanel, a probability-based web panel that is representative of the United States. Individuals who completed the survey must be the primary decision maker for the household s financial activities or share the financial decisions with someone else in the household. KN asked individuals who were not active in the financial decisions to pass the survey to the decision makers in their household. Field Period Knowledge Networks pretested the online survey in June 2010 and conducted the main survey in June, July, and August The data collection field periods were as follows. A-1
17 Stage Start Date End Date Pretest 6/9/2010 6/14/2010 Main 6/28/2010 8/24/2010 Participants completed the main survey in 164 minutes (median). Sample Sizes and Survey-Completion Rates The number of respondents sampled and participating in the survey and the survey completion rates are below. Key Survey Response Statistics: Main Interview Invited Completed Completion Rate National % Sample Affluent % Sample Total % Researchers at SBI considered 4374 of the 4577 completed surveys valid. Survey-Cooperation Enhancements In addition to taking some standard measures to enhance survey cooperation, Knowledge Networks took the following steps: Sent reminders to nonresponders on day three of the field period Sent additional reminders to nonresponders on July 8, July 15, July 19, July 23, July 30, August 5, August 12, August 16, and August 20, 2010 Gave participants a cash-equivalent $20 for their participation Made participants eligible to win an in-kind prize through a monthly KN sweepstakes. A-2
18 APPENDIX B SURVEY WEIGHTING PROCEDURES
19 Appendix B SURVEY WEIGHTING PROCEDURES The MacroMonitor target for weighting to the national household population in the U.S. is economic household units a definition that allows households to have more than one economic unit. The U.S. Bureau of the Census defines households as persons sharing a common dwelling unit. The MacroMonitor definition of economic household includes families, individuals living alone, and two or more adults living together in a common dwelling who share basic finances. Thus, adults who live together but are unrelated and unmarried such as housemates, roomers, a cohabiting couple, resident employees, or adult children or other relatives who might contribute to the housing expenses but otherwise maintain separate finances count as separate economic households. The KnowledgePanel sample design began as an equal probability sample with several enhancements incorporated to improve efficiency. Since any alteration in the selection process is a deviation from a pure equal probability sample design, statistical weighting adjustments were made to the data to offset known selection deviations. These adjustments were incorporated in the sample s base weight. There are also several sources of survey error that are an inherent part of any survey process, such as non- coverage and non- response due to panel recruitment methods and to inevitable panel attrition. These sources of sampling and non- sampling error were addressed using a panel demographic post-stratification weight. Lastly, a set of study-specific post-stratification weights were constructed to adjust for the study s sample design and survey non- response. The MacroMonitor study- specific weights are based on household level demographic and geographic distributions for the non- institutionalized, civilian population ages 18+ from the Current Population Survey (CPS), March 2010 Supplement. Respondents were weighted to the derived benchmark distributions presented in Table B- 1. Comparable distributions were calculated using all completed cases from the field data. Since study sample sizes are typically too small to accommodate a complete cross- tabulation of all the survey benchmark variables, an iterative proportional fitting is used for the post- stratification weighting adjustment. This procedure adjusts the sample data to the selected benchmark proportions. Through an iterative convergence process, the weighted sample data were optimally fitted to the marginal distributions. After this final post- stratification adjustment, the distribution of the calculated weights were examined to identify and, if necessary, trim outliers at the extreme upper and lower tails of the weight distribution. The post- stratified and trimmed weights were then scaled to the size of the population (116m households). Extremely large weights, though they help the fit of the total sample to the Census marginals, are statistically very unreliable. And because the demographics of persons underrepresented (and overweighted) in the sample B-1
20 are typically the young, low income, and poorly educated, large weights also increase the relative importance of questionnaire responses of low validity. For these reasons, we capped the largest weights by winsorizing the distribution: We replaced the top 2.5% of weights by the mean value of the top 2.5% of weights. After winsorizing, the range of weights was 1.88 to (ratio 90). The weighted winsorized sample has an estimated 40% of the statistical efficiency of the unweighted sample, which means that most weighted calculations have confidence intervals approximately equal to those in an unweighted sample of about 1,750 (0.40 x 4,374) respondents. Finally, we factored weights so that their sum equaled the estimated number in thousands of economic households in the United States. After factoring, the weights ranged from 1.88 to and summed to 128,047 (000). Table B-1 Weighting Targets MACROMONITOR Number of responding households 4,374 Estimated number of household economic units 128,047,000 Household Characteristics Percentage of All U.S. Households Presence of Unrelated Persons Living in the Home Non-family in the home 33.1 Family only in the home 66.9 Census Region New England 4.9 Mid- Atlantic 13.4 East-North Central 15.6 West- North Central 7.0 South Atlantic 19.7 East-South Central 6.1 West-South Central 11.2 Mountain 7.0 Pacific 15.1 Metropolitan Area Non-Metro 16.7 Metro 83.3 Household Income Under $ $ to $ $ to $ $ to $ B-2
21 $ to $ $ to $ $ to $ $ or more 8.3 Home Ownership Status Own 67.2 Rent/other 32.8 Household Size or more 23.7 Presence of Children No children under age Children under age Age of Head of Household 18 to 34 years to 44 years to 54 years to 64 years years or older 21.6 Ethnicity of Head of Household White 70.8 Black or African American 12.1 Hispanic 11.3 Other 4.7 More than one 1.1 Education of Head of Household Grade 0 to Some high school 7.7 High school graduate 29.6 Some college 28.0 Bachelorʼs degree 19.6 Beyond Bachelorʼs degree 10.7 Internet Access No 31.3 Yes 68.7 B-3
Notes On Weights, Produced by Knowledge Networks, Amended by the Stanford Research Team, Applicable to Version 2.0 of the data.
 Notes On Weights, Produced by Knowledge Networks, Amended by the Stanford Research Team, Applicable to Version 2.0 of the data. Sample Weighting The design for a KnowledgePanel SM sample begins as an equal
The American Panel Survey. Study Description and Technical Report Public Release 1 November 2013
 The American Panel Survey Study Description and Technical Report Public Release 1 November 2013 Contents 1. Introduction 2. Basic Design: Address-Based Sampling 3. Stratification 4. Mailing Size 5. Design
Survey Information and Methodology. Introduction
 Survey Information and Methodology Introduction Knowledge Networks conducted a study on different aspects of retirement on behalf of the Center for Retirement Research at Boston College. Specifically,
1 PEW RESEARCH CENTER
 1 Methodology This report is drawn from a survey conducted as part of the American Trends Panel (ATP), a nationally representative panel of randomly selected U.S. adults living in households recruited
Guide for Investigators. The American Panel Survey (TAPS)
") Draft (to be updated in January) Guide for Investigators The American Panel Survey (TAPS) Weidenbaum Center Washington University Steven S. Smith, Director About The American Panel Survey (TAPS) TAPS is
Draft (to be updated in January) Guide for Investigators The American Panel Survey (TAPS) Weidenbaum Center Washington University Steven S. Smith, Director About The American Panel Survey (TAPS) TAPS is
Appendix A: Detailed Methodology and Statistical Methods
 Appendix A: Detailed Methodology and Statistical Methods I. Detailed Methodology Research Design AARP s 2003 multicultural project focuses on volunteerism and charitable giving. One broad goal of the project
Survey of Household Economics and Decisionmaking
 SHED Survey of Household Economics and Decisionmaking Jeff Larrimore Consumer & Community Development Research Division of Consumer & Community Affairs The analysis and conclusions set forth in this presentation
ASSOCIATED PRESS-LIFEGOESSTRONG.COM BOOMERS SURVEY CONDUCTED BY KNOWLEDGE NETWORKS March 16, 2011
 1350 Willow Rd, Suite 102 Menlo Park, CA 94025 www.knowledgenetworks.com Interview dates: March 04 March 13, 2011 Interviews: 1,490 adults, including 1,160 baby boomers Sampling margin of error for a 50%
National Financial Well- Being Survey
 September 2017 National Financial Well- Being Survey Public Use File User s Guide Table of contents Table of contents... 1 1. Introduction... 2 2. Description of the survey... 5 2.1 National Financial
Commission District 4 Census Data Aggregation
 Commission District 4 Census Data Aggregation 2011-2015 American Community Survey Data, U.S. Census Bureau Table 1 (page 2) Table 2 (page 2) Table 3 (page 3) Table 4 (page 4) Table 5 (page 4) Table 6 (page
Northwest Census Data Aggregation
 Northwest Census Data Aggregation 2011-2015 American Community Survey Data, U.S. Census Bureau Table 1 (page 2) Table 2 (page 2) Table 3 (page 3) Table 4 (page 4) Table 5 (page 4) Table 6 (page 5) Table
Riverview Census Data Aggregation
 Riverview Census Data Aggregation 2011-2015 American Community Survey Data, U.S. Census Bureau Table 1 (page 2) Table 2 (page 2) Table 3 (page 3) Table 4 (page 4) Table 5 (page 4) Table 6 (page 5) Table
1 PEW RESEARCH CENTER
 1 Methodology The American Trends Panel (ATP), created by Pew Research Center, is a nationally representative panel of randomly selected U.S. adults recruited from landline and cellphone random-digit-dial
Zipe Code Census Data Aggregation
 Zipe Code 66101 Census Data Aggregation 2011-2015 American Community Survey Data, U.S. Census Bureau Table 1 (page 2) Table 2 (page 2) Table 3 (page 3) Table 4 (page 4) Table 5 (page 4) Table 6 (page 5)
Zipe Code Census Data Aggregation
 Zipe Code 66103 Census Data Aggregation 2011-2015 American Community Survey Data, U.S. Census Bureau Table 1 (page 2) Table 2 (page 2) Table 3 (page 3) Table 4 (page 4) Table 5 (page 4) Table 6 (page 5)
Poverty Facts, million people or 12.6 percent of the U.S. population had family incomes below the federal poverty threshold in 2004.
 Poverty Facts, 2004 How Many People Are Poor? 36.6 million people or 12.6 percent of the U.S. population had family incomes below the federal poverty threshold in 2004. 1 How Much Money Do Families Need
How Couples Meet and Stay Together Project
 How Couples Meet and Stay Together Project Overview Knowledge Networks conducted a study focusing on how couples meet and do or do not stay together, on behalf of Stanford University. The study included
In 2012, according to the U.S. Census Bureau, about. A Profile of the Working Poor, Highlights CONTENTS U.S. BUREAU OF LABOR STATISTICS
 U.S. BUREAU OF LABOR STATISTICS M A R C H 2 0 1 4 R E P O R T 1 0 4 7 A Profile of the Working Poor, 2012 Highlights Following are additional highlights from the 2012 data: Full-time workers were considerably
ASSOCIATED PRESS-LIFEGOESSTRONG.COM BOOMERS SURVEY OCTOBER 2011 CONDUCTED BY KNOWLEDGE NETWORKS October 14, 2011
 2100 Geng Road Suite 100 Palo Alto, CA 94303 www.knowledgenetworks.com Interview dates: October 5 October 12, 2011 Interviews: 1,410 adults; 1,095 boomers Sampling margin of error for a 50% statistic with
Income and Poverty Among Older Americans in 2008
 Income and Poverty Among Older Americans in 2008 Patrick Purcell Specialist in Income Security October 2, 2009 Congressional Research Service CRS Report for Congress Prepared for Members and Committees
Survey Methodology. Methodology Wave 1. Fall 2016 City of Detroit. Detroit Metropolitan Area Communities Study [1]
![Survey Methodology. Methodology Wave 1. Fall 2016 City of Detroit. Detroit Metropolitan Area Communities Study [1]](/thumbs/86/93833718.jpg "Survey Methodology. Methodology Wave 1. Fall 2016 City of Detroit. Detroit Metropolitan Area Communities Study [1]") Survey Methodology Methodology Wave 1 Fall 2016 City of Detroit Detroit Metropolitan Area Communities Study [1] Methodology Wave 1 I. SUMMARY Wave 1 of the Detroit Metropolitan Area Communities Study includes
Survey Methodology Methodology Wave 1 Fall 2016 City of Detroit Detroit Metropolitan Area Communities Study [1] Methodology Wave 1 I. SUMMARY Wave 1 of the Detroit Metropolitan Area Communities Study includes
Program on Retirement Policy Number 1, February 2011
 URBAN INSTITUTE Retirement Security Data Brief Program on Retirement Policy Number 1, February 2011 Poverty among Older Americans, 2009 Philip Issa and Sheila R. Zedlewski About one in three Americans
Women in the Labor Force: A Databook
 Cornell University ILR School DigitalCommons@ILR Federal Publications Key Workplace Documents 2-2013 Women in the Labor Force: A Databook Bureau of Labor Statistics Follow this and additional works at:
A Profile of the Working Poor, 2011
 Cornell University ILR School DigitalCommons@ILR Federal Publications Key Workplace Documents 4-2013 A Profile of the Working Poor, 2011 Bureau of Labor Statistics Follow this and additional works at:
Health Insurance Coverage in Massachusetts: Results from the Massachusetts Health Insurance Surveys
 Health Insurance Coverage in Massachusetts: Results from the 2008-2010 Massachusetts Health Insurance Surveys December 2010 Deval Patrick, Governor Commonwealth of Massachusetts Timothy P. Murray Lieutenant
MEMORANDUM. Gloria Macdonald, Jennifer Benedict Nevada Division of Health Care Financing and Policy (DHCFP)
") MEMORANDUM To: From: Re: Gloria Macdonald, Jennifer Benedict Nevada Division of Health Care Financing and Policy (DHCFP) Bob Carey, Public Consulting Group (PCG) An Overview of the in the State of Nevada
MEMORANDUM To: From: Re: Gloria Macdonald, Jennifer Benedict Nevada Division of Health Care Financing and Policy (DHCFP) Bob Carey, Public Consulting Group (PCG) An Overview of the in the State of Nevada
The coverage of young children in demographic surveys
 Statistical Journal of the IAOS 33 (2017) 321 333 321 DOI 10.3233/SJI-170376 IOS Press The coverage of young children in demographic surveys Eric B. Jensen and Howard R. Hogan U.S. Census Bureau, Washington,
No K. Swartz The Urban Institute
 THE SURVEY OF INCOME AND PROGRAM PARTICIPATION ESTIMATES OF THE UNINSURED POPULATION FROM THE SURVEY OF INCOME AND PROGRAM PARTICIPATION: SIZE, CHARACTERISTICS, AND THE POSSIBILITY OF ATTRITION BIAS No.
Demographic and Other Statistics for Women and Men Aged 50 and Older,
 Demographic and Other Statistics for Women and Men Aged 50 and Older, 1999-2001 Population in 2001 Proportion of Population Over Age 50 30.0 % 28.6 % 28.6 % 25.2 % Age Distribution: 50-61 41.9 49.6 45.5
Women in the Labor Force: A Databook
 Cornell University ILR School DigitalCommons@ILR Federal Publications Key Workplace Documents 9-2007 Women in the Labor Force: A Databook Bureau of Labor Statistics Follow this and additional works at:
Results from the 2009 Virgin Islands Health Insurance Survey
 2009 Report to: Bureau of Economic Research Office of the Governor St. Thomas, US Virgin Islands Ph 340.714.1700 Prepared by: State Health Access Data Assistance Center University of Minnesota School of
Benchmark Report for the 2008 American National Election Studies Time Series and Panel Study. ANES Technical Report Series, no. NES
 Benchmark Report for the 2008 American National Election Studies Time Series and Panel Study ANES Technical Report Series, no. NES012493 Summary This report compares estimates the 2008 ANES studies to
Original data included. The datasets harmonised are:
 Original data included The datasets harmonised are: 1965-1966 - Multinational Comparative Time-Budget Research Project, including a Jackson Michigan and a national USA sample, conducted by the Survey Research
Appendix Table 1: Rate of Uninsurance by Select Demographics (2015 to 2017)
") Appendix Table 1: Rate of Uninsurance by Select Demographics (2015 to 2017) Appendix Table 1: Rate of Uninsurance by Uninsurance Rate Select Demographics (2015 to 2017) 2015 2017 Statewide 4.3% 6.3% *
Appendix Table 1: Rate of Uninsurance by Select Demographics (2015 to 2017) Appendix Table 1: Rate of Uninsurance by Uninsurance Rate Select Demographics (2015 to 2017) 2015 2017 Statewide 4.3% 6.3% *
Women in the Labor Force: A Databook
 Cornell University ILR School DigitalCommons@ILR Federal Publications Key Workplace Documents 12-2011 Women in the Labor Force: A Databook Bureau of Labor Statistics Follow this and additional works at:
Small Area Health Insurance Estimates from the Census Bureau: 2008 and 2009
 October 2011 Small Area Health Insurance Estimates from the Census Bureau: 2008 and 2009 Introduction The U.S. Census Bureau s Small Area Health Insurance Estimates (SAHIE) program produces model based
Women in the Labor Force: A Databook
 Cornell University ILR School DigitalCommons@ILR Federal Publications Key Workplace Documents 12-2010 Women in the Labor Force: A Databook Bureau of Labor Statistics Follow this and additional works at:
HuffPost: Midterm elections March 23-26, US Adults
 1. Following midterm election news How closely have you been following news about the 2018 midterm elections? Gender Age (4 category) Race (4 category) Total Male Female 18-29 30-44 45-64 65+ White Black
Online Appendix for: Minimum Wages and Consumer Credit: Lisa J. Dettling and Joanne W. Hsu
 Online Appendix for: Minimum Wages and Consumer Credit: Impacts on Access to Credit and Traditional and High-Cost Borrowing Lisa J. Dettling and Joanne W. Hsu A1 Appendix Figure 1: Regional Representation
Evaluation of the Current Weighting Methodology for BRFSS and Improvement Alternatives (Abstract #309160) Joint Statistical Meetings July 31, 2007
 Joint Statistical Meetings July 31, 2007") Evaluation of the Current Weighting Methodology for BRFSS and Improvement Alternatives (Abstract #309160) Joint Statistical Meetings July 31, 2007 Mansour Fahimi, Darryl Creel, and Paul Levy RTI International
Evaluation of the Current Weighting Methodology for BRFSS and Improvement Alternatives (Abstract #309160) Joint Statistical Meetings July 31, 2007 Mansour Fahimi, Darryl Creel, and Paul Levy RTI International
The Economist/YouGov Poll
 Interviewing: Sample: 1500 Adults nationwide online 1004 registered voters nationwide online Weekly Tracking For immediate release 2 1. Presidential Job Approval Historical Do you approve or disapprove
THE IMPACT OF INTERGENERATIONAL WEALTH ON RETIREMENT
 Issue Brief THE IMPACT OF INTERGENERATIONAL WEALTH ON RETIREMENT When it comes to financial security during retirement, intergenerational transfers of wealth create a snowball effect for Americans age
Registered voters Gender Age (4 category) Race (4 category)
 Race (4 category)") 1. Percentage voting What percentage of Americans do you think will vote in the upcoming midterm election? 0-10 2% 1% 2% 3% 5% 6% 0% 0% 2% 3% 7% 2% 10-20 1% 1% 2% 1% 3% 2% 1% 0% 1% 3% 3% 2% 20-30 5% 5%
1. Percentage voting What percentage of Americans do you think will vote in the upcoming midterm election? 0-10 2% 1% 2% 3% 5% 6% 0% 0% 2% 3% 7% 2% 10-20 1% 1% 2% 1% 3% 2% 1% 0% 1% 3% 3% 2% 20-30 5% 5%
A Close Look at ETF Households
 A Close Look at ETF Households A Report by the Investment Company Institute and Strategic Business Insights SEPTEMBER 2018 Suggested citation: Investment Company Institute and Strategic Business Insights.
HuffPost: Voter fraud May 17-20, US Adults
 1. Easy to vote Do you think it should or should not be the government s goal to make it easy for people to vote? It should be a goal 61% 60% 61% 58% 65% 56% 66% 61% 63% 50% 65% It should not be a goal
Contingent and Alternative Employment Arrangements, May U.S. BUREAU OF LABOR STATISTICS bls.gov
 Contingent and Alternative Employment Arrangements, May 2017 1 U.S. BUREAU OF LABOR STATISTICS bls.gov Gig economy No official BLS definition of gig economy or gig workers Researchers use many different
Random Group Variance Adjustments When Hot Deck Imputation Is Used to Compensate for Nonresponse 1
 Random Group Variance Adjustments When Hot Deck Imputation Is Used to Compensate for Nonresponse 1 Richard A Moore, Jr., U.S. Census Bureau, Washington, DC 20233 Abstract The 2002 Survey of Business Owners
Health Insurance Coverage in Oklahoma: 2008
 Health Insurance Coverage in Oklahoma: 2008 Results from the Oklahoma Health Care Insurance and Access Survey July 2009 The Oklahoma Health Care Authority (OHCA) contracted with the State Health Access
CHAPTER 3 POPULATION AND ECONOMIC CHARACTERISTICS
 CHAPTER 3 POPULATION AND ECONOMIC CHARACTERISTICS INTRODUCTION Population trends in La Vista and its respective planning jurisdiction serve as valuable indicators of future development needs and patterns
UNEMPLOYMENT RATES IMPROVING IN THE DISTRICT By Caitlin Biegler
 An Affiliate of the Center on Budget and Policy Priorities 820 First Street NE, Suite 460 Washington, DC 20002 (202) 408-1080 Fax (202) 408-8173 www.dcfpi.org UNEMPLOYMENT RATES IMPROVING IN THE DISTRICT
COMMUNITY ADVANTAGE PANEL SURVEY: DATA COLLECTION UPDATE AND ANALYSIS OF PANEL ATTRITION
 COMMUNITY ADVANTAGE PANEL SURVEY: DATA COLLECTION UPDATE AND ANALYSIS OF PANEL ATTRITION Technical Report: February 2012 By Sarah Riley HongYu Ru Mark Lindblad Roberto Quercia Center for Community Capital
HuffPost: GM job cuts
 1. Whose interests When President Trump makes decisions, do you think he generally is: Working for the interests of people like you 36% 39% 37% 34% 23% 24% 42% 52% 43% 5% 24% 27% Working against the interests
Saving and Investing Among High Income African-American and White Americans
 The Ariel Mutual Funds/Charles Schwab & Co., Inc. Black Investor Survey: Saving and Investing Among High Income African-American and Americans June 2002 1 Prepared for Ariel Mutual Funds and Charles Schwab
NANOS SURVEY. Canadians divided on changes to tax treatment of private corporations NANOS SURVEY
 Canadians divided on changes to tax treatment of private corporations National survey released October 2 nd, 2017 Project 2017-1082 Summary Canadians are largely split in saying whether the federal government
THE AP-GfK POLL December, 2013
 Public Affairs & Corporate Communications THE AP-GfK POLL December, 2013 Conducted by GfK Public Affairs & Corporate Communications A survey of the American general population (ages 18+) Interview dates:
COMMUNITY ADVANTAGE PANEL SURVEY: DATA COLLECTION UPDATE AND ANALYSIS OF PANEL ATTRITION
 COMMUNITY ADVANTAGE PANEL SURVEY: DATA COLLECTION UPDATE AND ANALYSIS OF PANEL ATTRITION Technical Report: March 2011 By Sarah Riley HongYu Ru Mark Lindblad Roberto Quercia Center for Community Capital
2015 SURVEY AND DIARY OF CONSUMER PAYMENT CHOICE WEIGHTING PROCEDURE (Marco Angrisani, USC, 2/1/2016)
") 2015 SURVEY AND DIARY OF CONSUMER PAYMENT CHOICE WEIGHTING PROCEDURE (Marco Angrisani, USC, 2/1/2016) 1. Sample Selection The UAS is a panel of US households recruited through Address Based Sampling (ABS).
2015 SURVEY AND DIARY OF CONSUMER PAYMENT CHOICE WEIGHTING PROCEDURE (Marco Angrisani, USC, 2/1/2016) 1. Sample Selection The UAS is a panel of US households recruited through Address Based Sampling (ABS).
EBRI Databook on Employee Benefits Appendix D: Explanation of Sources
 UPDATED JUNE 2009 EBRI Databook on Employee Benefits Appendix D: Explanation of Sources Current Population Survey (CPS) March CPS The March Supplement to the Current Population Survey (CPS), conducted
Effects of the Oregon Minimum Wage Increase
 Effects of the 1998-1999 Oregon Minimum Wage Increase David A. Macpherson Florida State University May 1998 PAGE 2 Executive Summary Based upon an analysis of Labor Department data, Dr. David Macpherson
Did households discover identity theft in previous 6 months?
 U.S. Department of Justice Office of Justice Programs Bureau of Justice Statistics Bulletin First Estimates from the National Crime Victimization Survey Identity Theft, 2004 April 2006, NCJ 212213 By Katrina
TECHNICAL REPORT NO. 11 (5 TH EDITION) THE POPULATION OF SOUTHEASTERN WISCONSIN PRELIMINARY DRAFT SOUTHEASTERN WISCONSIN REGIONAL PLANNING COMMISSION
 THE POPULATION OF SOUTHEASTERN WISCONSIN PRELIMINARY DRAFT SOUTHEASTERN WISCONSIN REGIONAL PLANNING COMMISSION") TECHNICAL REPORT NO. 11 (5 TH EDITION) THE POPULATION OF SOUTHEASTERN WISCONSIN PRELIMINARY DRAFT 208903 SOUTHEASTERN WISCONSIN REGIONAL PLANNING COMMISSION KRY/WJS/lgh 12/17/12 203905 SEWRPC Technical
TECHNICAL REPORT NO. 11 (5 TH EDITION) THE POPULATION OF SOUTHEASTERN WISCONSIN PRELIMINARY DRAFT 208903 SOUTHEASTERN WISCONSIN REGIONAL PLANNING COMMISSION KRY/WJS/lgh 12/17/12 203905 SEWRPC Technical
Harris Interactive. ACEP Emergency Care Poll
 ACEP Emergency Care Poll Table of Contents Background and Objectives 3 Methodology 4 Report Notes 5 Executive Summary 6 Detailed Findings 10 Demographics 24 Background and Objectives To assess the general
Trend Analysis of Changes to Population and Income in Philadelphia, using American Community Survey (ACS) Data
 Data") OFFICE OF THE PRESIDENT FINANCE AND BUDGET TEAM City Council of Philadelphia 9.22.17 Trend Analysis of Changes to Population and Income in Philadelphia, using 2010-2016 American Community Survey (ACS)
OFFICE OF THE PRESIDENT FINANCE AND BUDGET TEAM City Council of Philadelphia 9.22.17 Trend Analysis of Changes to Population and Income in Philadelphia, using 2010-2016 American Community Survey (ACS)
SDs from Regional Peer Group Mean. SDs from Size Peer Group Mean
 Family: Population Demographics Population Entire MSA 2414616 Central Cities (CC) 764431 Outside Central Cities 1650185 Percent of Entire MSA 31.66% Population in CC Percent Change in Population from 1999
SELECTED ECONOMIC CHARACTERISTICS American Community Survey 5-Year Estimates
 DP03 SELECTED ECONOMIC CHARACTERISTICS 2008-2012 American Community Survey 5-Year Estimates Supporting documentation on code lists, subject definitions, data accuracy, and statistical testing can be found
The Financial Burden of Medical Spending Among the Non-Elderly, 2010
 ACA Implementation Monitoring and Tracking The Financial Burden of Medical Spending Among the Non-Elderly, 2010 November 2012 Kyle J. Caswell Timothy Waidmann Linda J. Blumberg The Urban Institute INTRODUCTION
Medical Expenditure Panel Survey. Household Component Statistical Estimation Issues. Copyright 2007, Steven R. Machlin,
 Medical Expenditure Panel Survey Household Component Statistical Estimation Issues Overview Annual person-level estimates Overlapping panels Estimation variables Weights Variance Pooling multiple years
TABLE 1. PROFILE OF GENERAL DEMOGRAPHIC CHARACTERISTICS
 Waterloo city, Iowa TABLE 1. PROFILE OF GENERAL DEMOGRAPHIC CHARACTERISTICS Estimate Lower Bound Upper Bound Total population 66,659 64,093 69,225 SEX AND AGE Male 32,096 30,415 33,777 Female 34,563 33,025
Health Status, Health Insurance, and Health Services Utilization: 2001
 Health Status, Health Insurance, and Health Services Utilization: 2001 Household Economic Studies Issued February 2006 P70-106 This report presents health service utilization rates by economic and demographic
Poverty in the United Way Service Area
 Poverty in the United Way Service Area Year 4 Update - 2014 The Institute for Urban Policy Research At The University of Texas at Dallas Poverty in the United Way Service Area Year 4 Update - 2014 Introduction
THE CHORE WARS Household Bargaining and Leisure Time
 THE CHORE WARS Household Bargaining and Leisure Time Leora Friedberg University of Virginia and NBER Anthony Webb Center for Retirement Research, Boston College Motivation Can time use of spouses be explained
Virginia registered voters age 50+ support expanding Medicaid in the state.
 2013 AARP Survey of Virginia Registered Voters Age 50+ on Medicaid Expansion Virginia registered voters age 50+ support expanding Medicaid in the state. About two-thirds (64%) of Virginia registered voters
LONG ISLAND INDEX SURVEY CLIMATE CHANGE AND ENERGY ISSUES Spring 2008
 LONG ISLAND INDEX SURVEY CLIMATE CHANGE AND ENERGY ISSUES Spring 2008 Pervasive Belief in Climate Change but Fewer See Direct Personal Consequences There is broad agreement among Long Islanders that global
National Statistics Opinions and Lifestyle Survey Technical Report January 2013
 UK Data Archive Study Number 7388 Opinions and Lifestyle Survey, Well-Being Module, January, February, March and April, 2013 National Statistics Opinions and Lifestyle Survey Technical Report January 2013
July Sub-group Audiences Report
 July 2013 Sub-group Audiences Report SURVEY OVERVIEW Methodology Penn Schoen Berland completed 4,000 telephone interviews among the following groups between April 4, 2013 and May 3, 2013: Audience General
Health Insurance Coverage in 2014: Significant Progress, but Gaps Remain
 ACA Implementation Monitoring and Tracking Health Insurance Coverage in 2014: Significant Progress, but Gaps Remain September 2016 By Laura Skopec, John Holahan, and Patricia Solleveld With support from
THE AP-GfK POLL May, 2014
 Public Affairs & Corporate Communications THE AP-GfK POLL May, 2014 Conducted by GfK Public Affairs & Corporate Communications A survey of the American general population (ages 18+) Interview dates: May
Introduction to Current Population Survey (CPS) Hsueh-Sheng Wu Center for Family and Demographic Research November 14, 2016
 Hsueh-Sheng Wu Center for Family and Demographic Research November 14, 2016") Introduction to Current Population Survey (CPS) Hsueh-Sheng Wu Center for Family and Demographic Research November 14, 2016 1 Introduction Outline What is special about the CPS? Navigate CPS website Survey
Introduction to Current Population Survey (CPS) Hsueh-Sheng Wu Center for Family and Demographic Research November 14, 2016 1 Introduction Outline What is special about the CPS? Navigate CPS website Survey
Marist College Institute for Public Opinion Poughkeepsie, NY Phone Fax
 Marist College Institute for Public Opinion Poughkeepsie, NY 12601 Phone 845.575.5050 Fax 845.575.5111 www.maristpoll.marist.edu Fewer Americans Expect Tax Refund *** Complete Tables for Poll Appended
APPENDIX 6: CENSUS DATA BURLINGTON, VERMONT
 APPENDIX 6: CENSUS DATA BURLINGTON, VERMONT 2000 CENSUS DATA 2005-2007 AMERICAN COMMUNITY SURVEY Burlington city, Vermont - Fact Sheet - American FactFinder Page 1 of 2 FACT SHEET Burlington
PROBABILITY BASED INTERNET SURVEYS: A SYNOPSIS OF EARLY METHODS AND SURVEY RESEARCH RESULTS 1
 PROBABILITY BASED INTERNET SURVEYS: A SYNOPSIS OF EARLY METHODS AND SURVEY RESEARCH RESULTS 1 Vicki Huggins, Knowledge Networks and Joe Eyerman, Research Triangle Institute Abstract Successfully targeting
HEDIS CAHPS HEALTH PLAN SURVEY, ADULT AND CHILD Beneficiary Satisfaction Survey Results
 HEDIS CAHPS HEALTH PLAN SURVEY, ADULT AND CHILD 2017 Beneficiary Satisfaction Survey Results HEDIS CAHPS HEALTH PLAN SURVEY, ADULT AND CHILD 2017 Beneficiary Satisfaction Survey Results TABLE OF CONTENTS
Demographic and Economic Characteristics of Children in Families Receiving Social Security
 Each month, over 3 million children receive benefits from Social Security, accounting for one of every seven Social Security beneficiaries. This article examines the demographic characteristics and economic
University of Minnesota
 neighborhood profile October 2011 About this area The University neighborhood is bordered by 11th Avenue Southeast, University Avenue, 15th Avenue Southeast, the railroad tracks, Oak Street, and the Mississippi
HuffPost Daily Survey for August August 9-10, US Adults
 1. Job Approval Do you approve or disapprove of the way Donald Trump is handling his job as President? Strongly approve 23% 26% 20% 10% 15% 25% 41% 28% 8% 10% 16% Somewhat approve 17% 18% 16% 17% 17% 20%
Mid - City Industrial
 Minneapolis neighborhood profile October 2011 Mid - City Industrial About this area The Mid-City Industrial neighborhood is bordered by I- 35W, Highway 280, East Hennepin Avenue, and Winter Street Northeast.
Estimating Attrition Bias in the Year 9 Cohorts of the Longitudinal Surveys of Australian Youth: Technical Report No. 48
 Australian Council for Educational Research ACEReSearch LSAY Technical Reports Longitudinal Surveys of Australian Youth (LSAY) 4-2009 Estimating Attrition Bias in the Year 9 Cohorts of the Longitudinal
New Jersey economic issues poll April 5-14, 2018 Stockton Polling Institute Weighted frequencies
 New Jersey economic issues poll April 5-14, 2018 Stockton Polling Institute Weighted frequencies Q1. How would you rate the U.S. economy: Frequency Valid Valid Excellent 47 6.6 6.6 6.6 Good 302 42.1 42.1
The internet should remain as free from government regulation and taxation as possible. Please indicate how much you agree or disagree.
 Do you favor or oppose a sales tax in your state on items purchased online even if the store or individual you buy from is not located in your state? Favor 24% 24% 22% 25% 20% 22% 32% 26% Oppose 65% 66%
A Profile of the Working Poor, 2009
 Cornell University ILR School DigitalCommons@ILR Federal Publications Key Workplace Documents 3-2011 A Profile of the Working Poor, 2009 Bureau of Labor Statistics Follow this and additional works at:
A Profile of the Working Poor, 2000
 Cornell University ILR School DigitalCommons@ILR Federal Publications Key Workplace Documents 3-2002 A Profile of the Working Poor, 2000 Stephanie Boraas Bureau of Labor Statistics Follow this and additional
PSID Technical Report. Construction and Evaluation of the 2009 Longitudinal Individual and Family Weights. June 21, 2011
 PSID Technical Report Construction and Evaluation of the 2009 Longitudinal Individual and Family Weights June 21, 2011 Steven G. Heeringa, Patricia A. Berglund, Azam Khan University of Michigan, Ann Arbor,
Camden Industrial. Minneapolis neighborhood profile. About this area. Trends in the area. Neighborhood in Minneapolis.
 Minneapolis neighborhood profile October 2011 Camden Industrial About this area The Camden Industrial neighborhood is bordered by 48th Avenue North, the Mississippi River, Dowling Avenue North, Washington
MetLife Retirement Income. A Survey of Pre-Retiree Knowledge of Financial Retirement Issues
 MetLife Retirement Income IQ Study A Survey of Pre-Retiree Knowledge of Financial Retirement Issues June, 2008 The MetLife Mature Market Institute Established in 1997, the Mature Market Institute (MMI)
PPI ALERT November 2011
 PPI ALERT November 2011 50+ and Worried about Today and Tomorrow Older Americans Express Concerns about the State of the Economy and their Current and Future Financial Well-being In late August, 2011,
Shingle Creek. Minneapolis neighborhood profile. About this area. Trends in the area. Neighborhood in Minneapolis. October 2011
 neighborhood profile October 2011 About this area The neighborhood is bordered by 53rd Avenue North, Humboldt Avenue North, 49th Avenue North, and Xerxes Avenue North. It is home to Olson Middle School.
THE VALUE OF LABOR AND VALUING LABOR: The Effects of Employment on Personal Well-Being and Unions on Economic Well-Being
 FOR IMMEDIATE RELEASE THE VALUE OF LABOR AND VALUING LABOR: The Effects of Employment on Personal Well-Being and Unions on Economic Well-Being A Special Labor Day Report from the Life, Liberty, and Happiness
THE AP-GfK POLL October, 2013
 Public Affairs & Corporate Communications THE AP-GfK POLL October, 2013 Conducted by GfK Public Affairs & Corporate Communications A survey of the American general population (ages 18+) Interview dates:
Codebook: Weighted Frequencies from Main Survey (using WEIGHT2 for the entire sample)
") Codebook: Weighted Frequencies from Main Survey (using WEIGHT2 for the entire sample) QFLAG DATA ONLY: Qualification Flag 1 Qualified Frequency 100.0 QUOTA Quota 1 AGE 45-52 : 0 < RETMID / INCMID
Codebook: Weighted Frequencies from Main Survey (using WEIGHT2 for the entire sample) QFLAG DATA ONLY: Qualification Flag 1 Qualified Frequency 100.0 QUOTA Quota 1 AGE 45-52 : 0 < RETMID / INCMID
The Impact of Tracing Variation on Response Rates within Panel Studies
 The Impact of Tracing Variation on Response Rates within Panel Studies Christine Carr Jennifer Wallin Kathleen Considine Azot Derecho Sarah Harris Barbara Bibb RTI International is a trade name of Research