The American Panel Survey. Study Description and Technical Report Public Release 1 November 2013
|
|
|
- Benedict Griffith
- 5 years ago
- Views:
Transcription
1 The American Panel Survey Study Description and Technical Report Public Release 1 November 2013 Contents 1. Introduction 2. Basic Design: Address-Based Sampling 3. Stratification 4. Mailing Size 5. Design Effect 6. Stratum Weight 7. Landline Telephone Match Weight 8. Eligible Adults Within Household Weight 9. The Base Weight 10. Post-Stratification Weighting 11. Two Post-Stratification Weights 12. Imputation 13. Demographics by Recruitment Cohort (Comparison with CPS) 14. Demographics by Survey Month, Selected Months 15. e Calculation by Recruitment Cohort 16. Selected Screen Shots of Online Questionnaire 1. Introduction The first American Panel Survey (TAPS) panel was recruited in the fall of The first survey (S1) occurred in November-December Surveys are numbered S1, S2, and so on. Each survey, S2 and thereafter, was fielded during a calendar month, starting during the first week of a month and completed in the first week of the next month. 2. Basic Design: Address-Based Sampling TAPS is designed to be representative of the U.S. population of adults. Survey results, properly weighted, are generalizable within a known margin of error. The sample design and the recruitment methods are based on the GfK/Knowledge Networks (GfK/KN) experience using residential address samples for the mail recruitment of GfK/KN KnowledgePanel members. TAPS is designed to have approximately 2,000+ members by recruiting one person per household through a mail sample. The frame for the sample of addresses is the U.S. Postal Service s computerized delivery sequence file (CDSF). Marketing Systems Group (MSG), is a sample vendor licensed to work with this file and from whom this sample was purchased. The CDSF covers some 97% of the physical addresses in all fifty states including P.O. boxes and rural route addresses. Homes that are vacant or
2 seasonal are identified as are other categories that help to refine the efficiency of the sample to be mailed. Using data from available U.S. Census files plus from a variety of commercial data bases, such as White Pages, Experian, Acxiom, etc., MSG adds names to these addresses, match with landline telephone numbers, and with some level of accuracy append information regarding race/ethnicity, age of householder, whether there are people of a certain age in the household, presence of children, home ownership status, etc. It should be pointed out that there is also some proportion of missing information, for example unknown age, in these databases. In order to have better control over the response of more difficult groups to recruit, the sample can be stratified using this appended or ancillary information. During 2010, GfK/KN experimented with this ancillary information to understand how well it predicts based on actual mail recruitment data used with KnowledgePanel. The GfK/KN stratification used for KnowledgePanel was used for the TAPS recruitment sample. 3. Stratification The sampling strata are designed to specifically target young adults (ages 18-24) and also Hispanic persons in addition to the balance of the population. In this way, young adults and Hispanics have been modestly oversampled to offset their known tendency to under-respond to surveys. Because age and Hispanic ethnicity are not mutually exclusive groupings, the strata are classified as follows: year-old Hispanic adults 2. All other Hispanic adults ages 25+ or age unknown year-old non-hispanic adults 4. All other adults that are non-hispanic or ethnicity unknown and ages 25+ or age unknown 2
3 4. Mailing Size Using estimated yield and profile rates, Table 1 shows the size of the mailing for each stratum (column A), the yields (column B) and the expected resultant sample sizes (column C). A modest oversample of the two young adult strata (#1 and #3) was fielded. This is shown in column D showing the sample distribution compared to the distribution of the sample frame (data provided by MSG). Table 1. Recruitment Sample Design Stratum A. Mailing B. Yields C. Profiled D. Strata Distributions Percent Count Proportion Count Proportion Count Sample % Frame % Hispanic Hispanic 25+/unk Other All Else 25+/unk , , ,816 3,081 2, Design Effect Based on the strata population distributions in the CDSF frame tagged with ancillary information, the sample distribution to recruit exactly 2,003 panel members (see column D in Table 1 above) has a very low design effect of This is due to the very mild oversampling of young adults. A perfect simple random sample has a design effect of The actual design effect depends on the reported demographic information from the profiled sample. 3
4 6. Stratum Weight Due to the stratified sample design, cases from each stratum are adjusted in their base weight in order to return the actual mailed sample distribution (n=38,000, design effect 1.07) to the same distribution as existing in the frame. This corrects cases for the stratum-specific selection probability associated with the sample design. Table 2 shows the relevant stratum selection probabilities and weights necessary to make this adjustment. The stratum weight is called weight1 (1). Table 2. Recruitment Stratum Weight Stratum (a) Frame % (b) Mailed sample count (c) Mailed sample % (d) Selection probability (c/a) Stratum weight (1/d) Hispanic Hispanic 5+/unk , Other Other Else 5+/unk , , Landline Telephone Match Weight For all addresses in the sample, MSG searched available databases to match a landline telephone number to the exact address. The telephone numbers were used to do an interviewer administrated telephone recruitment among nonresponding households. Thus, non-responders with a landline match had a higher chance of being recruited due to this telephone effort. To correct for this increased probability of recruitment due to this out-bound calling effort, the final cases, weighted by 1 were then corrected to reflect the original sample s proportion of landline match within stratum and across strata (see Table 3). This now corrected weight is called weight2 (2). Table 3. Percent Telephone Match by Stratum Stratum No Match Match Hispanic Hispanic 5+/unk Other Other Else 5+/unk Overall
5 8. Eligible Adults within Household Weight Each household had varying numbers of eligible adults from among which one was randomly selected to be recruited onto the TAPS. Persons from households with one or two adults are more likely to be represented in the sample, especially one-adult households. To correct for this increased selection probability from among one-adult households, a weight was calculated to adjust for selection from one-adult, two-adult and three or more-adult households. In the final sample, 34.4% were from one-adult households, 52.5% from two-adult households and 13.1% from households with three or more eligible adults. [Note: 34 cases had the number of eligible adults as missing or refused so a random imputation routine was used to assign an eligible adults number to these households.] Thus, multiplying 2 by 1, 2, or 3 corresponding for the eligible adult number, a final or weight3 (3) results for each case. 9. The Base Weight This 3 from the above step is then scaled to sum to the total number of cases recruited on the panel. The scaled 3 is now the base weight (basewt) for each case and will be the starting weight for the post stratification weighting procedure. Summary of Study Base Weight Components: 1: : basewt: (this is a scaled 3 so the design effect is identical to 3) 10. Post-Stratification Weighting When the full panel is assigned a survey, respondents completing the survey will undergo a post-stratification (PS) weighting that will use each respondent s base weight as their starting weight. The purpose of this PS weighting is to make survey respondents representative of the non-institutionalized U.S. adult population. The PS weighting adjusts for non-response by weighting all completed interviews to national benchmarks. Demographic and geographic distributions for the population ages 18+ from the most recent Current Population Surveys (CPS) are used as benchmarks for this adjustment. Some benchmark distributions come from the monthly CPS estimates and some come from special supplemental CPS estimates. 5
6 A description of the post-stratification process follows, using the January 2012 TAPS survey as an example. The same process is used for each monthly TAPS survey. Data weighting in January 2012 are weighted on the following variables and use the benchmark sources as shown: Benchmarks Source: December 2011 CPS Gender (Male/Female) by Age (18-29, 30-44, 45-59, and 60+) Race/Hispanic ethnicity (White/Non-Hispanic, Black/Non-Hispanic, Other/Non-Hispanic, 2+ Races/Non-Hispanic, Hispanic) Education (Less than High School, High School, Some College, Bachelor and higher) Census Region (Northeast, Midwest, South, West) by Metropolitan Area (Yes, No) Benchmarks Source: March 2011 CPS Annual Social and Economic Supplement (ASEC) Household Income (Under $10,000, $10,000-$29,999, $30,000-$49,999, $50,000-$79,999, $80,000-$99,999, $100,000 or more) Benchmarks Source: October 2010 CPS Supplement, Computer Use and Access Module Internet Access (Yes, No) Comparable distributions are calculated using all January completed cases (n=1,609) from the TAPS using a SAS raking procedure. This procedure adjusts the completed sample data to the selected benchmark proportions through an iterative convergence process. The weighted sample data are optimally fitted to the marginal benchmark distributions. 11. Two Post-Stratification Weights Two sets of weights were produced. One set included all of the weighting variables and the second set excluded the Internet Access adjustment. The purpose of excluding this adjustment was to lower the design effect and reduce the range of the weights. The final resulting distribution of each of the calculated weights were examined to identify and trim outliers (windsorized) at the extreme upper and lower tails of the weight distribution. The final trimmed weights for each of the two sets of weights align with the benchmark distributions within a tolerance of no more than 2 percentage points. The post-stratified and trimmed weights make up the final, single study weight. This weight in the data file is called jan2012wt1 for the adjustments that include Internet Access and jan2012wt2 when Internet Access is excluded. 6
7 Given these final weights (W), a design effect (Deffest) can be calculated for each set of weights that is the ratio of the average weights to the average of the weights. The formula for that estimation is: Deffest=[ Wi 2 )/n] / [( Wi)/n], where n = final sample size When using weights that are scaled to sample size n, this formula is simplified to the ratio of the sum of the squared weights to the sum of the weights: Deffest= Wi 2 / Wi. The survey design effect is used to adjust standard errors to reflect the deviation of this weighted complex sample design from those of simple random sample. Summary of the Final Weights Trimming (at low and high percentile): jan2012wt1: (0.99%, 99.01%) jan2012wt2: (0.87%, 99.13%) Design Effect: jan2012wt1: jan2012wt2: Imputation Imputation is a group of methods used to substitute plausible values for values that are missing in a data set. Missing values are rarely missing completely at random (MCAR). Missing values lead to less efficient estimations as many statistical techniques drop incomplete cases. With cases dropped, the estimates are then based on a smaller sample of respondents and, given that these dropped cases are not MCAR, this smaller subsample is likely to produce skewed estimates. Since we want to use the information contributed by all the cases in a study, as a minimum we must have no missing data in the variables to be used for weighting. With missing data, these cases cannot be weighted and thus cannot be used. For the TAPS panel members, some portion of the cases were missing some of the data essential for weighting and thus an imputation method was employed to resolve this problem so that the maximum number of cases could be used. Hot deck imputation. Imputation for The American Panel Survey (TAPS) was undertaken using the hot deck imputation method. The hot deck imputation method is a technique where respondents with missing values are matched to respondents who have identical values on other, correlated variables. If more than one match is found, the matching respondent is chosen at random. The missing value is then 7
8 replaced with the value of the variable given by the matched respondent. This hot deck imputation was achieved using SOLAS for Missing Data Analysis software. Panel data imputation. The following variables contain imputed values in the original dataset: Hispanic ethnicity, race, age categorization, labor force status, marital status, housing ownership, gender, education and income. Respondents who had missing information on all, or all but one, of the variables used for weighting were dropped from the dataset (6 cases). Table A indicates the number of missing values once these 6 cases were dropped (n=2,128). The variables identified with an asterisk are those used in weighting. The variables used to match respondents for each of the imputed variables are given in Table B. The matching is done in the order in which variables are presented in the table. For example, the age categorization is matched first on parental status and then on being a student. A series of variables are included in the dataset to inform the user whether the respondent has an imputed value on any particular dimension. These variable names begin with ii. Similarly, the oo series of variables give the original values of the variables. Table A. Frequency of Missing Values in Variables Selected for Imputation Variables Imputed # of Missing Values % of Missing Values Hispanic ethnicity* Race* Age category* Labor force status Marital status Home ownership Gender* Education* Income* Table B. Variables Used in Hot Deck Matching Process Variables Imputed Variables Used to Match Respondents Hispanic ethnicity sampling strata Race Hispanic ethnicity Age category parental status, student status Labor force status labor force status Marital status age category Home ownership marital status Gender labor force status Education labor force status Income education, home ownership, marital status, labor force status 8
9 13. Demographics by Recruitment Cohort (Comparison with CPS) Cohort 1 Fall 2011 Cohort 2 June 2012 Cohort 3 January 2013 Category Level Cohorts CPS Feb '13 Total Profile Cohort 1 Cohort 2 Cohort Age and over Gender Race Male Female White, NH Black, NH Other, NH Hispanic Races, NH Education Less than HS High School Some College Bachelor's Degree or More N
10 14. Demographics by Survey Month, Selected Months Category Level Benchmark Month (Survey #) Age CPS Feb '13 Jan '12 (S2) Jul '12 (S8) Nov '12 (S12) and over Gender Race Education Male Female White, NH Black, NH Other, NH Hispanic Races, NH Less than HS High School Some College Bachelor's Degree or More Panel Size Completion Rate 77% 82% 83% 10
11 15. e Calculation by Recruitment Cohort Initial Recruitment Category Cohorts Cohort 1 Cohort 2 Cohort 1-2 Completed Refused Ineligible Unknown Eligibility e calculation Saw Mail Packet 30.2% 27.1% 29.7% Read Mail Packet 87.1% 68.5% 84.4% Total Saw/Read (e) 26.3% 18.6% 25.1% 11

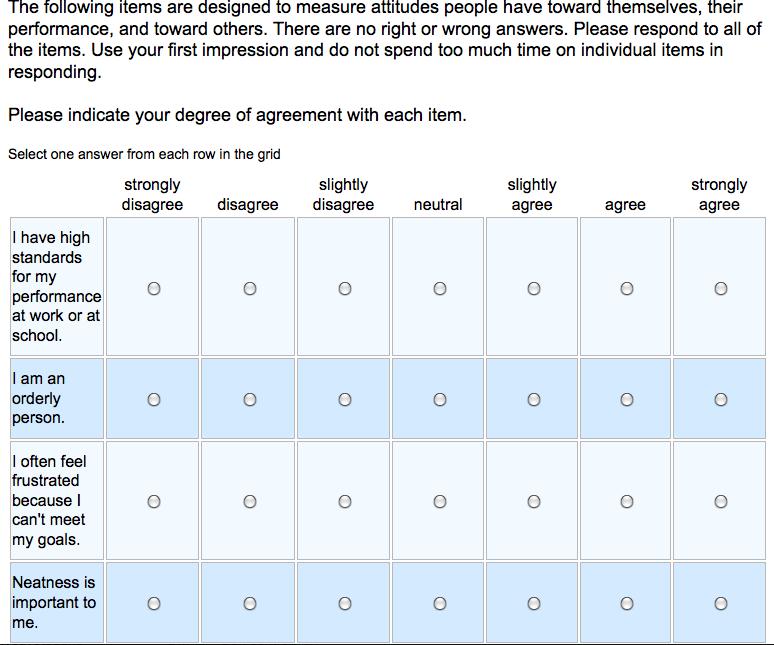
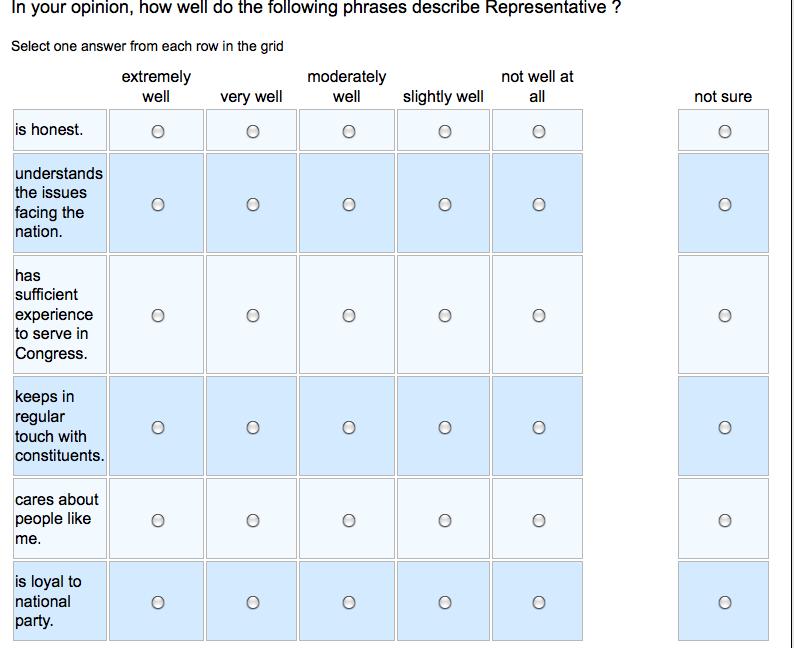
12 16. Selected Screen Shots of Online Questionnaire 12
13 13
14 14

15 15
Guide for Investigators. The American Panel Survey (TAPS)
") Draft (to be updated in January) Guide for Investigators The American Panel Survey (TAPS) Weidenbaum Center Washington University Steven S. Smith, Director About The American Panel Survey (TAPS) TAPS is
Draft (to be updated in January) Guide for Investigators The American Panel Survey (TAPS) Weidenbaum Center Washington University Steven S. Smith, Director About The American Panel Survey (TAPS) TAPS is
Notes On Weights, Produced by Knowledge Networks, Amended by the Stanford Research Team, Applicable to Version 2.0 of the data.
 Notes On Weights, Produced by Knowledge Networks, Amended by the Stanford Research Team, Applicable to Version 2.0 of the data. Sample Weighting The design for a KnowledgePanel SM sample begins as an equal
THE VALUE OF AN INVESTMENT & INSURANCE CUSTOMER TO A BANK
 THE VALUE OF AN INVESTMENT & INSURANCE CUSTOMER TO A BANK 2012 by Strategic Business Insights and K&C Partners. Unauthorized use or reproduction prohibited. TABLE OF CONTENTS THE VALUE OF AN INVESTMENT
Survey Information and Methodology. Introduction
 Survey Information and Methodology Introduction Knowledge Networks conducted a study on different aspects of retirement on behalf of the Center for Retirement Research at Boston College. Specifically,
Introduction to Survey Weights for National Adult Tobacco Survey. Sean Hu, MD., MS., DrPH. Office on Smoking and Health
 Introduction to Survey Weights for 2009-2010 National Adult Tobacco Survey Sean Hu, MD., MS., DrPH Office on Smoking and Health Presented to Webinar January 18, 2012 National Center for Chronic Disease
Random Group Variance Adjustments When Hot Deck Imputation Is Used to Compensate for Nonresponse 1
 Random Group Variance Adjustments When Hot Deck Imputation Is Used to Compensate for Nonresponse 1 Richard A Moore, Jr., U.S. Census Bureau, Washington, DC 20233 Abstract The 2002 Survey of Business Owners
1 PEW RESEARCH CENTER
 1 Methodology This report is drawn from a survey conducted as part of the American Trends Panel (ATP), a nationally representative panel of randomly selected U.S. adults living in households recruited
1 PEW RESEARCH CENTER
 1 Methodology The American Trends Panel (ATP), created by Pew Research Center, is a nationally representative panel of randomly selected U.S. adults recruited from landline and cellphone random-digit-dial
ASSOCIATED PRESS-LIFEGOESSTRONG.COM BOOMERS SURVEY CONDUCTED BY KNOWLEDGE NETWORKS March 16, 2011
 1350 Willow Rd, Suite 102 Menlo Park, CA 94025 www.knowledgenetworks.com Interview dates: March 04 March 13, 2011 Interviews: 1,490 adults, including 1,160 baby boomers Sampling margin of error for a 50%
ASSOCIATED PRESS-LIFEGOESSTRONG.COM BOOMERS SURVEY OCTOBER 2011 CONDUCTED BY KNOWLEDGE NETWORKS October 14, 2011
 2100 Geng Road Suite 100 Palo Alto, CA 94303 www.knowledgenetworks.com Interview dates: October 5 October 12, 2011 Interviews: 1,410 adults; 1,095 boomers Sampling margin of error for a 50% statistic with
Results from the 2009 Virgin Islands Health Insurance Survey
 2009 Report to: Bureau of Economic Research Office of the Governor St. Thomas, US Virgin Islands Ph 340.714.1700 Prepared by: State Health Access Data Assistance Center University of Minnesota School of
2015 SURVEY AND DIARY OF CONSUMER PAYMENT CHOICE WEIGHTING PROCEDURE (Marco Angrisani, USC, 2/1/2016)
") 2015 SURVEY AND DIARY OF CONSUMER PAYMENT CHOICE WEIGHTING PROCEDURE (Marco Angrisani, USC, 2/1/2016) 1. Sample Selection The UAS is a panel of US households recruited through Address Based Sampling (ABS).
2015 SURVEY AND DIARY OF CONSUMER PAYMENT CHOICE WEIGHTING PROCEDURE (Marco Angrisani, USC, 2/1/2016) 1. Sample Selection The UAS is a panel of US households recruited through Address Based Sampling (ABS).
Evaluation of the Current Weighting Methodology for BRFSS and Improvement Alternatives (Abstract #309160) Joint Statistical Meetings July 31, 2007
 Joint Statistical Meetings July 31, 2007") Evaluation of the Current Weighting Methodology for BRFSS and Improvement Alternatives (Abstract #309160) Joint Statistical Meetings July 31, 2007 Mansour Fahimi, Darryl Creel, and Paul Levy RTI International
Evaluation of the Current Weighting Methodology for BRFSS and Improvement Alternatives (Abstract #309160) Joint Statistical Meetings July 31, 2007 Mansour Fahimi, Darryl Creel, and Paul Levy RTI International
The Economist/YouGov Poll
 Interviewing: Sample: 1500 Adults nationwide online 1004 registered voters nationwide online Weekly Tracking For immediate release 2 1. Presidential Job Approval Historical Do you approve or disapprove
How Couples Meet and Stay Together Project
 How Couples Meet and Stay Together Project Overview Knowledge Networks conducted a study focusing on how couples meet and do or do not stay together, on behalf of Stanford University. The study included
PERCEPTIONS OF EXTREME WEATHER AND CLIMATE CHANGE IN VIRGINIA
 PERCEPTIONS OF EXTREME WEATHER AND CLIMATE CHANGE IN VIRGINIA A STATEWIDE SURVEY OF ADULTS Edward Maibach, Brittany Bloodhart, and Xiaoquan Zhao July 2013 This research was funded, in part, by the National
Comparative Study of Electoral Systems (CSES) Module 4: Design Report (Sample Design and Data Collection Report) September 10, 2012
 Module 4: Design Report (Sample Design and Data Collection Report) September 10, 2012") Comparative Study of Electoral Systems 1 Comparative Study of Electoral Systems (CSES) (Sample Design and Data Collection Report) September 10, 2012 Country: Norway Date of Election: September 8-9 th 2013
Comparative Study of Electoral Systems 1 Comparative Study of Electoral Systems (CSES) (Sample Design and Data Collection Report) September 10, 2012 Country: Norway Date of Election: September 8-9 th 2013
Technical Report. Panel Study of Income Dynamics PSID Cross-sectional Individual Weights,
 Technical Report Panel Study of Income Dynamics PSID Cross-sectional Individual Weights, 1997-2015 April, 2017 Patricia A. Berglund, Wen Chang, Steven G. Heeringa, Kate McGonagle Survey Research Center,
Survey of Household Economics and Decisionmaking
 SHED Survey of Household Economics and Decisionmaking Jeff Larrimore Consumer & Community Development Research Division of Consumer & Community Affairs The analysis and conclusions set forth in this presentation
Health Insurance Coverage in Oklahoma: 2008
 Health Insurance Coverage in Oklahoma: 2008 Results from the Oklahoma Health Care Insurance and Access Survey July 2009 The Oklahoma Health Care Authority (OHCA) contracted with the State Health Access
GTSS. Global Adult Tobacco Survey (GATS) Sample Weights Manual
 Sample Weights Manual") GTSS Global Adult Tobacco Survey (GATS) Sample Weights Manual Global Adult Tobacco Survey (GATS) Sample Weights Manual Version 2.0 November 2010 Global Adult Tobacco Survey (GATS) Comprehensive Standard
GTSS Global Adult Tobacco Survey (GATS) Sample Weights Manual Global Adult Tobacco Survey (GATS) Sample Weights Manual Version 2.0 November 2010 Global Adult Tobacco Survey (GATS) Comprehensive Standard
Benchmark Report for the 2008 American National Election Studies Time Series and Panel Study. ANES Technical Report Series, no. NES
 Benchmark Report for the 2008 American National Election Studies Time Series and Panel Study ANES Technical Report Series, no. NES012493 Summary This report compares estimates the 2008 ANES studies to
Survey Methodology Overview 2016 Central Minnesota Community Health Survey Benton, Sherburne, & Stearns Counties
 C E N T R A L M I N N E S O TA Community Health Survey In partnership with: Benton County, CentraCare Health, Fairview Northland Medical Center, Sherburne County, Stearns County and United Way Survey Methodology
HuffPost: Midterm elections March 23-26, US Adults
 1. Following midterm election news How closely have you been following news about the 2018 midterm elections? Gender Age (4 category) Race (4 category) Total Male Female 18-29 30-44 45-64 65+ White Black
Thanksgiving, the Economy, & Consumer Behavior November 15-18, 2013
 Thanksgiving, the Economy, & Consumer Behavior November 15-18, 2013 Page 1 Sept 13-16, 2013 Table of Contents EXECUTIVE SUMMARY... 4 TOPLINE... 6 DEMOGRAPHICS... 9 CROSS-TABS... 10 Prospective Economic
Appendix A: Detailed Methodology and Statistical Methods
 Appendix A: Detailed Methodology and Statistical Methods I. Detailed Methodology Research Design AARP s 2003 multicultural project focuses on volunteerism and charitable giving. One broad goal of the project
Survey Methodology. Methodology Wave 1. Fall 2016 City of Detroit. Detroit Metropolitan Area Communities Study [1]
![Survey Methodology. Methodology Wave 1. Fall 2016 City of Detroit. Detroit Metropolitan Area Communities Study [1]](/thumbs/86/93833718.jpg "Survey Methodology. Methodology Wave 1. Fall 2016 City of Detroit. Detroit Metropolitan Area Communities Study [1]") Survey Methodology Methodology Wave 1 Fall 2016 City of Detroit Detroit Metropolitan Area Communities Study [1] Methodology Wave 1 I. SUMMARY Wave 1 of the Detroit Metropolitan Area Communities Study includes
Survey Methodology Methodology Wave 1 Fall 2016 City of Detroit Detroit Metropolitan Area Communities Study [1] Methodology Wave 1 I. SUMMARY Wave 1 of the Detroit Metropolitan Area Communities Study includes
Comparative Study of Electoral Systems (CSES) Module 4: Design Report (Sample Design and Data Collection Report) September 10, 2012
 Module 4: Design Report (Sample Design and Data Collection Report) September 10, 2012") Comparative Study of Electoral Systems 1 Comparative Study of Electoral Systems (CSES) (Sample Design and Data Collection Report) September 10, 2012 Country: Sweden Date of Election: 2014-09-14 Prepared
Comparative Study of Electoral Systems 1 Comparative Study of Electoral Systems (CSES) (Sample Design and Data Collection Report) September 10, 2012 Country: Sweden Date of Election: 2014-09-14 Prepared
Community Survey on ICT usage in households and by individuals 2010 Metadata / Quality report
 HH -p1 EU T H I S P L A C E C A N B E U S E D T O P L A C E T H E N S I N A M E A N D L O G O Community Survey on ICT usage in households and by 2010 Metadata / Quality report Please read this first!!!
Considerations for Sampling from a Skewed Population: Establishment Surveys
 Considerations for Sampling from a Skewed Population: Establishment Surveys Marcus E. Berzofsky and Stephanie Zimmer 1 Abstract Establishment surveys often have the challenge of highly-skewed target populations
Survey Project & Profile
 Survey Project & Profile Title: Survey Organization: Sponsor: Indiana K-12 & School Choice Survey Braun Research Incorporated (BRI) The Foundation for Educational Choice Interview Dates: November 12-17,
CYPRUS FINAL QUALITY REPORT
 CYPRUS FINAL QUALITY REPORT STATISTICS ON INCOME AND LIVING CONDITIONS 2010 CONTENTS Page PREFACE... 6 1. COMMON LONGITUDINAL EUROPEAN UNION INDICATORS 1.1. Common longitudinal EU indicators based on the
BZComparative Study of Electoral Systems (CSES) Module 3: Sample Design and Data Collection Report June 05, 2006
 Module 3: Sample Design and Data Collection Report June 05, 2006") Comparative Study of Electoral Systems 1 BZComparative Study of Electoral Systems (CSES) Module 3: Sample Design and Data Collection Report June 05, 2006 Country: NORWAY Date of Election: SEPTEMBER 12,
Comparative Study of Electoral Systems 1 BZComparative Study of Electoral Systems (CSES) Module 3: Sample Design and Data Collection Report June 05, 2006 Country: NORWAY Date of Election: SEPTEMBER 12,
THE AP-GfK POLL July, 2015
 Public Affairs & Corporate Communications THE AP-GfK POLL July, 2015 Conducted by GfK Public Affairs & Corporate Communications A survey of the American general population (ages 18+) Interview dates: July
CHAPTER 2 PROJECTIONS OF EARNINGS AND PREVALENCE OF DISABILITY ENTITLEMENT
 CHAPTER 2 PROJECTIONS OF EARNINGS AND PREVALENCE OF DISABILITY ENTITLEMENT I. INTRODUCTION This chapter describes the revised methodology used in MINT to predict the future prevalence of Social Security
Massachusetts Household Survey on Health Insurance Status, 2007
 Massachusetts Household Survey on Health Insurance Status, 2007 Division of Health Care Finance and Policy Executive Office of Health and Human Services Massachusetts Household Survey Methodology Administered
November 1, 2010 I. Survey Methodology Selection of Households
 November 1, 2010 I. Survey Methodology The Elon University Poll is conducted using a stratified random sample of households with telephones and wireless telephone numbers in the population of interest
Health Status, Health Insurance, and Health Services Utilization: 2001
 Health Status, Health Insurance, and Health Services Utilization: 2001 Household Economic Studies Issued February 2006 P70-106 This report presents health service utilization rates by economic and demographic
CYPRUS FINAL QUALITY REPORT
 CYPRUS FINAL QUALITY REPORT STATISTICS ON INCOME AND LIVING CONDITIONS 2008 CONTENTS Page PREFACE... 6 1. COMMON LONGITUDINAL EUROPEAN UNION INDICATORS 1.1. Common longitudinal EU indicators based on the
THE AP-GfK POLL October, 2013
 Public Affairs & Corporate Communications THE AP-GfK POLL October, 2013 Conducted by GfK Public Affairs & Corporate Communications A survey of the American general population (ages 18+) Interview dates:
CYPRUS FINAL QUALITY REPORT
 CYPRUS FINAL QUALITY REPORT STATISTICS ON INCOME AND LIVING CONDITIONS 2009 CONTENTS Page PREFACE... 6 1. COMMON LONGITUDINAL EUROPEAN UNION INDICATORS 1.1. Common longitudinal EU indicators based on the
Redistribution under OASDI: How Much and to Whom?
 9 Redistribution under OASDI: How Much and to Whom? Lee Cohen, Eugene Steuerle, and Adam Carasso T his chapter presents the results from a study of redistribution in the Social Security program under current
GLOBAL WARMING NATIONAL POLL RESOURCES FOR THE FUTURE NEW YORK TIMES STANFORD UNIVERSITY. Conducted by SSRS
 GLOBAL WARMING NATIONAL POLL RESOURCES FOR THE FUTURE NEW YORK TIMES STANFORD UNIVERSITY Conducted by SSRS Interview dates: January 7-22, 2015 Interviews: 1006 adults nationwide 1,006 adults nationwide
THE AP-GfK POLL May, 2014
 Public Affairs & Corporate Communications THE AP-GfK POLL May, 2014 Conducted by GfK Public Affairs & Corporate Communications A survey of the American general population (ages 18+) Interview dates: May
Internet Appendix. The survey data relies on a sample of Italian clients of a large Italian bank. The survey,
 Internet Appendix A1. The 2007 survey The survey data relies on a sample of Italian clients of a large Italian bank. The survey, conducted between June and September 2007, provides detailed financial and
Credit history Bad credit history can discourage an individual s chances of being approved for a loan.
 history Bad credit history can discourage an individual s chances of being approved for a loan. Collateral This is any asset that can be converted to a cash value that can be used to secure a loan. Collateral
FINAL QUALITY REPORT EU-SILC
 NATIONAL STATISTICAL INSTITUTE FINAL QUALITY REPORT EU-SILC 2006-2007 BULGARIA SOFIA, February 2010 CONTENTS Page INTRODUCTION 3 1. COMMON LONGITUDINAL EUROPEAN UNION INDICATORS 3 2. ACCURACY 2.1. Sample
Americans' Views on Healthcare Costs, Coverage and Policy
 Americans' Views on Healthcare Costs, Coverage and Policy Conducted by at the University of Chicago with funding from The West Health Institute Interviews: 1,302 adults Margin of error: +/- 3.8 percentage
VARIANCE ESTIMATION FROM CALIBRATED SAMPLES
 VARIANCE ESTIMATION FROM CALIBRATED SAMPLES Douglas Willson, Paul Kirnos, Jim Gallagher, Anka Wagner National Analysts Inc. 1835 Market Street, Philadelphia, PA, 19103 Key Words: Calibration; Raking; Variance
The coverage of young children in demographic surveys
 Statistical Journal of the IAOS 33 (2017) 321 333 321 DOI 10.3233/SJI-170376 IOS Press The coverage of young children in demographic surveys Eric B. Jensen and Howard R. Hogan U.S. Census Bureau, Washington,
The Relationship between Psychological Distress and Psychological Wellbeing
 The Relationship between Psychological Distress and Psychological Wellbeing - Kessler 10 and Various Wellbeing Scales - The Assessment of the Determinants and Epidemiology of Psychological Distress (ADEPD)
Fact Sheet. Health Insurance Coverage in Minnesota, Early Results from the 2009 Minnesota Health Access Survey. February, 2010
 Fact Sheet February, 2010 Health Insurance Coverage in Minnesota, Early Results from the 2009 Minnesota Health Access Survey The Minnesota Department of Health and the University of Minnesota School of
Weighting Survey Data: How To Identify Important Poststratification Variables
 Weighting Survey Data: How To Identify Important Poststratification Variables Michael P. Battaglia, Abt Associates Inc.; Martin R. Frankel, Abt Associates Inc. and Baruch College, CUNY; and Michael Link,
1 Preface. Sample Design
 1 Preface This volume contains the full computer tabulations for the 2017 Half 1 (H1) Technology Tracker study, which has been run by Saville Rossiter-Base on behalf of Ofcom. The objective of the survey
National Financial Well- Being Survey
 September 2017 National Financial Well- Being Survey Public Use File User s Guide Table of contents Table of contents... 1 1. Introduction... 2 2. Description of the survey... 5 2.1 National Financial
The August 2018 AP-NORC Center Poll
 The August 2018 Center Poll Conducted by The Associated Press-NORC Center for Public Affairs Research With funding from The Associated Press and NORC at the University of Chicago Interviews: 1,055 adults
Chartpack Examining Sources of Supplemental Insurance and Prescription Drug Coverage Among Medicare Beneficiaries: August 2009
 Chartpack Examining Sources of Supplemental Insurance and Prescription Drug Coverage Among Medicare Beneficiaries: Findings from the Medicare Current Beneficiary Survey, 2007 August 2009 This chartpack
THE AP-GfK POLL December, 2013
 Public Affairs & Corporate Communications THE AP-GfK POLL December, 2013 Conducted by GfK Public Affairs & Corporate Communications A survey of the American general population (ages 18+) Interview dates:
PROBABILITY BASED INTERNET SURVEYS: A SYNOPSIS OF EARLY METHODS AND SURVEY RESEARCH RESULTS 1
 PROBABILITY BASED INTERNET SURVEYS: A SYNOPSIS OF EARLY METHODS AND SURVEY RESEARCH RESULTS 1 Vicki Huggins, Knowledge Networks and Joe Eyerman, Research Triangle Institute Abstract Successfully targeting
THE AP-GfK POLL December, 2013
 Public Affairs & Corporate Communications THE AP-GfK POLL December, 2013 Conducted by GfK Public Affairs & Corporate Communications A survey of the American general population (ages 18+) Interview dates:
Comparative Study of Electoral Systems (CSES) Module 4: Design Report (Sample Design and Data Collection Report) September 10, 2012
 Module 4: Design Report (Sample Design and Data Collection Report) September 10, 2012") Comparative Study of Electoral Systems 1 Comparative Study of Electoral Systems (CSES) (Sample Design and Data Collection Report) September 10, 2012 Country: France Date of Election: April, 22 nd 2012
Comparative Study of Electoral Systems 1 Comparative Study of Electoral Systems (CSES) (Sample Design and Data Collection Report) September 10, 2012 Country: France Date of Election: April, 22 nd 2012
NJ SPOTLIGHT ON CITIES 2016 CONFERENCE SPECIAL:
 NJ SPOTLIGHT ON CITIES 2016 CONFERENCE SPECIAL: NEW JERSEYANS HAVE MIXED VIEWS ON NJ CITIES, BELIEVE SCHOOL FUNDING LAWS HAVE HAD LITTLE IMPACT IN LOCAL OR URBAN DISTRICTS and NJ Spotlight October 2016
PART B Details of ICT collections
 PART B Details of ICT collections Name of collection: Household Use of Information and Communication Technology 2006 Survey Nature of collection If possible, use the classification of collection types
A Stratified Sampling Plan for Billing Accuracy in Healthcare Systems
 A Stratified Sampling Plan for Billing Accuracy in Healthcare Systems Jirachai Buddhakulsomsiri Parthana Parthanadee Swatantra Kachhal Department of Industrial and Manufacturing Systems Engineering The
THE AP-GfK POLL July, 2014
 Public Affairs & Corporate Communications THE AP-GfK POLL July, 2014 Conducted by GfK Public Affairs & Corporate Communications A survey of the American general population (ages 18+) Interview dates: July
Central Statistical Bureau of Latvia FINAL QUALITY REPORT RELATING TO EU-SILC OPERATIONS
 Central Statistical Bureau of Latvia FINAL QUALITY REPORT RELATING TO EU-SILC OPERATIONS 2007 2010 Riga 2012 CONTENTS CONTENTS... 2 Background... 4 1. Common longitudinal European Union Indicators based
Q. Which company delivers your electricity?
 Eagleton Institute of Politics Rutgers, The State University of New Jersey 191 Ryders Lane New Brunswick, New Jersey 08901-8557 https://doi.org/10.26419/res.00186.001 eagletonpoll.rutgers.edu poll@eagleton.rutgers.edu
THE AP-GfK POLL December, 2013
 Public Affairs & Corporate Communications THE AP-GfK POLL December, 2013 Conducted by GfK Public Affairs & Corporate Communications A survey of the American general population (ages 18+) Interview dates:
THE AP-GfK POLL October, 2013
 Public Affairs & Corporate Communications THE AP-GfK POLL October, 2013 Conducted by GfK Public Affairs & Corporate Communications A survey of the American general population (ages 18+) Interview dates:
CCES 2014 Methods and Survey Procedures
 CCES 2014 Methods and Survey Procedures Sundance Conference June 12, 2015 2 Simultaneous CCES Studies CCES "Regular" CCES "Panel" CCES Regular 48 Teams N = 56,200 matched 48,853 interviews in post 86.9%
Response Mode and Bias Analysis in the IRS Individual Taxpayer Burden Survey
 Response Mode and Bias Analysis in the IRS Individual Taxpayer Burden Survey J. Michael Brick 1 George Contos 2, Karen Masken 2, Roy Nord 2 1 Westat and the Joint Program in Survey Methodology, 1600 Research
Survey Sampling, Fall, 2006, Columbia University Homework assignments (2 Sept 2006)
") Survey Sampling, Fall, 2006, Columbia University Homework assignments (2 Sept 2006) Assignment 1, due lecture 3 at the beginning of class 1. Lohr 1.1 2. Lohr 1.2 3. Lohr 1.3 4. Download data from the CBS
Survey Sampling, Fall, 2006, Columbia University Homework assignments (2 Sept 2006) Assignment 1, due lecture 3 at the beginning of class 1. Lohr 1.1 2. Lohr 1.2 3. Lohr 1.3 4. Download data from the CBS
Original data included. The datasets harmonised are:
 Original data included The datasets harmonised are: 1965-1966 - Multinational Comparative Time-Budget Research Project, including a Jackson Michigan and a national USA sample, conducted by the Survey Research
THE AP-GfK POLL December, 2013
 Public Affairs & Corporate Communications THE AP-GfK POLL December, 2013 Conducted by GfK Public Affairs & Corporate Communications A survey of the American general population (ages 18+) Interview dates:
Central Statistical Bureau of Latvia INTERMEDIATE QUALITY REPORT EU-SILC 2011 OPERATION IN LATVIA
 Central Statistical Bureau of Latvia INTERMEDIATE QUALITY REPORT EU-SILC 2011 OPERATION IN LATVIA Riga 2012 CONTENTS Background... 5 1. Common cross-sectional European Union indicators... 5 2. Accuracy...
What America Is Thinking Access Virginia Fall 2013
 What America Is Thinking Access Virginia Fall 2013 Created for: American Petroleum Institute Presented by: Harris Interactive Interviewing: September 24 29, 2013 Respondents: 616 Virginia Registered Voters
Household Income Trends: February 2012
 Household Income Trends: February 2012 Issued March 2012 Gordon Green and John Coder Sentier Research, LLC Household Income Trends: February 2012 Copyright 2012 by Sentier Research, LLC Summary of Findings
Appendix Table 1: Rate of Uninsurance by Select Demographics (2015 to 2017)
") Appendix Table 1: Rate of Uninsurance by Select Demographics (2015 to 2017) Appendix Table 1: Rate of Uninsurance by Uninsurance Rate Select Demographics (2015 to 2017) 2015 2017 Statewide 4.3% 6.3% *
Appendix Table 1: Rate of Uninsurance by Select Demographics (2015 to 2017) Appendix Table 1: Rate of Uninsurance by Uninsurance Rate Select Demographics (2015 to 2017) 2015 2017 Statewide 4.3% 6.3% *
Household Income Trends: August 2012 Issued September 2012
 Household Income Trends: August 2012 Issued September 2012 Gordon Green and John Coder Sentier Research, LLC For Immediate Release on Tuesday, September 25, 2012 Household Income Trends: August 2012 Copyright
ASSOCIATED PRESS: TAXES STUDY CONDUCTED BY IPSOS PUBLIC AFFAIRS RELEASE DATE: APRIL 7, 2005 PROJECT # REGISTERED VOTERS/ PARTY AFFILIATION
 1101 Connecticut Avenue NW, Suite 200 Washington, DC 20036 (202) 463-7300 Interview dates: Interviews: 1,001 adults Margin of error: +3.1 ASSOCIATED PRESS: TAXES STUDY CONDUCTED BY IPSOS PUBLIC AFFAIRS
Wage Gap Estimation with Proxies and Nonresponse
 Wage Gap Estimation with Proxies and Nonresponse Barry Hirsch Department of Economics Andrew Young School of Policy Studies Georgia State University, Atlanta Chris Bollinger Department of Economics University
ASSOCIATED PRESS: SOCIAL SECURITY STUDY CONDUCTED BY IPSOS PUBLIC AFFAIRS RELEASE DATE: MAY 5, 2005 PROJECT #
 1101 Connecticut Avenue NW, Suite 200 Washington, DC 20036 (202) 463-7300 Interview dates: Interviews: 1,000 adults, 849 registered voters Margin of error: +3.1 for all adults, +3.4 for registered voters
THE AP-GfK POLL December, 2013
 Public Affairs & Corporate Communications THE AP-GfK POLL December, 2013 Conducted by GfK Public Affairs & Corporate Communications A survey of the American general population (ages 18+) Interview dates:
COMMUNITY ADVANTAGE PANEL SURVEY: DATA COLLECTION UPDATE AND ANALYSIS OF PANEL ATTRITION
 COMMUNITY ADVANTAGE PANEL SURVEY: DATA COLLECTION UPDATE AND ANALYSIS OF PANEL ATTRITION Technical Report: February 2012 By Sarah Riley HongYu Ru Mark Lindblad Roberto Quercia Center for Community Capital
Profile of Ohio s Medicaid-Enrolled Adults and Those who are Potentially Eligible
 Thalia Farietta, MS 1 Rachel Tumin, PhD 1 May 24, 2016 1 Ohio Colleges of Medicine Government Resource Center EXECUTIVE SUMMARY The primary objective of this chartbook is to describe the population of
HuffPost: Voter fraud May 17-20, US Adults
 1. Easy to vote Do you think it should or should not be the government s goal to make it easy for people to vote? It should be a goal 61% 60% 61% 58% 65% 56% 66% 61% 63% 50% 65% It should not be a goal
Employer-Sponsored Health Insurance Coverage Wisconsin Family Health Survey
 Employer-Sponsored Health Insurance Coverage Wisconsin Family Health Survey 2002 and 2003 February 2, 2005 Prepared by APS Healthcare, Inc. 210 E. Doty Street, Suite 210 Madison, WI 53703 Table of Contents
National Statistics Opinions and Lifestyle Survey Technical Report January 2013
 UK Data Archive Study Number 7388 Opinions and Lifestyle Survey, Well-Being Module, January, February, March and April, 2013 National Statistics Opinions and Lifestyle Survey Technical Report January 2013
The Affordable Care Act Has Led To Significant Gains In Health Insurance Coverage And Access To Care For Young Adults
 The Affordable Care Act Has Led To Significant Gains In Health Insurance Coverage And Access To Care For Young Adults Benjamin D. Sommers, M.D., Ph.D., Thomas Buchmueller, Ph.D., Sandra L. Decker, Ph.D.,
The Associated Press-GfK Poll: Health Care Reform. Conducted by GfK September 25, 2012
 2100 Geng Road, Suite 210 Palo Alto, CA 94303 www.gfk.com Interview dates: August 31 September 7, 2010 Interviews: 1251 adults Sampling margin of error for a 50% statistic with 95% confidence is: ±3.9
UNEMPLOYMENT RATES IMPROVING IN THE DISTRICT By Caitlin Biegler
 An Affiliate of the Center on Budget and Policy Priorities 820 First Street NE, Suite 460 Washington, DC 20002 (202) 408-1080 Fax (202) 408-8173 www.dcfpi.org UNEMPLOYMENT RATES IMPROVING IN THE DISTRICT
For Immediate Release
 Household Income Trends December 2014 Issued January 2015 Gordon Green and John Coder Sentier Research, LLC For Immediate Release Household Income Trends December 2014 Note This report on median household
COMMUNITY ADVANTAGE PANEL SURVEY: DATA COLLECTION UPDATE AND ANALYSIS OF PANEL ATTRITION
 COMMUNITY ADVANTAGE PANEL SURVEY: DATA COLLECTION UPDATE AND ANALYSIS OF PANEL ATTRITION Technical Report: March 2011 By Sarah Riley HongYu Ru Mark Lindblad Roberto Quercia Center for Community Capital
Anomalies under Jackknife Variance Estimation Incorporating Rao-Shao Adjustment in the Medical Expenditure Panel Survey - Insurance Component 1
 Anomalies under Jackknife Variance Estimation Incorporating Rao-Shao Adjustment in the Medical Expenditure Panel Survey - Insurance Component 1 Robert M. Baskin 1, Matthew S. Thompson 2 1 Agency for Healthcare
An Evaluation of Nonresponse Adjustment Cells for the Household Component of the Medical Expenditure Panel Survey (MEPS) 1
 1") An Evaluation of Nonresponse Adjustment Cells for the Household Component of the Medical Expenditure Panel Survey (MEPS) 1 David Kashihara, Trena M. Ezzati-Rice, Lap-Ming Wun, Robert Baskin Agency for
An Evaluation of Nonresponse Adjustment Cells for the Household Component of the Medical Expenditure Panel Survey (MEPS) 1 David Kashihara, Trena M. Ezzati-Rice, Lap-Ming Wun, Robert Baskin Agency for
Nepal Living Standards Survey III 2010 Sampling design and implementation
 Nepal Living Standards Survey III 2010 Sampling design and implementation Background The Central Bureau of Statistics (CBS), Government of Nepal, undertook the third Nepal Living Standards Survey (NLSS
Poverty in the United Way Service Area
 Poverty in the United Way Service Area Year 4 Update - 2014 The Institute for Urban Policy Research At The University of Texas at Dallas Poverty in the United Way Service Area Year 4 Update - 2014 Introduction
NEBRASKA RURAL POLL. A Research Report. Earning a Living in Nonmetropolitan Nebraska Nebraska Rural Poll Results
 NEBRASKA RURAL POLL A Research Report Earning a Living in Nonmetropolitan Nebraska 2014 Nebraska Rural Poll Results Rebecca Vogt Cheryl Burkhart-Kriesel Randolph Cantrell Bradley Lubben Nebraska Rural
Florida State University. From the SelectedWorks of Patrick L. Mason. Patrick Leon Mason, Florida State University. Winter February, 2009
 Florida State University From the SelectedWorks of Patrick L. Mason Winter February, 2009 DISTRIBUTIONAL ANALYSIS OF LABOR AND PROPERTY INCOME AMONG NEW SENIORS AND EARLY RETIREES: BY RACE, GENDER, REGION,
Appendices. Strained Schools Face Bleak Future: Districts Foresee Budget Cuts, Teacher Layoffs, and a Slowing of Education Reform Efforts
 Appendices Strained Schools Face Bleak Future: Districts Foresee Budget Cuts, Teacher Layoffs, and a Slowing of Education Reform Efforts Appendix 1: Confidence Intervals and Statistical Significance Many