Measuring competitiveness with the Urban Audit data. Teodora Brandmuller EUROSTAT
|
|
|
- Raymond McDonald
- 6 years ago
- Views:
Transcription

1 Measuring competitiveness with the Urban Audit data Teodora Brandmuller EUROSTAT SCORUS Conference
2 Outline of my talk 1. Urban Audit State of the art 2. Building the Index of Competitiveness 3. Comparing cities 4. Relationship between indicators 5. Limitations and conclusions SCORUS Conference
3 Dimensions of the Urban Audit dataset 333 variables collected More than 260 indicators (derived series) calculated Reference years: 1991, 1996 and 2001 Four spatial units: core city, larger urban zone, kernel, sub-city information SCORUS Conference
4 Average response rates by theme 100% 80% 60% 40% 20% 0% Demography Social aspects Economic asp. Civic involvem. Training,educ. Environment Travel,transp. Information soc. Culture, recreat. SCORUS Conference

5 Geographical coverage of Urban Audit 189 EU15 69 EU12 26 Turkey Geographical coverage of the analysis 137 cities over SCORUS Conference
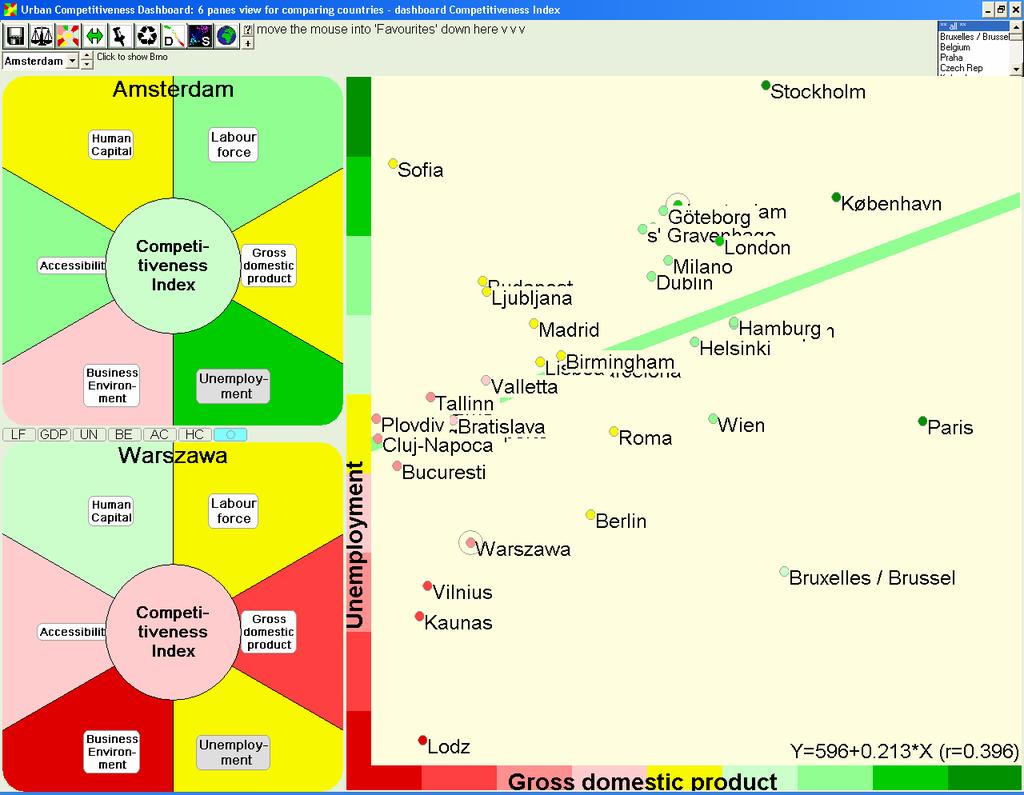
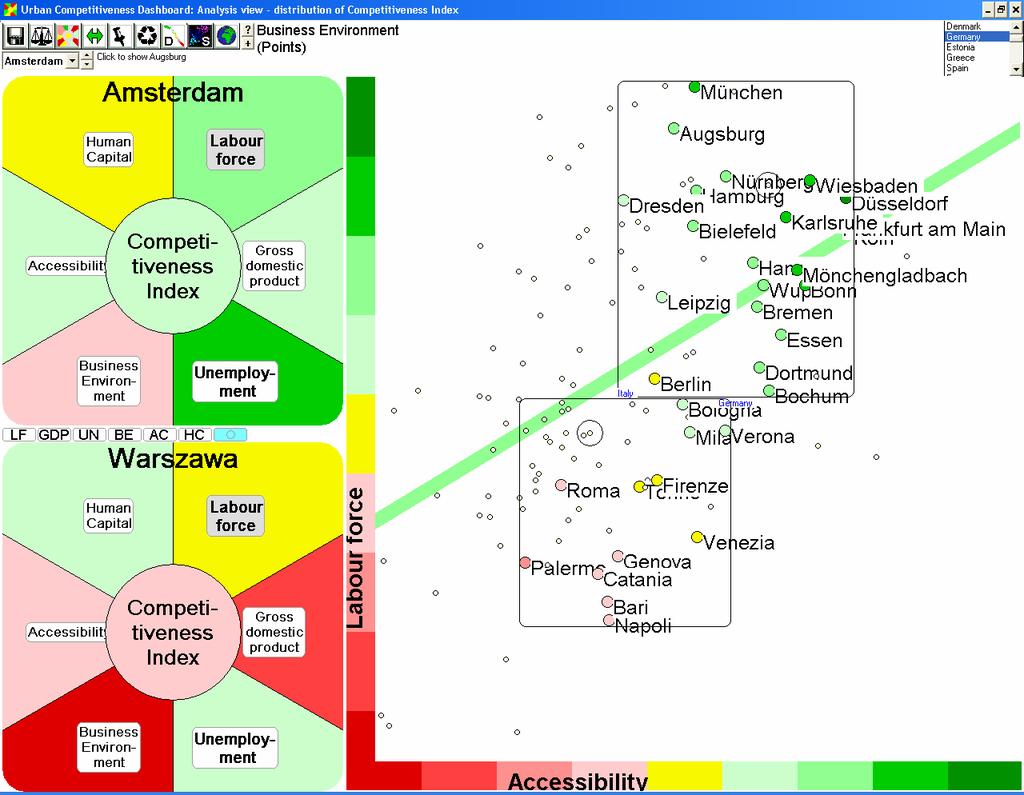
6 Building the Index of Competitiveness Competitiveness Index Labour force Gross domestic product Unemployment Business Environment Accessibility Human Capital SCORUS Conference
7 CI LF GDP UN BE AC Labour Force indicators Total annual population change over 5 years Activity rate Activity rate - male Activity rate - female Activity rate Activity rate HC SCORUS Conference
8 CI LF GDP Gross Domestic Product GDP per head GDP per employed person UN BE AC HC SCORUS Conference
9 CI LF GDP UN BE AC HC Unemployment Unemployment rate Unemployment rate - male Unemployment rate - female Proportion of unemployed Proportion of unemployed Proportion of long term unemployed (>6 months) Proportion of long term unemployed (>1 year) aged Proportion of unemployed who are under 25 SCORUS Conference
10 CI LF GDP UN BE Business Environment Companies with HQs in city quoted on stock market Proportion of companies gone bankrupt New businesses registered as a proportion of existing companies AC HC SCORUS Conference
11 Accessibility CI LF GDP UN BE AC Prop. of those employed in the city who are in-commuters Average time of journey to work Length of public transport network per 1000 pop Accessibility by air (EU27=100) Accessibility by rail (EU27=100) Accessibility by road (EU27=100) Multimodal accessibility (EU27=100) HC SCORUS Conference
12 CI LF GDP UN BE AC HC Human Capital Number of students in universities and further education establishments per 1000 resident population Proportion of resident population qualified at level 1 ISCED Proportion of the resident population qualified at levels 5-6 ISCED SCORUS Conference
13 Technical note The "Dashboard" is a free, non-commercial software which allows to present complex relationships between economic, social and environmental issues in a highly communicative format aimed at decision-makers and citizens. It is also particularly recommended to students, university lecturers, researchers and indicator experts. Source: SCORUS Conference
14

15

16

17

18

19

20

21

22

23

24
25

26

27
28

29
30

31

32
33
34
35 Limitations The indicator selection is arbitrary Weighting - equal weight to each indicator is in obvious contrast to reality Missing data Valuation point values are linearly interpolated between the worst ant the best. In some cases it leads to uneven distribution SCORUS Conference
36 Conclusions The Dashboard is a very useful tool - to create and test composite indexes - to show heterogeneous indicators in a common format - to compare cities along multiple criteria Relationship between accessibility, labour force and GDP is apparent in UA cities The Indicators selected to characterize business environment proved to be inadequate If the number of indicators is three or less the results are highly distorted by missing data (example: Human capital) SCORUS Conference
OTTAWA THIS QUARTER Q A quarterly view of Ottawa s employment landscape from your Local Employment Planning Council
 OTTAWA THIS QUARTER Who lives in Ottawa and where they live Where people work Industry view Ottawa s labour pool and employment What people do Occupation view A quarterly view of Ottawa s employment landscape
1. ECONOMIC ACTIVITY
 1. ECONOMIC ACTIVITY This section presents the data characterizing the economic activity of 15-75 years old population during the observation period. 1.1. BASIC CONCEPTS (DEFINITIONS) Economically active
BETTER LIFE INDEX 2013: DEFINITIONS AND METADATA
 September 2013 BETTER LIFE INDEX 2013: DEFINITIONS AND METADATA This document defines the indicators included in the OECD Your Better Life Index (BLI). Definitions for each indicator are listed by dimension
CityBench ESPON CityBench for benchmarking European Urban Zones. Annex I: Indicators and Cities
 CityBench ESPON CityBench for benchmarking European Urban Zones Annex I: Indicators and Cities Scientific Platform / Tools 2013/3/10 Inception Report Version 15/March/2013 ESPON 2013 1 This report presents
EF.IO/3/05 22 May 2005
 Organization for Security and Co-operation in Europe Secretariat EF.IO/3/5 May 5 ENGLISH only Conference Services Please find attached the presentation by Ms. Vanessa Mitchell-Thomson, Principal Economist,
Israel. Israel: regional, urban and rural development policies
 Key facts and issues Israel Israel is a unitary country with a population of 8.4 million. Its subnational governments are responsible for 13.4 of public expenditures, ranking Israel the 8 th least decentralised
OTTAWA THIS QUARTER Q A quarterly view of Ottawa s employment landscape from your Local Employment Planning Council
 OTTAWA THIS QUARTER Who lives in Ottawa and where they live Where people work Industry view Ottawa s labour pool and employment What people do Occupation view A quarterly view of Ottawa s employment landscape
Simulation Model of the Irish Local Economy: Short and Medium Term Projections of Household Income
 Simulation Model of the Irish Local Economy: Short and Medium Term Projections of Household Income Cathal O Donoghue, John Lennon, Jason Loughrey and David Meredith Teagasc Rural Economy and Development
USING MARKOV CHAIN ANALYSIS TO ASSESS THE CONVERGENCE TRENDS IN THE EMPLOYED POPULATION IN ROMANIAN URBAN AREAS
 USING MARKOV CHAIN ANALYSIS TO ASSESS THE CONVERGENCE TRENDS IN THE EMPLOYED POPULATION IN ROMANIAN URBAN AREAS Daniela HÎNCU Academy of Economic Studies, Piata Romana 6, Bucharest, Romania Daniela.hincu@man.ase.ro
Spatial and Inequality Impact of the Economic Downturn. Cathal O Donoghue Teagasc Rural Economy and Development Programme
 Spatial and Inequality Impact of the Economic Downturn Cathal O Donoghue Teagasc Rural Economy and Development Programme 1 Objectives of Presentation Impact of the crisis has been multidimensional Labour
OTTAWA THIS QUARTER Q A quarterly view of Ottawa s employment landscape from your Local Employment Planning Council
 OTTAWA THIS QUARTER Who lives in Ottawa and where they live Where people work Industry view Ottawa s labour pool and employment What people do Occupation view A quarterly view of Ottawa s employment landscape
Country profile Remuneration Spain
 Support for continued data collection and analysis concerning mobility patterns and career paths of researchers Country profile Remuneration Spain 1 RESEARCHER REMUNERATION IN ACADEMIA 2 1.0 Introduction
MONTENEGRO. SWTS country brief. December Main findings of the ILO SWTS
 MONTENEGRO SWTS country brief December 2016 The ILO Work4Youth project worked with the Statistical Office of Montenegro to implement the School-to-work transition survey (SWTS) in 2015 (September October).
REPUBLIC OF ZAMBIA CENTRAL STATISTICAL OFFICE PRELIMINARY RESULTS OF THE 2012 LABOUR FORCE SURVEY
 REPUBLIC OF ZAMBIA CENTRAL STATISTICAL OFFICE PRELIMINARY RESULTS OF THE 2012 LABOUR FORCE SURVEY This report presents preliminary results of the 2012 Labour Force Survey. The results presented herein
There were 2,275 employing organisations in Guernsey in March 2015, which is two fewer than in March 2014.
 Guernsey Quarterly Labour Market Bulletin Quarter 1 - Issue date 17th June 1.1 Introduction The Labour Market Bulletin provides a quarterly snapshot of the Guernsey labour market using claimant and contribution
Country profile Remuneration Hungary
 Support for continued data collection and analysis concerning mobility patterns and career paths of researchers Country profile Remuneration Hungary 1 RESEARCHER REMUNERATION IN ACADEMIA 2 1.0 Introduction
COUNCIL OF THE EUROPEAN UNION. Brussels, 5 November /01 LIMITE SOC 415 ECOFIN 310 EDUC 126 SAN 138
 COUNCIL OF THE EUROPEAN UNION Brussels, 5 November 2001 13509/01 LIMITE SOC 415 ECOFIN 310 EDUC 126 SAN 138 FORWARDING OF A TEXT from : Permanent Representatives Committee (Part 1) to : The Council (Employment
Nemat Khuduzade, Deputy Head Labour Statistics Department, SSC of Azerbaijan
 Decent Work Situation and Overview of the Labour Force Survey in Azerbaijan and New Opportunities with the implementation of the 19 th ICLS Resolution concerning statistics of work, employment and labour
The Current and Future Contribution of the Aboriginal Community to the Economy of Saskatchewan
 1 The Current and Future Contribution of the Aboriginal Community to the Economy of Saskatchewan Andrew Sharpe, Executive Director Centre for the Study of Living Standards Saskatchewan Association of Health
Countries of the CIS
 Countries Socio-economic Statistics Key Publications A summary of key publications from (StatCommittee) comprising socio-economic statistics on the twelve countries of the Commonwealth of Independent States:
Final Country Report UÀ 2009/2010 [Sweden]
![Final Country Report UÀ 2009/2010 [Sweden]](/thumbs/88/115259090.jpg "Final Country Report UÀ 2009/2010 [Sweden]") Ref. Ares(2011)928191-01/09/2011 Final Country Report UÀ 2009/2010 [Sweden] Description of the work In the process of collecting data to Urban Audit 2009-2010, Statistics Sweden had the main responsibility.
Ref. Ares(2011)928191-01/09/2011 Final Country Report UÀ 2009/2010 [Sweden] Description of the work In the process of collecting data to Urban Audit 2009-2010, Statistics Sweden had the main responsibility.
City Prosperity Initiative Conceptualization and Application
 City Prosperity Initiative Conceptualization and Application Antony Abilla ; UN-Habitat Bangkok, Thailand The Origin of the Initiative In 2012, UN-Habitat created the City Prosperity Index - a tool to
Make it Fair in Sudbury! Regional Perspective Who would improvements to employment laws directly affect?
 Make it Fair in Sudbury! Regional Perspective Who would improvements to employment laws directly affect? Population In the Greater Sudbury Census Metropolitan Area (CMA), the number of persons of working
SECTION 2.1. REAL SECTOR National Accounts
 PART 2. PROGRAMS OF MEASURES GUARANTEENG THE DEVELOPMENT OF FUNCTIONAL SPHERES The sphere of statistics is characterized by the need of permanent improvement of the methodology that is conditioned on one
Better Life Index 2017 Definitions and metadata
 November 2017 Better Life Index 2017 Definitions and metadata November 2017 This document defines the indicators included in the OECD Your Better Life Index (BLI). Definitions for each indicator are listed
Level (10 6 euros) rate of change. rate of change
 rate of change. rate of change") Table 1a. Macroeconomic prospects 2011 2011 2012 2013 2014 2015 Level (10 6 euros) 1. Real GDP 1 B1*g 169890,3-1,6-3,0 0,6 2,0 2,4 2,8 2. Nominal GDP B1*g 171015,9-1,0-2,1 2,1 3,3 4,0 4,3 Components of
Table 1a. Macroeconomic prospects 2011 2011 2012 2013 2014 2015 Level (10 6 euros) 1. Real GDP 1 B1*g 169890,3-1,6-3,0 0,6 2,0 2,4 2,8 2. Nominal GDP B1*g 171015,9-1,0-2,1 2,1 3,3 4,0 4,3 Components of
Preliminary data for the Well-being Index showed an annual growth of 3.8% for 2017
 7 November 2018 Well-being Index - Preliminary data for the Well-being Index showed an annual growth of 3.8% for The Portuguese Well-being Index has positively progressed between and and declined in. It
American Community Survey 5-Year Estimates
 S2401 OCCUPATION BY SEX AND MEDIAN EARNINGS IN THE PAST 12 MONTHS (IN 2012 INFLATION- ADJUSTED DOLLARS) FOR THE CIVILIAN EMPLOYED POPULATION 16 YEARS AND OVER 2008-2012 American Community Survey 5-Year
WP1: Synthesis report. Task 3 Country Report Luxembourg
 WP1: Synthesis report Ex post evaluation of Cohesion Policy programmes 2007-2013, focusing on the European Regional Development Fund (ERDF) and the Cohesion Fund (CF) Task 3 Country Report Luxembourg September
newstats 2016 NWT Annual Labour Force Activity NWT Bureau of Statistics Overview
 newstats NWT Bureau of Statistics Released: March 27, 2017 2016 NWT Annual Labour Force Activity Overview The Labour Force Survey is a source of monthly estimates of employment and unemployment. On a yearly
LABOUR FORCE SURVEY 2017 MAIN RESULTS
 LABOUR FORCE SURVEY 2017 MAIN RESULTS In 2017 the number of economically active population aged 15-64 was 3 277.5 thousand and represented 71.3% of population in the same age group. The activity rate (15-64
LABOUR MARKET. People in the labour market employment People in the labour market unemployment Labour market policy and public expenditure
 . LABOUR MARKET People in the labour market employment People in the labour market unemployment Labour market policy and public expenditure Labour market People in the labour market employment People
EUROPEAN COMMISSION EUROSTAT
 EUROPEAN COMMISSION EUROSTAT Directorate F: Social statistics Unit F-4 Quality of life STATISTICS ON INCOME AND LIVING CONDITIONS (EU-SILC): AD HOC REQUEST AND DETAILED GUIDELINES I. AD-HOC REQUEST FORM
The MPI as a governance tool to support the achievement of the SDGs
 The MPI as a governance tool to support the achievement of the SDGs Revisiting socio-economic policies to address poverty in all its dimensions in Middle Income Countries, Beirut, May 2018 Diego Zavaleta
OECD workshop Paris, 5 April Godwin Mifsud Chair of the EPC-Ageing Working Group 1
 Ageing in Europe Presenting the EC/EPC-AWG expenditure projections on health care & the joint healthcare policy analysis for ensuring long-term fiscal sustainability OECD workshop Paris, 5 April 2018 Godwin
Quarterly Labour Force Survey Q1:2018
 Quarterly Labour Force Survey Q1:2018 Faizel Mohammed Stats SA discouraged work seekers The labour market Q1:2018 37,7 million People of working age in South Africa (15 64 year olds) Labour force 22,4
ECO 209Y MACROECONOMIC THEORY LECTURE 1: INTRODUCTION AND POLICY. Gustavo Indart. Slide 1
 ECO 209Y MACROECONOMIC THEORY AND POLICY LECTURE 1: INTRODUCTION Slide 1 BRANCHES OF ECONOMICS Microeconomics is concerned with the study of the choice problem faced by the economic agents: households
American Community Survey 5-Year Estimates
 DP03 SELECTED ECONOMIC CHARACTERISTICS 2013-2017 American Community Survey 5-Year Estimates Supporting documentation on code lists, subject definitions, data accuracy, and statistical testing can be found
Transport Infrastructure and Regional Development
 Transport Infrastructure and Regional Development Budapest University of Technology and Economics, 2017 Reminder Deadline for submitting case study report in PDF via email April 10th, 2017 Students presentations
ECON 302 Fall 2009 Answers to Assignment #1 1
 Answers to Assignment #1 1 Homework will be graded for both content and neatness. Sloppy or illegible work will not receive full credit. This homework requires the use of Microsoft Excel. 1) Assume that
Tell us what you think. Provide feedback to help make American Community Survey data more useful for you.
 DP03 SELECTED ECONOMIC CHARACTERISTICS 2016 American Community Survey 1-Year Estimates Supporting documentation on code lists, subject definitions, data accuracy, and statistical testing can be found on
GB (numbers) All people 185,200 5,462,900 57,851,100 Males 93,500 2,680,900 28,275,200 Females 91,700 2,782,000 29,575,900.
 All people 185,200 5,462,900 57,851,100 Males 93,500 2,680,900 28,275,200 Females 91,700 2,782,000 29,575,900.") Labour Market Profile This profile gives an overview of the labour market within local authority (). The profile brings together data from several sources. Details about these and related terminology is
Labour Market Profile This profile gives an overview of the labour market within local authority (). The profile brings together data from several sources. Details about these and related terminology is
Situation of labour markets in Europe
 Situation of labour markets in Europe Paris, 28th May 13 Jean-François Lebrun European Commission - DG Employment, Social Affairs and Inclusion Labour market situation persistently deteriorating Employment
REPUBLIC OF MOLDOVA. SWTS country brief. December Main findings of the ILO SWTS
 REPUBLIC OF MOLDOVA SWTS country brief December 2016 The ILO Work4Youth project worked with the National Bureau of Statistics of Moldova to implement two rounds of the School-to-work transition survey
Regional Data from Sample Surveys using the lfs as an example
 Regional Data from Sample Surveys using the lfs as an example Susanne Schnorr-Bäcker Federal Statistical Office of Germany Klaus Trutzel National Urban Audit Coordinator SCORUS Conference Brussels 4-5
American Community Survey 5-Year Estimates
 DP03 SELECTED ECONOMIC CHARACTERISTICS 2012-2016 American Community Survey 5-Year Estimates Supporting documentation on code lists, subject definitions, data accuracy, and statistical testing can be found
American Community Survey 5-Year Estimates
 DP03 SELECTED ECONOMIC CHARACTERISTICS 2012-2016 American Community Survey 5-Year Estimates Supporting documentation on code lists, subject definitions, data accuracy, and statistical testing can be found
American Community Survey 5-Year Estimates
 DP03 SELECTED ECONOMIC CHARACTERISTICS 2012-2016 American Community Survey 5-Year Estimates Supporting documentation on code lists, subject definitions, data accuracy, and statistical testing can be found
American Community Survey 5-Year Estimates
 DP03 SELECTED ECONOMIC CHARACTERISTICS 2012-2016 American Community Survey 5-Year Estimates Supporting documentation on code lists, subject definitions, data accuracy, and statistical testing can be found
American Community Survey 5-Year Estimates
 DP03 SELECTED ECONOMIC CHARACTERISTICS 2012-2016 American Community Survey 5-Year Estimates Supporting documentation on code lists, subject definitions, data accuracy, and statistical testing can be found
American Community Survey 5-Year Estimates
 DP03 SELECTED ECONOMIC CHARACTERISTICS 2012-2016 American Community Survey 5-Year Estimates Supporting documentation on code lists, subject definitions, data accuracy, and statistical testing can be found
American Community Survey 5-Year Estimates
 DP03 SELECTED ECONOMIC CHARACTERISTICS 2012-2016 American Community Survey 5-Year Estimates Supporting documentation on code lists, subject definitions, data accuracy, and statistical testing can be found
American Community Survey 5-Year Estimates
 DP03 SELECTED ECONOMIC CHARACTERISTICS 2012-2016 American Community Survey 5-Year Estimates Supporting documentation on code lists, subject definitions, data accuracy, and statistical testing can be found
American Community Survey 5-Year Estimates
 DP03 SELECTED ECONOMIC CHARACTERISTICS 2012-2016 American Community Survey 5-Year Estimates Supporting documentation on code lists, subject definitions, data accuracy, and statistical testing can be found
American Community Survey 5-Year Estimates
 DP03 SELECTED ECONOMIC CHARACTERISTICS 2012-2016 American Community Survey 5-Year Estimates Supporting documentation on code lists, subject definitions, data accuracy, and statistical testing can be found
American Community Survey 5-Year Estimates
 DP03 SELECTED ECONOMIC CHARACTERISTICS 2012-2016 American Community Survey 5-Year Estimates Supporting documentation on code lists, subject definitions, data accuracy, and statistical testing can be found
American Community Survey 5-Year Estimates
 DP03 SELECTED ECONOMIC CHARACTERISTICS 2012-2016 American Community Survey 5-Year Estimates Supporting documentation on code lists, subject definitions, data accuracy, and statistical testing can be found
American Community Survey 5-Year Estimates
 DP03 SELECTED ECONOMIC CHARACTERISTICS 2012-2016 American Community Survey 5-Year Estimates Supporting documentation on code lists, subject definitions, data accuracy, and statistical testing can be found
American Community Survey 5-Year Estimates
 DP03 SELECTED ECONOMIC CHARACTERISTICS 2012-2016 American Community Survey 5-Year Estimates Supporting documentation on code lists, subject definitions, data accuracy, and statistical testing can be found
American Community Survey 5-Year Estimates
 DP03 SELECTED ECONOMIC CHARACTERISTICS 2012-2016 American Community Survey 5-Year Estimates Supporting documentation on code lists, subject definitions, data accuracy, and statistical testing can be found
American Community Survey 5-Year Estimates
 DP03 SELECTED ECONOMIC CHARACTERISTICS 2012-2016 American Community Survey 5-Year Estimates Supporting documentation on code lists, subject definitions, data accuracy, and statistical testing can be found
American Community Survey 5-Year Estimates
 DP03 SELECTED ECONOMIC CHARACTERISTICS 2012-2016 American Community Survey 5-Year Estimates Supporting documentation on code lists, subject definitions, data accuracy, and statistical testing can be found
American Community Survey 5-Year Estimates
 DP03 SELECTED ECONOMIC CHARACTERISTICS 2012-2016 American Community Survey 5-Year Estimates Supporting documentation on code lists, subject definitions, data accuracy, and statistical testing can be found
American Community Survey 5-Year Estimates
 DP03 SELECTED ECONOMIC CHARACTERISTICS 2012-2016 American Community Survey 5-Year Estimates Supporting documentation on code lists, subject definitions, data accuracy, and statistical testing can be found
American Community Survey 5-Year Estimates
 DP03 SELECTED ECONOMIC CHARACTERISTICS 2012-2016 American Community Survey 5-Year Estimates Supporting documentation on code lists, subject definitions, data accuracy, and statistical testing can be found
American Community Survey 5-Year Estimates
 DP03 SELECTED ECONOMIC CHARACTERISTICS 2012-2016 American Community Survey 5-Year Estimates Supporting documentation on code lists, subject definitions, data accuracy, and statistical testing can be found
American Community Survey 5-Year Estimates
 DP03 SELECTED ECONOMIC CHARACTERISTICS 2012-2016 American Community Survey 5-Year Estimates Supporting documentation on code lists, subject definitions, data accuracy, and statistical testing can be found
American Community Survey 5-Year Estimates
 DP03 SELECTED ECONOMIC CHARACTERISTICS 2012-2016 American Community Survey 5-Year Estimates Supporting documentation on code lists, subject definitions, data accuracy, and statistical testing can be found
American Community Survey 5-Year Estimates
 DP03 SELECTED ECONOMIC CHARACTERISTICS 2012-2016 American Community Survey 5-Year Estimates Supporting documentation on code lists, subject definitions, data accuracy, and statistical testing can be found
American Community Survey 5-Year Estimates
 DP03 SELECTED ECONOMIC CHARACTERISTICS 2012-2016 American Community Survey 5-Year Estimates Supporting documentation on code lists, subject definitions, data accuracy, and statistical testing can be found
American Community Survey 5-Year Estimates
 DP03 SELECTED ECONOMIC CHARACTERISTICS 2012-2016 American Community Survey 5-Year Estimates Supporting documentation on code lists, subject definitions, data accuracy, and statistical testing can be found
TECHNICAL NOTE. 1 Purpose of This Document. 2 Basic Assessment Specification
 TECHNICAL NOTE Project MetroWest Phase 1 Modelling & Appraisal Date 23 rd July 2014 Subject MetroWest Phase 1 Wider Impacts Assessment Ref 467470.AU.02.00 Prepared by CH2MHILL 1 Purpose of This Document
CONTENTS. I) IMPROVEMENTS ON THE BASIC INDICATORS OF THE YEARS 2002 & Text II) THE RESULTS OF THE YEAR Text
 IMPROVEMENTS ON THE BASIC INDICATORS OF THE YEARS 2002 & Text II) THE RESULTS OF THE YEAR Text") CONTENTS I) IMPROVEMENTS ON THE BASIC INDICATORS OF THE YEARS 2002 & 2003... Text II) THE RESULTS OF THE YEAR 2003...Text Graphics : Sheet Name Graphic 1. The labour force participation, employment and
CONTENTS I) IMPROVEMENTS ON THE BASIC INDICATORS OF THE YEARS 2002 & 2003... Text II) THE RESULTS OF THE YEAR 2003...Text Graphics : Sheet Name Graphic 1. The labour force participation, employment and
The Kangaroo Island (DC) Region. Workforce Wizard Region Report
 Region. Workforce Wizard Region Report") Workforce Wizard Region Report Table of Contents Executive Summary 3 Population and Social Characteristics 4 Current Population 4 Age Groups 4 Key Populations 5 Aboriginal Australians 6 Disability and
Workforce Wizard Region Report Table of Contents Executive Summary 3 Population and Social Characteristics 4 Current Population 4 Age Groups 4 Key Populations 5 Aboriginal Australians 6 Disability and
SCENARIO PLANNING CHAPTER 2015 REGIONAL MASTER PLAN. For the Rockingham Planning Commission Region
 SCENARIO PLANNING CHAPTER 2015 REGIONAL MASTER PLAN For the Rockingham Planning Commission Region Contents Introduction to... ii Vision and Objective... 1 Basis in Projections... 1 Population Projections...
Country profile Remuneration Ireland
 Support for continued data collection and analysis concerning mobility patterns and career paths of researchers Country profile Remuneration Ireland 1 RESEARCHER REMUNERATION IN ACADEMIA 2 10 Introduction
WHAT ARE THE FINANCIAL INCENTIVES TO INVEST IN EDUCATION?
 INDICATOR WHAT ARE THE FINANCIAL INCENTIVES TO INVEST IN EDUCATION? Not only does education pay off for individuals ly, but the public sector also from having a large proportion of tertiary-educated individuals
THE URBAN AUDIT Towards the Benchmarking of Quality of Life in 58 European Cities. VOLUME III: The Urban Audit Manual
 THE URBAN AUDIT Towards the Benchmarking of Quality of Life in 58 European Cities VOLUME III: The Urban Audit Manual The Urban Audit is supported by the European Commission. It is aimed at improving comparative
JOINT EMPLOYMENT REPORT STATISTICAL ANNEX
 ,--~- -._, COMMISSION OF THE EUROPEAN COMMUNITIES Brussels, 6.9.2000 COM(2000) 551 final Volume II JOINT EMPLOYMENT REPORT STATISTICAL ANNEX Definitions, tables and charts (presented by the Commission)
SEE Jobs Gateway Database - Metadata
 P a g e 1 SEE Jobs Gateway Database - Metadata Disclaimer All data presented in this report and online have been collected directly from national statistical offices of the six Western Balkan countries
Lisburn & Castlereagh Council Area Profile
 Council Area Profile June 2017 Sources: Various Invest NI Activity ( to 2016-17) No. of = 476 No. of Offers = 1,870 Locally-Owned Externally-Owned 23 147 9 2016-17 312 18 100 156 8 297 14 182 10 364 17
EXCLUSION. Reduce the number of long-term unemployed by 320,000 by 2020, measured against the annual average in 2008.
 GERMANY 1 NATIONAL 2020 TARGET FOR THE REDUCTION OF POVERTY AND SOCIAL EXCLUSION Reduce the number of long-term unemployed by 320,000 by 2020, measured against the annual average in 2008. Source: National
SERBIA. SWTS country brief. December Main findings of the ILO SWTS
 SERBIA SWTS country brief December 2016 The ILO Work4Youth project worked with the Statistical Office of the Republic of Serbia to implement the School-towork transition survey (SWTS) in 2015 (March April).The
Economic Overview York County, South Carolina. February 14, 2018
 Economic Overview York County, February 14, 2018 DEMOGRAPHIC PROFILE... 3 EMPLOYMENT TRENDS... 5 UNEMPLOYMENT RATE... 5 WAGE TRENDS... 6 COST OF LIVING INDEX... 6 INDUSTRY SNAPSHOT... 7 OCCUPATION SNAPSHOT...
PRESS RELEASE 2012 LABOUR FORCE SURVEY 10 APRIL 2012
 PRESS RELEASE 2012 LABOUR FORCE SURVEY 10 APRIL 2012 =========================================================== 1. The Namibia Statistics Agency is pleased to release the results of the 2012 Labour Force
LFS Eurostat Requirements Labour Force Survey / Annual Population Survey User Group Meeting 10 December 2012
 LFS Eurostat Requirements Labour Force Survey / Annual Population Survey User Group Meeting 10 December 2012 Colin Beavan-Seymour LFS Research Team ONS Social Survey Division Established in 1953; Directorate-General
ESF Programming Round CATEGORISATION OF EXPENDITURE. Informal Technical Working Group May 2007, Prague
 ESF Programming Round 2007-2013 2013 CATEGORISATION OF EXPENDITURE Informal Technical Working Group 10-11 11 May 2007, Prague EARMARKING Article 9 39 3 Gen. Reg. 1083/2006 The assistance co-financed by
Unemployment Briefing Number 1: Issued September 2013
 Unemployment Briefing Number 1: Issued September 2013 Introduction & Background Welcome to the initial refreshed edition of Wolverhampton s Unemployment Briefing, last published in 2009. This month s briefing
Correcting for non-response bias using socio-economic register data
 Correcting for non-response bias using socio-economic register data Liisa Larja & Riku Salonen liisa.larja@stat.fi / riku.salonen@stat.fi Introduction Increasing non-response is a problem for population
Day 1, Session 3, UN Workshop on Improving the Intergation of a Gender Perspective inti Official Chiba, Japan April 2013
 Day 1, Session 3, UN Workshop on Improving the Intergation of a Gender Perspective inti Official Statistics @ Chiba, Japan 16-19 April 2013 Saidah Hashim (Ms.) Manpower & Social Statistics Division Department
EXCLUSION. Reduce the number of long-term unemployed by 320,000 by 2020, measured against the annual average in 2008.
 GERMANY 1 NATIONAL 2020 TARGET FOR THE REDUCTION OF POVERTY AND SOCIAL EXCLUSION Reduce the number of long-term unemployed by 320,000 by 2020, measured against the annual average in 2008. Source: National
MAIN LABOUR FORCE SURVEY RESULTS FOR THE FIRST QUARTER OF 2017
 MAN LABOUR FORCE SURVEY RESULTS FOR THE FRST QUARTER OF 2017 Main labour market indicators for the first quarter of 2017 The activity rate for population aged 15-64 was 69.2%, by 0.9 percentage points
The Employment of Young Graduates in the Period : A Comparison between Six European Countries *
 Modern Economy, 2011, 2, 880-892 doi:10.4236/me.2011.25099 Published Online November 2011 (http://www.scirp.org/journal/me) The Employment of Young Graduates in the Period 2000-2010: A Comparison between
Country profile Remuneration Portugal
 Support for continued data collection and analysis concerning mobility patterns and career paths of researchers Country profile Remuneration Portugal 1 RESEARCHER REMUNERATION IN ACADEMIA 2 1.0 Introduction
Objective Urban Audit indicators and citizens' subjective perceptions: Match or clash?
 Objective Urban Audit indicators and citizens' subjective perceptions: Match or clash? Stefanie Neurauter, City of Wiesbaden Amt für Strategische Steuerung, Stadtforschung und Statistik SCORUS Conference
Home Values near doral, FL
 Home Values near doral, FL Median Home Value $232,400 $159,100 $127,600 $153,800 Home Appreciation 2.7% 3.3% 1.2% 1.6% Homes Statistics near doral, FL Median Age of Home 13.1 34.2 26.1 35.1 Homes Owned
National Social Target for Poverty Reduction. Social Inclusion Monitor 2013
 National Social Target for Poverty Reduction Social Inclusion Monitor 2013 published by Department of Social Protection Arás Mhic Dhiarmada Store Street Dublin 1 Ireland ISBN: 978-1-908109-27-9 Dublin,
EDORA (European Development Opportunities for Rural Areas)
") The ESPON 2013 Programme Applied Research Project 2013/1/2 EDORA (European Development Opportunities for Rural Areas) WP 23 EDORA Database Description Stefan Neumeier Version 3 29 March 2010 EUROPEAN UNION
The ESPON 2013 Programme Applied Research Project 2013/1/2 EDORA (European Development Opportunities for Rural Areas) WP 23 EDORA Database Description Stefan Neumeier Version 3 29 March 2010 EUROPEAN UNION
Tyler Area Economic Overview
 Tyler Area Economic Overview Demographic Profile. 2 Unemployment Rate. 4 Wage Trends. 4 Cost of Living Index...... 5 Industry Clusters. 5 Occupation Snapshot. 6 Education Levels 7 Gross Domestic Product